Introduction
Hepatocellular carcinoma (HCC) is one of the most
common types of cancer globally, and the third highest cause of
cancer-associated mortality globally, according to 2018 statistics
(1). The high mortality rate may be
partially attributed to the fact that ~80% of patients with novel
diagnosed HCC have already been diagnosed with advanced liver
disease and hepatic cirrhosis (2–4). Altekruse
et al (5) reported that
>60% of patients were diagnosed with late-stage HCC following
metastasis, resulting in a <16% overall 5-year survival rate
(6). However, if an appropriate
diagnosis and treatment can be used in the early stage of HCC, the
5-year survival rate of patients may increase by 75% (7). Therefore, an effective way to detect HCC
at early stage would improve the outcomes for patients
significantly. At present, the diagnosis of HCC remains largely
dependent on invasive biopsy, imaging methods, including magnetic
resonance imaging, 18-fluoro-deoxyglucose positron emission
tomography/computerized topography and serum α-fetoprotein testing
(1,8).
The limited sensitivity and specificity of these methods result in
poor quality and a low diagnosis rate. Therefore, the
identification of biomarkers with a higher sensitivity and
specificity is vital for HCC diagnosis, particulalry for earlier
stages of HCC (9). A previous study
reported that urine and serum contain a lot of metabolic
information that may be altered underlying HCC, which may be used
as new biomarkers for HCC diagnosis (10). Additionally, the level of glycocholic
acid (GCA) in patients with HCC is significantly increased,
compared with healthy individuals (11). GCA has been identified as a specific
and sensitive biomarker for HCC in urine and serum (12,13).
GCA, a secondary bile acid and one of the main
components of bile acids, is formed by the conjugation of cholic
acid and glycine, which assists in the digestion and the absorption
of fat in food, in addition to being located in the bile as a
sodium salt (14). Numerous studies
reported that GCA may serve as a superior clinical marker to detect
liver diseases, compared with the traditional markers, including
serum alpha fetoprotein, blood enzymology and metabolomics
(13,15,16).
Analysis of GCA in combination with other diagnostic indicators
provides a more sensitive background for the diagnosis, treatment
and prognosis of liver diseases (17). Additionally, the level of GCA is also
a vital diagnostic indicator for various biliary system diseases,
including intrahepatic cholestasis and alcoholic liver injury
(18). Currently, a number of methods
have been reported for the analysis of GCA, including liquid
chromatography-mass spectrometry (19), ultra-performance liquid
chromatography-quadrupole time-of-flight-high-definition mass
spectrometry (12), liquid
chromatography-tandem mass spectrometry (20) and macromolecular crowding
agents-assisted imprinted polymers (13). However, these methods come with a high
cost as they require a well-equipped laboratory and well-trained
professionals (19,20). Therefore, there is a great demand for
developing a more economical, reliable and rapid method to detect
GCA.
In the present study, a novel anti-GCA monoclonal
antibody (mAb) was generated, in which low 50% inhibitory rate
(IC50), high specificity and sensitivity for GCA binding
were reached. Furthermore, by this novel development of mAb, an
effective indirect competitive ELISA method (icELISA) has been
established to detect GCA. Therefore, a simple, rapid and efficient
method was successfully developed to detect GCA for the diagnosis
of early-stage HCC, in addition to providing novel insights for
further research and treatment of HCC.
Materials and methods
Immunogen preparation
Human GCA hydrate (C26H43NO6.xH2O)
synthesized by Sigma-Aldrich (Merck KGaA, Darmstadt, Germany) was
conjugated to the carrier protein, bovine serum albumin (BSA;
BioFroxxx, Germany), by the active ester method through amide bonds
(21,22), using 1-ethyl-3-(3-dimethylaminopropyl)
carbodiimide hydrochloride (EDC) and N-hydroxysuccinimide (NHS) as
the dehydrating agents. A total of 10 mg GCA was mixed with 100 µl
2-(morpholino) ethanesulfonic acid buffered saline (0.5 M NaCl, pH
6.0) and conjugated to BSA at the molecular ratio of 100:1 in 500
ml conjugation buffer (PBS; pH=7.2–7.4). Following incubation at
room temperature for 2 h, GCA-BSA conjugate (GCA-BSA) was purified
by a desalting column and identified by 10% SDS-PAGE, and then dyed
by 0.25% Coomassie Brilliant Blue R-250 (Beijing Solarbio Science
& Technology Co., Ltd., Beijing, China) for 2 h at 37°C
(23,24).
Mice preparation and immunization
Five female BALB/c mice (6–8 weeks old, ~20 g),
purchased from Medical Animal Center of Sichuan University
(Chengdu, China), were maintained in individually ventilated cages
under specific pathogen free conditions, including a temperature of
24°C, a humidity of 55±10%, adequate food and water and a 12/12 h
light/dark cycle. The mice immunized with immunogens at multiple
sites by standard vaccination procedures. Ethical approval for the
use of animals was obtained from the Research Ethics Committee of
West China School of Basic Medical Sciences and Forensic Medicine,
Sichuan University (Sichuan, China). All experimental procedures
complied with Sichuan University Committee Guidelines on the Use of
Live Animals in Research, in accordance with the National
Institutes of Health Guide for the Care and Use of Laboratory
Animals (25).
As previously described (26), mice were subcutaneously immunized with
100 µg GCA-BSA emulsified with Freund's complete adjuvant
(Sigma-Aldrich; Merck KGaA) with a volume ratio of 1:1. To
strengthen the immune response, subcutaneous injections with the
same dose and method were repeated three times within 2 months.
Prior to the last injection, blood was drawn from the mouse-tail
vein and the serum was isolated. The serum titers were analyzed by
indirect ELISA assay. Anti-GCA mAb in mouse-tail vein serum was
used as the primary antibody and a horseradish
peroxidase-conjugated goat anti-mouse IgG (cat. no. ab97051; Abcam,
Cambridge, UK) was used as the secondary antibody.
Hybridoma generation and
screening
The mouse myeloma SP2/0 cell line was used as a
fusion partner. Subsequently, 1 week prior to the fusion, SP2/0
(cat. no. NCBI 129; National Cell Bank of Iran, Pasteur Institute
of Iran, Tehran, Iran) was cultured in RPMI-1640 media
(Sigma-Aldrich; Merck KGaA) and 10% fetal bovine serum (FBS,
Sigma-Aldrich; Merck KGaA) until reaching to >70% confluency.
The feeder-layer cells were prepared from the peritoneal cavity of
unimmunized BALB/c mouse 1 day prior to fusion. Following the final
injection, one immunized mouse with the highest serum titer
(>1:409,000) was sacrificed, and splenocytes were collected for
fusion with mouse myeloma SP2/0 cells using 50% polyethylene glycol
(cat. no. PEG4000, Sigma-Aldrich; Merck KGaA) at a
splenocyte:myeloma cell ratio of 10:1, according to the standard
procedures of hybridoma technique under sterile condition (27). Fused cells were washed with RPMI-1640
medium and distributed in 96-well plates followed by selection with
hypoxanthine-aminopterin-thymidine medium (Sigma-Aldrich; Merck
KGaA) to screen and obtain the positive hybridoma cells.
Cell growth and colony formations were examined
daily. Colonies appeared between 5 and 10 days. Once the colony
diameter reached 1 mm, determined by Image pro plus 7.0 (Media
Cybernetics, Inc., Rockville, MD, USA), the immortalized cells were
screened and selected for their capability to generate an anti-GCA
mAb with an ELISA, as described previously (28). A total of two 96-well microtiter
plates were coated with GCA as the coating antigen with 1 µg/ml
(100 µl/well) at 4°C overnight and unoccupied binding sites on the
plates were blocked by 120 µl/well 1% BSA in PBS at 37°C for 1 h. A
total of 50 µl/well of hybridoma supernatant was added into the
plates as a primary antibody, whereas the RPMI-1640 medium was used
as the negative control. The plates were subsequently incubated at
37°C for 1 h. Following washing in triplicate by 0.05% Tween-20 PBS
(PBST), 100 µl/well of goat anti-mouse IgG conjugated with
horseradish peroxidase (HRP) was added into the 96-well plate as
the secondary antibody (cat. no. TA130001; OriGene Technologies,
Inc., Rockville, MD, USA), and the plates were incubated at 37°C
for 1 h. Following washing with PBST, 100 µl/well
tetramethyl-benzidine (TMB; Beijing Solarbio Science &
Technology Co., Ltd.) substrate was added into the plates at 37°C
for 15 min. The reaction was stopped by 50 µl/well of
H2SO4 (2 mol/l) and optical density
absorbance value (OD) was measured at wavelength of 450 nm with an
ELISA Reader (Bio-Rad Laboratories Inc., Hercules, CA, USA). The
positive clone was selected and subcloned into 96-well plates by
the limiting dilution method (29)
and the supernatant of the positive clone was detected with an
ELISA kit, as aforementioned.
Generation, purification and detection
of ascites
A total of five adult female BALB/c mice were
intraperitoneally injected with sterile paraffin oil (0.5 ml/mouse;
Sigma-Aldrich; Merck KGaA). After 7 days, each mouse was injected
peritoneally with 5×10⁶ screened hybridoma cells. Within
10–14 days following the peritoneal injection, ascites were
collected from the mice. The supernatant of the ascites containing
anti-GCA mAb was collected by centrifugation at 19,400 × g for 5
min at 4°C, purified by ammonium sulfate precipitation, followed by
further depuration with protein-G affinity chromatography (GE
Healthcare, Chicago, IL, USA) according to the manufacturer's
protocols (30), and then detected by
the ELISA method (26).
Affinity and isotype analysis of
anti-GCA mAb
Affinity of anti-GCA mAb was examined by
non-competitive ELISA. A 96-well plate was coated with three
different concentrations of the synthesized GCA hydrate (2.0, 1.0
and 0.5 mg/l), into which the 2-fold diluted anti-GCA mAbs were
added. The 96-well plate was incubated at 37°C for 1 h, followed by
three washes with PBST buffer to remove unbound substances. The
plate was incubated with secondary antibody (goat anti-mouse IgG
antibody 1:5,000; cat. no. ab97051; Abcam) at 37°C for 1 h and TMB
was added to the plate at 37°C for 15 min. The OD values at a
wavelength of 450 nm were detected. The curve diagram was made and
the affinity of the antibody was obtained as described previously
(31). The curves were produced with
OD values as the y-axis and the concentration logarithm of anti-GCA
mAb based on 10 (Igρ) as the x-axis. The upper platform stage of
curves was designed at OD100. Then the corresponding Ab
concentration logarithm values at 50% (OD50) of each curve was
detected, which were termed [Ab]t1, [Ab]t2 and [Ab]t3, respectively
The affinity constant of antigen-antibody interaction was designed
by the following equation: Kaff = (n-1)/2[n (Ab′)t-(Ab)t], where n
= (Ag)t/(Ag′)t, (Ag)t and (Ag′)t represent three different
concentrations of GCA-BSA antigen, and (Ab′)t and (Ab)t represent
the corresponding Ab concentration logarithm values at 50% of each
curve. The concentration ratio of the antigen was 1:2. K1 =
1/2[2(Ab)t1-(Ab)t2], K2 = 1/2[2(Ab)t2-(Ab)t3] and K3 =
3/2[4(Ab)t1-(Ab)t3] when the ratio was 1:4. The final K-value was
the average of the aforementioned three results.
The isotype of mAb was analyzed with an Antibody
Isotyping kit (SouthernBiotech, Birmingham, AL, USA), according to
manufacturer's protocols (32). The
96-well microtiter plates were coated by 1 µg/ml (100 µl/well)
GCA-BSA as the coating antigen at 4°C overnight. The plates were
subsequently blocked with 1% casein at 37°C for 1 h and washed with
PBST three times. The culture supernatants of the hybridoma cell
were incubated in 96-well plates (100 µl/well) at 37°C for 1 h with
gentle shaking. Following three washes with PBST buffer, AP-labeled
detection antibody (dilution, 1:500, Mouse Ig Isotyping kit;
SouthernBiotech, Birmingham, AL, USA) in BSA was added and
incubated at 37°C for 1 h. The OD of each well was measured at a
wavelength of 405 nm following substrate addition (33).
Specificity analysis by competitive
western blot analysis
BSA (500 µg/ml) and GCA-BSA (500 µg/ml) were
separated by 10% SDS-PAGE and electro-transferred to a
polyvinylidene fluoride membrane (PVDF) at room temperature for 1
h. They were subsequently blocked by 10 mM PBST containing 5% skim
milk (Beijing Solarbio Science & Technology Co., Ltd.) at room
temperature for 1 h. The PVDF membrane was cut into two identical
parts. A part of the membrane was incubated with the mixture of 5
ml 1:1,000 diluted anti-GCA mAb plus 5 ml PBST as the
non-competitive group. Another part of membrane was incubated with
the mixture of 5 ml 1:1,000 diluted anti-GCA mAb plus 5 ml GCA (10
µg/ml) as the competitive group, at room temperature for 1 h. The
membranes were washed by PBST three times and incubated with the
secondary antibody (goat anti-mouse IgG; cat. no. ab97051; Abcam)
at a 1:5,000 dilution in PBST at room temperature for 1 h.
Following extensive washing by PBST, the protein bands were
visualized by enhanced chemiluminescence kit (ECL; GE Healthcare)
substrate. The software used for densitometry was Image J software
1.48 (National Institutes of Health, Bethesda, MD, USA).
Screening of the optimal concentration
of GCA-BSA and anti-GCA mAb by indirect ELISA chessboard
method
GCA-BSA, including 0.8 µg/ml in Carbonate Buffer
(CB) solution, as the initial concentration and coated with 100
µl/well on plate, and anti-GCA mAb (1:312.5 in CB as the initial
concentration) were diluted in 2-fold series with PBST to the final
concentration of 12.5 ng/ml and 1:320,000, respectively. A
non-competitive ELISA assay (Goat Anti-Mouse IgG; cat. no. ab97051;
Abcam) was performed. The concentration with the best sensitivity
(0.2 µg/ml for GCA-BSA and 1:10,000 dilution for anti-GCA mAb) was
determined as the optimal concentration of GCA-BSA and anti-GCA
mAb, and subsequently used in the subsequent icELISA.
Sensitivity identification of the
anti-GCA mAb by icELISA
The 96-well microtiter plates were coated by GCA-BSA
with 0.2 µg/ml (100 µl/well), BSA at 4°C overnight. Unoccupied
binding sites on the plates were blocked by 1% BSA in PBS at 37°C
for 1 h. A total of 50 µl/well of GCA (1 µg/ml diluted in PBS as
the initial concentration, 2-fold serial dilutions) acting as
competitive reagent, was fully mixed with 50 µl/well anti-GCA mAb
(dilution, 1:10,000). The mixture was subsequently added onto the
plates, while PBS was used as the negative control. The rest of the
procedures were same as that of the non-competitive ELISA. Goat
anti-mouse IgG conjugated with HRP (1:5,000; 100 µl/well) was used
as the secondary antibody (cat. no. TA130001; OriGene Technologies,
Inc.). OD value was detected at a wavelength of 450 nm. The curves
were made with the concentration logarithm of GCA as x-axis, and
mean binding rate ratio (B/B0%) as the y-axis indicating
the following: B0 represented the OD value of the
control well without GCA; B represented the OD value of the well
with GCA. The B/B0 generated was plotted versus the
logarithmic concentration of GCA to get an inhibition curve
(34). A standard line and the linear
regression equation was obtained. The IC50 of the
anti-GCA mAb against GCA was calculated, and the sensitivity of the
mAb was measured by IC50 (35).
For quantitative detection of GCA and its
application in HCC cells, icELISA was performed using GCA-BSA as
the coated antigen, and using anti-GCA mAb as the detection
reagent. The standard line was made with the concentration
logarithm of GCA as the x-axis, and the OD450 value as the y-axis.
A standard line and the linear regression equation were obtained.
According to the standard curve equation, the anti-GCA mAb and
icELISA assay can be used to determine GCA concentration within the
competitive reagent. Note that in icELISA, the OD450 value was
inversely correlated with GCA concentration.
Application of icELISA in the
detection of GCA content in HCC cells
HCCs cell lines, Huh7 and PLC/PRF/5, human
hepatocyte cell line, HL-7702, and lung cancer cell line, A549
(China Cell Culture Center, Shanghai, China) were cultured in
RPMI-1640 supplemented with 10% FBS, 100 U/ml penicillin and 100
U/ml streptomycin (Gibco; Thermo Fisher Scientific, Inc., Waltham,
MA, USA). After 24 h, supernatants were discarded, cells were
washed once with PBS and cultured in RPMI-1640 serum
(Sigma-Aldrich; Merck KGaA) without FBS for 48 h. The supernatants
were collected for icELISA below. All cells (1×10⁵
cells/line) were lysed in ice-cold buffer radioimmunoprecipitation
assay buffer (RIPA; 50 mM Tris-HCl pH7.4, 150 mM NaCl, 1%
TritonX-100, 0.1% SDS) and 1 mM phenylmethylsulphonyl fluoride
(PMSF) was added at a ratio of PMSF:RIPA 1:100. The two-fold serial
dilutions of cell lysates or supernatants were used as competitive
reagent in icELISA to detect GCA concentration. Protein in cell
lysates and cell supernatants were quantified using a bicinchoninic
acid (BCA) assay (Pierce; Thermo Fisher Scientific, Inc.) (32). The same amount of protein (20 µg) was
two-fold diluted and added as the competitive reagent to detect the
GCA concentration in different cell lines lysates or
supernatants.
Statistical analysis
Statistical analyses were performed using the SPSS
22.0 software (IBM Corp., Armonk, NY, USA). Values were expressed
as mean ± standard error of the mean. To calculate statistical
significant differences among groups, linear regression and the
one-way analysis of variance were used. P<0.05 was considered to
indicate a statistically significant difference. A Bonferroni post
hoc test was used for further statistical analysis between
groups.
Results
Successful conjugation of GCA-BSA
immunogen
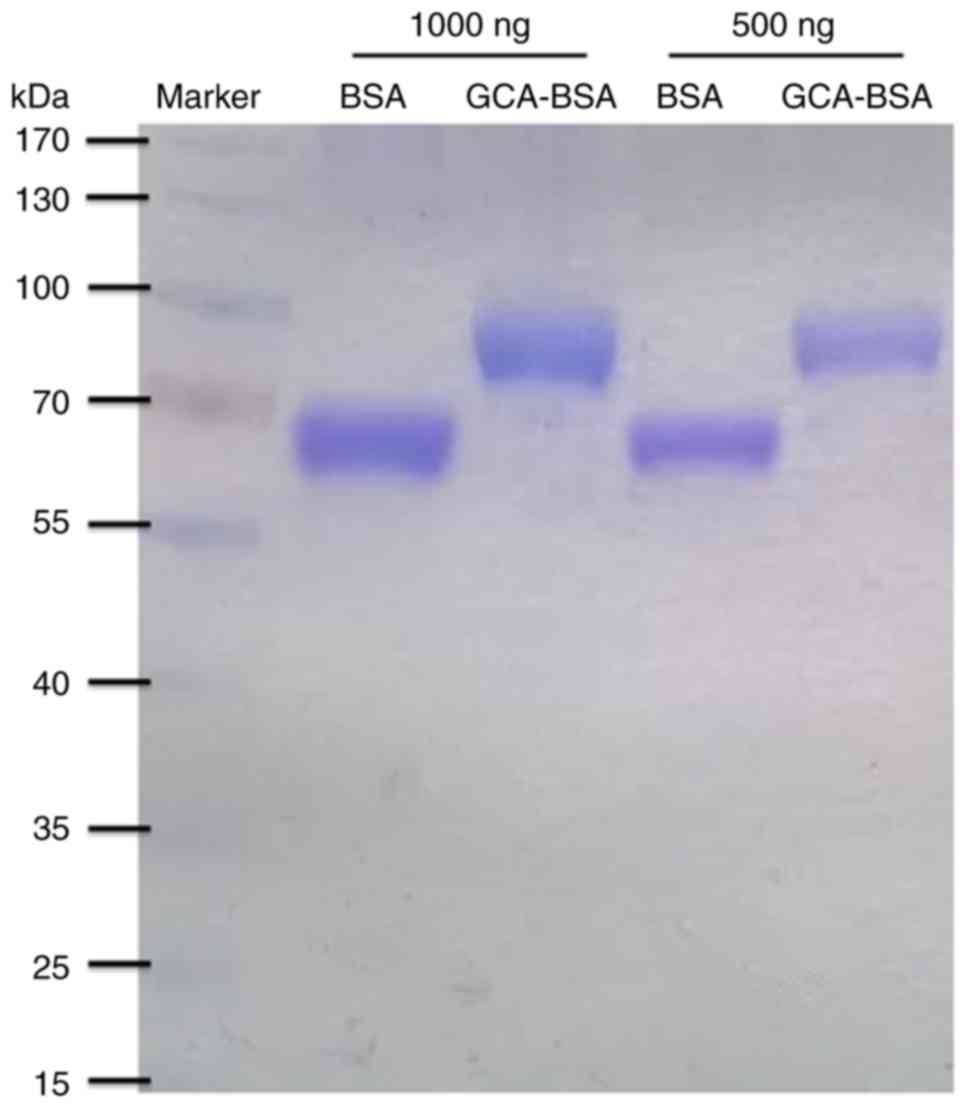
GCA is a hapten, which, on its own, cannot induce an
immune response to produce antibodies in mice. It is necessary to
combine GCA with a carrier protein to elicit a specific antibody
response (21). Therefore, GCA
hydrate (465.62 g/mol) was conjugated to the carrier protein BSA
(66.43 kDa), with a molecular ratio of 100:1, by the active ester
method through amide bonds, using EDC and NHS as the dehydrating
agents. GCA-BSA conjugate was purified with a desalting column and
identified by SDS-PAGE dyed by 0.25% Coomassie Brilliant Blue
R-250. SDS-PAGE analysis indicated that GCA-BSA conjugate, ~100
kDa, was successfully generated compared with the control groups,
66.43 kDa (Fig. 1).
The novel anti-GCA mAb indicates high
purity and affinity against human GCA
GCA-BSA conjugate was used, in order to immunize the
mice. Polyclonal antibodies were generated and obtained. The serum
titers were analyzed by indirect non-competitive ELISA. The results
indicated that the titer was very high (>1:409,000), and the
GCA-BSA conjugate had successfully induced an immune response.
Therefore, the aforementioned results indicated that the GCA-BSA
conjugate could be used to prepare hybridomas.
The splenocyte-myeloma hybridomas were obtained by
using the standard procedure of hybridoma technique, screened and
selected for their capability to examine the anti-GCA mAb by ELISA.
Positive clones were subcloned by limiting dilution method to
obtain mAbs. The positive hybridoma cells were subsequently
peritoneally injected into the female BALB/c mice, and the ascites
were generated and purified by ammonium sulfate precipitation,
followed further depuration by protein-G affinity chromatography,
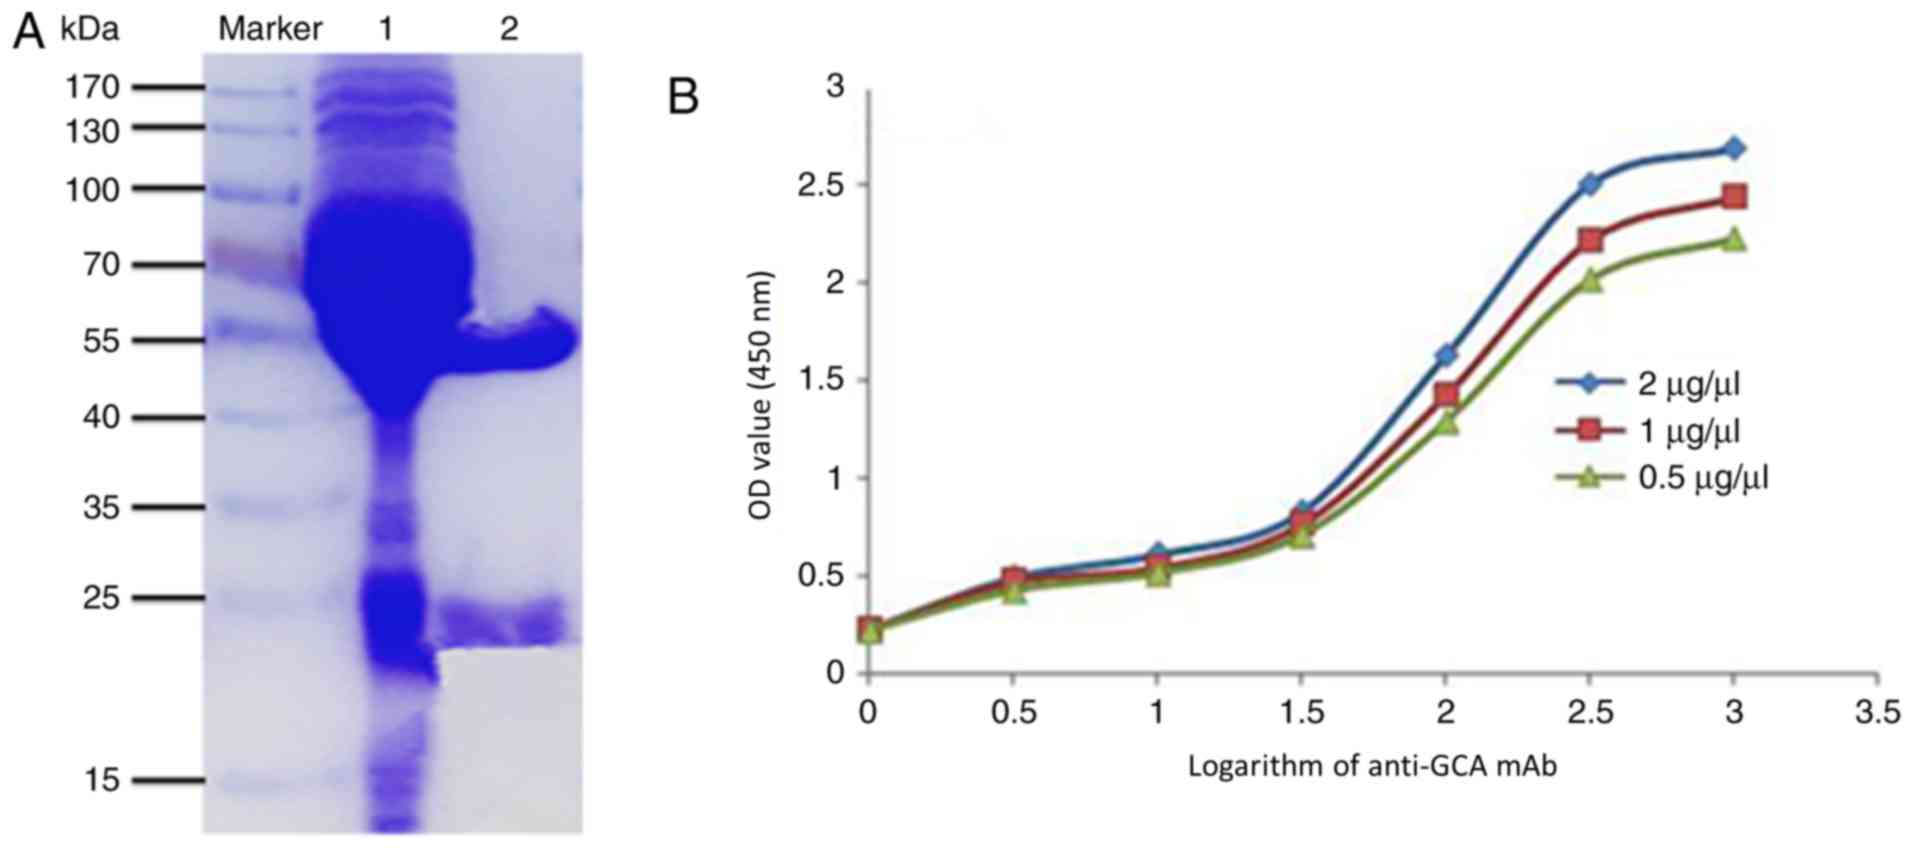
according to the manufacturer's protocols (30). Furthermore, the purity of mAb was
identified by SDS-PAGE (dyed by Coomassie Brilliant Blue R-250).
Antibodies have two chains, where the heavy chain molecular weight
is 50–75 kDa, and the light chain molecular weight is ~25 kDa
(29). The SDS-PAGE data demonstrated
that the purified anti-GCA mAb (Lane 2) had only two chains
compared with the unpurified antibodies (Lane 1), and the heavy
chain of anti-GCA mAb was ~55 kDa and the light chain was ~25 kDa
(Fig. 2A), indicating that the mAb
was successfully obtained and purified.
The affinity of anti-GCA mAb
Furthermore, the affinity of anti-GCA mAb was tested
by non-competitive ELISA as described previously (31). The OD values at a wavelength of 450 nm
were detected. The curve diagram was made and the affinity of the
antibody was obtained (31). The
affinity constant of antigen-antibody interaction was designed by
the equation average affinity constant (Kaff) = (n-1)/2[n
(Ab′)t-(Ab)t]. It was reported that an antibody with an affinity
constant between 107−1012 mol/l has a good
potential for application (36). The
Kaff of anti-GCA mAb was 2.6×10⁸ mol/l determined by
non-competitive ELISA (Fig. 2B).
Therefore, high affinity anti-GCA mAb was successfully generated
and purified. The isotype of mAb was further analyzed with an
Antibody Isotyping kit, according to manufacturer's protocols
(32) and the isotype of heavy chain
and light chain of the mouse anti-GCA mAb were IgG2a and κ,
respectively.
The anti-GCA mAb is highly specific
against human GCA
The specificity of anti-GCA mAb to human GCA was
analyzed by competitive western blot analysis. BSA and GCA-BSA were
separated by 10% SDS-PAGE, which was detected by Coomassie
Brilliant Blue R-250, according to the manufacturer's protocols.
The molecular weight of BSA was 66.43 kDa (range, 55–70 kDa), while
the molecular weight of GCA-BSA (~100 kDa) was significantly
increased (P<0.001), compared with that of BSA. SDS-PAGE results
indicated that the molecular weights of BSA and GCA-BSA were
correct and were able to be used as a control (Fig. 3A). To analyze the specificity of the
anti-GCA mAb, BSA and GCA-BSA were separated by 10% SDS-PAGE, and
subsequently electro-transferred to a PVDF membrane. The band of
the competitive group was significantly weaker (P<0.001),
compared with that of the non-competitive group (Fig. 3B), indicating that the anti-GCA mAb
was highly specific against human GCA.
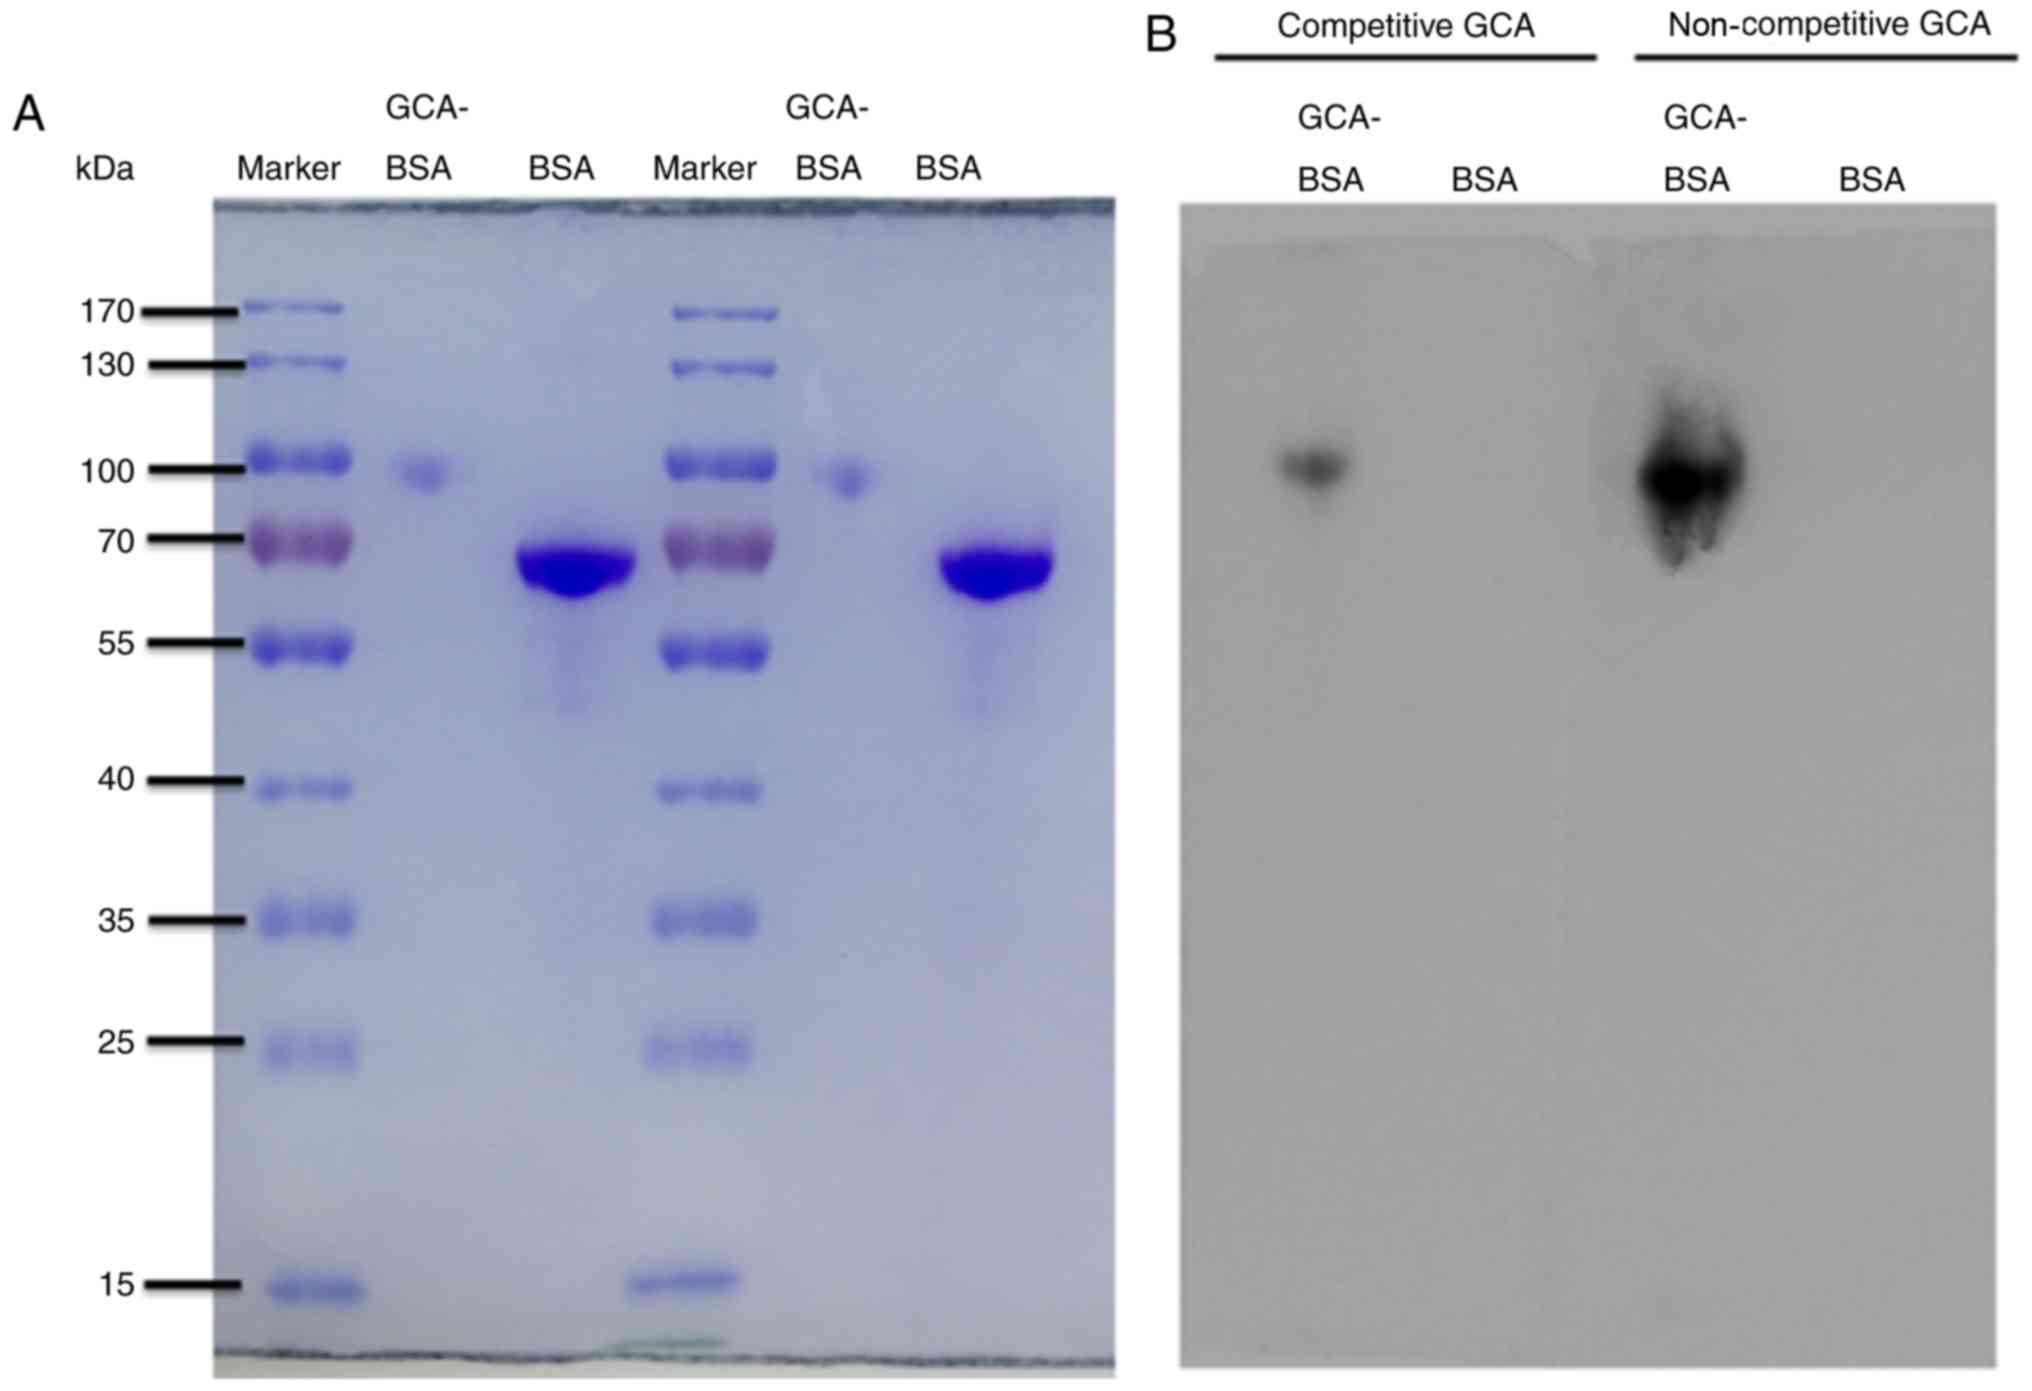 | Figure 3.The anti-GCA mAb was highly specific
against human GCA. (A) The molecular weight of GCA-BSA (~100 kDa)
was significantly increased, compared with the molecular weight of
BSA, 66.43 kDa (range, 55–70 kDa). SDS-PAGE results were used as
the control. (B) BSA and GCA-BSA were separated by SDS-PAGE and
electro-transferred to a PVDF membrane. The PVDF membrane was cut
into two identical parts. Competitive group, 5 ml GCA (10 µg/ml)
added to 5 ml anti-GCA mAb (1:1,000); non-competitive group, 5 ml
PBST added to 5 ml anti-GCA mAb (1:1,000). The secondary antibody
of all lanes was goat anti-mouse IgG (1:5,000). The band of the
competitive group was significantly weaker, compared with the
non-competitive group. GCA, glycocholic acid; mAb, monoclonal
antibody; BSA, bovine serum albumin; GCA-BSA, GCA-BSA conjugate;
PVDF, polyvinylidene fluoride membrane; PBST, Tween-20 PBS. |
Anti-GCA mAb is highly sensitive
toward human GCA
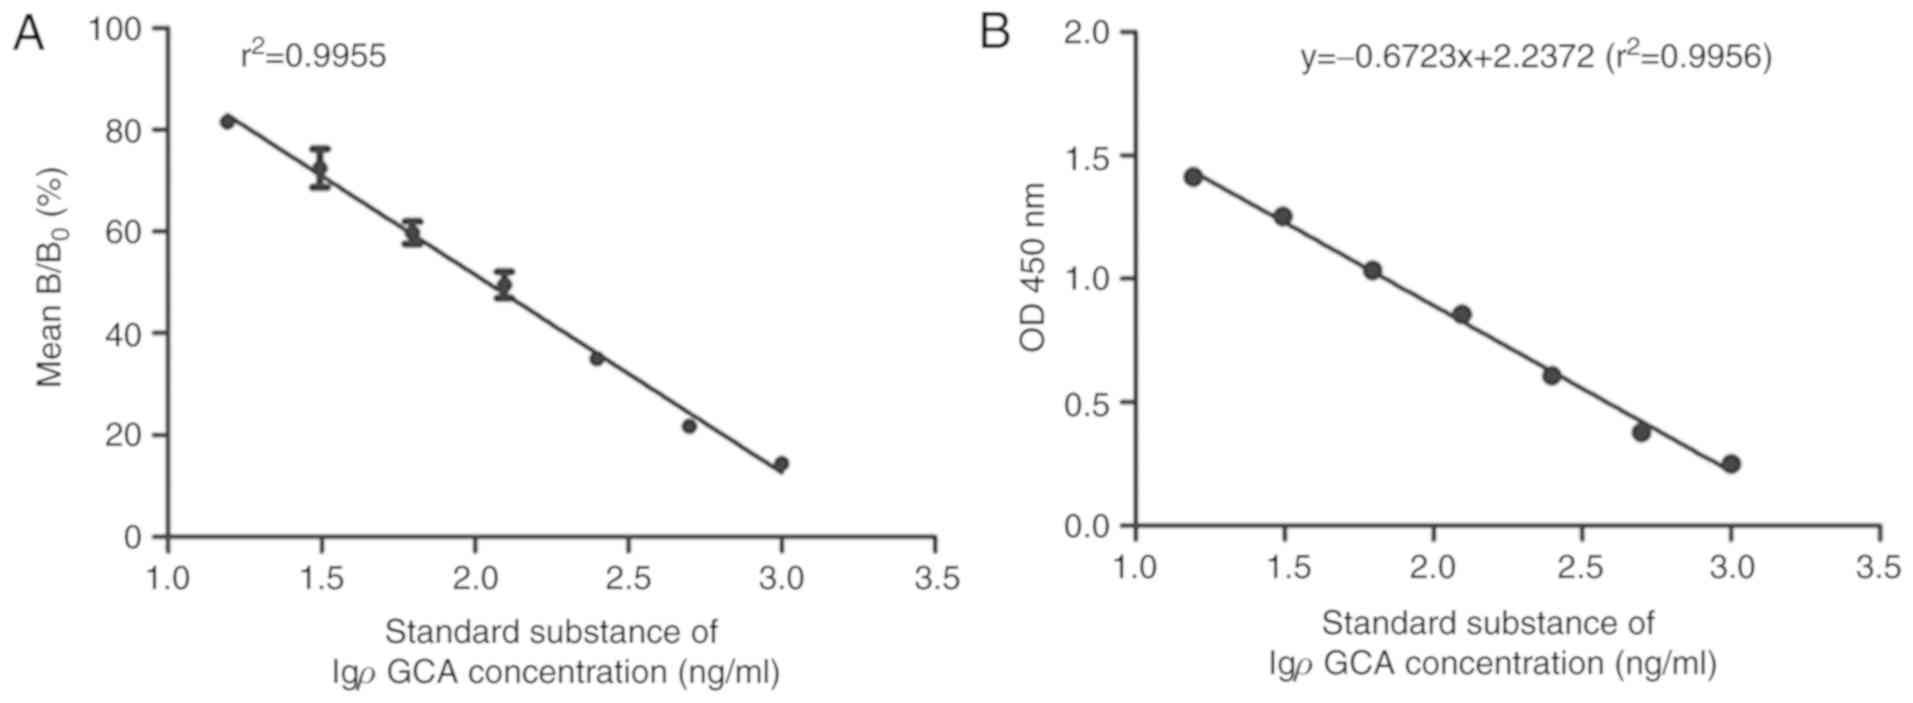
The sensitivity of anti-GCA mAb to human GCA was
analyzed by icELISA. Anti-GCA mAb was used as the primary antibody
and a series of diluted GCA (1, 2, 4, 8, 16, 32, 64 ×, and 0 × as
the control) were used as the competitive reagent. The curves were
made with the concentration logarithm of GCA as the x-axis, and the
mean binding rate ratio (B/B0) as the y-axis.
B0 was the OD value of the control well without GCA, and
B was the OD value of the well with GCA. According to the curves,
the following linear regression equation was obtained: y = −38.837×
+ 129.25, and the correlation coefficient (r2) was
0.9955. According to the regression equation, IC50 of
mAb binding to GCA-BSA was calculated to be 0.1098 µg/ml,
indicating the sensitivity of anti-GCA mAb was notably high
(Fig. 4A). It was observed that the
lower the IC50 was, the higher the sensitivity of
anti-GCA mAb.
For quantitative detection of GCA and its
application in HCC cells, icELISA was performed using GCA-BSA as
the coated antigen, and anti-GCA mAb as the detection reagent. The
standard line was made with the concentration logarithm of GCA as
the x-axis, and OD450 nm value as the y-axis. The
standard line indicates a good sensibility and reliability of the
icELISA method, which is capable of detecting GCA between 0.01563-1
µg/ml. The linear regression equation was y = −0.6723× + 2.2372 and
the correlation coefficient was 0.9956 (Fig. 4B). The result indicated that
OD450 nm absorbance was inversely correlated with GCA
competitive reagent, indicating that the anti-GCA mAb and icELISA
assay can be used to determine GCA concentration within the
competitive reagent. It was also indicated in icELISA that the
OD450 value was inversely correlated with GCA
concentration.
GCA is significantly elevated in HCC
cells, compared with normal human hepatocytes or lung cancer
cells
In order to determine if anti-GCA mAb can be used to
detect GCA in HCC cells, cell lysates and supernatants from HCC
cell line Huh7 and PLC/PRF/5, human hepatocyte cell line, HL-7702,
and lung cancer cell line, A549, were analyzed by icELISA. The
two-fold serial dilutions of the cell lysates or supernatants,
starting with the same number of cells for each cell line, were
used as the competitive reagent. The GCA in each sample was
subsequently calculated, according to the previous linear
regression equation y = −0.6723× + 2.2372. Consistent with previous
results (11), it was indicated that
the GCA level in Huh7 and PLC/PRF/5 cells was significantly
increased, compared with HL-7702 and A549 cells (Fig. 5A-D). GCA level in A549 cells was
similar to blank control value (Fig. 5A
and C).
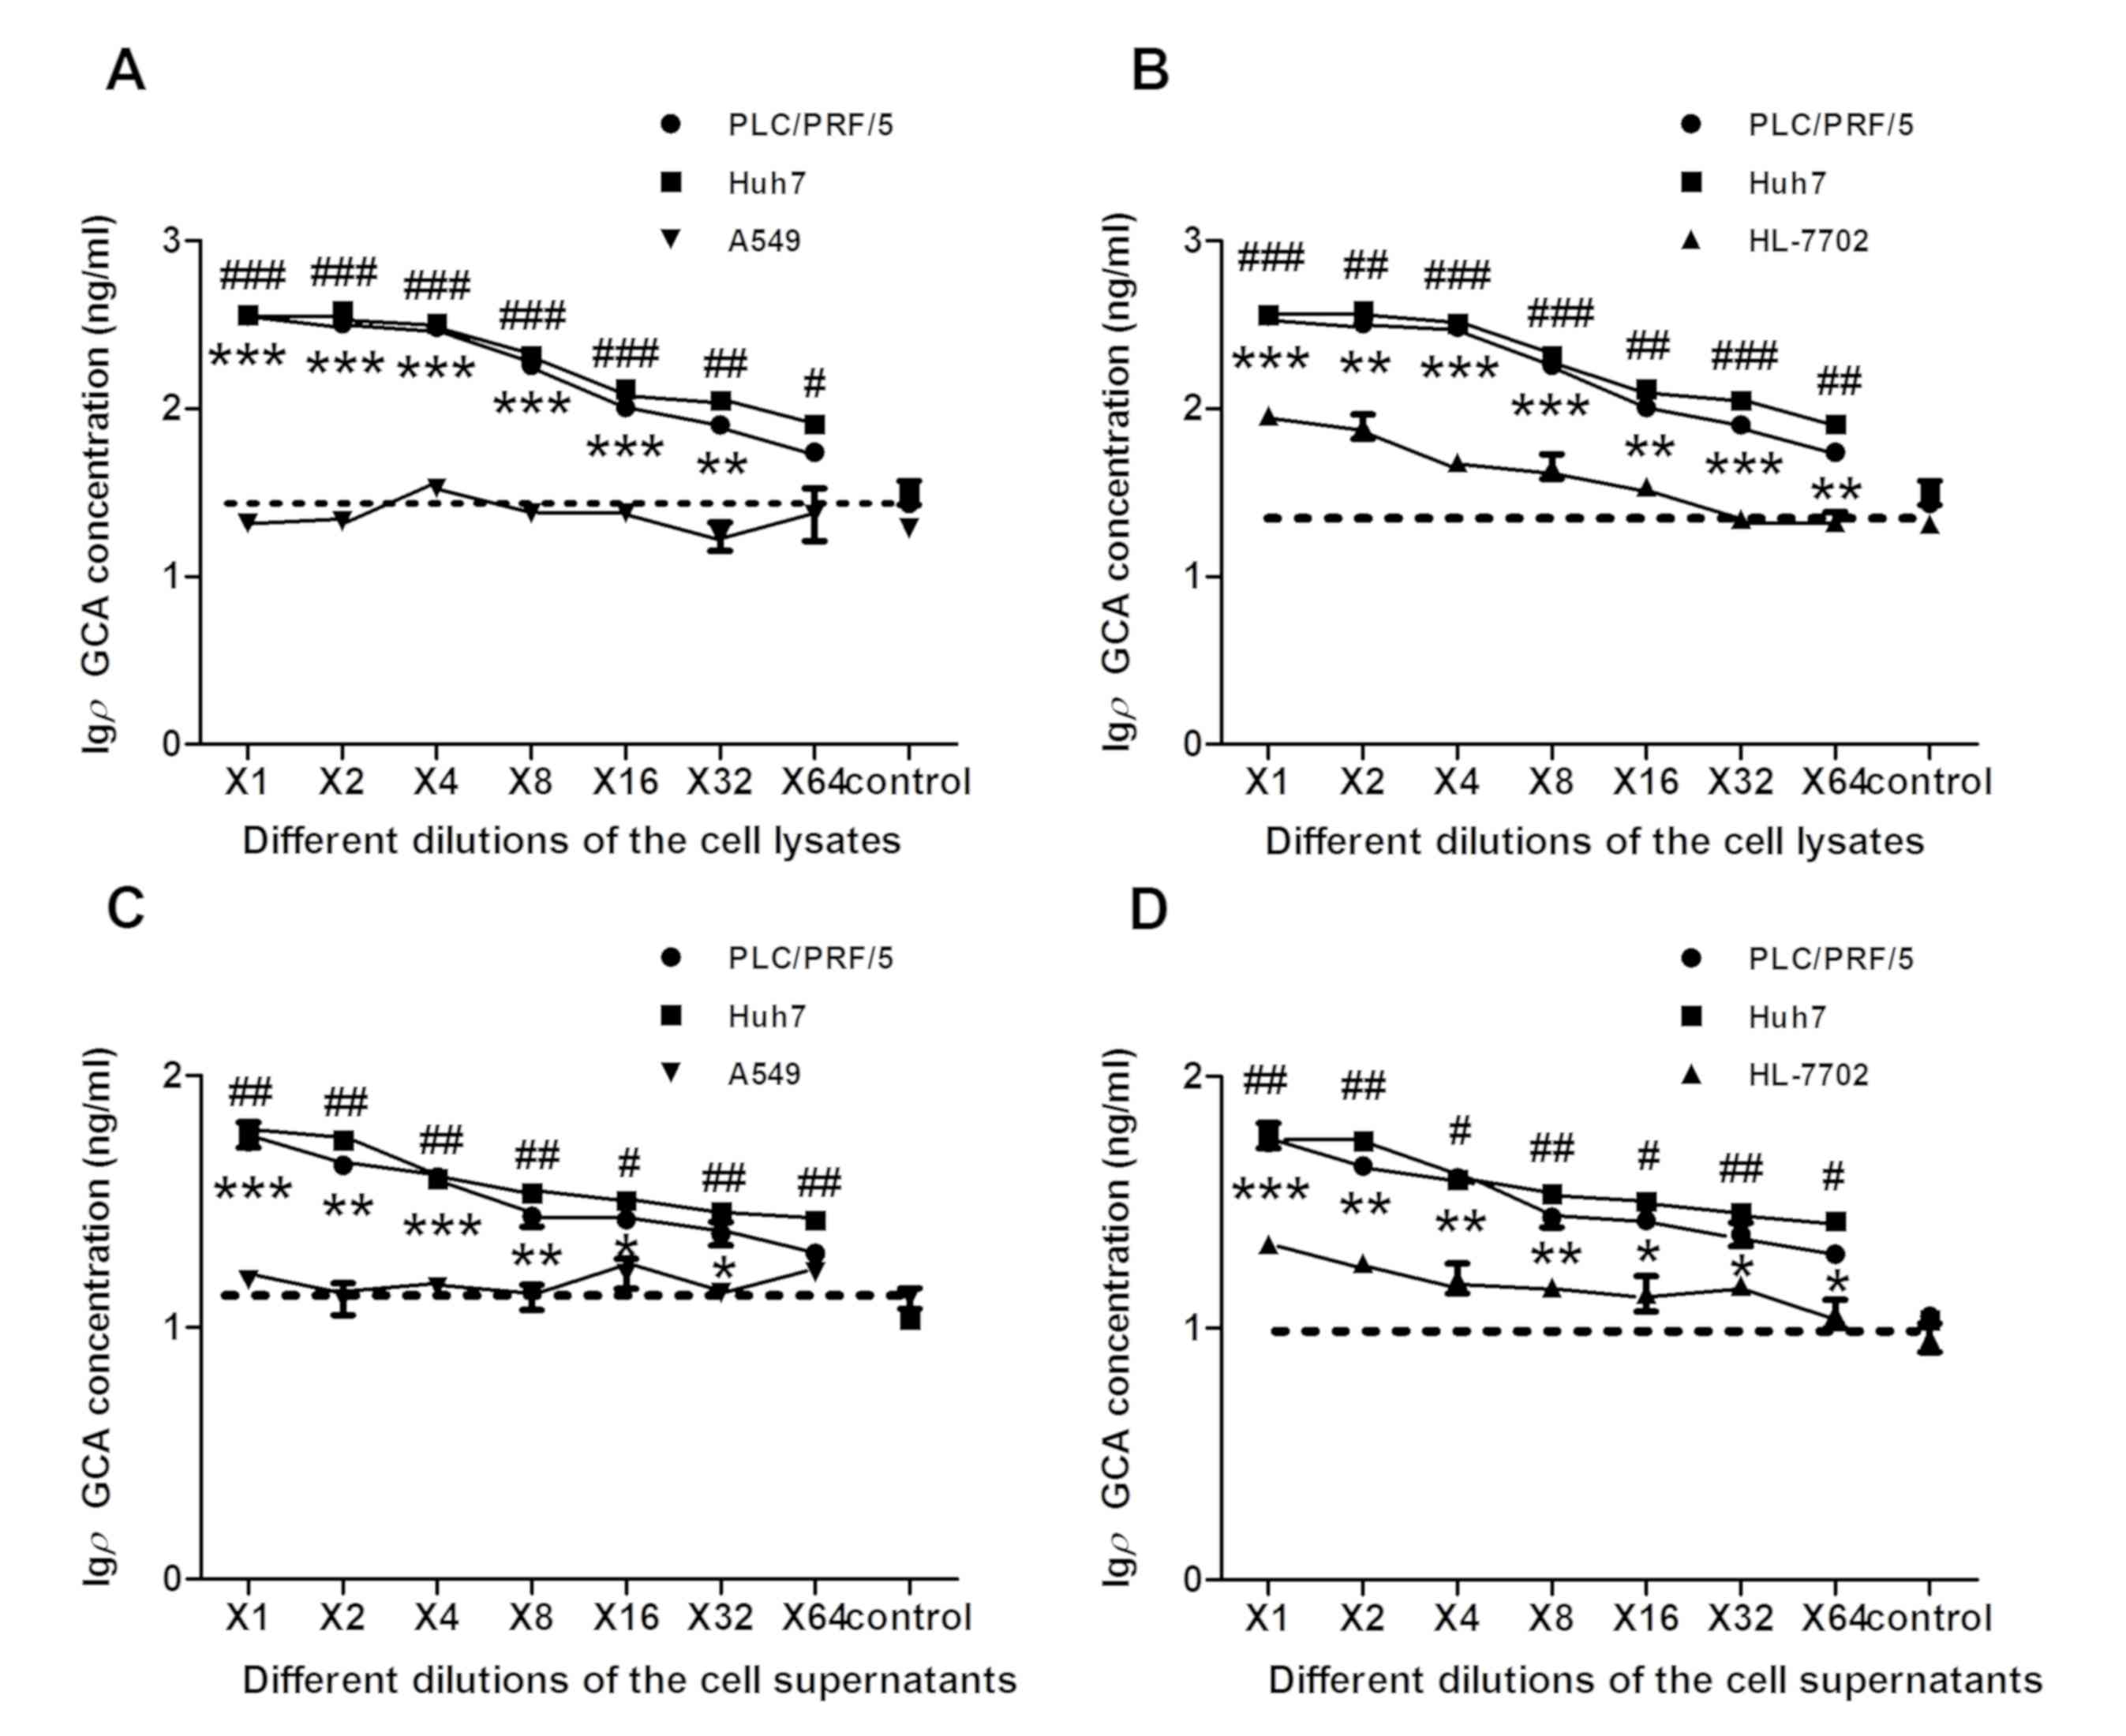 | Figure 5.The significantly elevated amount of
GCA was detected in HCC cells, compared with normal human
hepatocytes and lung cancer cells. Cell lysates and supernatants
from HCC cell lines Huh7 and PLC/PRF/5, human hepatocyte cell line
HL-7702 and lung cancer cell line A549 were collected and analyzed
by icELISA. The two-fold serial dilutions of the cell lysates or
supernatants were used as the competitive reagent. The GCA content
in each sample was then calculated according to the linear
regression equation y = −0.6723× + 2.2372. (A) icELISA analysis of
GCA content was examined in cell lysate using the same number of
different cells in Huh7 and PLC/PRF/5 cells, compared with A549
cells. **P<0.01, ***P<0.001, #P<0.05,
##P<0.01 and ###P<0.001 vs. A549 cells.
(B) icELISA analysis of GCA content was examined in cell lysate
using the same number of different cells in Huh7 and PLC/PRF/5 cell
lines, compared with HL-7702 cells. **P<0.01, ***P<0.001,
##P<0.01 and ###P<0.001 vs. HL-7702
cells. (C) icELISA analysis of GCA content was examined in the
supernatant using the same number of different cells in Huh7 and
PLC/PRF/5 cells, compared with A549 cells. *P<0.05, **P<0.01,
***P<0.001 and #P<0.05 vs. A549 cells. (D) icELISA
analysis of GCA content was examined in the supernatant using the
same number of different cells in Huh7 and PLC/PRF/5 cell lines,
compared with HL-7702 cells. *P<0.05, **P<0.01,
***P<0.001, #P<0.05 and ##P<0.01 vs.
HL-7702 cells. The dashed line in each figure represent the blank
control value (RPMI-1640 without FBS). The x-axis is the two-fold
serial dilutions of the cell line lysates or supernatants The
y-axis represents the Igρ GCA concentration. GCA, glycocholic acid;
icELISA, indirect competitive ELISA; HCC, hepatocellular carcinoma;
Igρ GCA, the logarithm of the GCA concentration based on 10. |
The protein concentration was subsequently
quantified with a BCA assay. Same amount of proteins (20 µg) were
used to make series of two-fold dilutions. GCA level from above
cell lysates and supernatants of HCC cell Huh7 and PLC/PRF/5, human
hepatocyte HL-7702, lung cancer cell A549 were analyzed again by
icELISA. Significantly increased levels of GCA were detected in HCC
cell lines Huh7 and PLC/PRF/5, compared with A549 or HL-7702 cells
(Fig. 6A-D), which was consistent
with the results indicated in Fig.
5A-D. In conclusion, the results of the present study indicated
that icELISA analysis based on the novel anti-GCA mAb can be
successfully used for a rapid, sensitive and efficient detection of
GCA from different HCC cell lines. Therefore, icELISA analysis may
have great potential for further clinical application.
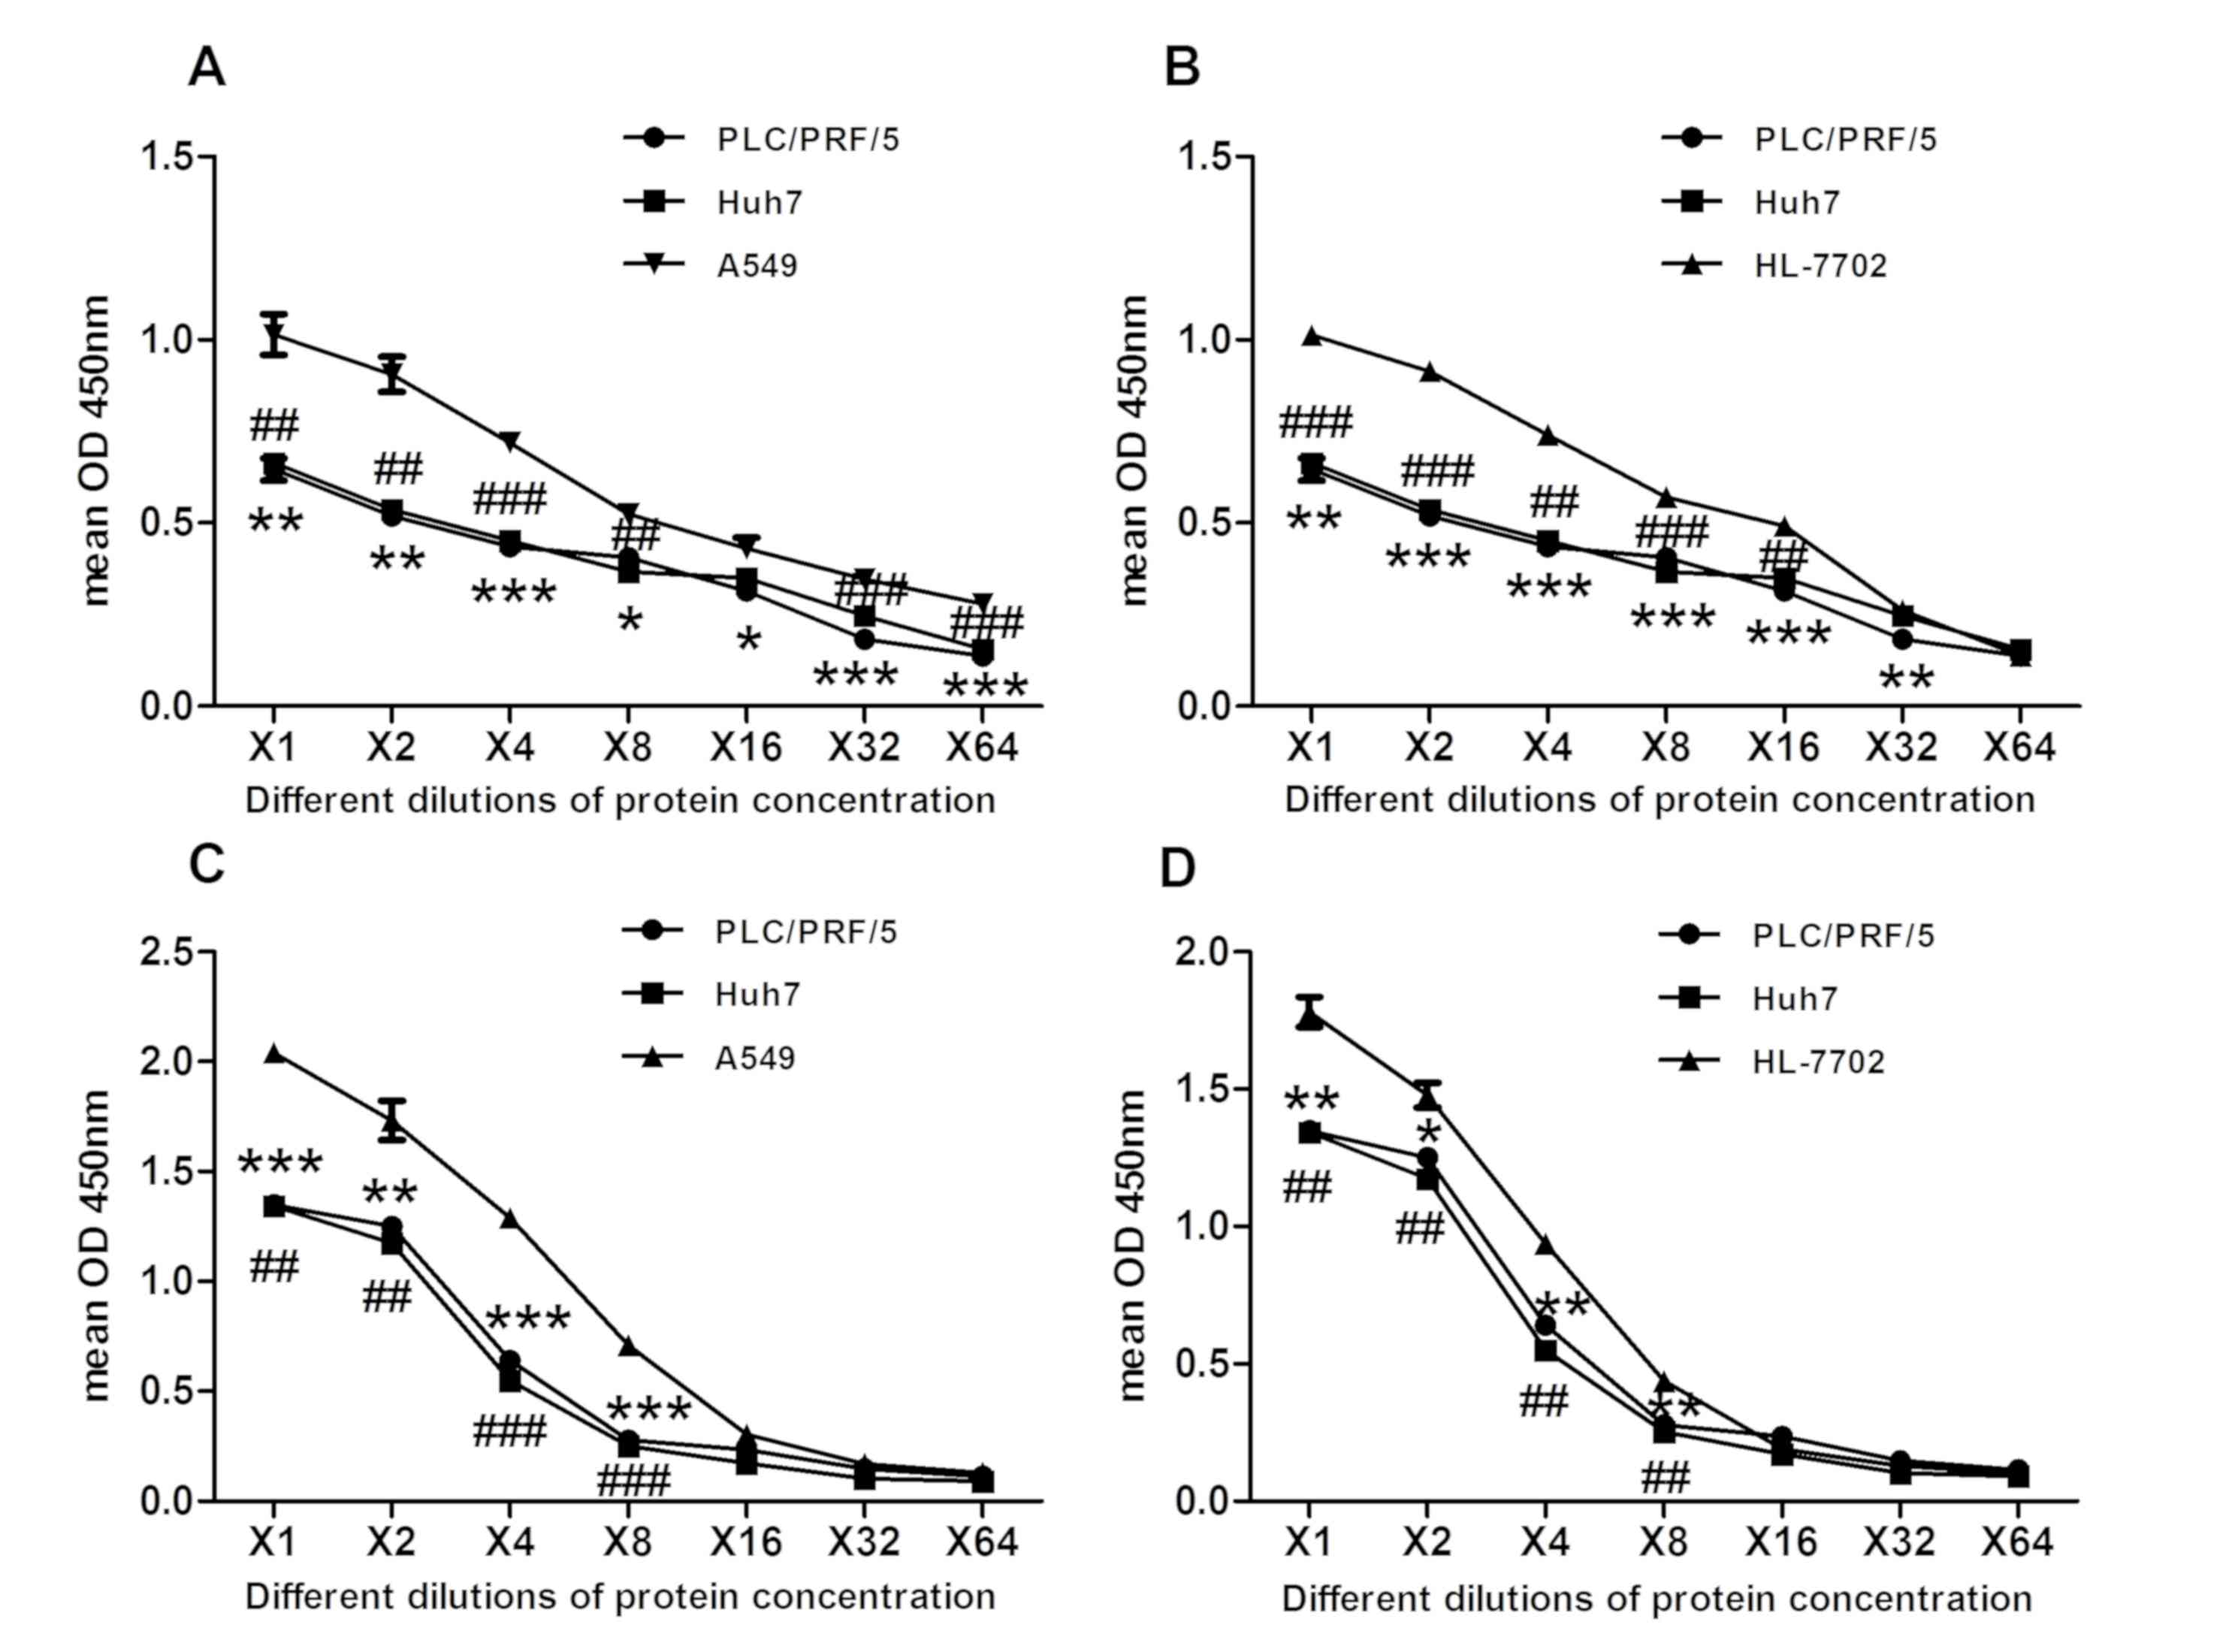 | Figure 6.The significantly elevated amount of
GCA was detected in HCC cells, compared with normal human
hepatocytes and lung cancer cells. Cell lysates and supernatants
from HCC cell lines Huh7 and PLC/PRF/5, human hepatocyte cell line
HL-7702 and lung cancer cell line A549 were collected and analyzed
by icELISA. The 2-fold serial dilutions of the cell lysates or
supernatants were used as the competitive reagent. The GCA content
in each sample was then calculated according to the linear
regression equation y = −0.6723×+2.2372. Quantified protein
concentration using a bicinchoninic acid assay where y-axis
indicates OD450, which is inversely correlated to GCA
concentration. Same amount of protein (20 µg) was used to make
series of two-fold dilutions. (A) Mean OD450 of GCA
contents was examined in cell lysate using the same protein amount
of different cells in Huh7 and PLC/PRF/5 cells, compared with A549.
*P<0.05, **P<0.01, ***P<0.001, ##P<0.01 and
###P<0.001 vs. A549 cells. (B) Mean OD450
of GCA contents was examined in cell lysate using the same protein
amount of different cells in Huh7 and PLC/PRF/5 cell lines,
compared with HL-7702 cells. **P<0.01, ***P<0.001,
##P<0.01 and ###P<0.001 vs. HL-7702
cells. (C) Mean OD450 of GCA contents was examined in
the supernatant using the same protein amount of different cells in
Huh7 and PLC/PRF/5 cells, compared with A549 cells. **P<0.01 and
***P<0.001 ##P<0.01 and ###P<0.001
vs. A549 cells. (D) Mean OD450 of GCA contents was
examined in the supernatant using the same protein amount of
different cells in Huh7 and PLC/PRF/5 cell lines, compared with
HL-7702 cells. *P<0.05, **P<0.01 and ##P<0.01
vs. HL-7702 cells. GCA, glycocholic acid; OD, optical density;
icELISA, indirect competitive ELISA; HCC, hepatocellular
carcinoma. |
Discussion
GCA is a combination of cholic acid and glycine,
with a molecular weight of 466.3 Da and one of the main components
of bile acids (12). The main
function of GCA is to participate in the digestion of fat, as it
also occurs as a sodium salt in the bile of mammals. In normal
conditions, GCA content in peripheral blood is very low and stable,
regardless of fasting or after-meal, with a blood concentration
<3 µg/ml in healthy individuals (37). However, under the conditions of
hepatocytes injury or cholestasis, abnormal metabolism and
circulation of bile acids would decrease the absorbance of cholic
acid, resulting in an increased GCA level in the blood, positively
correlated with the severity of hepatocyte damage and the metabolic
dysfunction of bile acid (38,39).
A number of studies have indicated that GCA, as a
clinical marker to detect liver diseases including HCC, chronic
active hepatitis, chronic active hepatitis and chronic active
hepatitis (40), has numerous
advantages compared with the traditional liver function tests,
including alanine aminotransferase, aspartate transaminase and
gamma-glutamyltranspeptidase (41,42).
Therefore, GCA analysis can provide the basic information for
diagnosis, treatment and prognosis of liver diseases, various
biliary system diseases, including cholangiocarcinoma (43), intrahepatic cholestasis and alcoholic
liver injury (39,44). HCC has a high morbidity and mortality
rate. Early-stage diagnosis of HCC can greatly reduce the mortality
and increase disease-free rate. Therefore, further studies are
required to identify a sensitive marker for the diagnosis of HCC. A
number of previous studies have identified that GCA is a sensitive
biomarker for HCC diagnosis (12,37,41).
The aim of the present study was to establish an
effective icELISA method, based on the anti-GCA mAb for detection
of GCA, in order to provide a simple, rapid, convenient, and
reliable way to detect GCA, therefore, promoting early diagnosis of
HCC. Synthesized human GCA hydrate
(C26H43NO6.xH2O, 465.62
g/mol), as a hapten, was first conjugated with BSA (66.43 kDa) to
form a complete antigen by the active ester method, as verified by
SDS-PAGE. GCA-BSA conjugate was used to immunize mice, and the
anti-serum specific to GCA with high titer (>1:409,000) was
acquired. Using GCA-BSA conjugate as the immunogen, a hybridoma
capable of generating anti-GCA mAb, was successfully obtained by
hybridoma technique (45). Ascites
were generated to obtain abundant mAb for further purification and
detection by SDS-PAGE. The isotype of the anti-GCA mAb was examined
to be IgG2a and κ. The affinity constant of anti-GCA mAb was
2.6×10⁸ mol/l. Furthermore, the high specificity of
anti-GCA mAb was determined by competitive western blot analysis
using GCA as the competitive reagent. The results indicated that
the binding between anti-GCA mAb and GCA-BSA can be almost fully
inhibited by free GCA.
Additionally, icELISA was established to detect the
expression of GCA in supernatant and lysate in a number of cell
lines. Previous studies indicated the expression of GCA increased
significantly in liver cancer (12,37,43). In
the present study, the expression of GCA in human normal hepatocyte
cell line (HL-7702), human HCC cell lines (PLC/PRF/5 and Huh7) and
lung adenocarcinoma cell line (A549) was detected. The results from
cell lysate of the different cells were similar to that from cell
supernatant, indicating that GCA expression was significantly
elevated in PLC/PRF/5 and Huh7, compared with HL-7702 and A549. In
order to further verify this result, under the same protein amount,
using a BCA protein assay kit, GCA expression was indicated to be
significantly elevated in PLC/PRF/5 and Huh7 cells, compared with
HL-7702 and A549 cells. Therefore, the results of the present study
strongly indicate that the icELISA method using the novel anti-GCA
mAb could be of great clinical assistance, in addition to being
sensitive to detecting GCA in HCC.
The present study data also indicates that GCA may
be used as a sensitive biomarker in HCC, which is consistent with
the results from other groups (13,46). A
number of studies have reported that there is a linear association
between GCA and the severity of hepatocyte dysfunction (37,43). With
the progress of hepatobiliary diseases, GCA has been reported to
demonstrate a trend of gradual increase (47). A number of researchers have proposed
the use of chenodeoxycholic acid ratio and the vein 14C
cholylglycine tolerance test, as a method for differential
diagnosis of liver diseases (48,49). It
has been also reported that GCA in human plasma and urine from
patients with HCC was significantly increased, compared with
healthy individuals (13). These
results indicate the broad application of GCA in the detection of
hepatobiliary diseases and HCC, as GCA is a more sensitive marker.
The novel anti-GCA mAb and icELISA assay may qualify for a simple,
more rapid and efficient detection method for GCA.
In conclusion, a novel anti-GCA mAb was successfully
generated in the present study, exhibiting a low IC50,
high specificity and sensitivity for GCA binding. An icELISA was
further established to detect the level of GCA in cells or body
fluids, reflecting the dynamic process of hepatocellular injury.
Therefore, these observations indicate the promising extensive
clinical application of GCA for early HCC diagnosis, and provide
novel insight for further research and treatment of HCC and other
hepatobiliary diseases.
Acknowledgements
Not applicable.
Funding
The present study was supported by the Youth Fund of
National Natural Science Foundation of China (grant No. 81600456)
to NL.
Availability of data and materials
All data generated or analyzed during the present
study are included in this published article.
Authors' contributions
MW made substantial contributions to conception,
design, and acquisition of data and was a major contributor in
writing the manuscript. SHZ and JG analyzed the data, design and
were involved in drafting the manuscript. DPW made contributions to
resource, data acquisition and analysis. JXX made contributions to
methodology. YXZ made contributions to investigation and
supervision. NL was involved in revising the manuscript critically
for important intellectual content and agreed to be accountable for
all aspects of the work in ensuring that questions related to the
accuracy of the work are appropriately investigated and resolved.
NL also made contributions to conception, methodology and
interpretation of data. LJH made substantial contributions to
conception, design, revised the manuscript and was the project
supervisor. All authors read and approved the final manuscript.
Ethics approval and consent to
participate
Ethical approval for the use of animals was obtained
from the Research Ethics Committee of West China School of Basic
Medical Sciences and Forensic Medicine, Sichuan University
(Sichuan, China). All experimental procedures complied with the
Sichuan University Committee Guidelines on the Use of Live Animals
in Research, in accordance with the National Institutes of Health
Guide for the Care and Use of Laboratory Animals (NIH Publications
No. 80-23), revised in 1978.
Patient consent for publication
Not applicable.
Competing interests
The authors declare that they have no conflict of
interest.
References
|
1
|
Raghunath A, Sundarraj K, Arfuso F, Sethi
G and Perumal E: Dysregulation of nrf2 in hepatocellular carcinoma:
Role in cancer progression and chemoresistance. Cancers (Basel).
10:E4812018. View Article : Google Scholar : PubMed/NCBI
|
|
2
|
Zhang Z, Zhang Y, Wang Y, Xu L and Xu W:
Alpha-fetoprotein-L3 and Golgi protein 73 may serve as candidate
biomarkers for diagnosing alpha-fetoprotein-negative hepatocellular
carcinoma. Onco Targets Ther. 9:123–129. 2015.PubMed/NCBI
|
|
3
|
Schuette D, Moore LM, Robert ME, Taddei TH
and Ehrlich BE: Hepatocellular carcinoma outcome is predicted by
expression of neuronal calcium sensor 1. Cancer Epidemiol
Biomarkers Prev. 27:1091–1100. 2018. View Article : Google Scholar : PubMed/NCBI
|
|
4
|
Llovet JM, Burroughs A and Bruix J:
Hepatocellular carcinoma. Lancet. 362:1907–1917. 2003. View Article : Google Scholar : PubMed/NCBI
|
|
5
|
Altekruse SF, McGlynn KA and Reichman ME:
Hepatocellular carcinoma incidence, mortality, and survival trends
in the United States from 1975 to 2005. J Clin Oncol. 27:1485–1491.
2009. View Article : Google Scholar : PubMed/NCBI
|
|
6
|
Siegel R, Naishadham D and Jemal A: Cancer
statistics, 2013. CA Cancer J Clin. 63:11–30. 2013. View Article : Google Scholar : PubMed/NCBI
|
|
7
|
Hernandez-Gea V, Turon F, Berzigotti A and
Villanueva A: Management of small hepatocellular carcinoma in
cirrhosis: Focus on portal hypertension. World J Gastroenterol.
19:1193–1199. 2013. View Article : Google Scholar : PubMed/NCBI
|
|
8
|
Wang W and You J: Research and application
of (18)F-fluorodeoxyglucose positron emission tomography/computed
tomography for the diagnosis and treatment of primary
hepatocellular carcinoma. Sheng Wu Yi Xue Gong Cheng Xue Za Zhi.
34:480–484. 2017.(In Chinese; Abstract available in Chinese from
the publisher). PubMed/NCBI
|
|
9
|
Guo W, Tan HY, Wang N, Wang X and Feng Y:
Deciphering hepatocellular carcinoma through metabolomics: From
biomarker discovery to therapy evaluation. Cancer Manag Res.
10:715–734. 2018. View Article : Google Scholar : PubMed/NCBI
|
|
10
|
Ressom HW, Xiao JF, Tuli L, Varghese RS,
Zhou B, Tsai TH, Ranjbar MR, Zhao Y, Wang J, Di Poto C, et al:
Utilization of metabolomics to identify serum biomarkers for
hepatocellular carcinoma in patients with liver cirrhosis. Anal
Chim Acta. 743:90–100. 2012. View Article : Google Scholar : PubMed/NCBI
|
|
11
|
Li H, Fan SF, Wang Y, Shen SG and Sun DX:
Rapid detection of small molecule metabolites in serum of
hepatocellular carcinoma patients using ultrafast liquid
chromatography-ion trap-time of flight tandem mass spectrometry.
Anal Sci. 33:573–578. 2017. View Article : Google Scholar : PubMed/NCBI
|
|
12
|
Zhang A, Sun H, Yan G, Han Y, Ye Y and
Wang X: Urinary metabolic profiling identifies a key role for
glycocholic acid in human liver cancer by ultra-performance
liquid-chromatography coupled with high-definition mass
spectrometry. Clin Chim Acta. 418:86–90. 2013. View Article : Google Scholar : PubMed/NCBI
|
|
13
|
Li QF, Zhan YM, Zhong YG, Zhang B and Ge
CQ: Macromolecular crowding agents-assisted imprinted polymers for
analysis of glycocholic acid in human plasma and urine. Biomed
Chromatogr. 30:1706–1713. 2016. View
Article : Google Scholar : PubMed/NCBI
|
|
14
|
Martinot E, Sedes L, Baptissart M,
Lobaccaro JM, Caira F, Beaudoin C and Volle DH: Bile acids and
their receptors. Mol Aspects Med. 56:2–9. 2017. View Article : Google Scholar : PubMed/NCBI
|
|
15
|
Cui X, Vasylieva N, Shen D, Barnych B,
Yang J, He Q, Jiang Z, Zhao S and Hammock BD: Biotinylated
single-chain variable fragment-based enzyme-linked immunosorbent
assay for glycocholic acid. Analyst. 143:2057–2065. 2018.
View Article : Google Scholar : PubMed/NCBI
|
|
16
|
Guo C, Xie C, Ding P, Qin G, Mo W, Cao X
and Zheng S: Quantification of glycocholic acid in human serum by
stable isotope dilution ultra performance liquid chromatography
electrospray ionization tandem mass spectrometry. J Chromatogr B
Analyt Technol Biomed Life Sci. 1072:315–319. 2018. View Article : Google Scholar : PubMed/NCBI
|
|
17
|
Luo L, Schomaker S, Houle C, Aubrecht J
and Colangelo JL: Evaluation of serum bile acid profiles as
biomarkers of liver injury in rodents. Toxicol Sci. 137:12–25.
2014. View Article : Google Scholar : PubMed/NCBI
|
|
18
|
Trottier J, Bialek A, Caron P, Straka RJ,
Milkiewicz P and Barbier O: Profiling circulating and urinary bile
acids in patients with biliary obstruction before and after biliary
stenting. PLoS One. 6:e220942011. View Article : Google Scholar : PubMed/NCBI
|
|
19
|
Xiao JF, Varghese RS, Zhou B, Nezami
Ranjbar MR, Zhao Y, Tsai TH, Di Poto C, Wang J, Goerlitz D, Luo Y,
et al: LC-MS based serum metabolomics for identification of
hepatocellular carcinoma biomarkers in egyptian cohort. J Proteome
Res. 11:5914–5923. 2012. View Article : Google Scholar : PubMed/NCBI
|
|
20
|
Schmid A, Neumann H, Karrasch T, Liebisch
G and Schaffler A: Bile acid metabolome after an oral lipid
tolerance test by liquid chromatography-tandem mass spectrometry
(Lc-Ms/Ms). PLoS One. 11:e01488692016. View Article : Google Scholar : PubMed/NCBI
|
|
21
|
Cui X, Vasylieva N, Wu P, Barnych B, Yang
J, Shen D, He Q, Gee SJ, Zhao S and Hammock BD: Development of an
indirect competitive enzyme-linked immunosorbent assay for
glycocholic acid based on chicken single-chain variable fragment
antibodies. Anal Chem. 89:11091–11097. 2017. View Article : Google Scholar : PubMed/NCBI
|
|
22
|
Hua J, Li Z, Xia W, Yang N, Gong J, Zhang
J and Qiao C: Preparation and properties of EDC/NHS mediated
crosslinking poly (gamma-glutamic acid)/epsilon-polylysine
hydrogels. Mater Sci Eng C Mater Biol Appl. 61:879–892. 2016.
View Article : Google Scholar : PubMed/NCBI
|
|
23
|
Schrama D, Reisfeld RA and Becker JC:
Antibody targeted drugs as cancer therapeutics. Nat Rev Drug
Discov. 5:147–159. 2006. View Article : Google Scholar : PubMed/NCBI
|
|
24
|
Kumar G: Fungal laccase efficiently
destains coomassie brilliant blue-R-250 stained polyacrylamide
gels. Methods Mol Biol. 1853:247–253. 2018. View Article : Google Scholar : PubMed/NCBI
|
|
25
|
National Research Council (US) Committee
for the Update of the Guide for the Care and Use of Laboratory
Animals: Guide for the Care and Use of Laboratory Animals. The
National Academies Collection: Reports funded by National
Institutes of Health (8th). (Washington (DC), USA). 2011.
|
|
26
|
Seong GS, Sohn HJ, Kang H, Seo GE, Kim JH
and Shin HJ: Production and characterization of monoclonal
antibodies against cathepsin B and cathepsin B-Like proteins of
naegleria fowleri. Exp Parasitol. 183:171–177. 2017. View Article : Google Scholar : PubMed/NCBI
|
|
27
|
Kohler G and Milstein C: Continuous
cultures of fused cells secreting antibody of predefined
specificity. Nature. 256:495–497. 1975. View Article : Google Scholar : PubMed/NCBI
|
|
28
|
Kim JH, Lee J, Sohn HJ, Song HO, Kim JY,
Lee WJ, Park H and Shin HJ: Production of monoclonal antibodies for
Plasmodium vivax lactate dehydrogenase and patient sera screening
using sandwich ELISA. Parasitol Res. 111:1645–1650. 2012.
View Article : Google Scholar : PubMed/NCBI
|
|
29
|
Chen Q, Qiu S, Li H, Lin C, Luo Y, Ren W,
Zou Y, Wang Y, Xia N and Huang C: A novel approach for rapid
high-throughput selection of recombinant functional rat monoclonal
antibodies. BMC Immunol. 19:352018. View Article : Google Scholar : PubMed/NCBI
|
|
30
|
Zarei S, Bayat AA, Hadavi R, Mahmoudi AR,
Tavangar B, Vojgani Y, Jeddi-Tehrani M and Amirghofran Z:
Production and characterization of a peptide-based monoclonal
antibody against CD44 variant 6. Monoclon Antib Immunodiagn
Immunother. 34:36–43. 2015. View Article : Google Scholar : PubMed/NCBI
|
|
31
|
Sheng JW, He M and Shi HC: A highly
specific immunoassay for microcystin-LR detection based on a
monoclonal antibody. Anal Chim Acta. 603:111–118. 2007. View Article : Google Scholar : PubMed/NCBI
|
|
32
|
Jin Z, Sun T, Xia X, Wei Q, Song Y, Han Q,
Chen Q, Hu J and Zhang J: Optimized expression, purification of
herpes B virus gD protein in escherichia coli, and production of
its monoclonal antibodies. Jundishapur J Microbiol. 9:e321832016.
View Article : Google Scholar : PubMed/NCBI
|
|
33
|
Aghebati Maleki L, Majidi J, Baradaran B,
Abdolalizadeh J, Kazemi T, Aghebati Maleki A and Sineh Sepehr K:
Large scale generation and characterization of anti-human CD34
monoclonal antibody in ascetic fluid of balb/c mice. Adv Pharm
Bull. 3:211–216. 2013.PubMed/NCBI
|
|
34
|
Yin W, Liu J, Zhang T, Li W, Liu W, Meng
M, He F, Wan Y, Feng C, Wang S, et al: Preparation of monoclonal
antibody for melamine and development of an indirect competitive
ELISA for melamine detection in raw milk, milk powder, and animal
feeds. J Agric Food Chem. 58:8152–8157. 2010. View Article : Google Scholar : PubMed/NCBI
|
|
35
|
Chen L, Wang L, Yan J, Ma C, Lu J, Chen G,
Chen S, Su F, Wang W and Su X: 131I-labeled monoclonal antibody
targeting neuropilin receptor type-2 for tumor SPECT imaging. Int J
Oncol. 50:649–659. 2017. View Article : Google Scholar : PubMed/NCBI
|
|
36
|
Maragos CM, Busman M and Plattner RD:
Development of monoclonal antibodies for the fusarin mycotoxins.
Food Addit Contam Part A Chem Anal Control Expo Risk Assess.
25:105–114. 2008. View Article : Google Scholar : PubMed/NCBI
|
|
37
|
He Q, Cui X, Shen D, Chen Y, Jiang Z, Lv
R, Eremin SA and Zhao S: Development of a simple, rapid and
high-throughput fluorescence polarization immunoassay for
glycocholic acid in human urine. J Pharm Biomed Anal. 158:431–437.
2018. View Article : Google Scholar : PubMed/NCBI
|
|
38
|
Collazos J: Glycocholic acid in chronic
active hepatitis and mild liver diseases. Clin Investig. 72:36–39.
1993. View Article : Google Scholar : PubMed/NCBI
|
|
39
|
Li T and Chiang JY: Bile Acid signaling in
liver metabolism and diseases. J Lipids. 2012:7540672012.
View Article : Google Scholar : PubMed/NCBI
|
|
40
|
Kim MJ and Suh DJ: Profiles of serum bile
acids in liver diseases. Korean J Intern Med. 1:37–42. 1986.
View Article : Google Scholar : PubMed/NCBI
|
|
41
|
Zhou L, Wang SB, Chen SG, Qu Q and Rui JA:
Prognostic value of ALT AST, and AAR in hepatocellular carcinoma
with B-type hepatitis-associated cirrhosis after radical
hepatectomy. Clin Lab. 64:1739–1747. 2018. View Article : Google Scholar : PubMed/NCBI
|
|
42
|
Stepien M, Fedirko V, Duarte-Salles T,
Ferrari P, Freisling H, Trepo E, Trichopoulou A, Bamia C,
Weiderpass E, Olsen A, et al: Prospective association of liver
function biomarkers with development of hepatobiliary cancers.
Cancer Epidemiol. 40:179–187. 2016. View Article : Google Scholar : PubMed/NCBI
|
|
43
|
Song WS, Park HM, Ha JM, Shin SG, Park HG,
Kim J, Zhang T, Ahn DH, Kim SM, Yang YH, et al: Discovery of
glycocholic acid and taurochenodeoxycholic acid as phenotypic
biomarkers in cholangiocarcinoma. Sci Rep. 8:110882018. View Article : Google Scholar : PubMed/NCBI
|
|
44
|
Collazos J, Mendarte U and De Miguel J:
Clinical value of the determination of fasting glycocholic acid
serum levels in patients with liver diseases. A comparison with
standard liver tests. Gastroenterol Clin Biol. 17:79–82.
1993.PubMed/NCBI
|
|
45
|
Li X, Yang L, Yang Y, Shao M and Liu Y:
Preparation and characterization of a novel monoclonal antibody
against the extracellular domain of human transferrin receptor.
Monoclon Antib Immunodiagn Immunother. 36:1–7. 2017. View Article : Google Scholar : PubMed/NCBI
|
|
46
|
Han J, Qin WX, Li ZL, Xu AJ, Xing H, Wu H,
Zhang H, Wang MD, Li C, Liang L, et al: Tissue and serum metabolite
profiling reveals potential biomarkers of human hepatocellular
carcinoma. Clin Chim Acta. 488:68–75. 2019. View Article : Google Scholar : PubMed/NCBI
|
|
47
|
Chen T, Xie G, Wang X, Fan J, Qiu Y, Zheng
X, Qi X, Cao Y, Su M, Wang X, et al: Serum and urine metabolite
profiling reveals potential biomarkers of human hepatocellular
carcinoma. Mol Cell Proteomics. 10:M110004945. 2011. View Article : Google Scholar
|
|
48
|
Thjodleifsson B, Barnes S, Chitranukroh A,
Billing BH and Sherlock S: Assessment of the plasma disappearance
of cholyl'l14C-glycine as a test of hepatocellular disease. Gut.
18:697–702. 1977. View Article : Google Scholar : PubMed/NCBI
|
|
49
|
McCormick WC III, Bell CC Jr, Swell L and
Vlahcevic ZR: Cholic acid synthesis as an index of the severity of
liver disease in man. Gut. 14:895–902. 1973. View Article : Google Scholar : PubMed/NCBI
|