Introduction
Adipose tissue serves a vital role in regulating
metabolism. Two different types of adipose tissue, white adipose
tissue (WAT) and brown adipose tissue (BAT), have been recognized
in mammals. Although WAT has attracted considerable attention in
various research fields, the progress of investigating BAT remains
slow.
In the last decade, it has been demonstrated that
BAT is a therapeutic target of obesity and other associated
metabolic diseases. BAT was first described in 1551 by K. Gessner
in the interscapular region of marmots and was validated in the
early 20th Century (1). In 2004, BAT
was identified in the adult human body by
fluorodeoxyglucose-positron emission tomography (2,3).
Ultimately, in 2009, the presence of a metabolically active form of
BAT in the adult human body was identified in three independent
studies (4–6). Of note, in recent years, it has been
reported that WAT can acquire similar metabolic functions to those
of BAT in a process known as ‘browning’ (7). Subsequently, the number of studies on
the origin, development, activation, function and regulation of BAT
has rapidly increased.
Hepatocellular carcinoma (HCC) is one of the most
common malignant types of cancer with a high mortality rate. There
is a lack of effective strategies for the treatment of HCC in the
clinic, particularly for patients with advanced stages of the
disease, as surgical resection or transplantation are not suitable
owing to serious side effects caused by conventional chemotherapy
and radiotherapy. Currently, bio-immunotherapy and targeted therapy
are favorable for clinical application because of their relatively
low toxicity. However, the self-tolerance immune mechanism of the
liver and a lack of candidate target antigens are huge challenges
for bio-immunotherapy (8).
Furthermore, clinical trials of targeted drugs, with the exception
of sorafenib, ended in failure (9–11), which
is stagnating the progress of targeted therapy. Therefore, there is
an urgent requirement to develop novel HCC treatments with a lower
toxicity and a higher efficiency.
To date, owing to a decrease in the incidence of
chronic hepatitis infections, the rationale for an increasing
number of HCC cases is focused on liver metabolic disorders
(12). Metabolic conditions,
including obesity, which underlie hepatic metabolic diseases, are
becoming emerging risk factors for HCC (13). Considering that the browning of WAT
and the activation of BAT have been indicated to be a novel
approach for treating obesity (14),
it is hypothesized that there are as yet unknown connections
between HCC and BAT. BAT may be an inhibitory factor for HCC.
Therefore, to clarify the association between HCC
and BAT, a mouse model was used to determine the effect of H22 cell
transplantation on BAT. The in vivo BAT excision model was
established to investigate the effect of removing BAT on the growth
of H22 tumors. Furthermore, the in vitro and in vivo
intervention models with primary brown adipose cells (BACs) were
developed to investigate the interaction of BACs with the H22 cells
and tumors, respectively. Furthermore, DNA microarray and signaling
pathways [Kyoto Encyclopedia of Genes and Genomes (KEGG)] analyses
were used to characterize the gene expression profile of the liver.
The metabolic alterations in the serum were also investigated by
biochemical analysis. A number of previously unreported connections
between BAT/BACs and HCC were identified, thus indicating an
innovative strategy for HCC treatment.
Materials and methods
Animals
The animal experiments were conducted according to
the Regulations on the Administration of Experimental Animals (2013
revision) issued by the National Scientific and Technological
Committee of People's Republic of China. All animal experimental
procedures were approved by the Beijing Municipal Science &
Technology Commission (Beijing, China).
A total of 140 female KM mice (18–20 g) at 3–4 weeks
old were purchased from HFK Bioscience (Beijing, China), and were
fed standard food and water. The mice were housed in cages in a
12-h light/12-h dark cycle at 22±1°C and a humidity of 55±5%. After
2 days of free access to regular food and water, the mice were used
for subsequent experiments.
H22 mouse model
H22 ascites, which were frozen and passaged in our
laboratory, can be transformed into solid tumors in the armpits of
KM mice. First, 1 ml cryopreserved H22 ascites were thawed and
injected into the abdominal cavities of three KM mice. After 2
weeks, the abdominal cavities of KM mice were filled with H22
ascites. The ascites (dilution, 1:10) were injected into the
armpits of 10 female KM mice. These 10 mice were allocated to the
tumor (T) group. A further 10 healthy female KM mice were allocated
to the control (C) group.
Blood samples were collected from the eyeballs,
tumors and livers from 20 mice 10 days later. BATs in the
interscapular region and WATs in the inguinal region were dissected
and weighed following sacrifice of the mice. At the same time, part
of the liver tissues was excised and frozen in liquid nitrogen. At
the end of the experiment, the collected blood samples were
centrifuged at 3,000 × g for 5 min at room temperature, and the
serum in the supernatant was stored at −80°C for biochemical
analyses.
BAT excision model
A total of 40 KM mice (weight, 18–20 g) were
randomly divided into four groups: sham (S), sham and tumor (ST),
surgery (O), and surgery and tumor (OT). At day 0, all mice were
anaesthetized by injecting pentobarbital sodium into the abdominal
cavities (50 mg/kg). Incisions (15–20 mm) were made in the
interscapular regions of the mouse skin. For the S and ST groups,
the wounds were sutured immediately. For the O and OT groups, BATs
in the interscapular region were excised and the wounds were
sewed.
At day 4, H22 ascites (dilution, 1:10) were injected
into the armpit of mice in the T and OT groups. At day 14, the
blood samples were collected from the eyeballs of 40 mice. Tumors,
livers, BATs and WATs in the mice were treated as aforementioned in
the H22 mouse model section.
In vivo primary BAC intervention
model
Primary BACs were isolated as described by Marko
et al (15). Following
sacrifice and sterilization, the BATs in the interscapular region
were dissected from the 3-week-old female mice. The tissues were
minced and digested at 37°C for 30 min in an isolation buffer with
1 mg/ml collagenase I, 123 mM NaCl, 5 mM KCl, 1.3 mM
CaCl2, 5 mM glucose, 4% bovine serum albumin (Amresco,
Inc., Framingham, MA, USA) and 100 mM
4-(2-hydroxyethyl)-1-piperazine-ethanesulfonic acid (pH of 7.4).
The digested tissues were passed through a 100-µm nylon filter, and
the collected BACs were centrifuged at 1,200 × g at room
temperature for 5 min. The BACs were resuspended in Dulbecco's
modified Eagle's medium (DMEM)/F12 (GE Healthcare, Chicago, IL,
USA) containing 20% FBS (Gibco; Thermo Fisher Scientific, Inc.,
Waltham, MA, USA), supplemented with penicillin (100 U/ml) and
streptomycin (100 µg/ml), in a humidified atmosphere containing 5%
CO2. The medium was changed daily. The identity of BACs
was validated using steps as outlined by Gao et al (16) as follows: i) The BACs were induced and
differentiated to become mature adipose cells, and ii) the mature
BACs were stained with oil red O.
Following stabilization of the primary BACs, H22
ascites were injected into the armpit of mice at a volume ratio of
1:10 simultaneously adding the different numbers of BACs in the
inoculation suspensions. All mice were sacrificed, and the tumors
and livers were dissected and weighed 10 days after injection.
In vitro primary BAC intervention
model
The in vitro primary BAC intervention model
was established by performing a co-culture assay of the primary
BACs and H22 cells using Transwell cell culture inserts (Corning
Incorporated, Corning, NY, USA) containing a polycarbonate filter
with an 8-µm pore size. The H22 cell line was purchased from the
China Center for Type Culture Collection (Wuhan, China). H22 cells
were cultured in RPMI-1640 medium (GE Healthcare) supplemented with
10% FBS and penicillin (100 U/ml)/streptomycin (100 µg/ml) at 37°C
in a humidified atmosphere containing 5% CO2.
H22 cell suspensions (2×10⁵ cells/ml) in
a volume of 600 µl RPMI-1640 complete medium were added to the
lower compartment of the chamber. BAC suspensions at different cell
densities (7.5×10⁴, 1.5×10⁵ and
3×10⁵ cells/ml) in 100 µl DMEM/F12 complete medium were
added to the upper compartment of the chamber. After 48 h of
co-culture, the H22 cells were enumerated using a blood counting
chamber. The experiments were performed in triplicate. The complete
medium refers to the basal medium (RPMI-1640 or DMEM/F12)
supplemented with FBS and penicillin/streptomycin.
Serum biochemistry and histological
analyses
Serum cholesterol (CHO), high-density lipoprotein
(HDL), low-density lipoprotein (LDL), triacylglycerol (TG) and
glucose (GLU) were analyzed using a Hitachi 7100 analyzer (Hitachi,
Ltd., Tokyo, Japan) and kits obtained from Zhongsheng Beikong
Biotechnology (Beijing, China) (http://www.zhongsheng.com.cn/). Formalin-fixed tissues
including BAT, WAT and liver were embedded in paraffin, and the
sections were stained for 5 min at room temperature with
hematoxylin and eosin using a Hematoxylin-Eosin Staining kit (cat.
no., G1120-100, Beijing Solarbio Science & Technology Co.,
Ltd., Beijing, China), according to the manufacturer's protocols.
The percentage of cross-sectional areas for BAT and WAT was
quantified, which was determined in three random view fields for
each mouse from one group using a Leica QW3 light microscope (Leica
Microsystems, Inc., Buffalo Grove, IL, USA).
DNA microarray and KEGG analysis of
the livers for the T and OT groups
Five groups, i.e. C, T, S, O and OT, were created
using a similar animal modeling process with that aforementioned.
The mice in the C and T groups were treated with the aforementioned
procedures in the H22 mouse model. The mice in the S, O and OT
groups was treated with the aforementioned procedures in the BAT
excision model. Following sacrifice of the mice, the livers were
collected in liquid nitrogen. For the T and OT groups, three liver
tissue samples were selected from three different mice and combined
as one sample. The gene expression profiles of the combined sample
were analyzed for T vs. OT by DNA microarray and KEGG analysis.
Statistical analysis
The data and results were calculated with Excel 2016
(Microsoft Corporation, Redmond, WA, USA). The data are expressed
as the mean ± standard deviation, and then plotted using GraphPad
Prism (version 6; GraphPad Software, Inc., La Jolla, CA, USA). The
statistical differences among three or more groups were determined
using analysis of variance followed by a Tukey's test. Student's
t-test was used for comparisons between two groups. P<0.05 was
considered to indicate a statistically significant difference.
Results
H22 transplantation decreases BAT
weight in mice
In order to investigate the association between HCC
and BAT, the H22 mouse model was used to determine the effect of
H22 transplantation on BAT. As presented in Table I, the weight of the liver in the T
group was significantly greater compared with that of the C group
(P<0.01). In addition, the weights of BAT and WAT for the T
group were decreased compared with those of the C group; however,
the difference was not statistically significant. As presented in
Fig. 1A, the histopathological
analysis of BAT, WAT and liver revealed no marked pathological
changes prior to or following injection of H22 cells. The
percentages of cross-sectional areas in BAT were 58.81±5.54 and
54.32±4.71, respectively, for C and T; and in WAT were 91.71±3.45
and 90.52±4.25, respectively, for C and T. In order to analyze the
biochemical serum indices of the two groups, the levels of CHO,
HDL, LDL, TG and GLU were determined. The TG content in the serum
of the T group increased significantly compared with that of
healthy mice (P<0.01; Table
II).
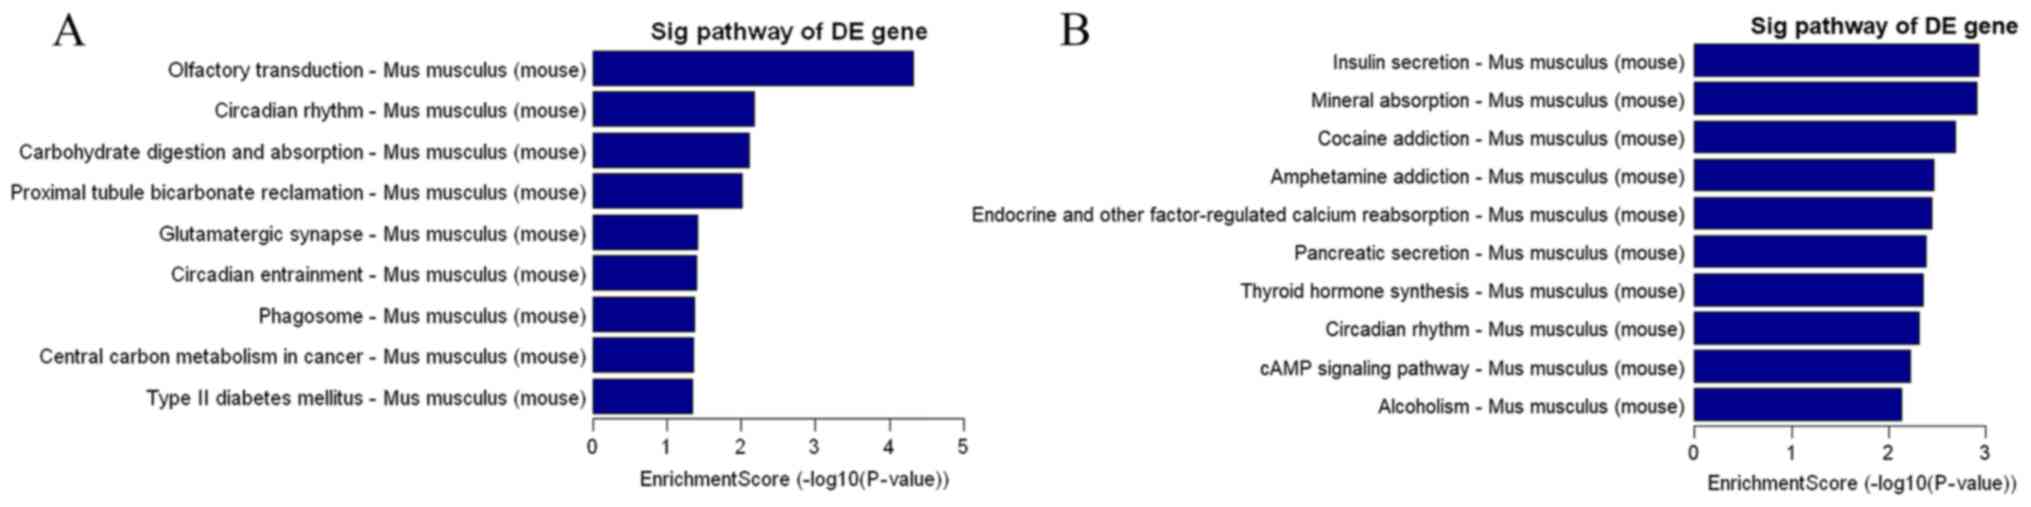
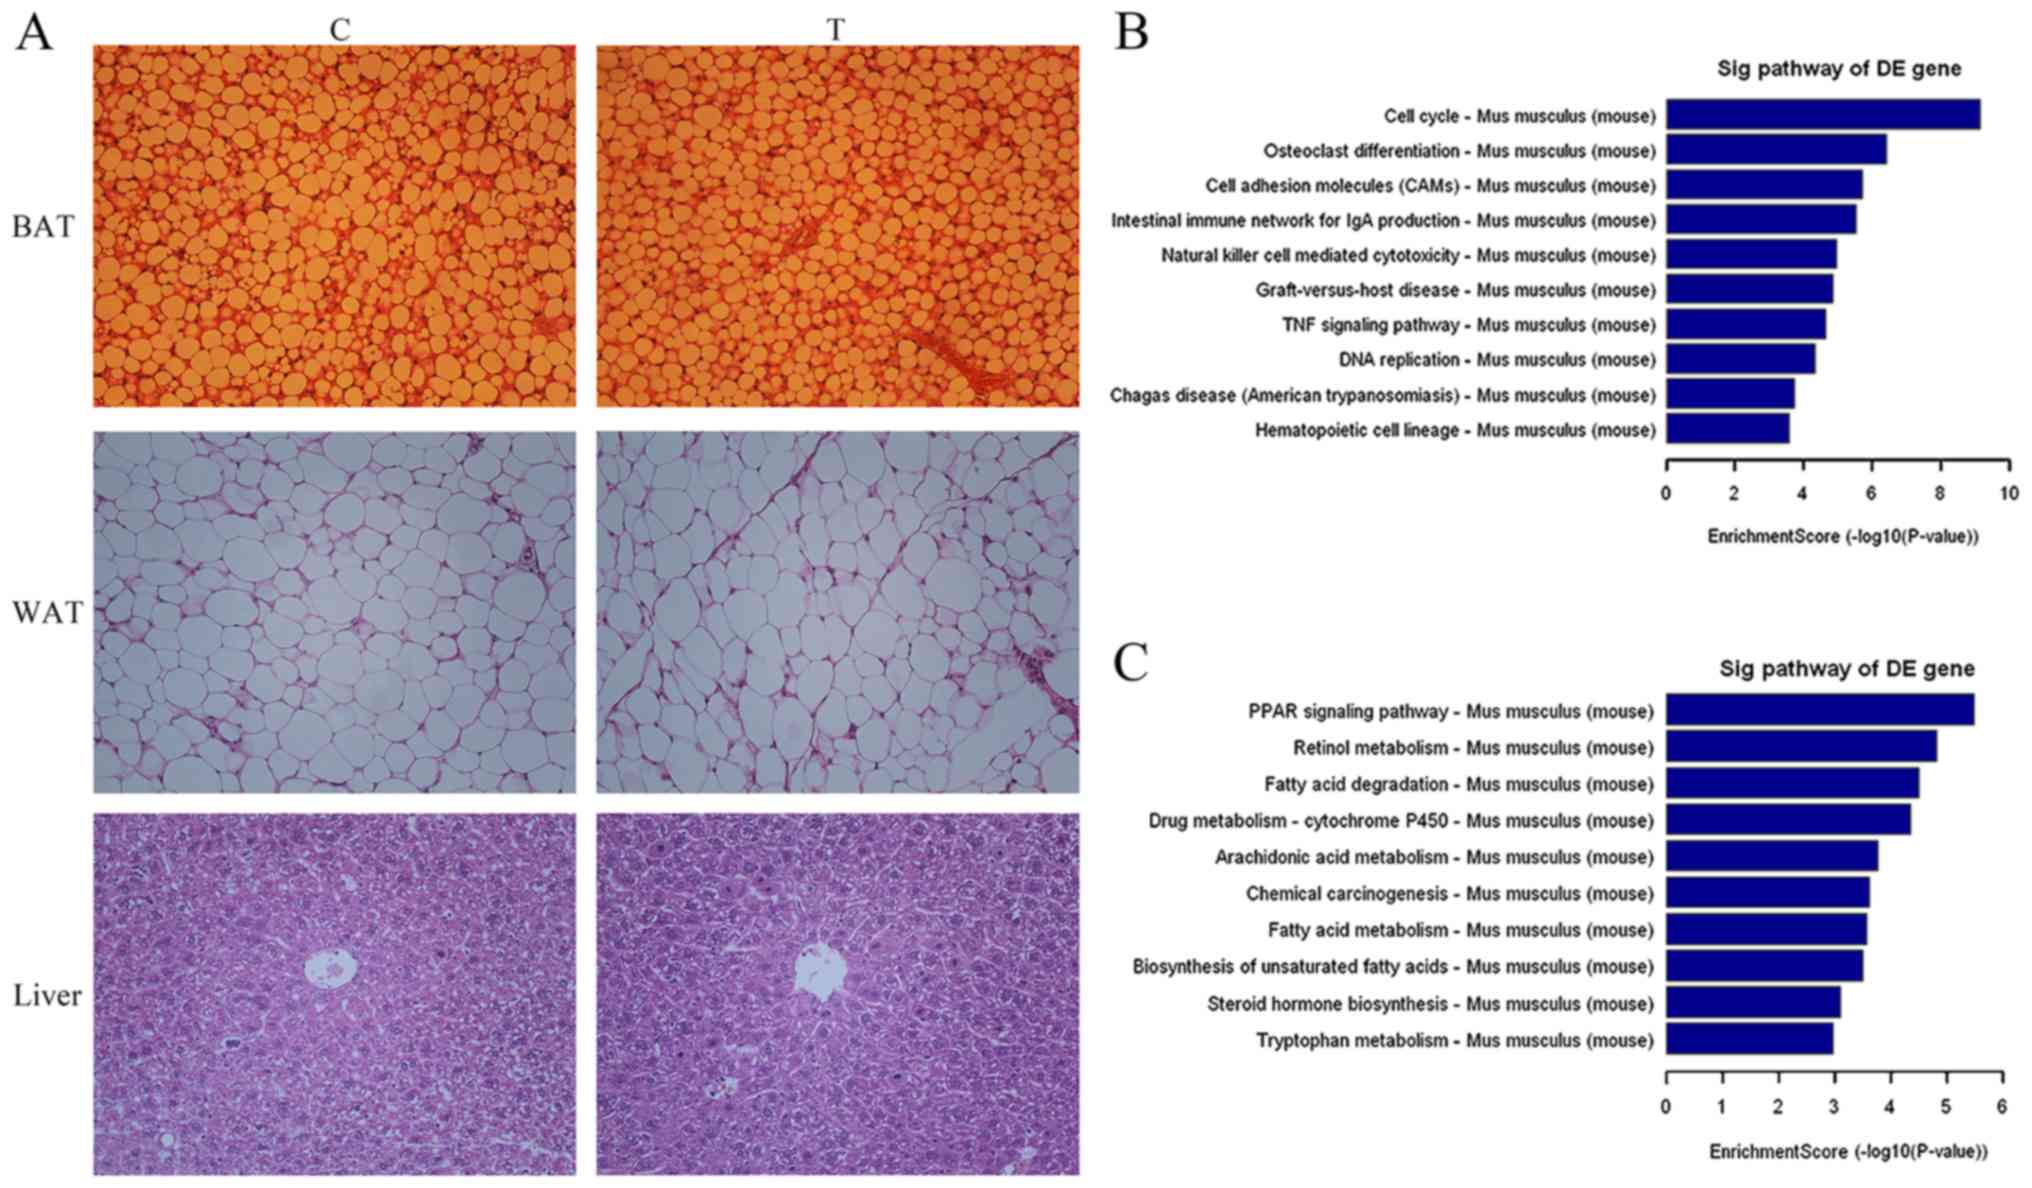 | Figure 1.(A) H22 cell transplantation resulted
in no pathological changes in BAT, WAT and liver in the C and T
groups, as determined by hematoxylin and eosin staining
(magnification, ×200). The 10 most significantly (B) upregulated
and (C) downregulated pathways in the liver for the group T vs. C
as determined using Kyoto Encyclopedia of Genes and Genomes pathway
analysis. BAT, brown adipose tissue; WAT, white adipose tissue; C,
control; T, tumor; Sig, significant; DE, differentially expressed;
IgA, immunoglobulin A; TNF, tumor necrosis factor; PPAR,
peroxisome-proliferator-activated receptor. |
 | Table I.Effect of H22 cell transplantation in
KM mice on body weight, tumor, liver, BAT and WAT. |
Table I.
Effect of H22 cell transplantation in
KM mice on body weight, tumor, liver, BAT and WAT.
| Group | Body weight, g | Tumor weight, g | Liver weight, g | BAT weight, g | WAT weight, g |
|---|
| C | 30.22±1.74 | − | 1.805±0.168 | 0.277±0.057 | 0.161±0.037 |
| T | 31.00±2.40 | 2.006±0.299 |
2.414±0.219a | 0.244±0.018 | 0.134±0.036 |
| Table II.Effect of H22 cell transplantation in
KM mice on the concentration of CHO, HDL, LDL, TG and GLU in
serum. |
Table II.
Effect of H22 cell transplantation in
KM mice on the concentration of CHO, HDL, LDL, TG and GLU in
serum.
| Group | CHO, mM | HDL, mM | LDL, mM | TG, mM | GLU, mM |
|---|
| C | 2.66±0.36 | 1.26±0.19 | 0.27±0.08 | 2.21±0.41 | 4.56±1.00 |
| T | 2.52±0.37 | 1.02±0.17 | 0.25±0.11 |
3.28±1.10a | 5.09±1.09 |
Gene expression profiling analysis of the livers in
the two groups of mice was also performed. Fig. 1B indicates that there was upregulation
of genes involved in the cell cycle (including BUB1, CCNA2, CDC14A,
CDK1, CDKN2C, E2F1, ESPL1 and GADD45B) and DNA
replication-associated (including FEN1, MCM2, MCM3, MCM4, MCM5,
MCM6, PCNA, POLA1, POLE, POLE2, PRIM1 and RNASEH2B) signaling
pathways in the liver of the T group. In addition, a number of
genes in metabolism-associated signaling pathways (including
ACAA1B, ACSL1, AOX3, CYP1A2, ACAA1B, ACADSB, ACAA1B, ACACA, ACAA1B
and ACOT1) were downregulated (Fig.
1C).
Removal of BAT in vivo promotes the
growth of H22 tumors
Since H22 injection led to a decrease in the weight
of BAT in mice, an in vivo BAT excision model was used to
investigate the effect on H22 tumors of removing BAT. The tumor
weight of the OT group was significantly larger (P<0.01)
compared with that of the ST group, indicating that excision of BAT
promoted the growth of H22 tumors (Table III). Compared with the S group, H22
injection led to a significant increase in liver weight in the ST
group (P<0.05) and the removal of BAT also resulted in a
significant increase in liver weight in the O group (P<0.05)
(Table III). Furthermore, the liver
weight in the OT group was higher compared with that of the O or ST
group, but there was no significant difference in liver weight
between the OT and O groups or between the OT and T groups. For the
ST group, the weight of BAT and WAT decreased compared with in the
S group where mice do not have tumors, but there was no significant
difference between the two groups. The weight of WAT in the OT
group was significantly less compared with in the O or S group
(P<0.01). There were no marked pathological changes in sections
of BAT, WAT and liver among different groups (Fig. 2). The percentages of cross-sectional
areas in BAT were 57.20±4.96 and 56.18±5.10, respectively, for the
S and ST groups; and in WAT were 94.13±2.94, 93.04±2.13, 92.07±2.43
and 90.45±8.14, respectively, for the S, ST, O and OT groups.
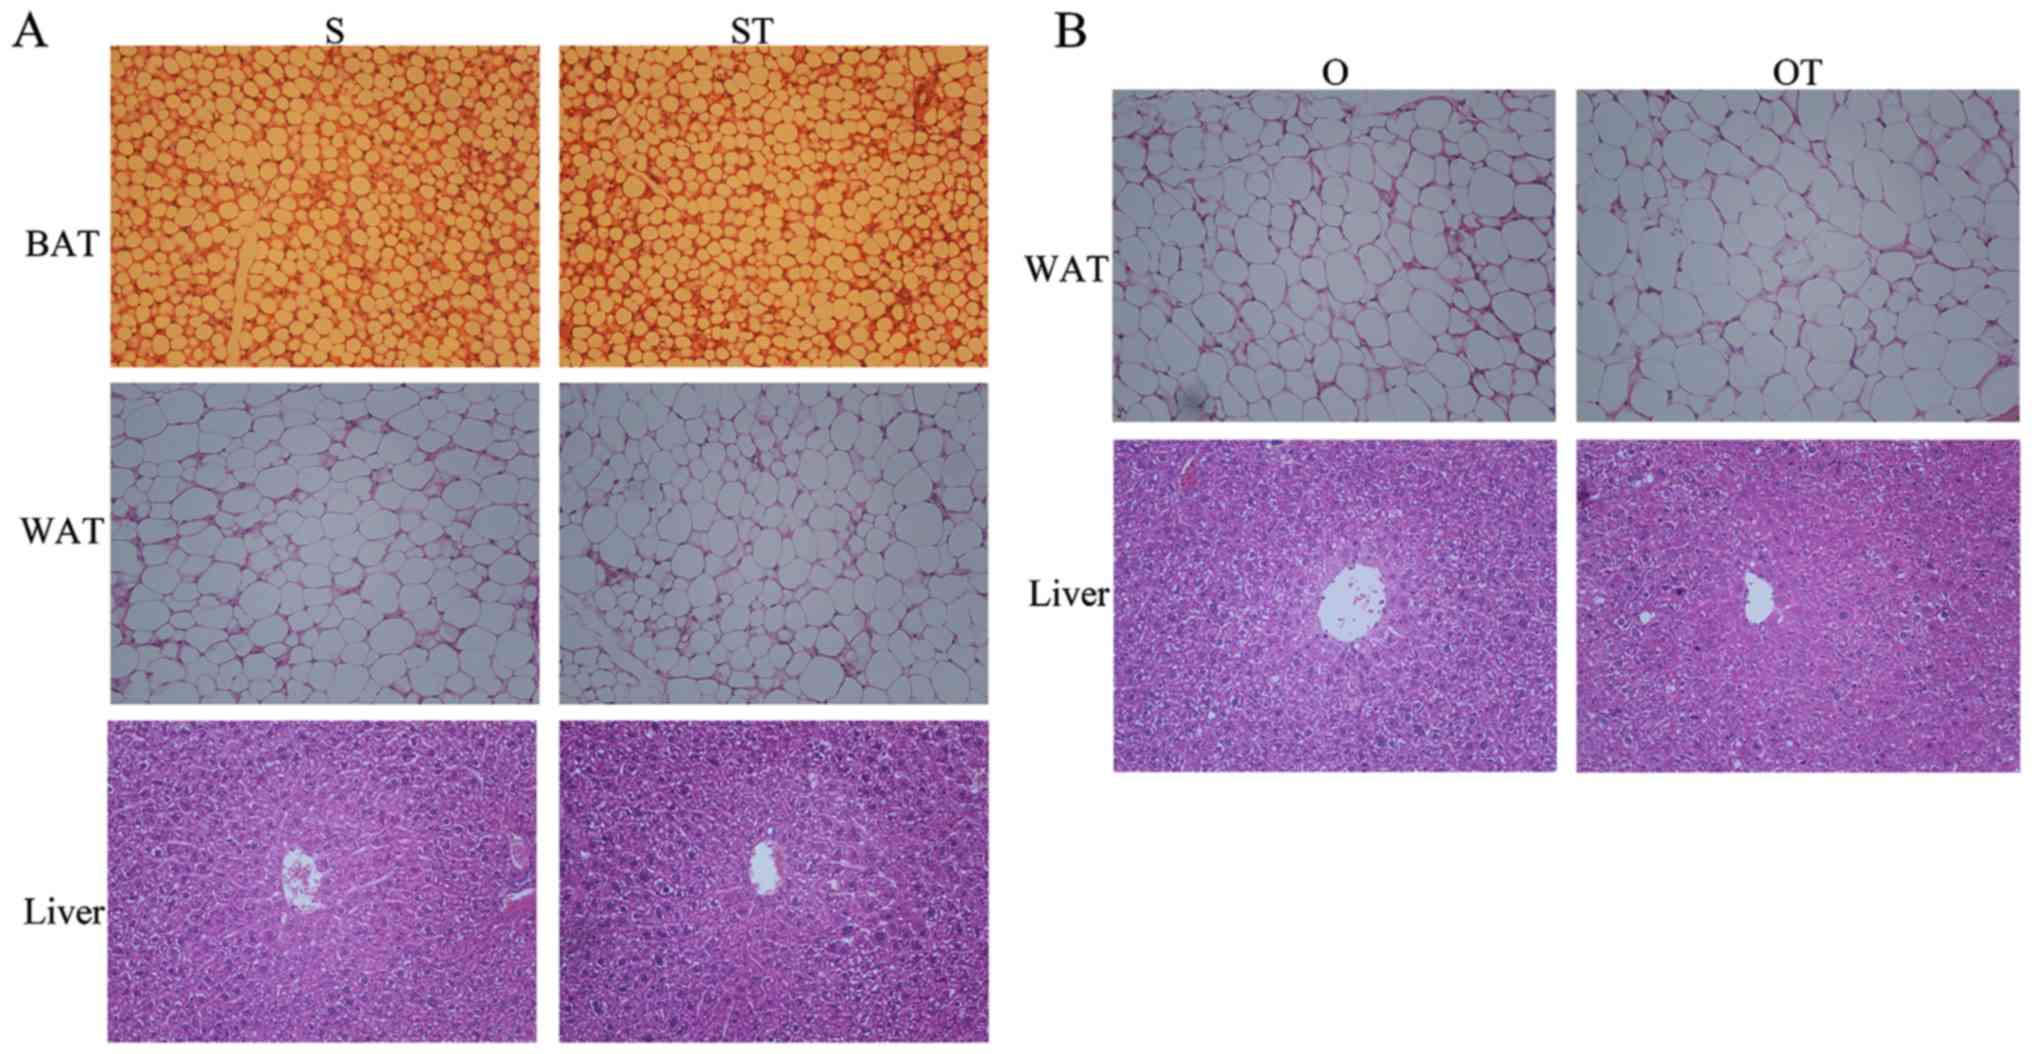 | Figure 2.(A) In the in vivo BAT excision
model, H22 cell transplantation leads resulted in no pathological
changes in BAT, WAT and liver in the S and ST groups, as determined
by H&E staining (magnification, ×200). (B) Removal of BAT and
H22 transplantation resulted in no pathological changes in WAT and
liver in the O or OT groups, as determined by H&E staining
(magnification, ×200). BAT, brown adipose tissue; WAT, white
adipose tissue; S, sham; ST, sham and tumor; O, surgery; OT,
surgery and tumor; H&E, hematoxylin and eosin. |
| Table III.Effect of BAT removal on body weight,
tumor, liver, BAT and WAT in the BAT excision model. |
Table III.
Effect of BAT removal on body weight,
tumor, liver, BAT and WAT in the BAT excision model.
| Group | Body weight, g | Tumor, weight g | Liver weight, g | BAT weight, g | WAT weight, g |
|---|
| S | 27.68±2.67 | − | 1.764±0.381 | 0.243±0.024 | 0.142±0.028 |
| ST | 28.87±2.73 | 1.919±0.143 |
2.128±0.198a | 0.223±0.042 | 0.124±0.023 |
| O | 29.28±1.51 | − |
2.091±0.195a | − | 0.145±0.026 |
| OT | 28.85±1.32 |
2.802±0.468d |
2.322±0.280b | − |
0.106±0.015b,c |
Since the functions of liver and BAT are associated
with lipid metabolism, the serum concentrations of the biochemical
indicators CHO, HDL, LDL, TG and GL were determined (Table IV). For CHO, HDL, LDL and GLU, there
was no significant difference in serum levels among the four
groups. The patterns of changes in the serum level of TG among the
four groups were similar with regard to liver weight. There was a
significant increase in the serum level of TG in the ST or OT group
compared with the S or O group, respectively (P<0.01). However,
in contrast with the S group, the serum TG level in the O group
increased slightly, but not significantly.
| Table IV.Effect of BAT removal on the serum
concentration of CHO, HDL, LDL, TG and GLU in the BAT excision
model. |
Table IV.
Effect of BAT removal on the serum
concentration of CHO, HDL, LDL, TG and GLU in the BAT excision
model.
| Group | CHO, mM | HDL, mM | LDL, mM | TG, mM | GLU, mM |
|---|
| S | 2.19±0.47 | 1.06±0.23 | 0.26±0.07 | 1.37±0.36 | 5.04±1.00 |
| ST | 2.43±0.34 | 0.94±0.09 | 0.26±0.08 |
2.37±0.94a | 5.04±0.94 |
| O | 2.28±0.30 | 1.07±0.13 | 0.21±0.09 | 1.68±0.63 | 5.08±0.90 |
| OT | 2.56±0.41 | 1.08±0.19 | 0.30±0.08 |
3.09±1.06a,b | 6.00±1.23 |
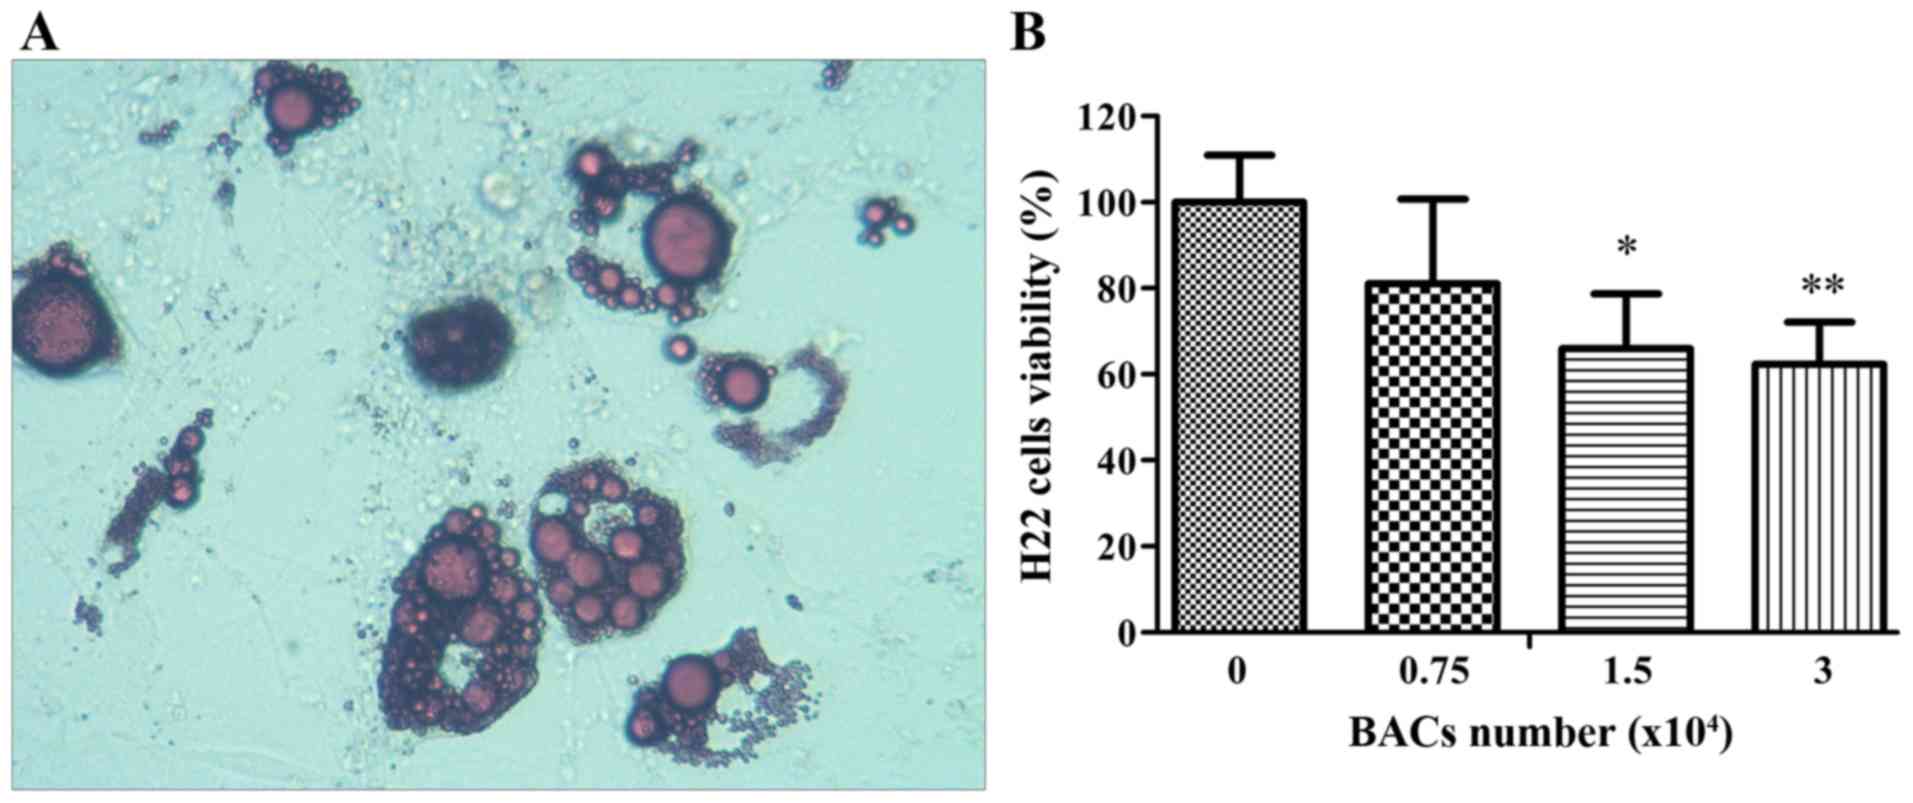
Primary BACs inhibit the viability of
H22 cells and growth of tumors in vitro and in vivo
The aforementioned results indicated an interaction
between H22 and BAT, so an intervention model with primary BACs was
used to investigate the effect of BAT on the growth of H22 cells
and tumors in vitro and in vivo. The mature BACs were
stained with oil red O to validate the primary BACs (Fig. 3A).
As presented in Table
V, the growth of H22 tumors was markedly decreased owing to a
mixture of BACs and H22 ascites in the inoculation suspensions. At
the end of the experiment, the weight of the H22 tumor in the OT
group reached 3.00±0.35 g. When 7×10⁵ and
14×105 BACs were mixed with the H22 inoculation
suspensions, the final tumor weight decreased to 2.17±0.35 and
1.72±0.46 g, respectively. These changes were significant compared
with the OT group with no BACs, which corresponded to inhibition
rates of 27.67 and 42.67%, respectively. However, injecting a
mixture of BACs and H22 cells did not affect liver weight (Table V).
| Table V.Body, liver and tumor weight, and
tumor inhibition rate in the in vivo primary BACs
intervention model. |
Table V.
Body, liver and tumor weight, and
tumor inhibition rate in the in vivo primary BACs
intervention model.
| Group | Body weight, g | Liver weight,
g | Tumor weight,
g | Inhibition rate,
% |
|---|
| OT (no BACs) | 30.74±3.25 | 2.36±0.26 | 3.00±0.35 | − |
| BACs1
(7×10⁵ cells/mouse) | 31.95±2.60 | 2.54±0.29 |
2.17±0.35a | 27.67 |
| BACs2
(14×105 cells/mouse) | 30.92±2.79 | 2.43±0.26 |
1.72±0.46a | 42.67 |
The results of the in vitro experiments are
presented in Fig. 3B. The co-culture
of the primary BACs and H22 cells was used to investigate the
effect of BACs on the viability of H22 cells in vitro. The
initial density of H22 cells was 2×10⁵ cells/ml in the
lower compartment of the chamber, and, after 48 h, the density of
the H22 cells reached 1.65×10⁶ cells/ml in the blank
control. Notably, when primary BACs were injected in the upper
compartment of the chamber, the viability of the H22 cells was
inhibited. The densities of the H22 cells were 134.08, 109.08 and
103.08×10⁴ cells/ml for 7.5×10³,
1.5×10⁴ and 3×10⁴ BACs, respectively,
representing decreases in viability of 18.90, 34.02 and 37.65%,
respectively. Compared with the blank control, there was a
significant difference in cell viability for 1.5×10⁴ and
3×10⁴ BACs (P<0.01).
KEGG analysis of the signaling
pathways in the liver in T and OT groups
From the aforementioned results, it was observed
that BAT affected the growth of H22 tumors and, following H22
injection, the liver weight also changed. Therefore, the changes in
hepatic signaling pathways following the resection of interscapular
BAT and H22 injection were investigated. Tumor, liver and BAT
weights in the five treatment groups (C, T, S, O and OT) were
determined and analyzed. The pattern of the key indicators,
including the weights of the association tissue in serum was
similar to that of the aforementioned results. The weight of the
liver in the T group was significantly greater compared with that
of the C group. The tumor weight of the OT group was larger
compared with that of the T group. The removal of BAT resulted in
an increase in liver weight in the O group. Furthermore, the liver
weight in the OT group was higher compared with that of the O or T
group. The KEGG analysis of gene expression profiles of livers for
the T and OT groups in presented in Fig.
4. Compared with the T group, the cancer-associated central
carbon metabolism (including FGFR1, GLS, NTRK3, PDHA2, SIRT6 and
SLC2A2) was enhanced in the OT group, which may be associated with
tumor growth.
Discussion
Previous studies have identified that WAT is the
major tissue associated with obesity (4), which is associated with an increased
risk of HCC (13,17), and BAT is an effective target for
treating obesity (4). However, to the
best of our knowledge, there has been no published study on the
association between HCC and BAT.
The results of the present study indicate that BAT
and BACs have an inhibitory effect on the viability of H22 cells
and growth of tumors in vitro and in vivo. H22
transplantation led to increased liver weight, decreased BAT weight
in the interscapular region and an increased serum level of TG in
mice. The removal of BAT led to increased growth of H22 tumors,
which was accompanied by a more marked increase in liver weight and
serum level of TG. The primary BACs were able to inhibit the growth
of H22 tumors in vivo. By removing BAT, the effect of
inter-individual variation in the interscapular region was
excluded, and the addition of BACs provided a more conducive
environment for inhibiting the growth of H22 tumors. The primary
BACs also directly limited the viability of H22 cells in the
Transwell chamber for the co-culture assay.
At the beginning of the present study, the H22 mouse
model was used to elucidate the association between HCC and
metabolism. The H22 mouse model was characterized by an increase in
liver weight, a decrease in the weight of BAT and WAT, and an
increase in the serum TG level. The increased liver weight in the T
group was consistent with the results of a previous study (18), which indicated that the injection of
H22 cells markedly increased the liver indices. In this model, it
was demonstrated that the serum TG content was increased following
H22 transplantation, which could be associated with the
downregulation of the fatty acid degradation signaling pathway.
The serum TG level is an important indicator for
monitoring metabolic diseases. Non-alcoholic fatty liver disease is
a common metabolic syndrome and may lead to the development of
cirrhosis, which is a significant risk factor for HCC. Nderitu
et al (19) identified that
the increased TG level was associated with an increased risk of
developing HCC. From pathological tissue biopsy results, the
decrease in the weight of BAT and WAT without histopathological
cell atrophy possibly arose from the decrease in the number of BACs
or cellular contents. Therefore, the H22 mouse model indicated that
HCC exerted a negative effect on BAT, which prompted the
investigation of the role of BAT in HCC. Similar to the gene
knockout method used for investigating gene function, BAT in the
interscapular region was removed to observe the function of BAT in
the growth of H22 tumors in the BAT excision model. The results
indicated that the removal of BAT altered the liver weight and the
serum TG level. Furthermore, the most marked changes in increased
liver weight and serum TG content in the OT group were influenced
by the removal of BAT and by H22 transplantation. Most notably, the
growth of H22 tumors increased in the OT group compared with the ST
group, which indicated that BAT could inhibit the growth of
HCC.
The aforementioned results indicate an association
between HCC and BAT, where HCC promotes the consumption of BAT and
in turn BAT inhibits the growth of HCC. This suggests that BAT can
secrete chemical substances or cytokines that inhibit the growth of
HCC. Chen et al (20,21) and Thomou et al (22) identified that exosomes secreted by BAT
carried miRNAs that regulated other organs and tissues, such as the
liver.
Owing to their accessibility, primary BACs were
separated and used to interfere with the growth of H22 cells and
tumors. The results from the in vitro and in vivo
models support the hypothesis that BACs possess the potential to be
an inhibitor of HCC. Coincidentally, in a study by Boyd et
al (23) on the in vivo
administration of peroxisome-proliferator-activated receptor γ
agonists to promote the proliferation of adipose cells in the bone
marrow, acute myeloid leukemia cells were killed indirectly.
Therefore, a treatment approach involving the culture of BACs on a
large-scale and subsequent injection into patients with HCC was
suggested.
It has been established that obesity is a risk
factor for HCC and the browning of WAT is a possible strategy for
treating obesity. The results of the present study demonstrated
that BAT inhibits the growth of HCC, which further supports the
hypothesis that exercise can decrease the risk of tumor. Overall,
the association between HCC and BAT identified in the present study
is of interest in the field of cancer and metabolism, and further
investigation is required to define the roles of BAT in the growth
of HCC. The unknown functions of BAT should be verified by more
comprehensive experiments. The possibility of BACs as a therapeutic
tool should be confirmed by further studies with HCC animal
models.
Acknowledgements
Not applicable.
Funding
The present study was supported by the National
Natural Science Foundation of China (grant no. 81621064) and CAMS
Innovation Fund for Medical Sciences (CIFMS) (grant no.
2016-I2M-02-002).
Availability of data and materials
The datasets used and/or analyzed during the current
study are available from the corresponding author on reasonable
request.
Authors' contributions
SZC conceived the study and wrote the manuscript.
DL, YL, YS, and WW conducted the animal experiments and YL prepared
pathological section slices. DL conducted the other experiments.
All authors read and approved the final manuscript.
Ethics approval and consent to
participate
All animal experimental procedures were approved by
the Beijing Municipal Science & Technology Commission (Beijing,
China) with the approval number of SYXK (Jing) 2017–0023.
Patient consent for publication
Not applicable.
Competing interests
The authors declare that they have no competing
interests.
References
|
1
|
Bonnot E: The interscapular gland. J Anat
Physiol. 43:43–58. 1908.PubMed/NCBI
|
|
2
|
Truong MT, Erasmus JJ, Munden RF, Marom
EM, Sabloff BS, Gladish GW, Podoloff DA and Macapinlac HA: Focal
FDG uptake in mediastinal brown fat mimicking malignancy: A
potential pitfall resolved on PET/CT. AJR Am J Roentgenol.
183:1127–1132. 2004. View Article : Google Scholar : PubMed/NCBI
|
|
3
|
Nedergaard J, Bengtsson T and Cannon B:
Unexpected evidence for active brown adipose tissue in adult
humans. Am J Physiol Endocrinol Metab. 293:E444–E452. 2007.
View Article : Google Scholar : PubMed/NCBI
|
|
4
|
Virtanen KA, Lidell ME, Orava J, Heglind
M, Westergren R, Niemi T, Taittonen M, Laine J, Savisto NJ,
Enerbäck S and Nuutila P: Functional brown adipose tissue in
healthy adults. N Engl J Med. 360:1518–1525. 2009. View Article : Google Scholar : PubMed/NCBI
|
|
5
|
Cypess AM, Lehman S, Williams G, Tal I,
Rodman D, Goldfine AB, Kuo FC, Palmer EL, Tseng YH, Doria A, et al:
Identification and importance of brown adipose tissue in adult
humans. N Engl J Med. 360:1509–1517. 2009. View Article : Google Scholar : PubMed/NCBI
|
|
6
|
van M, arken Lichtenbelt WD, Vanhommerig
JW, Smulders NM, Drossaerts JM, Kemerink GJ, Bouvy ND, Schrauwen P
and Teule GJ: Cold-activated brown adipose tissue in healthy men. N
Engl J Med. 360:1500–1508. 2009. View Article : Google Scholar : PubMed/NCBI
|
|
7
|
Wu J, Boström P, Sparks LM, Ye L, Choi JH,
Giang AH, Khandekar M, Virtanen KA, Nuutila P, Schaart G, et al:
Beige adipocytes are a distinct type of thermogenic fat cell in
mouse and human. Cell. 150:366–376. 2012. View Article : Google Scholar : PubMed/NCBI
|
|
8
|
Sprinzl MF and Galle PR: Current progress
in immunotherapy of hepatocellular carcinoma. J Hepatol.
66:482–484. 2017. View Article : Google Scholar : PubMed/NCBI
|
|
9
|
Kudo M, Han G, Finn RS, Poon RT, Blanc JF,
Yan L, Yang J, Lu L, Tak WY, Yu X, et al: Brivanib as adjuvant
therapy to transarterial chemoembolization in patients with
hepatocellular carcinoma: A randomized phase III trial. Hepatology.
60:1697–1707. 2014. View Article : Google Scholar : PubMed/NCBI
|
|
10
|
Chuah B, Lim R, Boyer M, Ong AB, Wong SW,
Kong HL, Millward M, Clarke S and Goh BC: Multi-centre phase II
trial of thalidomide in the treatment of unresectable
hepatocellular carcinoma. Acta Oncol. 46:234–238. 2007. View Article : Google Scholar : PubMed/NCBI
|
|
11
|
Cainap C, Qin S, Huang WT, Chung IJ, Pan
H, Cheng Y, Kudo M, Kang YK, Chen PJ, Toh HC, et al: Linifanib
versus Sorafenib in patients with advanced hepatocellular
carcinoma: Results of a randomized phase III trial. J Clin Oncol.
33:172–179. 2015. View Article : Google Scholar : PubMed/NCBI
|
|
12
|
Rahib L, Smith BD, Aizenberg R, Rosenzweig
AB, Fleshman JM and Matrisian LM: Projecting cancer incidence and
deaths to 2030: The unexpected burden of thyroid, liver, and
pancreas cancers in the United States. Cancer Res. 74:2913–2921.
2014. View Article : Google Scholar : PubMed/NCBI
|
|
13
|
Agosti P, Sabbà C and Mazzocca A: Emerging
metabolic risk factors in hepatocellular carcinoma and their
influence on the liver microenvironment. Biochim Biophys Acta Mol
Basis Dis 1864. 607–617. 2018. View Article : Google Scholar
|
|
14
|
Vargas-Castillo A, Fuentes-Romero R,
Rodriguez-Lopez LA, Torres N and Tovar AR: Understanding the
biology of thermogenic fat: Is browning a new approach to the
treatment of obesity? Arch Med Res. 48:401–413. 2017. View Article : Google Scholar : PubMed/NCBI
|
|
15
|
Marko O, Cascieri MA, Ayad N, Strader CD
and Candelore MR: Isolation of a preadipocyte cell line from rat
bone marrow and differentiation to adipocytes. Endocrinology.
136:4582–4588. 1995. View Article : Google Scholar : PubMed/NCBI
|
|
16
|
Gao W, Kong X and Yang Q: Isolation,
primary culture, and differentiation of preadipocytes from mouse
brown adipose tissue. Methods Mol Biol 1566. 3–8. 2017. View Article : Google Scholar
|
|
17
|
Karagozian R, Derdák Z and Baffy G:
Obesity-associated mechanisms of hepatocarcinogenesis. Metabolism.
63:607–617. 2014. View Article : Google Scholar : PubMed/NCBI
|
|
18
|
Shi WR, Liu Y, Wang XT, Huang QY, Cai XR
and Wu SR: Antitumor efficacy and mechanism in hepatoma H22-bearing
mice of brucea javanica oil. Evid Based Complement Alternat Med
2015. 2174942015.
|
|
19
|
Nderitu P, Bosco C, Garmo H, Holmberg L,
Malmström H, Hammar N, Walldius G, Jungner I, Ross P and Van
Hemelrijck M: The association between individual metabolic syndrome
components, primary liver cancer and cirrhosis: A study in the
Swedish AMORIS cohort. Int J Cancer. 141:1148–1160. 2017.
View Article : Google Scholar : PubMed/NCBI
|
|
20
|
Chen Y, Buyel JJ, Hanssen MJ, Siegel F,
Pan R, Naumann J, Schell M, van der Lans A, Schlein C, Froehlich H,
et al: Exosomal microRNA miR-92a concentration in serum reflects
human brown fat activity. Nat Commun. 7:114202016. View Article : Google Scholar : PubMed/NCBI
|
|
21
|
Chen Y and Pfeifer A: Brown fat-derived
exosomes: Small vesicles with big impact. Cell Metab. 25:759–760.
2017. View Article : Google Scholar : PubMed/NCBI
|
|
22
|
Thomou T, Mori MA, Dreyfuss JM, Konishi M,
Sakaguchi M, Wolfrum C, Rao TN, Winnay JN, Garcia-Martin R,
Grinspoon SK, et al: Adipose-derived circulating miRNAs regulate
gene expression in other tissues. Nature. 542:450–455. 2017.
View Article : Google Scholar : PubMed/NCBI
|
|
23
|
Boyd AL, Reid JC, Salci KR, Aslostovar L,
Benoit YD, Shapovalova Z, Nakanishi M, Porras DP, Almakadi M,
Campbell CJV, et al: Acute myeloid leukaemia disrupts endogenous
myelo-erythropoiesis by compromising the adipocyte bone marrow
niche. Nat Cell Biol. 19:1336–1347. 2017. View Article : Google Scholar : PubMed/NCBI
|