Introduction
Renal cell carcinoma (RCC) accounts for 2–3% of
malignant tumors in adults (1).
Notably, clear cell RCC (ccRCC) accounts for 70–85% of kidney
cancer cases with an increasing incidence worldwide (2). Clinically, RCC can be divided into four
stages according to the size of the tumor and extent of invasion
and metastasis. The insidious onset of symptoms usually results in
diagnosis in the first instance at an advanced stage of the disease
(3). Owing to the resistance of
ccRCC to radiotherapy and chemotherapy, the most effective
treatment is radical or partial nephrectomy. However, the mortality
rate of patients with metastatic RCC remains high (4). Targeted therapy with agents such as
sorafenib and sunitinib have been used for metastatic RCC; however,
its curative effects are limited (5). Thus, it is important to identify
biomarkers to aid early diagnosis of RCC and to provide novel
therapeutic targets.
Recently, a number of biomarkers for diagnosis and
prognosis have been found and investigated. For example, the CXC
chemokine receptor 4 (CXCR4), which is one of the most important
markers of cancer stem cells, has been confirmed as a major
chemokine receptor in solid tumors (6). A previous study demonstrated that CXCR4
may predict survival in patients with RCC. High-throughput
sequencing is a common tool used in medical research in numerous
types of cancer concerning early diagnosis, staging, grading and
prognosis (7,8). The use of bioinformatics to screen
high-throughput sequencing allows identification of differentially
expressed genes (DEGs) that may be associated with occurrence and
development of certain diseases. In the present study, a Gene
Expression Omnibus (GEO) dataset was selected and bioinformatics
analysis was performed to identify the DEGs in ccRCC. Subsequently,
the Search Tool for the Retrieval of Interacting Genes (STRING) was
used to construct a protein-protein interaction (PPI) network and
identify the hub genes in ccRCC. DEGs were analyzed to determine
the biological process (BP), molecular function (MF) or cellular
component (CC) associated with the genes using Kyoto Encyclopedia
of Genes and Genomes (KEGG). A total of 15 hub genes were selected
and overall survival analysis was performed to determine the
relationship between each gene and survival of patients with ccRCC.
The aim of the present study was to identify novel biomarkers and
targets for the diagnosis and prognosis of RCC.
Materials and methods
Dataset
Data relevant to RCC was obtained from the GEO
database and the GSE40435 (https://www.ncbi.nlm.nih.gov/geo/query/acc.cgi?acc=GSE40435)
dataset was selected (9). This
dataset was established on a GPL10558 platform. The GSE40435
dataset contains 101 pairs of ccRCC tumors and healthy adjacent
tissue samples (age range, 42–84 years). In this database the basic
information regarding each patient, including age, sex, tumor grade
and type of tissue, is complete.
Differential gene expression
analysis
The online software tool GEO2R (https://www.ncbi.nlm.nih.gov/geo/geo2r/?acc=GSE40435)
was used to analyze the samples in the GSE40435 dataset. Using the
GEO2R software, samples can be divided into two or more groups and
the DEGs can be selected (10). A
total of 202 samples were divided into two groups; the ccRCC tumor
group and the adjacent non-tumor group. The Benjamini-Hochberg
method was used to determine the false discovery rate (11) and the adjusted P-value was used to
reduce the likelihood of false positive errors. The selection
criteria included an adjusted P-value of <0.05 and |log fold
change (FC)|≥1 (12).
Gene Ontology (GO) and KEGG pathway
analysis of DEGs
GO analysis is a valuable approach to annotate genes
and gene products, and assign characteristic biological properties
to high-throughput genomic or transcriptome data (13). KEGG is a database collection which
can be used to analyze genomes, biological pathways, diseases,
chemical substances and drugs (14).
DEGs selected by GEO2R were stratified according to whether they
were upregulated or downregulated. Database for Annotation,
Visualization and Integrated Discovery (DAVID; david.ncifcrf.gov/) was used for annotation of the GO
and KEGG pathway results (15).
P<0.05 was used as a selection criterion for major BPs, MF and
CC.
Establishing the PPI network and
analyzing modules
STRING is an online application for evaluating PPI
networks (16). STRING was used to
map DEGs and identify potential interaction between DEGs. The
selection criteria were: Confidence score ≥0.4 and max number of
interactors to show none/query proteins only (17,18).
Furthermore, the Molecular Complex Detection (MCODE) application in
Cytoscape (version 3.6.1) was applied to select the PPI network
modules, with a cutoff=2, node score cutoff=0.2, k-core=2 and
maximum depth=100 as the selection criteria (18). GO and KEGG pathway analyses of the
selected modules were performed in DAVID to explore potential
information. The network of 15 selected hub genes were visualized
using STRING and the selection criteria were: Confidence score ≥0.4
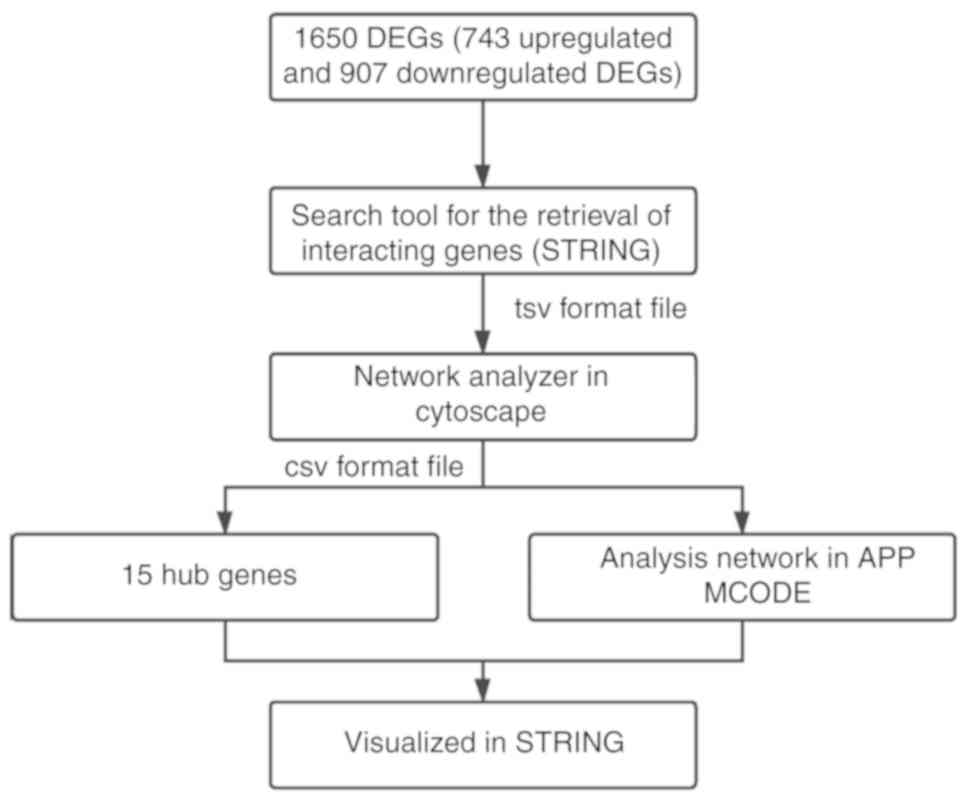
and a maximum number of interactors ≤5. Fig. 1 shows a flow diagram of the
methodology.
Comparing expression and survival
The differential gene expression in patients with
RCC and patients without tumors was investigated using the
standardized output of RNA sequencing data in The Cancer Genome
Atlas and Genotype-Tissue Expression project databases (19). GEPIA was used to determine
differences in the expression of hub genes between RCC tissues and
non-tumorous tissues, and the results were visualized as box plots.
Additionally, the Gene Expression Profiling Interactive Analysis
(GEPIA; gepia.cancer-pku.cn/index.html) also detects changes
in the survival curves caused by hub genes in RCC patients.
University of California Santa Cruz Xena (xena.ucsc.edu/kaplan-survival-analysis/) was used
to perform Kaplan-Meier survival analyses (20). Immunohistochemical data of patients
with RCC and healthy individuals were obtained from the Human
Protein Atlas (HPA) (21) to confirm
the expression levels of the hub genes. For GLDC, the normal tissue
was from a 61-year old man and the tumor was from a 59-years old
woman. For ENO2, the normal tissue was from a 52-years old woman
and the tumor was from a 52-years old woman. The GLDC expression
level, age, sex and tumor stage of the 877 patients (age range,
28–90 years; mean age, 62 years) with renal cancer was obtained
from the HPA (proteinatlas.org/ENSG00000178445-GLDC/pathology/renal+cancer)
to explore the patient characteristics in the glycine decarboxylase
(GLDC) high and GLDC low groups. After removal of incomplete data,
complete information of 840 patients was gathered. Subsequently,
these 840 patients were divided into two groups according to the
level of GLDC expression (n=420 for each group). The relationship
between the expression of GLDC and patient characteristics was then
analyzed using χ2 test.
Gene set enrichment analysis
(GSEA)
RCC samples (n=101) from the GSE40435 dataset were
divided into a high and low expression groups according to the
median expression levels of GLDC and enolase 2 (ENO2). GSEA
(version 3.0; software.broadinstitute.org/gsea/index.jsp) was
used to examine the potential biological functions of GLDC and
ENO2. The reference gene sets were annotated. Gene sets:
c2.cp.kegg.v5.2.symbols.gmt, sets c2.cp.bp. v5.2.symbols.gmt,
setsc2.cp.mf. v5.2.symbols.gmt and sets c2.cp.cc. v5.2.symbols.gmt.
The cut-off criteria were P<0.05 P<0.05, enrichment score
(ES)>0.5 and gene size ≥100 (22,23).
Cell culture and transfection of small
interfering (si)RNA and small activating (sa)RNA
Human RCC cell line 786-O and normal renal tubular
epithelial cell line HK-2 were obtained from The China Center for
Type Culture Collection. The saRNA negative control and siRNA were
purchased from Shanghai GenePharma Co., Ltd., and were used at the
concentration of 40 nM. The siRNAs were transfected into cells
using Lipofectamine® 2000 (Invitrogen, Thermo Fisher
Scientific, Inc.) for 48 h prior to subsequent experimentation.
Cells were cultured at the density of 2×10⁶ cells in
RPMI-1640 media supplemented with 10% FBS (Gibco; Thermo Fisher
Scientific, Inc.), 1% antibiotic solution (penicillin 100 U/ml and
streptomycin 100 g/ml; Beyotime Institute of Biotechnology) at 37°C
with 5% CO2 in a humidified incubator. Before
transfection, 5×10⁴ cells were seeded into 6-well plate.
Sequences for siRNA targeting ENO2 were as follows:
5′-UUCUCUAUGGACAUGAUGGCU-3′ guide, 5′-CCAUCAUGUCCAUAGAGAAGA-3′
passenger. Sequences for saRNA targeting GLDC were as follows:
5′-AGUGUCUUGGUUGAGCGCA-3′ guide; 5′-UGCGCUCAACCAAGACACU-3′
passenger.
Cell proliferation assay
Cell viability was quantitatively evaluated using a
Cell Counting kit-8 (CCK-8; Beyotime Institute of Biotechnology).
After transfection by siRNA, saRNA and negative control, a total of
7×10³ RCC cells/well were seeded into 96-well plates and
exposed to a combination of different conditions. CCK-8 solution
(10 µl) was added to each well for 2 h at 37°C, after which the
optical density was estimated by measuring the absorbance at 450 nm
using a microplate reader (Victor 3 1420 Multilabel Counter;
PerkinElmer, Inc.).
Western blotting
RCC cells were cultured in 6-well plates for 48 h
and transfected with siRNA or shRNA. Cells were lysed with RIPA
buffer containing protease inhibitors (Beyotime Institute of
Biotechnology. A bicinchoninic acid protein assay kit (Beyotime
Institute of Biotechnology) was used to determine the concentration
of protein. Proteins (25 µg) were separated by 10% SDS-PAGE and
subsequently transferred to PVDF membranes (EMD Millipore). The
membranes were blocked in 5% non-fat dry milk in TBS. Subsequently,
the membranes were incubated with a rabbit or mouse primary
antibody against GLDC (1:1,000; Abcam; cat. no. ab232989), ENO2
(1:1,000; Abcam; cat. no. ab189891), Bax (1:1,000; Abcam; cat. no.
ab32503) and Bcl-2 (1:1,000; Abcam; cat. no. ab32124) at 4°C
overnight. After washing with TBS-Tween 20 three times (10
min/wash), the membranes were incubated with the relevant secondary
antibody for 1 h at room temperature, followed by three washes with
TBS-Tween 20 in the dark. The membranes were scanned using a
two-color Odyssey infrared imaging system (LI-COR Biosciences).
Protein expression levels were normalized to those of GAPDH from
the same membrane. Densitometry analysis was performed using ImageJ
software (version 1.52r; National Institutes of Health).
Annexin
V-phycoerythrin/7-aminoactinomycin D (Annexin V-PE/7-AAD) double
staining assay for apoptosis
The Annexin V-PE/7-AAD kit (MultiSciences) and
Annexin-V-FITC/PI kit (BD Biosciences) were used to quantify the
percentage of apoptotic cells using a flow cytometer (FACSCalibur;
BD Biosciences). FlowJo v10.6.1 software (FlowJo, LLC) was used for
analysis. Cells were seeded into 6-well plates after being
transfected for 48 h with siRNA or saRNA, NC and control. Adherent
cells were collected and co-stained with 5 µl Annexin V-PE and 5 µl
7-AAD for 15 min at room temperature in the dark prior to flow
cytometry analysis. Live cells were cells fluorescing positively
for both PE and 7-AAD negative, early apoptotic cells were cells
fluorescing with PE alone, necrotic cells did not show fluorescence
for either fluorophore and late apoptotic and dead cells showed
7-AAD fluorescence alone.
Hoechst 33258 apoptosis assay
Hoechst 33258 Staining kit (Beyotime Institute of
Biotechnology) was used to detect apoptotic morphological features.
A total of 1×10⁵ cells/well in the exponential growth
phase were seeded into a 6-well plate. Cells were cultured for 24 h
and stained with Hoechst 33258 at room temperature for 15 min.
Apoptotic morphological features (chromatin condensation, nuclear
fragmentation) were observed and captured using a fluorescent
microscope (BX51; Olympus Corporation; magnification, ×200).
Statistical analysis
Data analysis was performed in GraphPad prism
version (GraphPad Software, Inc.). Data are presented as the mean ±
standard error of mean of 3 repeats. An ANOVA with a post-hoc
Tukey's test was used to compare the differences between multiple
groups. P<0.05 was considered to indicate a statistically
significant difference.
Results
DEGs and hub genes
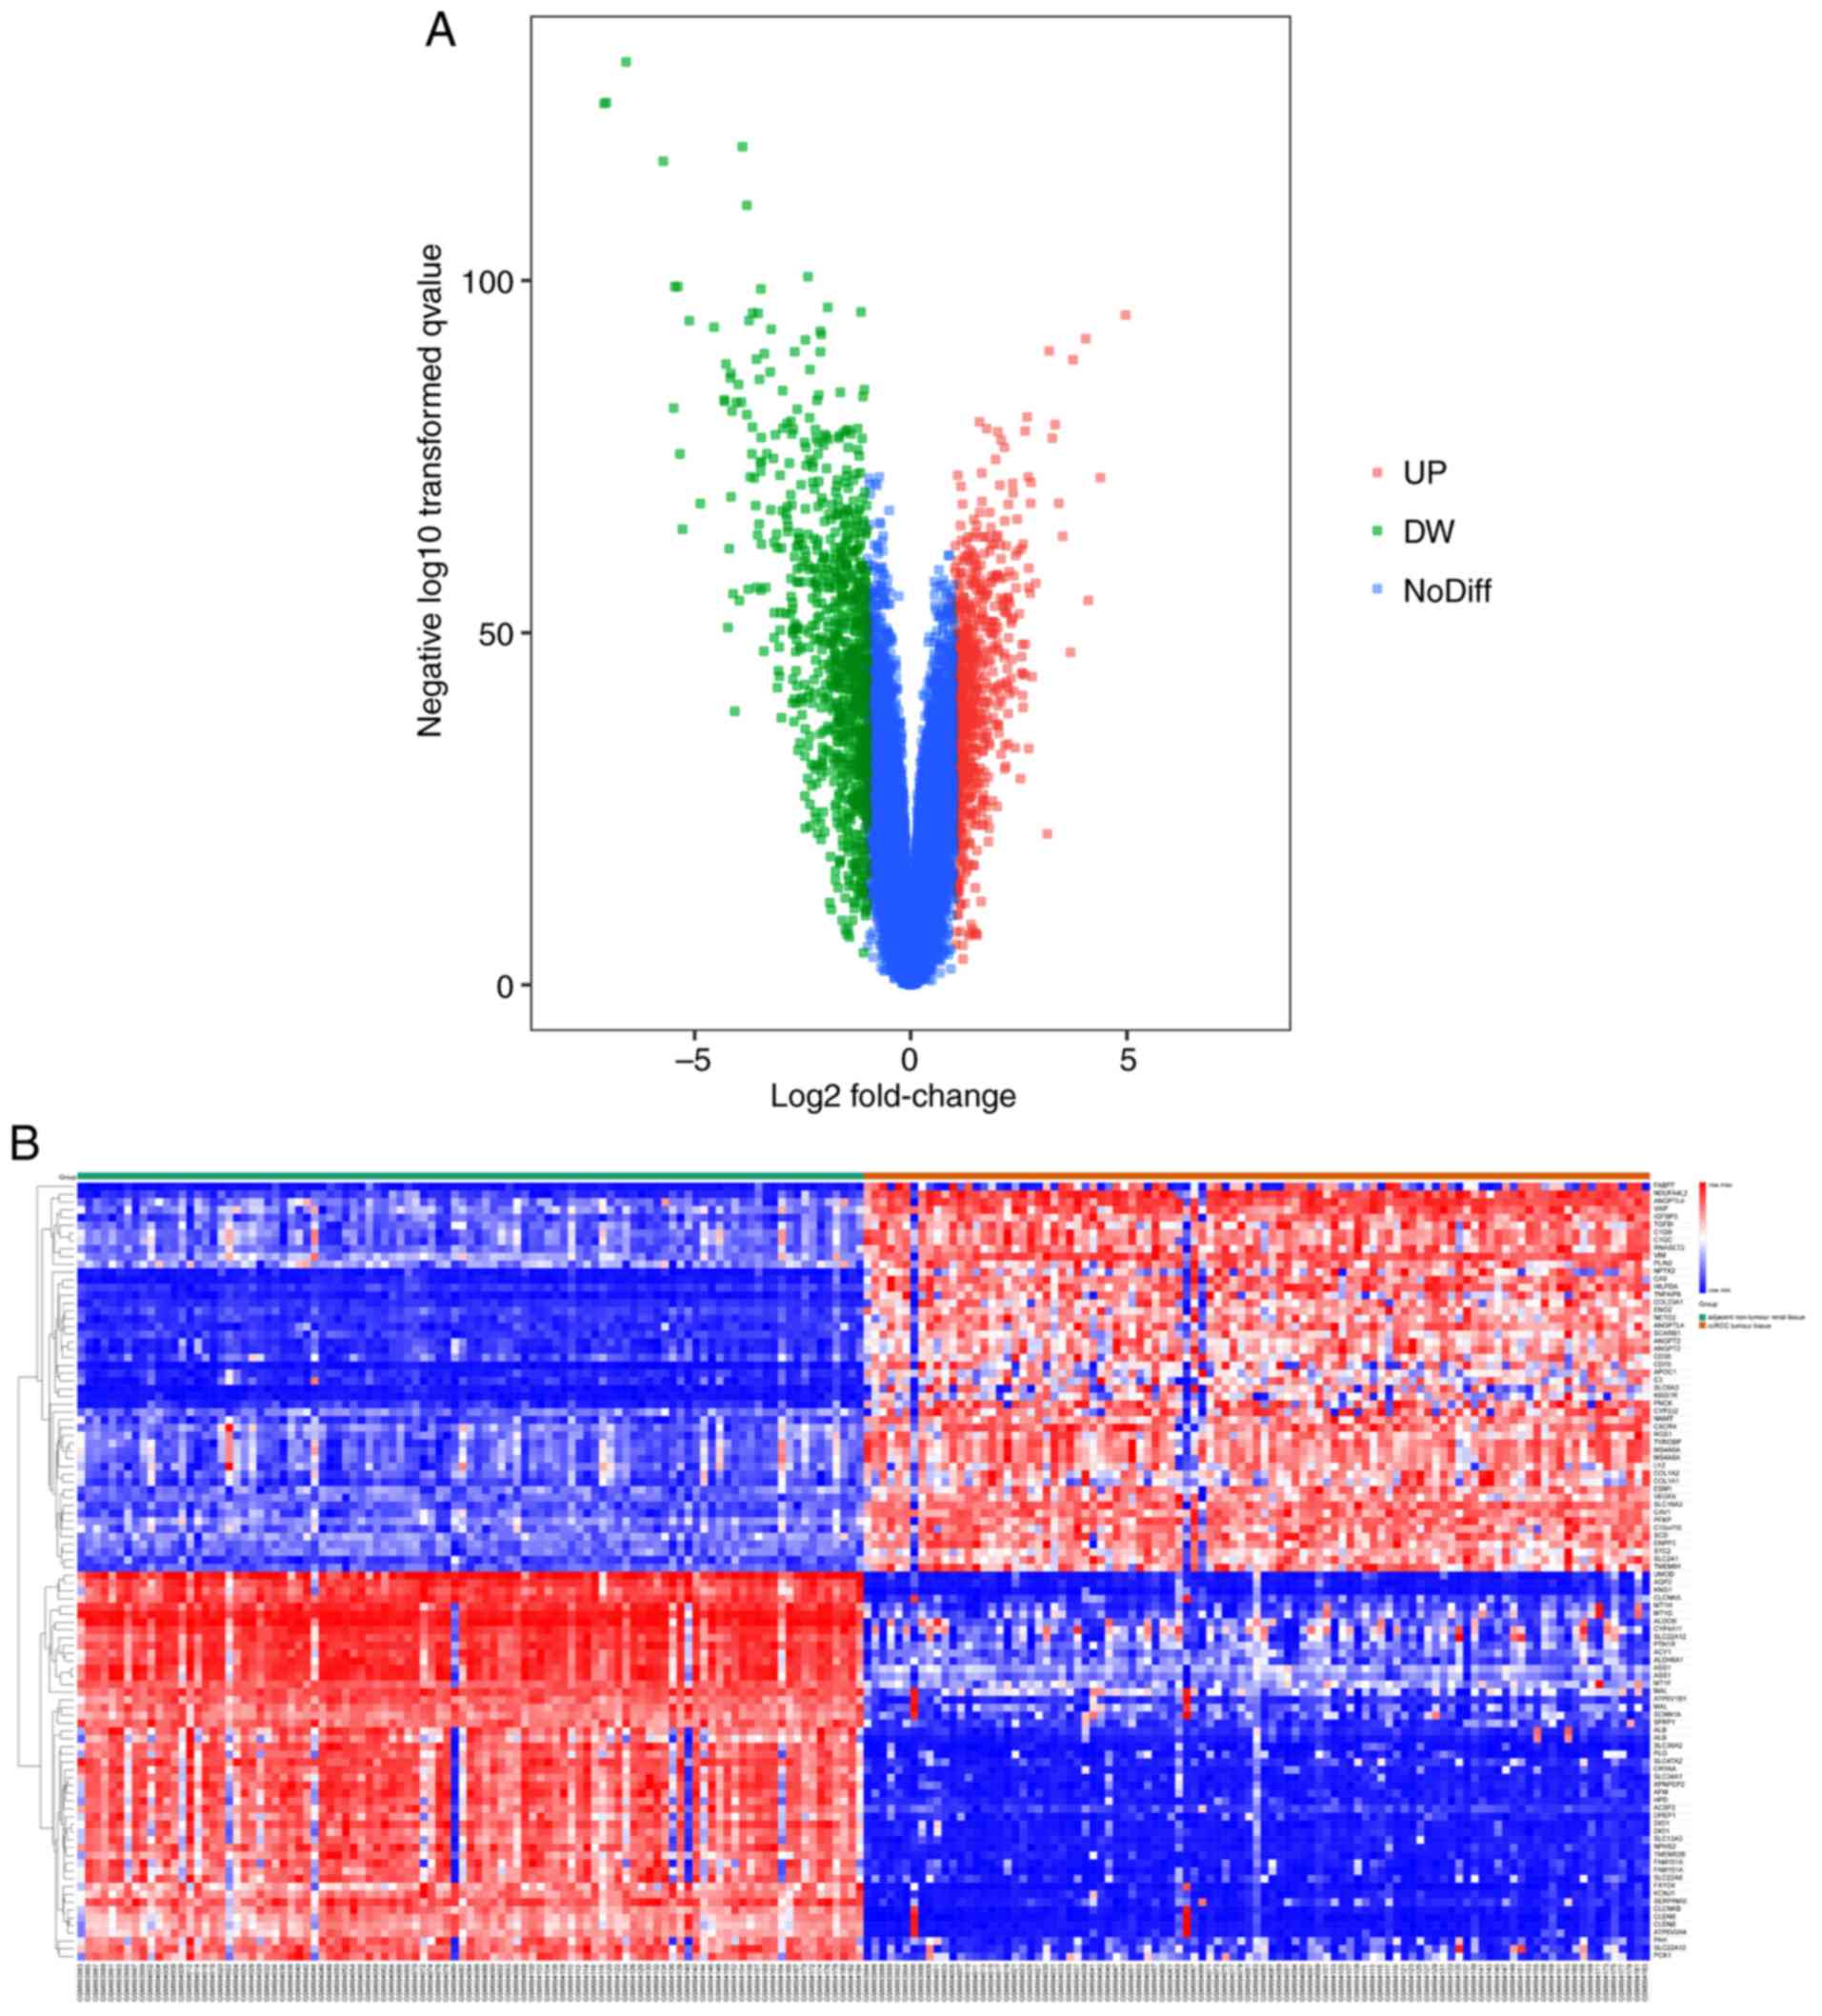
The GSE40435 dataset contains 202 samples, including
101 pairs of ccRCC tumors and adjacent healthy tissue. A total of
1,650 DEGs (743 upregulated and 907 downregulated) were selected.
The volcano map (Fig. 2A) and the
heat map (Fig. 2B) graphically
visualize the selected DEGs with P<0.05 and |log FC|≥1.
Subsequently, the 15 most relevant hub genes were selected
according to the degree of connectivity in PPI networks (Table I).
 | Table I.Top 15 hub genes with highest degree
of connectivity. |
Table I.
Top 15 hub genes with highest degree
of connectivity.
| Gene | Degree of
connectivity | Adjusted
P-value |
|---|
| ALB | 222 |
3.05×10−56 |
| VEGFA | 150 |
1.39×10−58 |
| TOP2A | 141 |
5.15×10−53 |
| EGFR | 114 |
2.73×10⁻³² |
| EGF | 111 |
5.01×10−60 |
| EHHADH | 102 |
7.34×10⁻¹⁷ |
| MYC | 100 |
2.62×10−49 |
| CD44 | 97 |
6.41×10⁻³⁰ |
| GLDC | 95 |
1.37×10−67 |
| ALDH7A1 | 84 |
3.05×10−52 |
| ENO2 | 83 |
7.62×10−73 |
| CSF1R | 81 |
1.43×10−43 |
| ALDH3A2 | 81 |
8.34×10⁻²⁹ |
| ALDH1B1 | 79 |
1.89×10−49 |
| ALDH4A1 | 79 |
4.13×10−56 |
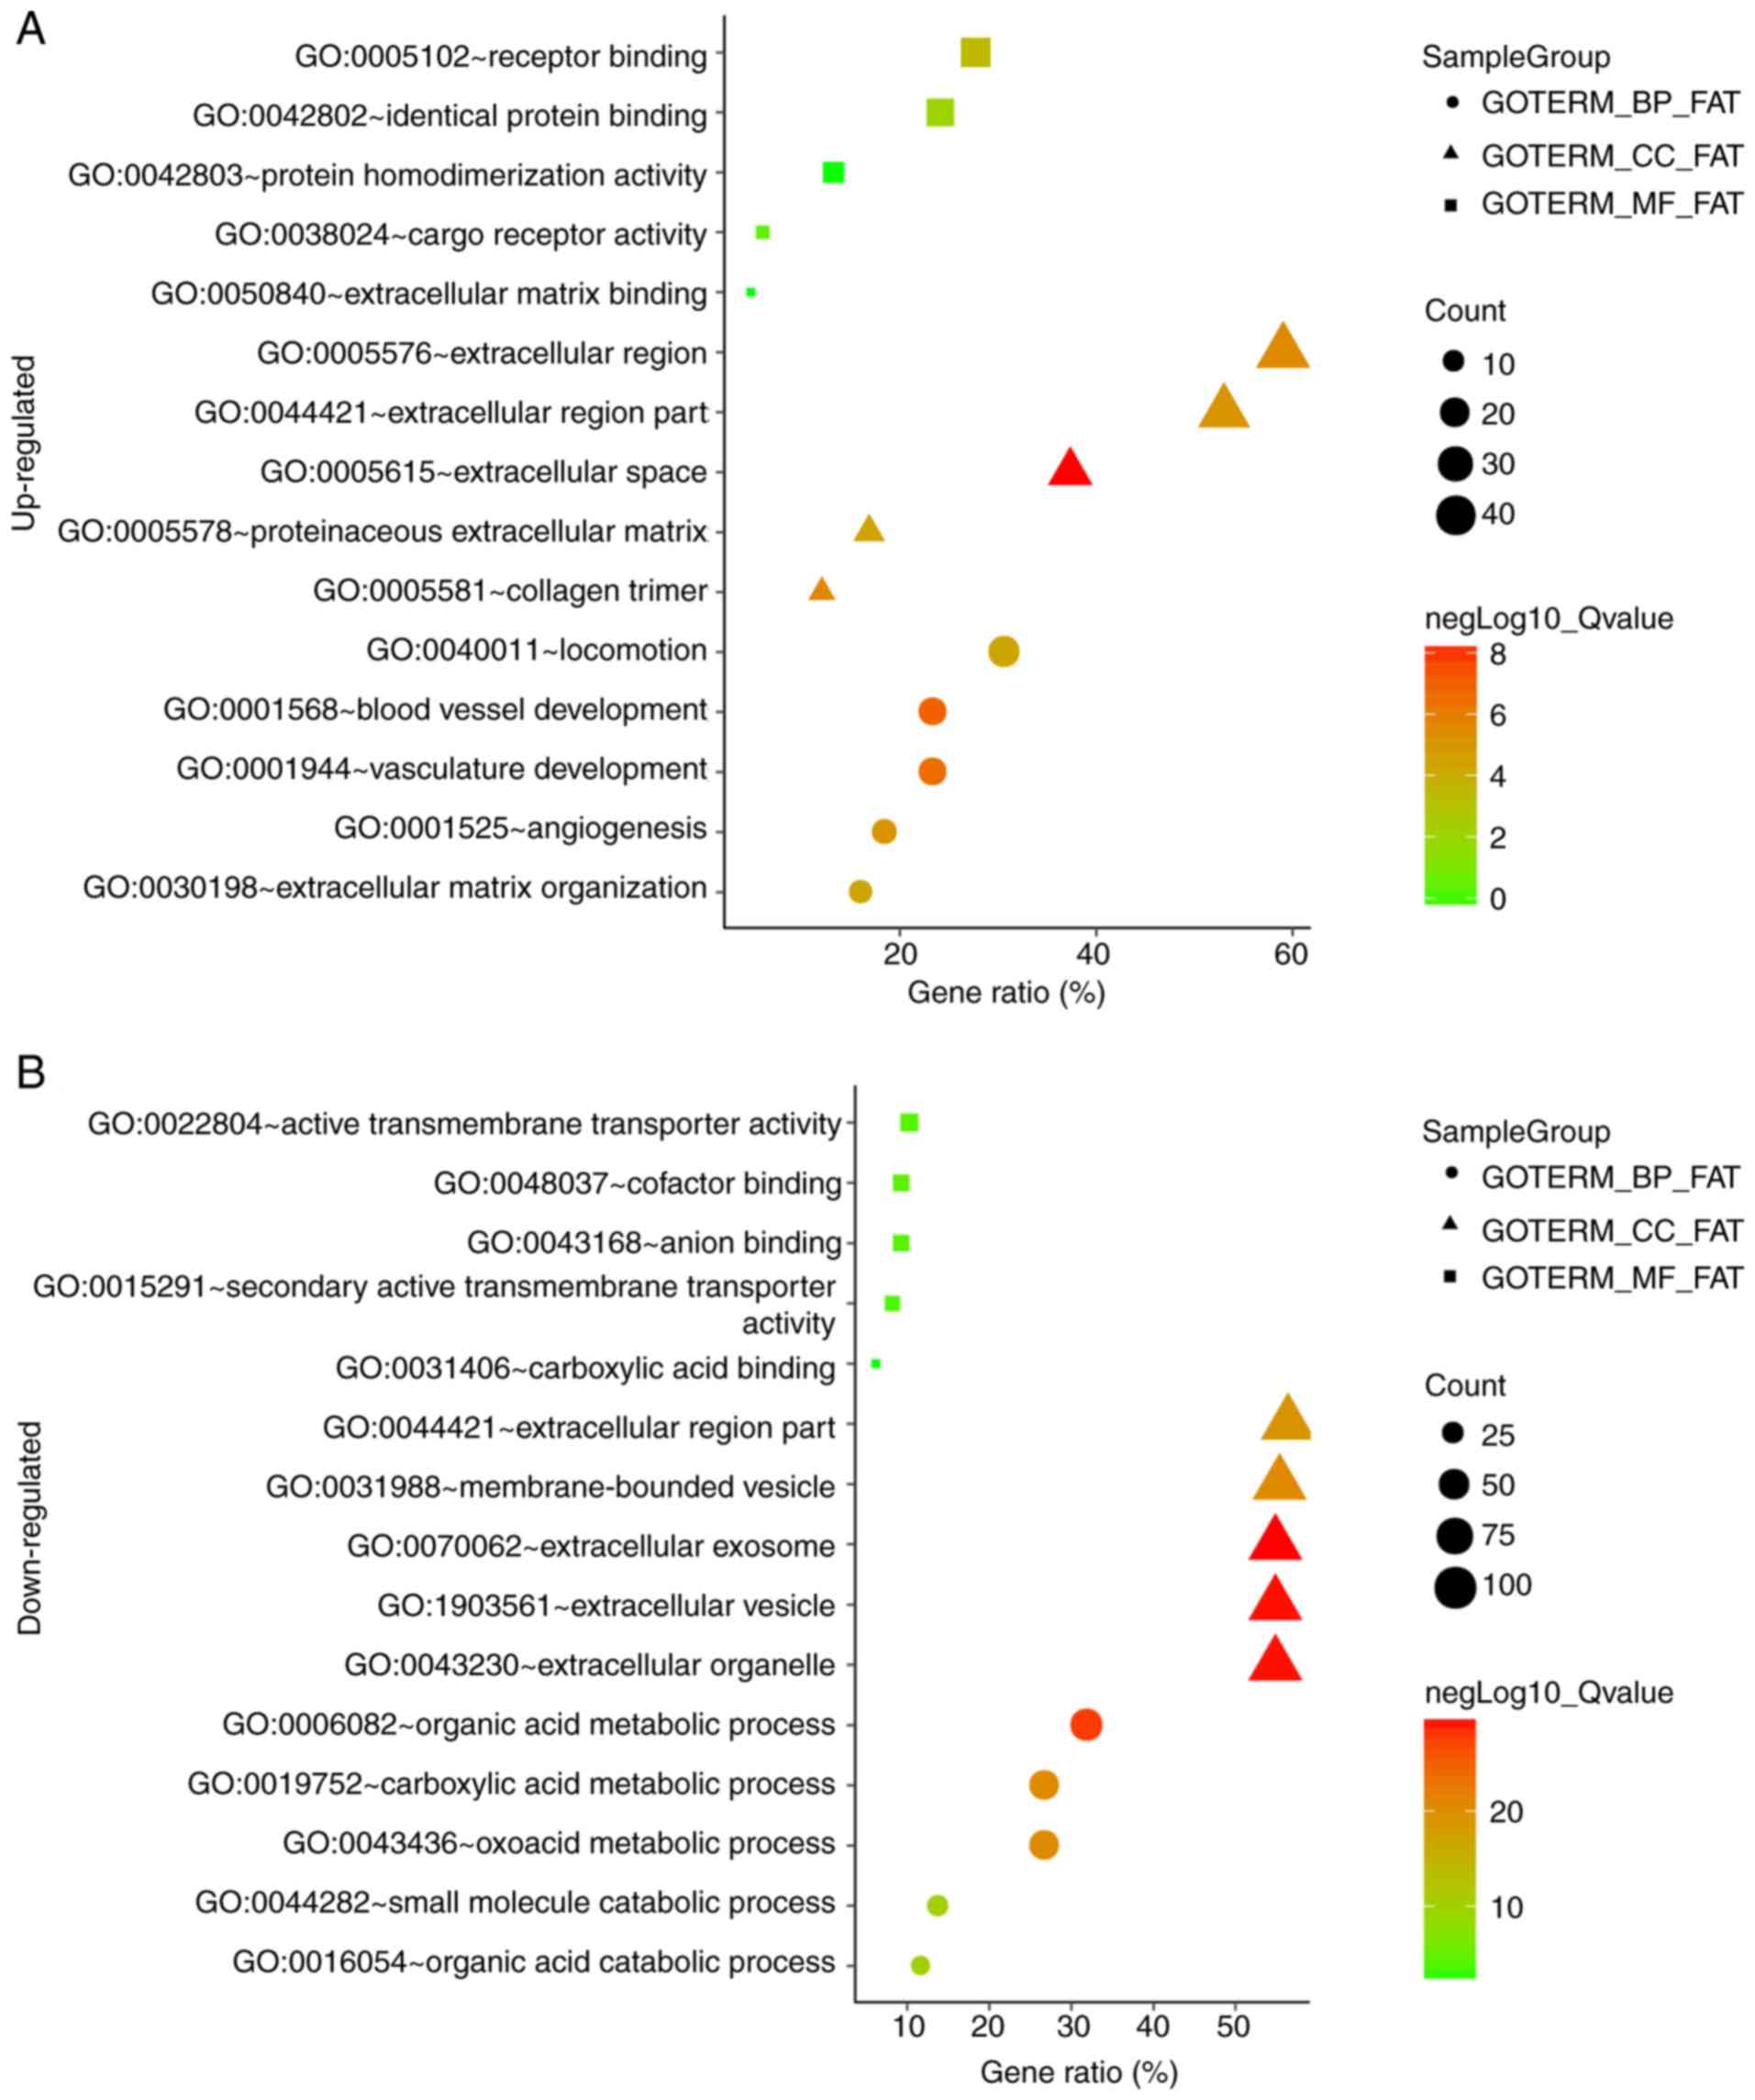
GO and KEGG pathway enrichment
analyses
GO and KEGG pathway enrichment analyses were
performed by inputting upregulated and downregulated DEGs into
DAVID to determine their relationship and study the functions of
the DEGs (Fig. 3). Fig. 3A and B show the results of GO
enrichment analysis. The upregulated DEGs were enriched in BPs,
including ‘blood vessel development’, ‘vasculature development’,
‘angiogenesis’, ‘locomotion’ and ‘extracellular matrix
organization’. The downregulated DEGs were enriched in BPs,
including ‘organic acid metabolic process’, ‘carboxylic acid
metabolic process’, ‘oxoacid metabolic process’, ‘organic acid
catabolic process’ and ‘small molecule catabolic process’. For MF,
the upregulated DEGs were primarily enriched in ‘receptor binding’,
‘identical protein binding’, ‘cargo receptor activity’, ‘protein
homodimerization activity’ and ‘extracellular matrix binding’. The
downregulated DEGs were enriched in ‘cofactor binding’, ‘anion
binding’, ‘active transmembrane transporter activity’, ‘secondary
active transmembrane transporter activity’ and ‘carboxylic acid
binding’ (Table II). For CC, the
upregulated DEGs were enriched in ‘extracellular space’, ‘collagen
trimer’, ‘extracellular region’, ‘extracellular region part’ and
‘proteinaceous extracellular matrix’. Downregulated DEGs were
enriched in ‘extracellular exosome’, ‘extracellular vesicle’,
‘extracellular organelle’, ‘membrane-bounded vesicle’ and
‘extracellular region part’ (Table
II).
| Table II.Gene ontology analysis of
differentially expressed genes associated with renal cell
carcinoma. |
Table II.
Gene ontology analysis of
differentially expressed genes associated with renal cell
carcinoma.
| A, Upregulated
genes |
|---|
|
|---|
| Category | Count | Ratio | P-value | FDR |
|---|
| BP |
|
|
|
|
|
GO:0001568-blood vessel
development | 19 | 22.89157 |
5.91×10⁻¹¹ |
1.05×10−07 |
|
GO:0001944-vasculature
development | 19 | 22.89157 |
1.50×10⁻¹⁰ |
2.68×10−07 |
|
GO:0001525-angiogenesis | 15 | 18.07229 |
3.79×10−09 |
6.76×10−06 |
|
GO:0040011-locomotion | 25 | 30.12048 |
2.81×10−08 |
5.02×10−05 |
|
GO:0030198-extracellular
matrix organization | 13 | 15.66265 |
2.94×10−08 |
5.23×10−05 |
| CC |
|
|
|
|
|
GO:0005615-extracellular
space | 31 | 37.3494 |
2.51×10⁻¹² |
3.19×10−09 |
|
GO:0005581-collagen
trimer | 10 | 12.04819 |
1.94×10−09 |
2.47×10−06 |
|
GO:0005576-extracellular
region | 49 | 59.03614 |
2.58×10−09 |
3.29×10−06 |
|
GO:0044421-extracellular
region part | 44 | 53.01205 |
6.54×10−09 |
8.32×10−06 |
|
GO:0005578-proteinaceous
extracellular matrix | 14 | 16.86747 |
2.49×10−08 |
3.17×10−05 |
| MF |
|
|
|
|
|
GO:0005102-receptor
binding | 23 | 27.71084 |
3.23×10−07 |
4.53×10−04 |
|
GO:0042802-identical protein
binding | 20 | 24.09639 |
7.57×10−06 | 0.010638 |
|
GO:0038024-cargo receptor
activity | 5 | 6.024096 |
2.81×10−04 | 0.39348 |
|
GO:0042803-protein
homodimerization activity | 11 | 13.25301 | 0.001746 | 2.425067 |
|
GO:0050840-extracellular
matrix binding | 4 | 4.819277 | 0.001839 | 2.551809 |
|
| B,
Downregulated |
|
|
Category | Count | Ratio | P-value | FDR |
| CC |
|
|
|
|
|
GO:0070062-extracellular
exosome | 107 | 54.87179 |
3.25×10⁻³³ |
4.34×10⁻³⁰ |
|
GO:1903561-extracellular
vesicle | 107 | 54.87179 |
5.11×10⁻³³ |
6.83×10⁻³⁰ |
|
GO:0043230-extracellular
organelle | 107 | 54.87179 |
5.27×10⁻³³ |
7.06×10⁻³⁰ |
|
GO:0031988-membrane-bounded
vesicle | 108 | 55.38462 |
2.53×10⁻²⁴ |
3.39×10⁻²¹ |
|
GO:0044421-extracellular
region part | 110 | 56.41026 |
5.33×10⁻²³ |
7.13×10⁻²⁰ |
| MF |
|
|
|
|
|
GO:0048037-cofactor
binding | 18 | 9.230769 |
1.71×10−08 |
2.57×10−05 |
|
GO:0043168-anion binding | 18 | 9.230769 |
2.91×10−08 |
4.37×10−05 |
|
GO:0022804-active
transmembrane transporter activity | 20 | 10.25641 |
4.68×10−08 |
7.04×10−05 |
|
GO:0015291-secondary active
transmembrane transporter activity | 16 | 8.205128 |
8.44×10−08 |
1.27×10−04 |
|
GO:0031406-carboxylic acid
binding | 12 | 6.153846 |
3.06×10−06 | 0.004593 |
The upregulated DEGs were enriched in ‘Focal
adhesion’, the ‘PI3K-Akt signaling pathway’, ‘ECM-receptor
interaction’, the HIF-1 signaling pathway’ and ‘Staphylococcus
aureus infection’. The downregulated DEGs were enriched in
‘Metabolic pathways’, ‘Biosynthesis of antibiotics’, ‘Glycine,
serine and threonine metabolism’, ‘Mineral absorption’ and
‘Aldosterone-regulated sodium reabsorption’ (Fig. 3C; Table
III).
| Table III.Kyoto Encyclopedia of Genes and
Genomes pathway analysis of differentially expressed genes
associated with renal cell carcinoma. |
Table III.
Kyoto Encyclopedia of Genes and
Genomes pathway analysis of differentially expressed genes
associated with renal cell carcinoma.
| A, Upregulated |
|---|
|
|---|
| Term | Count | Ratio | P-value | Genes | False discovery
rate |
|---|
| hsa04510: Focal
adhesion | 9 | 10.84337 |
1.15×10−04 | CAV2, VWF, LAMA4,
CAV1, PGF, VEGFA, COL1A2, COL1A1, BIRC3 | 0.133554 |
| hsa04151: PI3K-Akt
signaling pathway | 9 | 10.84337 | 0.003446 | VWF, LAMA4, PGF,
VEGFA, COL1A2, COL1A1, ANGPT2, MYC, DDIT4 | 3.92945 |
| hsa04512:
ECM-receptor interaction | 5 | 6.024096 | 0.003733 | VWF, LAMA4, CD36,
COL1A2, COL1A1 | 4.250896 |
| hsa04066: HIF-1
signaling pathway | 5 | 6.024096 | 0.005709 | VEGFA, SLC2A1,
ENO2, ANGPT2, TIMP1 | 6.433293 |
| hsa05150:
Staphylococcus aureus infection | 4 | 4.819277 | 0.007211 | C1QB, C3, ITGB2,
C1QC | 8.060809 |
|
| B,
Downregulated |
|
| Term | Count | Ratio,
% | P-value | Genes | False discovery
rate |
|
| hsa01130:
Biosynthesis of antibiotics | 16 | 8.205128 |
1.74×10−06 | ACY1, ASS1, SUCLG1,
ALDOB, OGDHL, FBP1, ECHS1, PCK2, AGXT, PCK1, GLDC, HMGCS2, HAO2,
PSAT1, HADH, ACAA1 | 0.002068 |
| hsa00260: Glycine,
serine and threonine metabolism | 8 | 4.102564 |
2.75×10−06 | CHDH, GATM, BHMT,
AGXT2, PSAT1, AGXT, PIPOX, GLDC | 0.003272 |
| hsa04978: Mineral
absorption | 8 | 4.102564 |
8.70×10−06 | FXYD2, MT1A, MT1E,
ATP1A1, MT1H, MT1X, MT1G, MT1F | 0.01035 |
| hsa04960:
Aldosterone-regulated sodium reabsorption | 7 | 3.589744 |
3.70×10−05 | FXYD2, FXYD4,
HSD11B2, ATP1A1, SCNN1G, SCNN1A, KCNJ1 | 0.044004 |
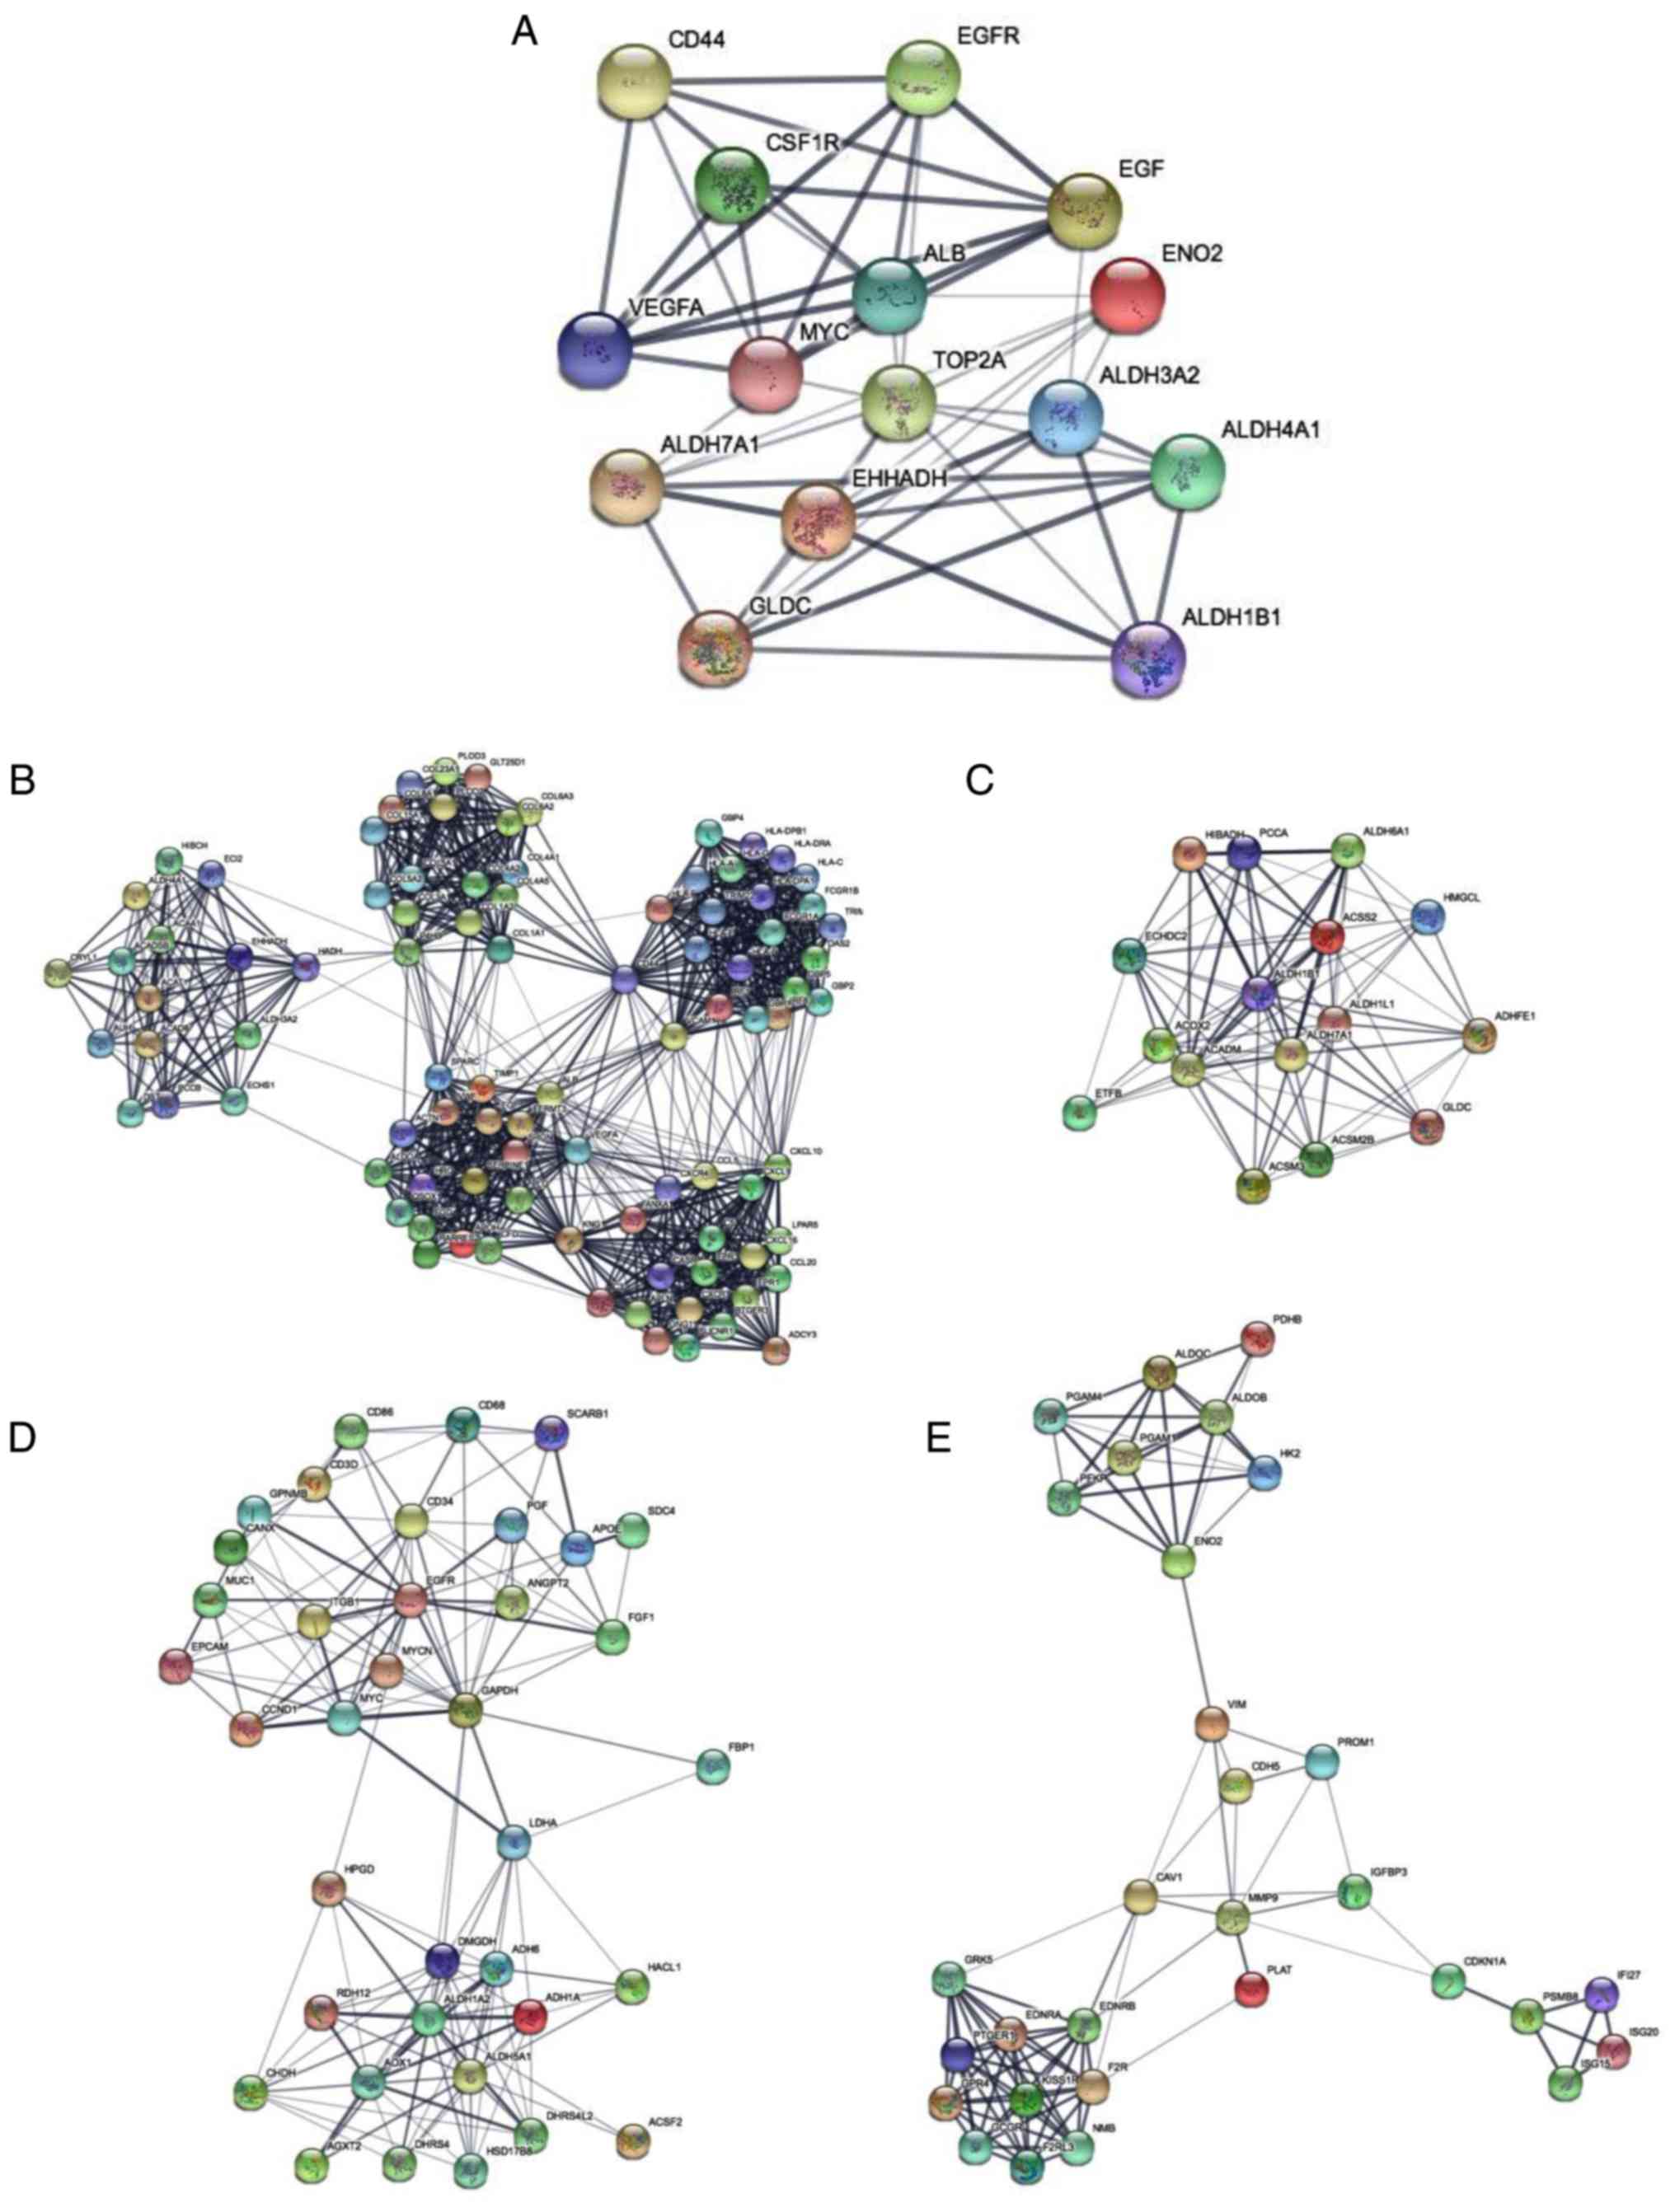
Screening hub genes and three modules
from the PPI network
The PPI network constructed using hub genes revealed
the correlation between DEGs, where hub genes with higher degrees
of correlation were detected using Cytoscape. The following hub
genes were selected: Albumin; vascular endothelial growth factor-A;
topoisomerase II a; epidermal growth factor receptor (EGFR); EGF;
enoyl-CoA hydratase and 3-hydroxyacyl CoA dehydrogenase; MYC; CD44;
GLDC; aldehyde dehydrogenase 7 family member A1; ENO2; colony
stimulating factor 1 receptor; aldehyde dehydrogenase 3 family
member A2; aldehyde dehydrogenase 1 family member B1; and aldehyde
dehydrogenase 4 family member A1. Subsequently, a PPI network of
the 15 most relevant hub genes was constructed (Fig. 4A) and the top four modules were
identified using the MCODE application in Cytoscape (Fig. 4B-E). These four modules were
associated with valine, leucine and isoleucine degradation, retinol
metabolism, glycolysis and gluconeogenesis (Table IV).
| Table IV.Enriched pathways of the top 4
modules from the protein-protein interaction network. |
Table IV.
Enriched pathways of the top 4
modules from the protein-protein interaction network.
| A, Module 1 |
|---|
|
|---|
| Term | P-value | FDR | Genes |
|---|
| Valine, leucine and
isoleucine degradation |
6.66×10⁻¹³ |
7.95×10⁻¹⁰ | DBT, ACADSB,
EHHADH, ECHS1, ACAD8, HIBCH, HADH, ACAT1, PCCB, ALDH3A2, ACAA1,
AUH |
| Staphylococcus
aureus infection |
9.85×10⁻¹¹ |
1.18×10−07 | FGG, C3, FCGR1A,
C5, FPR1, FPR3, HLA-DPA1, HLA-DPB1, CFD, PLG, HLA-DRA |
| ECM-receptor
interaction |
7.80×10⁻¹⁰ |
9.32×10−07 | VWF, COL4A2,
COL4A1, CD44, COL3A1, COL6A3, COL1A2, COL6A2, COL1A1, COL5A2,
COL5A1, COL4A5 |
| Graft-versus-host
disease |
8.35×10⁻¹⁰ |
9.98×10−07 | HLA-A, HLA-C,
HLA-DPA1, HLA-B, HLA-DPB1, HLA-E, HLA-G, HLA-DRA, HLA-F |
| Allograft
rejection |
2.25×10−09 |
2.69×10−06 | HLA-A, HLA-C,
HLA-DPA1, HLA-B, HLA-DPB1, HLA-E, HLA-G, HLA-DRA, HLA-F |
|
| B, Module
2 |
|
| Term | P-Value | FDR | Genes |
|
| Valine, leucine and
isoleucine degradation |
1.75×10⁻¹¹ |
1.45×10−08 | ALDH6A1, ALDH7A1,
ACADM, ALDH1B1, HIBADH, HMGCL, PCCA |
| Metabolic
pathways |
3.41×10−08 |
2.83×10−05 | ACSM3, ACOX2,
ALDH6A1, ALDH7A1, ACADM, ALDH1B1, ACSS2, HIBADH, HMGCL, PCCA,
GLDC |
| Biosynthesis of
antibiotics |
6.42×10−06 | 0.005321 | ALDH7A1, ACADM,
ALDH1B1, ACSS2, PCCA, GLDC |
| Propanoate
metabolism |
7.19×10−06 | 0.005954 | ALDH6A1, ACADM,
ACSS2, PCCA |
| beta-Alanine
metabolism |
1.08×10−05 | 0.008986 | ALDH6A1, ALDH7A1,
ACADM, ALDH1B1 |
|
|
|
|
|
| C, Module
3 |
|
| Term | P-Value | FDR | Genes |
|
| Retinol
metabolism |
4.18×10−06 | 0.004763 | RDH12, ALDH1A2,
DHRS4, AOX1, ADH6, ADH1A |
| Glycolysis /
Gluconeogenesis |
5.31×10−04 | 0.602677 | LDHA, FBP1, ADH6,
ADH1A, GAPDH |
| Metabolic
pathways | 0.001785 | 2.014139 | CHDH, LDHA,
ALDH5A1, FBP1, ADH6, ADH1A, RDH12, ALDH1A2, DHRS4, AOX1, DMGDH,
AGXT2, GAPDH, HSD17B8 |
| PI3K-Akt signaling
pathway | 0.003875 | 4.325624 | EGFR, CCND1, PGF,
FGF1, ANGPT2, ITGB1, MYC |
| Proteoglycans in
cancer | 0.012514 | 13.36304 | EGFR, CCND1, SDC4,
ITGB1, MYC |
|
| D, Module
4 |
|
| Term | P-Value | FDR | Genes |
|
|
Glycolysis/Gluconeogenesis |
5.96×10−08 |
6.07×10−05 | ALDOC, ALDOB,
PGAM1, HK2, PFKP, ENO2, PDHB |
| Carbon
metabolism |
1.98×10−06 | 0.002013 | ALDOC, ALDOB,
PGAM1, HK2, PFKP, ENO2, PDHB |
| Biosynthesis of
antibiotics |
7.50×10−05 | 0.076404 | ALDOC, ALDOB,
PGAM1, HK2, PFKP, ENO2, PDHB |
| Biosynthesis of
amino acids |
1.18×10−04 | 0.119904 | ALDOC, ALDOB,
PGAM1, PFKP, ENO2 |
| Fructose and
mannose metabolism |
1.64×10−04 | 0.167132 | ALDOC, ALDOB, HK2,
PFKP |
Differential expression and survival
curves of hub genes
The GEPIA online tool revealed the upregulated and
downregulated expression of genes between RCC and non-tumorous
tissues (Fig. 5A and B). Expression
levels of GLDC mRNA were significantly decreased in RCC compared
with normal tissues (Fig. 5A),
whereas ENO2 mRNA expression levels were significantly increased in
renal carcinoma compared with normal tissues (Fig. 5B). In addition, immunohistochemical
data of patients with RCC and normal patients were analyzed using
HPA, and the results demonstrated that GLDC expression was low in
tumor whereas ENO2 expression was high in tumor (Fig. 5C and D). KM survival curves indicated
that GLDC may inhibit tumor development and ENO2 may promote tumor
progression (Fig. 5E and F). GEPIA
and UCSC Xena were performed, demonstrating that low expression
levels of GLDC in RCC was associated with a less favorable
prognosis (P=0.0082 and P=0.02541, respectively). Analyses of ENO2
revealed that high expression levels of ENO2 was associated with
poor prognosis (GEPIA, P=0.02; UCSC Xena, P=0.01375). CIs and
log-rank P-value were calculated as shown in the plot (Fig. 5E and F). The relationship between the
expression levels of GLDC and patient characteristics were
analyzed, demonstrating that GLDC expression levels are
significantly associated with patient age and disease stage,
whereas no significant difference in terms of sex were observed
(Table V).
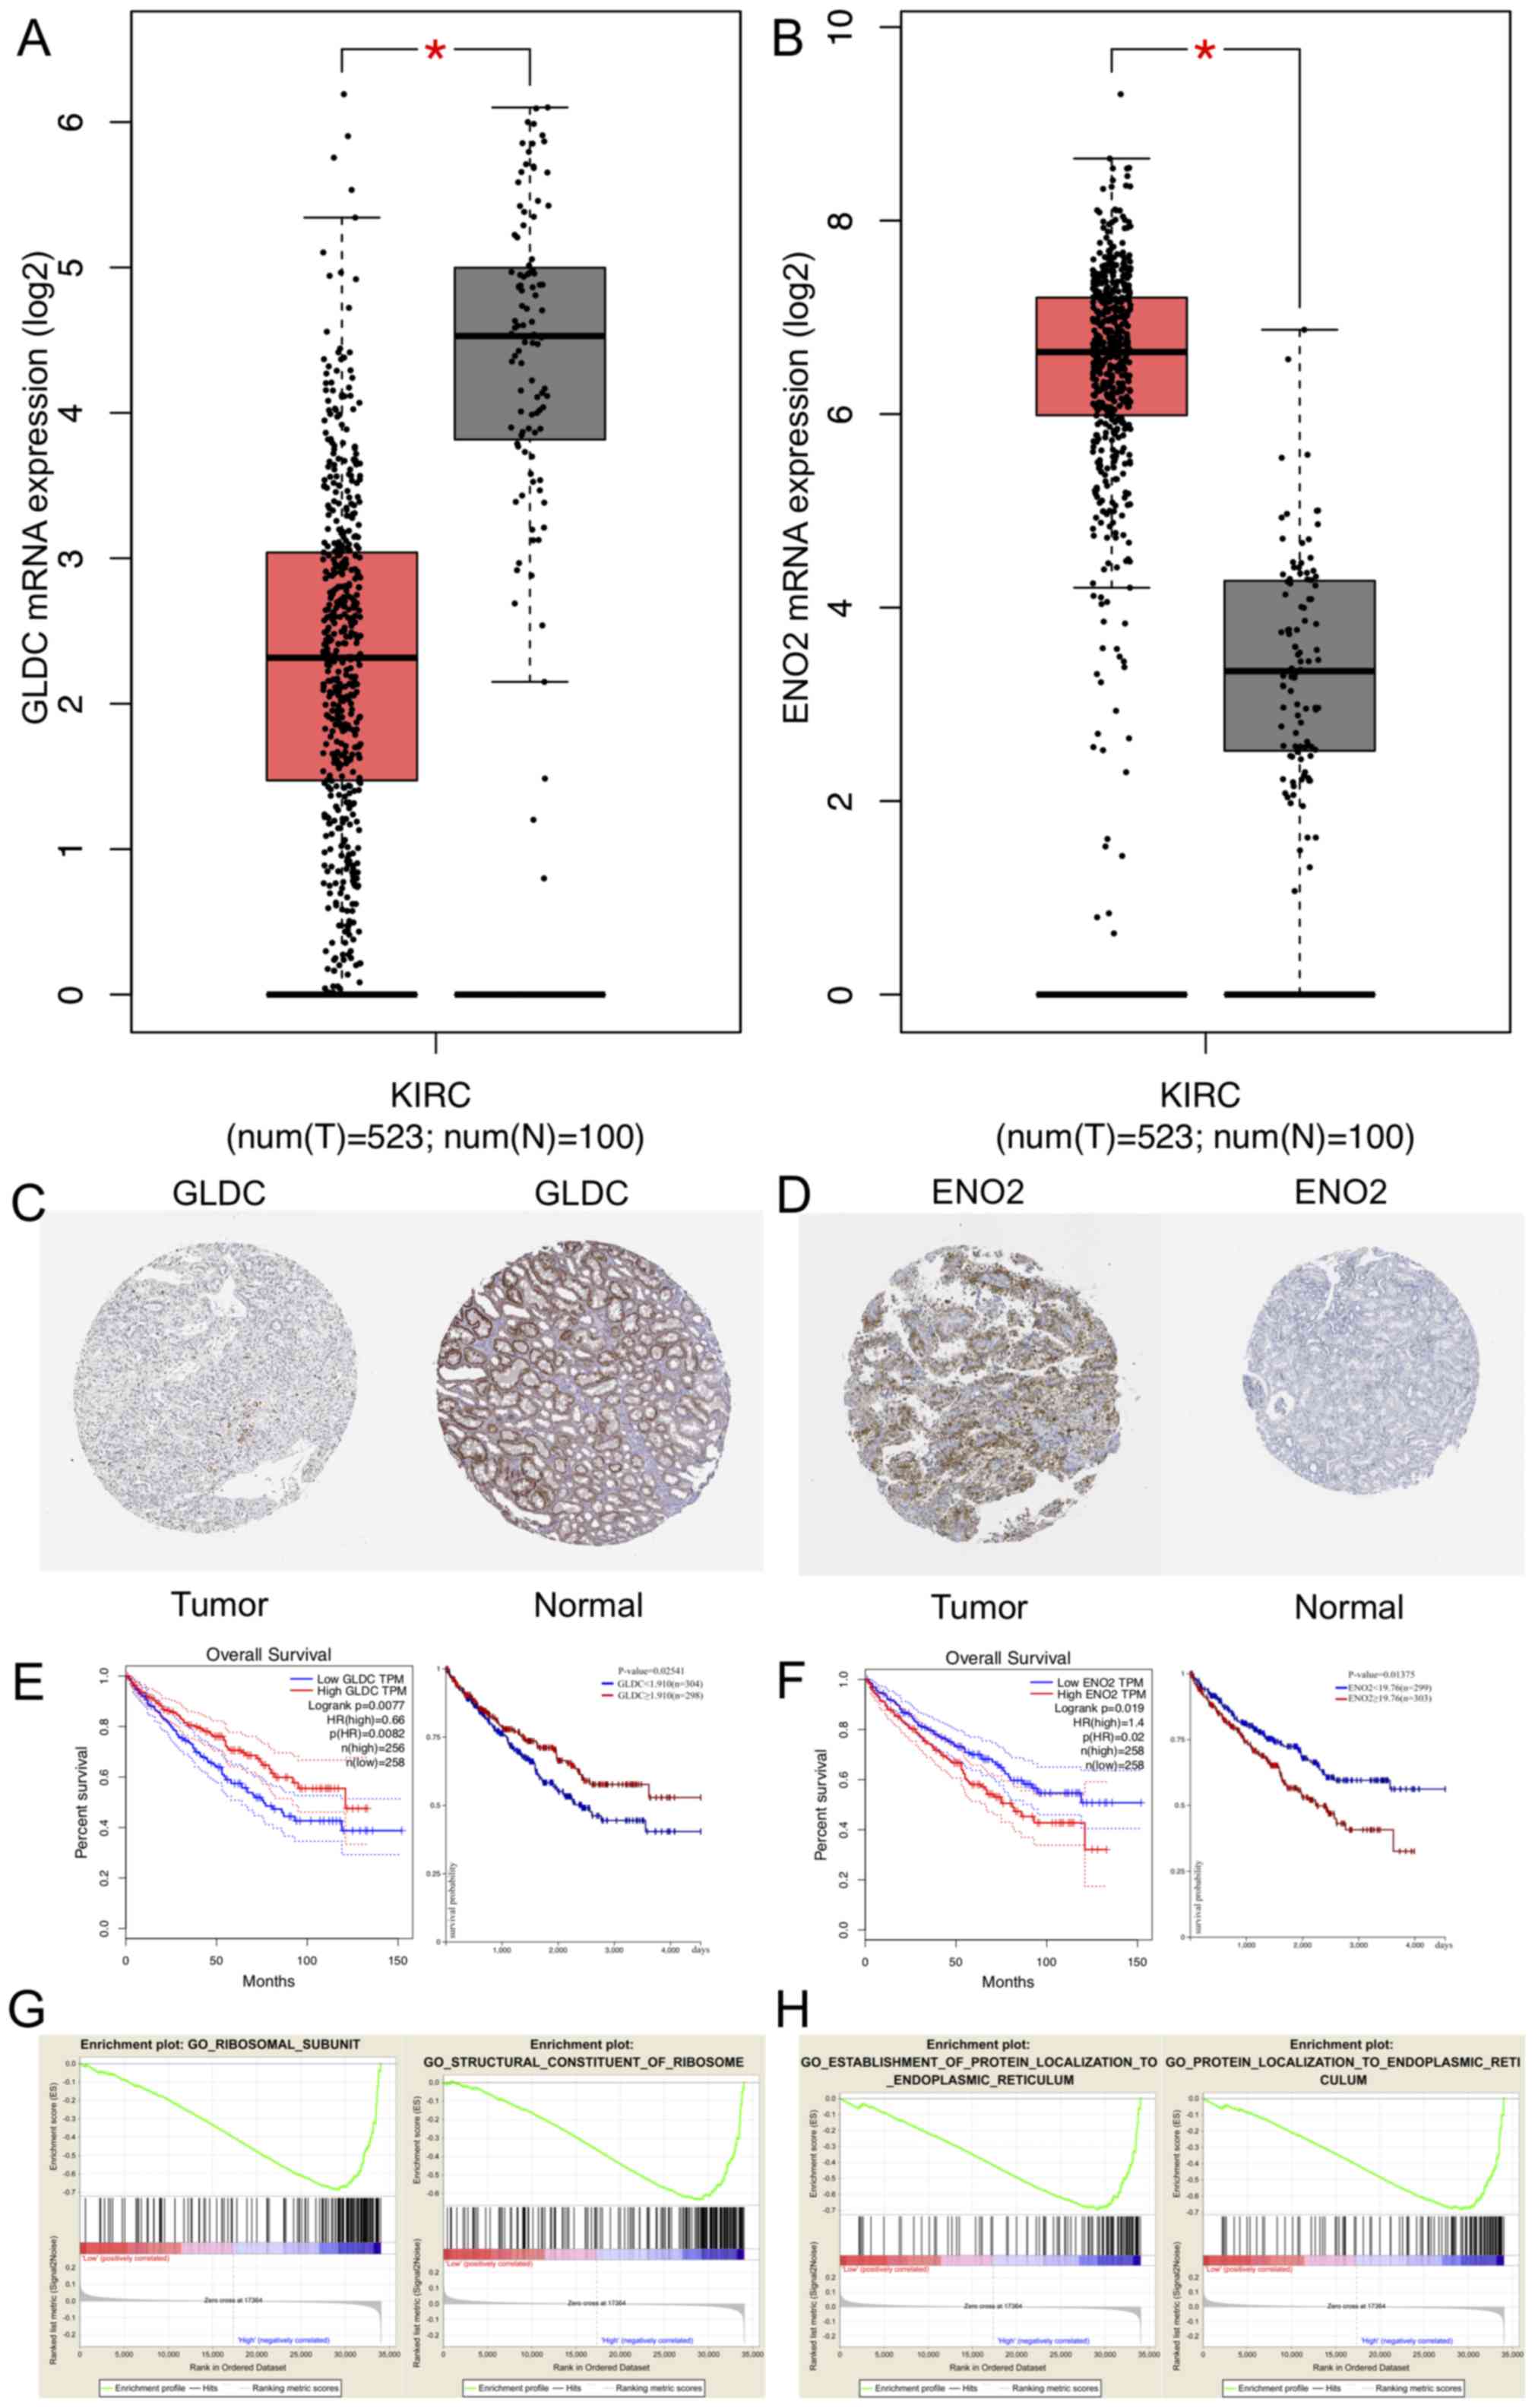 | Figure 5.Expression level and GSEA of GLDC and
ENO2. Expression levels of (A) GLDC and (B) ENO2 in tumor and
nontumor tissues. *P<0.05. (C) GLDC protein expression was
downregulated in RCC tissues compared with normal tissues. (D) ENO2
protein expression was significantly upregulated in RCC tissues
compared with normal tissues. (E) KM survival curves of GLDC
analyzed using GEPIA and UCSC Xena browser. (F) KM survival curves
of ENO2 analyzed using GEPIA and UCSC Xena browser. (G) GSEA
results showed two significant functional gene sets when GLDC was
upregulated in RCC. GeneSet1: GO Ribosomal Subunit, ES=−0.69,
Nominal P=0.02. GeneSet2: GO Structural Constituent of Ribosome,
ES=−0.63, Nominal P=0.02. (H) GSEA results showed 2 significant
functional gene sets when ENO2 was overexpressed in RCC. GeneSet1:
GO Establishment of Protein Localization to Endoplasmic Reticulum,
Enrichment Score (ES)=−0.69, Nominal P=0.04. GeneSet2: GO Protein
Localization to Endoplasmic Reticulum, ES=−0.68, Nominal P=0.02.
GLDC, glycine decarboxylase; ENO2, enolase 2; KIRC, Kidney renal
clear cell carcinoma; T, tumor; N, normal; HR, hazard ratio; KM;
Kaplan Meier; ES, enrichment score; RCC, renal cell carcinoma;
GSEA, gene set enrichment analysis; GO, gene ontology. |
| Table V.Relationship between GLDC expression
and characteristics of 840 patients with renal cell carcinoma from
the Human Protein Atlas. |
Table V.
Relationship between GLDC expression
and characteristics of 840 patients with renal cell carcinoma from
the Human Protein Atlas.
|
Characteristics | n | GLDC
expression | χ2 | P-value |
|---|
| Age |
| High | Low | 8.223 | 0.00414 |
|
≥55 | 565 | 302 | 263 |
|
|
|
<55 | 275 | 118 | 157 |
|
|
| Sex |
|
|
| 3.108 | 0.07791 |
|
Male | 564 | 294 | 270 |
|
|
|
Female | 276 | 126 | 150 |
|
|
| Stage |
|
|
| 10.229 | 0.00138 |
|
I–II | 552 | 298 | 254 |
|
|
|
III–IV | 288 | 122 | 166 |
|
|
GSEA
GSEA was performed to relate the hub genes to the GO
analysis and KEGG pathway database and explore the function of
these genes. A total of four functional gene sets were enriched.
The gene sets enriched in RCC with high expression of GLDC were
‘ribosomal subunit’ and ‘structural constituent of ribosome’. These
two gene sets were primarily involved in cell proliferation and
differentiation pathways (Fig. 5G).
The gene sets enriched in RCC with high ENO2 expression levels were
‘establishment of protein localization to endoplasmic reticulum’
and ‘protein localization to endoplasmic reticulum’ (Fig. 5H). These gene sets were focused on
pathways associated with cell apoptosis and endoplasmic reticulum
stress.
GLDC acts as a tumor suppressor gene,
whereas ENO2 is an oncogene in RCC
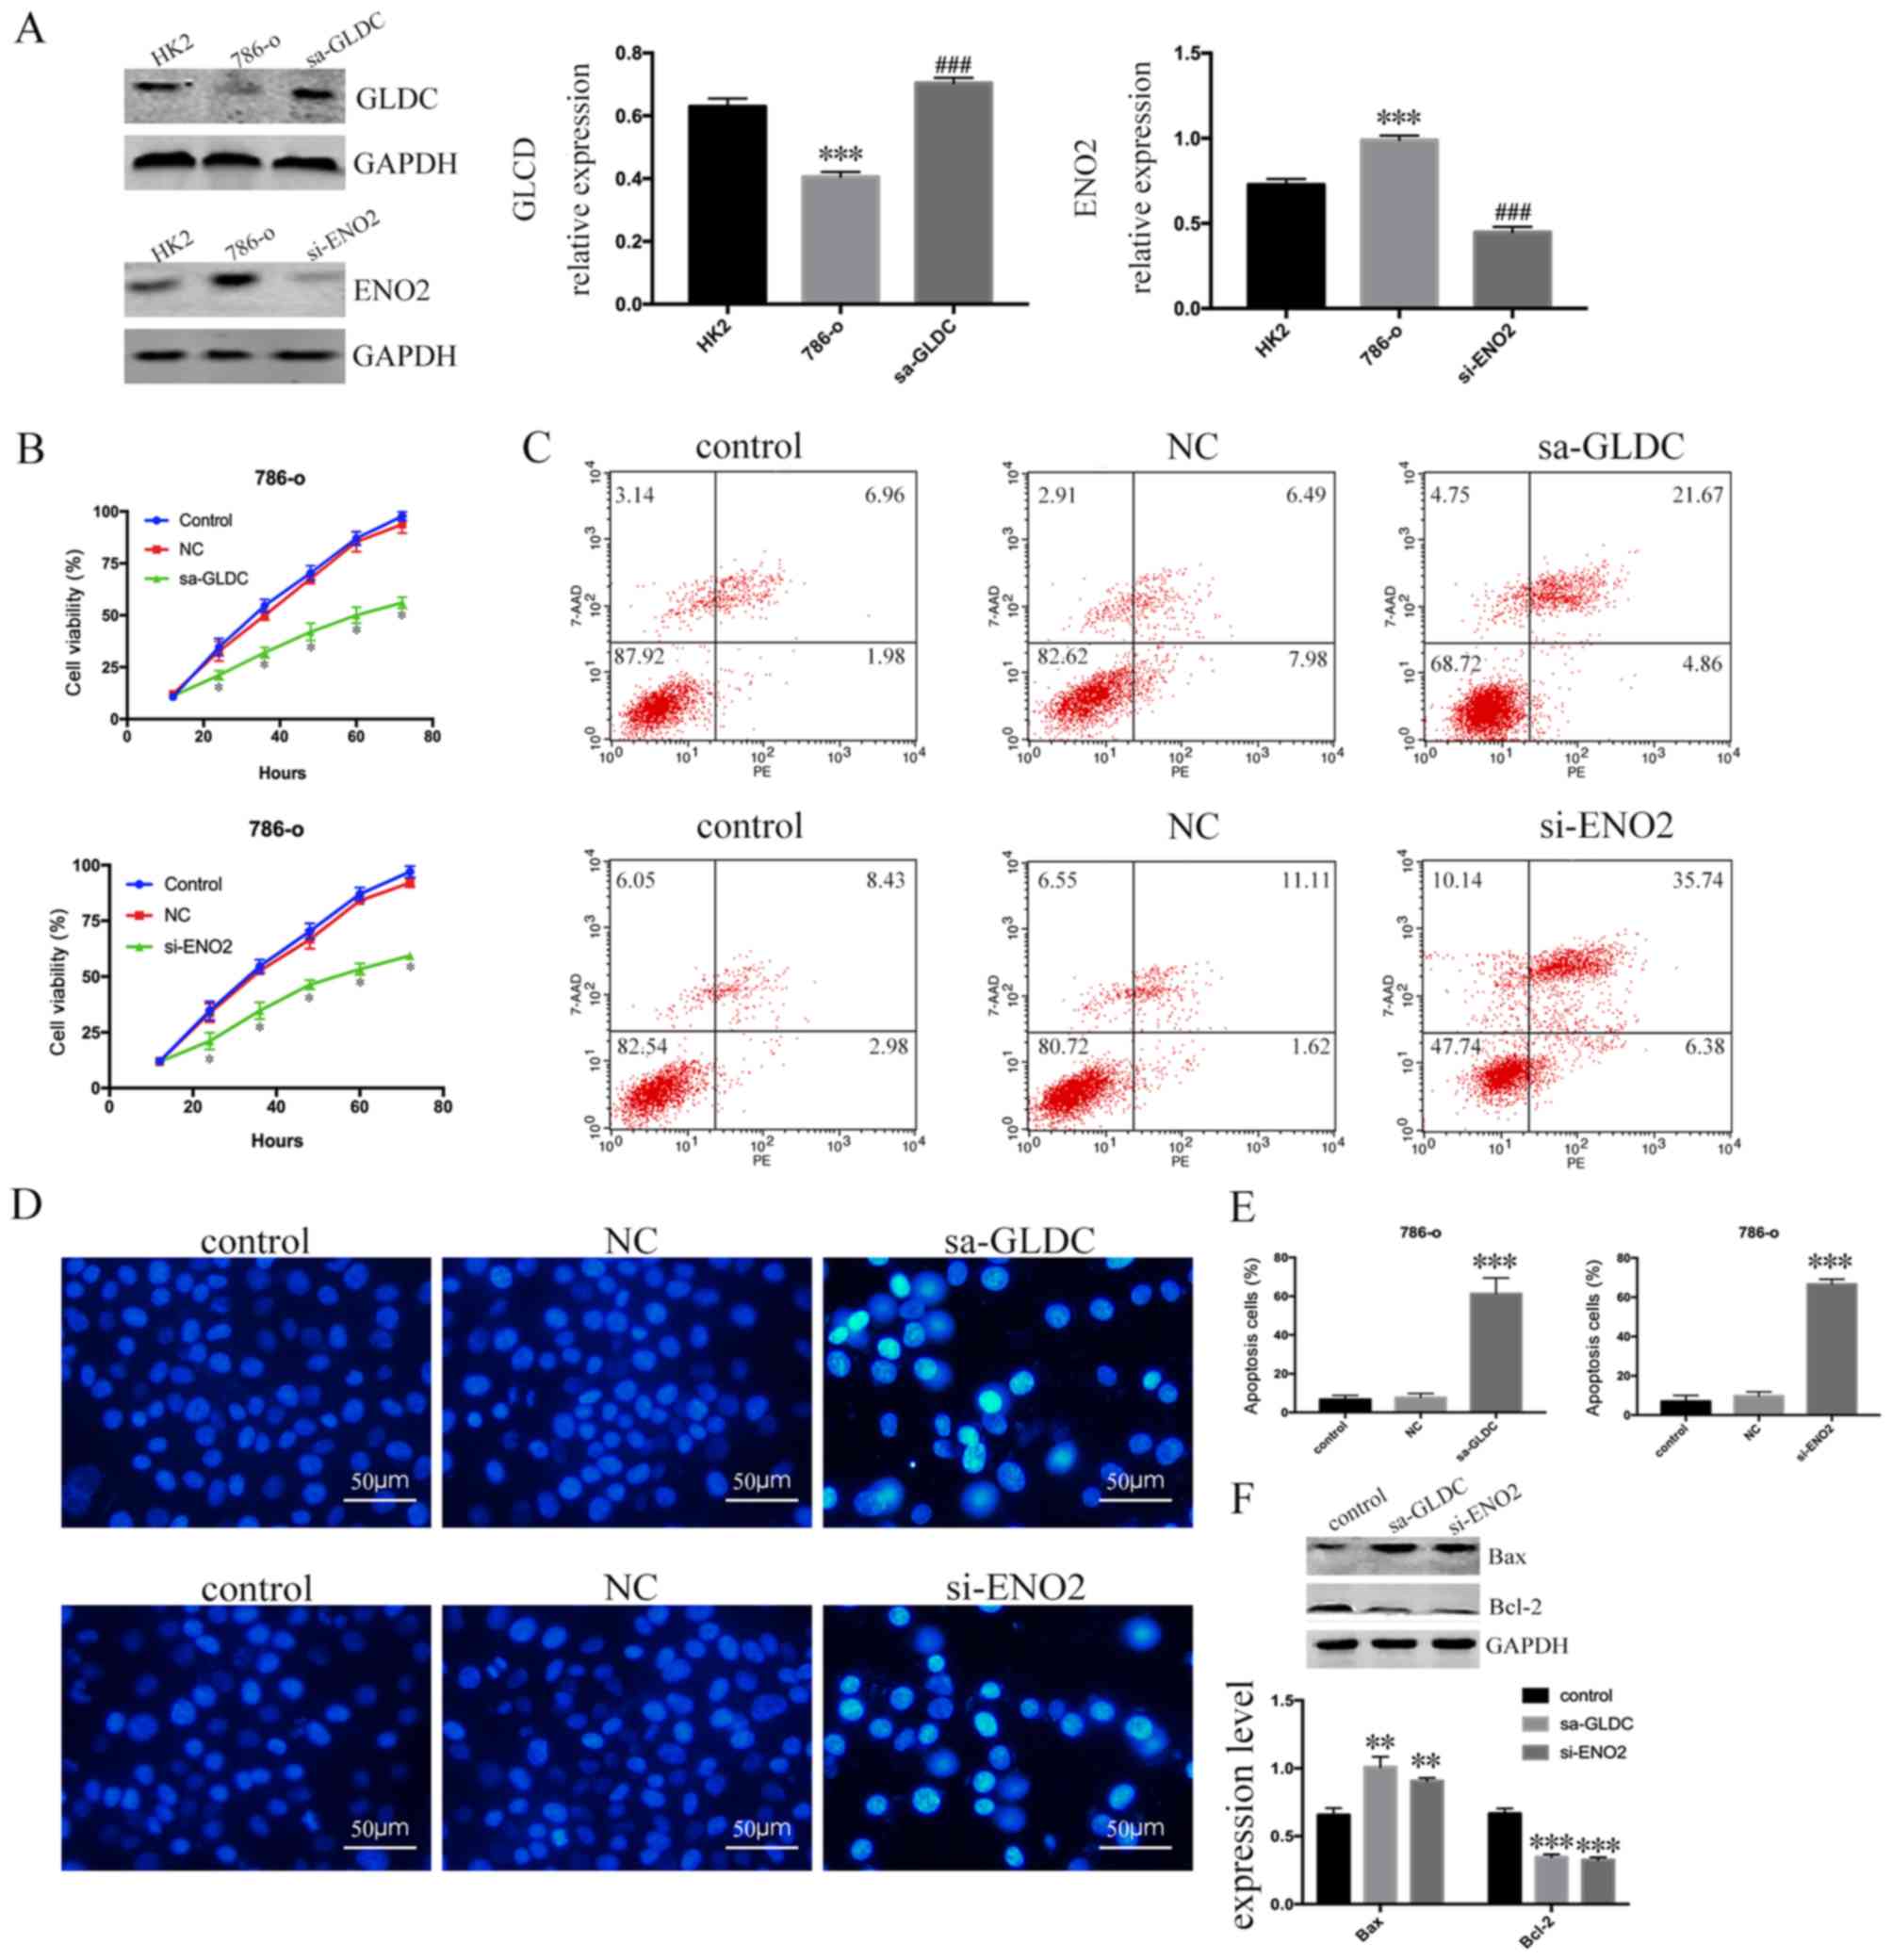
The expression levels of GLDC and ENO2 were examined
in the normal renal tubular epithelial cell line HK-2 and the renal
clear cell carcinoma cell line 786-O. It was found that GLDC had
reduced expression levels in 786-O cells, whereas ENO2 was highly
expressed in 786-O cells. saRNA was used to induce GLDC
overexpression in 786-O cells and siRNA was used to knockdown ENO2
expression (Fig. 6A). There was a
significant decrease in the proliferative capacity of the
sa-GLDC-786-O and si-ENO2-786-O cells after 72 h compared to
control group (P<0.0001; Fig.
6B). An Annexin V-PE/7-AAD double staining assay was performed
detect cell apoptosis using flow cytometry. The number of apoptotic
786-O cells was increased in sa-GLDC-786-O cells and si-ENO2-786-O
cells compared to control group (Fig.
6C) and the results of Hoechst 33258 staining assay were
consistent with Annexin V-PE/7-AAD double staining assay (Fig. 6D and E). Finally, it was demonstrated
that the expression of Bax increased and expression of Bcl-2
decreased (Fig. 6F). These data
showed that GLDC promoted and ENO2 inhibited apoptosis of renal
cancer cells, which suggests that GLDC acts as a tumor suppressor
gene whereas ENO2 acts as an oncogene in RCC.
Discussion
A tumor is a manifestation of a disease dependent on
a number of genes and its formation is associated with a variety of
factors, including metabolic capacity and immune regulation. The
essential attribute of a tumor is the loss of cell cycle regulation
control, resulting in uncontrollable cell proliferation (24). The reasons for this may be the
activation of one or more proto-oncogenes and mutations of or
deletions in tumor suppressor genes (25). Genetic deletion mutations can lead to
the inability of the immune system to recognize tumors, leading to
immune escape (26). Therefore,
changes in gene expression levels in cancer are particularly
important.
The insidious onset of symptoms usually results in
delayed diagnosis at an advanced stage of RCC (27). Therefore, the identification of
specific biomarkers to aid diagnosis of RCC and effective
therapeutic targets is needed. In the present study, the GSE40435
dataset, containing 101 pairs of tumors and adjacent healthy
tissue, was analyzed. Although the number of samples included in
the present study is limited, the data mining performed may be
valuable. In gastric cancer, Sun et al (28) utilized the gene expression profile of
GSE54129 containing only 111 gastric cancer samples and 21 healthy
gastric mucosa epithelium. Chen et al (29) used bioinformatic analysis to
demonstrate that the COP9 signalosome subunit 7B may be a
prognostic marker and therapeutic target in renal cancer. Among
differentially expressed genes, Wan et al (30) identified Aurora kinase B as a marker
for predicting the prognosis of renal cancer. In the present study,
the prognostic value of GLDC and ENO2 in RCC were assessed and it
was hypothesized that they may be associated with cancer and
carcinogenicity. DEGs were identified using bioinformatics and the
15 most important genes among these were determined using PPI
network analysis. In these 15 genes, altered expression levels of
GLDC and ENO2 exerted a significant effect on the prognosis of
patients with renal cancer. Finally, GSEA was used to identify the
BPs which may have been affected by altered expression levels of
GLDC and ENO2. An understanding of the biological mechanisms
regulated by GLDC and ENO2 in RCC may have research value.
GLDC, also termed glycine cleavage system P protein
and HYGN1, is involved in nonketotic hyperglycinemia (31,32).
Diseases associated with GLDC include glycine encephalopathy and
neonatal glycine encephalopathy (33). Metabolism, glyoxylate metabolism and
glycine degradation are among the pathways related to GLDC. GLDC
has been shown to serve an important role in certain types of
cancer, such as gastric cancer (34), breast cancer (35) and lung cancer (36); however, to the best of our knowledge,
there has been no research investigating the relationship between
GLDC and RCC. In lung cancer, GLDC is an essential oncogene
promoting tumorigenesis through its metabolic action (37). In gastric cancer, GLDC promoter
hypermethylation regulates transcriptional silencing inhibiting
tumor development, whereas GLDC was reported as a putative tumor
suppressor gene involved in tumor progression (34). The present study revealed that GLDC
was downregulated in RCC and associated with poor prognosis,
consistent with the results observed in gastric cancer. The result
of the present study suggested that GLDC may be a tumor suppressor
gene in RCC, supported by the fact that high GLDC expression levels
inhibited proliferation and promoted apoptosis in RCC. Therefore,
GLDC may serve an important role in the diagnosis and therapy of
RCC.
To date, three enolase isoenzymes have been
identified in mammals, including ENO2. Pathways related to ENO2 are
metabolism and hypoxia-inducible factor-1 signaling pathway
(38). ENO2 participates in
glycolysis and promotes the conversion of b-glycerophosphate to
dihydroxyacetone phosphate (39,40). In
a previous study, ENO2 was shown to be a pro-survival factor in
renal cancer (41). However, to the
best of our knowledge, the underlying mechanism of this action has
not been clarified. In acute lymphoblastic leukemia, ENO2 was
reported to promote cell proliferation, glycolysis and
glucocorticoid resistance (42). The
mechanism of ENO2 was initially demonstrated in the present study,
also demonstrating that high ENO2 expression may be a promising
prognostic and diagnostic marker for patients with RCC.
DEGs are candidate diagnostic markers of RCC, with
some well-established genes, such as EGFR and VEGF already
associated with this disease. The EGFR signaling pathway serves an
important role in physiological processes, such as cell growth,
proliferation and differentiation. Regulation of the EGFR signaling
pathway controls the growth and progression of renal cancer
(43). VEGF promotes vascular
permeability, extracellular matrix degeneration, vascular
endothelial cell migration, proliferation and angiogenesis. Studies
have shown that VEGF has a significant impact on the
epithelial-mesenchymal transition process in kidney cancer
(44,45). UMOD gene is associated with more
aggressive clinical and pathological characteristics in RCC
(46). Carbonic anhydrase 9 (CA9) is
a gene from a family of carbonic anhydrases shown to be a biomarker
of ccRCC (47,48), with previous studies showing that CA9
is overexpressed in RCC (49) and
its value as a diagnostic or prognostic marker of ccRCC (50). Pregnancy upregulated nonubiquitous
CaM kinase (PNCK) belongs to the calmodulin kinase I family and
participates in cytoplasmic and nuclear signal transduction
(51). A previous study indicated
that overexpression of PNCK could be used for the prognostic
stratification of patients with primary ccRCC (52). Collectively, further exploration of
the clinical value of these DEGs is warranted.
In the present study, 1,650 DEGs and 15 hub genes
were identified as potential diagnostic or prognostic biomarkers of
RCC. The present study identified several genes which had not been
previously linked with RCC and provided evidence that these genes
were associated with this disease. Further experiments are required
to verify these results and to more accurately analyze the
associations between these genes and RCC. Overall, the present
study highlights potentially novel targets for more individualized
treatment of patients with RCC.
Acknowledgements
The authors would like to thank Dr Huan Deng
(Department of Gastroenterology, Renmin Hospital of Wuhan
University) for his assistance in statistical analysis.
Funding
This study was supported by The Application and
Basic Research Project of Wuhan City (grant no. 2018060401011321),
The Wuhan Morning Light Plan of Youth Science and Technology (grant
no. 2017050304010281), The Hubei Province Health and Family
Planning Scientific Research Project (grant nos. WJ2017M025 and
WJ2017Z005), The Natural Science Foundation of Hubei Province
(grant no. 2016CFB114, 2017CFB181) and The Research Project of
Wuhan University (grant no. 2042017kf0097).
Availability of data and materials
The datasets used and/or analyzed during the present
study are available from the corresponding author on reasonable
request.
Authors' contributions
RL and LW performed the biochemical experiments and
contributed to the preparation of the draft. XL collected the data
and wrote the first draft of the paper. XW perforemd analysis of
PPI network. RXG and NL performed the GO and KEGG analysis of hub
genes. All authors read and approved the final version of the
manuscript.
Ethics approval and consent to
participate
Not applicable.
Patient consent for publication
Not applicable.
Competing interests
The authors declare that they have no competing
interests.
References
|
1
|
Ferlay J, Soerjomataram I, Dikshit R, Eser
S, Mathers C, Rebelo M, Parkin DM, Forman D and Bray F: Cancer
incidence and mortality worldwide: Sources, methods and major
patterns in GLOBOCAN 2012. Int J Cancer. 136:E359–E386. 2015.
View Article : Google Scholar : PubMed/NCBI
|
|
2
|
Patard JJ, Pignot G, Escudier B, Eisen T,
Bex A, Sternberg C, Rini B, Roigas J, Choueiri T, Bukowski R, et
al: ICUD-EAU international consultation on kidney cancer 2010:
Treatment of metastatic disease. Eur Urol. 60:684–690. 2011.
View Article : Google Scholar : PubMed/NCBI
|
|
3
|
Waalkes S, Kramer M, Herrmann TR, Schrader
AJ, Kuczyk MA and Merseburger AS: Present state of target therapy
for disseminated renal cell carcinoma. Immunotherapy. 2:393–398.
2010. View Article : Google Scholar : PubMed/NCBI
|
|
4
|
Siegel RL, Miller KD and Jemal A: Cancer
statistics, 2018. CA Cancer J Clin. 68:7–30. 2018. View Article : Google Scholar : PubMed/NCBI
|
|
5
|
Duran I, Lambea J, Maroto P,
Gonzalez-Larriba JL, Flores L, Granados-Principal S, Graupera M,
Saez B, Vivancos A and Casanovas O: Resistance to targeted
therapies in renal cancer: The importance of changing the mechanism
of action. Target Oncol. 12:19–35. 2017. View Article : Google Scholar : PubMed/NCBI
|
|
6
|
Gassenmaier M, Chen D, Buchner A, Henkel
L, Schiemann M, Mack B, Schendel DJ, Zimmermann W and Pohla H: CXC
chemokine receptor 4 is essential for maintenance of renal cell
carcinoma-initiating cells and predicts metastasis. Stem Cells.
31:1467–1476. 2013. View Article : Google Scholar : PubMed/NCBI
|
|
7
|
Pan Q, Shai O, Lee LJ, Frey BJ and
Blencowe BJ: Deep surveying of alternative splicing complexity in
the human transcriptome by high-throughput sequencing. Nat Genet.
40:1413–1415. 2008. View
Article : Google Scholar : PubMed/NCBI
|
|
8
|
Geng RX, Li N, Xu Y, Liu JH, Yuan FE, Sun
Q, Liu BH and Chen QX: Identification of core biomarkers associated
with outcome in glioma: Evidence from bioinformatics analysis. Dis
Markers. 2018:32159582018. View Article : Google Scholar : PubMed/NCBI
|
|
9
|
Wozniak MB, Le Calvez-Kelm F,
Abedi-Ardekani B, Byrnes G, Durand G, Carreira C, Michelon J,
Janout V, Holcatova I, Foretova L, et al: Integrative genome-wide
gene expression profiling of clear cell renal cell carcinoma in
Czech Republic and in the United States. PLoS One. 8:e578862013.
View Article : Google Scholar : PubMed/NCBI
|
|
10
|
Davis S and Meltzer PS: GEOquery: A bridge
between the gene expression omnibus (GEO) and BioConductor.
Bioinformatics. 23:1846–1847. 2007. View Article : Google Scholar : PubMed/NCBI
|
|
11
|
Thissen D, Steinberg L and Kuang D: Quick
and easy implementation of the benjamini-hochberg procedure for
controlling the false positive rate in multiple comparisons. J Educ
Behav Stat. 27:77–83. 2002. View Article : Google Scholar
|
|
12
|
Barrett T, Troup DB, Wilhite SE, Ledoux P,
Evangelista C, Kim IF, Tomashevsky M, Marshall KA, Phillippy KH,
Sherman PM, et al: NCBI GEO: Archive for functional genomics data
sets-10 years on. Nucleic Acids Res. 39((Database Issue)):
D1005–D1010. 2011. View Article : Google Scholar : PubMed/NCBI
|
|
13
|
Ashburner M, Ball CA, Blake JA, Botstein
D, Butler H, Cherry JM, Davis AP, Dolinski K, Dwight SS, Eppig JT,
et al: Gene ontology: Tool for the unification of biology. The gene
ontology consortium. Nat Genet. 25:25–29. 2000. View Article : Google Scholar : PubMed/NCBI
|
|
14
|
Kanehisa M and Goto SA: KEGG: Kyoto
encyclopedia of genes and genomes. Nucleic Acids Res. 28:27–30.
2000. View Article : Google Scholar : PubMed/NCBI
|
|
15
|
Huang da W, Sherman BT and Lempicki RA:
Systematic and integrative analysis of large gene lists using DAVID
bioinformatics resources. Nat Proto. 4:44–57. 2009. View Article : Google Scholar
|
|
16
|
Szklarczyk D, Franceschini A, Wyder S,
Forslund K, Heller D, Huerta-Cepas J, Simonovic M, Roth A, Santos
A, Tsafou KP, et al: STRING v10: Protein-protein interaction
networks, integrated over the tree of life. Nucleic Acids Res.
43((Database Issue)): D447–D452. 2015. View Article : Google Scholar : PubMed/NCBI
|
|
17
|
von Mering C, Huynen M, Jaeggi D, Schmidt
S, Bork P and Snel B: STRING: A database of predicted functional
associations between proteins. Nucleic Acids Res. 31:258–261. 2003.
View Article : Google Scholar : PubMed/NCBI
|
|
18
|
Shannon P, Markiel A, Ozier O, Baliga NS,
Wang JT, Ramage D, Amin N, Schwikowski B and Ideker T: Cytoscape: A
software environment for integrated models of biomolecular
interaction networks. Genome Res. 13:2498–2504. 2003. View Article : Google Scholar : PubMed/NCBI
|
|
19
|
Carithers LJ and Moore HM: The
genotype-tissue expression (GTEx) project. Biopreserv Biobank.
13:307–308. 2013. View Article : Google Scholar
|
|
20
|
Nagy A, Lánczky A, Menyhárt O and Győrffy
B: Validation of miRNA prognostic power in hepatocellular carcinoma
using expression data of independent datasets. Sci Rep. 8:92272018.
View Article : Google Scholar : PubMed/NCBI
|
|
21
|
Uhlén M, Fagerberg L, Hallström BM,
Lindskog C, Oksvold P, Mardinoglu A, Sivertsson Å, Kampf C,
Sjöstedt E, Asplund A, et al: Proteomics. Tissue-based map of the
human proteome. Science. 347:12604192015. View Article : Google Scholar : PubMed/NCBI
|
|
22
|
Li N, Li L and Chen Y: The identification
of core gene expression signature in hepatocellular carcinoma. Oxid
Med Cell Longev. 2018:34783052018. View Article : Google Scholar : PubMed/NCBI
|
|
23
|
Subramanian A, Tamayo P, Mootha VK,
Mukherjee S, Ebert BL, Gillette MA, Paulovich A, Pomeroy SL, Golub
TR, Lander ES and Mesirov JP: Gene set enrichment analysis: A
knowledge-based approach for interpreting genome-wide expression
profiles. Proc Natl Acad Sci USA. 102:15545–15550. 2005. View Article : Google Scholar : PubMed/NCBI
|
|
24
|
Pelosi G, Fraggetta F, Nappi O, Pastorino
U, Maisonneuve P, Pasini F, Iannucci A, Solli P, Musavinasab HS, De
Manzoni G, et al: Pleomorphic carcinomas of the lung show a
selective distribution of gene products involved in cell
differentiation, cell cycle control, tumor growth, and tumor cell
motility: A clinicopathologic and immunohistochemical study of 31
cases. Am J Surg Pathol. 27:1203–1215. 2003. View Article : Google Scholar : PubMed/NCBI
|
|
25
|
Yan T, Skaftnesmo KO, Leiss L, Sleire L,
Wang J, Li X and Enger PO: Neuronal markers are expressed in human
gliomas and NSE knockdown sensitizes glioblastoma cells to
radiotherapy and temozolomide. BMC Cancer. 11:5242011. View Article : Google Scholar : PubMed/NCBI
|
|
26
|
Murakami N and Riella LV: Co-inhibitory
pathways and their importance in immune regulation.
Transplantation. 98:3–14. 2014. View Article : Google Scholar : PubMed/NCBI
|
|
27
|
Zimpfer A, Glass Ä, Zettl H, Maruschke M,
Hakenberg OW and Erbersdobler A: Renal cell carcinoma diagnosis and
prognosis within the context of the WHO classification 2016.
Urologe A. 58:1057–1065. 2019.(In German). View Article : Google Scholar : PubMed/NCBI
|
|
28
|
Sun C, Yuan Q, Wu D, Meng X and Wang B:
Identification of core genes and outcome in gastric cancer using
bioinformatics analysis. Oncotarget. 8:70271–70280. 2017.PubMed/NCBI
|
|
29
|
Chen B, Jiao Z, Yin X, Qian Z, Gu J and
Sun H: Novel insights into biomarkers associated with renal cell
carcinoma. Oncol Lett. 16:83–90. 2018.PubMed/NCBI
|
|
30
|
Wan B, Huang Y, Liu B, Lu L and Lv C:
AURKB: A promising biomarker in clear cell renal cell carcinoma.
PeerJ. 7:e77182019. View Article : Google Scholar : PubMed/NCBI
|
|
31
|
Kure S, Kato K, Dinopoulos A, Gail C,
DeGrauw TJ, Christodoulou J, Bzduch V, Kalmanchey R, Fekete G,
Trojovsky A, et al: Comprehensive mutation analysis of GLDC, AMT,
and GCSH in nonketotic hyperglycinemia. Hum Mutat. 27:343–352.
2006. View Article : Google Scholar : PubMed/NCBI
|
|
32
|
Rodriguez-Benitez V, Arranz JA, Mata C,
Perez-Navero JL and Gil-Campos M: A new mutation in the GLDC gene
in non-ketotic hyperglycinaemia. An Pediatr (Barc). 80:e7–e8.
2014.(In Spanish). PubMed/NCBI
|
|
33
|
Khraim W, Abu-Libdeh B, Ayesh S and
Dweikat I: Clinical heterogeneity of glycine encephalopathy in
three Palestinian siblings: A novel mutation in the glycine
decarboxylase (GLDC) gene. Brain Dev. 39:601–605. 2017. View Article : Google Scholar : PubMed/NCBI
|
|
34
|
Min HL, Kim J, Kim WH, Jang BG and Kim MA:
Epigenetic silencing of the putative tumor suppressor gene GLDC
(Glycine Dehydrogenase) in gastric carcinoma. Anticancer Res.
36:179–187. 2016.PubMed/NCBI
|
|
35
|
Kim SK, Jung WH and Koo JS: Differential
expression of enzymes associated with serine/glycine metabolism in
different breast cancer subtypes. PLoS One. 9:e1010042014.
View Article : Google Scholar : PubMed/NCBI
|
|
36
|
Berezowska S, Galván JA, Langer R,
Bubendorf L, Savic S, Gugger M, Schmid RA and Marti TM: Glycine
decarboxylase and HIF-1α expression are negative prognostic factors
in primary resected early-stage non-small cell lung cancer.
Virchows Arch. 470:323–330. 2017. View Article : Google Scholar : PubMed/NCBI
|
|
37
|
Zhang WC, Shyh-Chang N, Yang H, Rai A,
Umashankar S, Ma S, Soh BS, Sun LL, Tai BC, Nga ME, et al: Glycine
decarboxylase activity drives non-small cell lung cancer
tumor-initiating cells and tumorigenesis. Cell. 148:259–272. 2012.
View Article : Google Scholar : PubMed/NCBI
|
|
38
|
Zhang T, Niu X, Liao L, Cho EA and Yang H:
The contributions of HIF-target genes to tumor growth in RCC. PLoS
One. 8:e805442013. View Article : Google Scholar : PubMed/NCBI
|
|
39
|
Isgro MA, Bottoni P and Scatena R:
Neuron-specific enolase as a biomarker: Biochemical and clinical
aspects. Adv Exp Med Biol. 867:125–143. 2015. View Article : Google Scholar : PubMed/NCBI
|
|
40
|
Vizin T and Kos J: Gamma-enolase: A
well-known tumour marker, with a less-known role in cancer. Radiol
Oncol. 49:217–226. 2015. View Article : Google Scholar : PubMed/NCBI
|
|
41
|
Luo T, Chen X, Zeng S, Guan B, Hu B, Meng
Y, Liu F, Wong T, Lu Y, Yun C, et al: Bioinformatic identification
of key genes and analysis of prognostic values in clear cell renal
cell carcinoma. Oncol Lett. 16:1747–1757. 2018.PubMed/NCBI
|
|
42
|
Liu CC, Wang H, Wang WD, Wang L, Liu WJ,
Wang JH, Geng QR and Lu Y: ENO2 promotes cell proliferation,
glycolysis, and glucocorticoid-resistance in acute lymphoblastic
leukemia. Cell Physiol Biochem. 46:1525–1535. 2018. View Article : Google Scholar : PubMed/NCBI
|
|
43
|
Laviolette LA, Mermoud J, Calvo IA, Olson
N, Boukhali M, Steinlein OK, Roider E, Sattler EC, Huang D, The BT,
et al: Negative regulation of EGFR signalling by the human
folliculin tumour suppressor protein. Nat Commun. 8:158662017.
View Article : Google Scholar : PubMed/NCBI
|
|
44
|
Huang J, Wang X, Wen G and Ren Y:
MiRNA2055p functions as a tumor suppressor by negatively regulating
VEGFA and PI3K/Akt/mTOR signaling in renal carcinoma cells. Oncol
Rep. 42:1677–1688. 2019.PubMed/NCBI
|
|
45
|
Roskoski R Jr: Vascular endothelial growth
factor (VEGF) and VEGF receptor inhibitors in the treatment of
renal cell carcinomas. Pharmacol Res. 120:116–132. 2017. View Article : Google Scholar : PubMed/NCBI
|
|
46
|
Trevisani F, Larcher A, Cinque A,
Capitanio U, Ripa F, Vago R, Bettiga A, Benigni F, Carenzi C,
Muttin F, et al: The association of uromodulin genotype with renal
cancer aggressiveness. Eur Urol Focus. 5:262–265. 2019. View Article : Google Scholar : PubMed/NCBI
|
|
47
|
Liao SY, Aurelio ON, Jan K, Zavada J and
Stanbridge EJ: Identification of the MN/CA9 protein as a reliable
diagnostic biomarker of clear cell carcinoma of the kidney. Cancer
Res. 57:2827–2831. 1997.PubMed/NCBI
|
|
48
|
Li G, Cuilleron M, Cottier M,
Gentil-Perret A, Lambert C, Genin C and Tostain J: The use of
MN/CA9 gene expression in identifying malignant solid renal tumors.
Eur Urol. 49:401–405. 2006. View Article : Google Scholar : PubMed/NCBI
|
|
49
|
Li G, Cuilleron M, Gentil-Perret A,
Cottier M, Passebosc-Faure K, Lambert C, Genin C and Tostain J:
Rapid and sensitive detection of messenger RNA expression for
molecular differential diagnosis of renal cell carcinoma. Clin
Cancer Res. 9:6441–6446. 2003.PubMed/NCBI
|
|
50
|
Li G, Feng G, Gentil-Perret A, Genin C and
Tostain J: Serum carbonic anhydrase 9 level is associated with
postoperative recurrence of conventional renal cell cancer. J Urol.
180:510–514. 2008. View Article : Google Scholar : PubMed/NCBI
|
|
51
|
Ueda T, Sakagami H, Abe K, Oishi I, Maruo
A, Kondo H, Terashima T, Ichihashi M, Yamamura H and Minami Y:
Distribution and intracellular localization of a mouse homologue of
Ca2+/calmodulin-dependent protein kinase Ibeta2 in the nervous
system. J Neurochem. 73:2119–2129. 1999.PubMed/NCBI
|
|
52
|
Wu S, Lv Z, Wang Y, Sun L, Jiang Z, Xu C,
Zhao J, Sun X, Li X, Hu L, et al: Increased expression of pregnancy
up-regulated non-ubiquitous calmodulin kinase is associated with
poor prognosis in clear cell renal cell carcinoma. PLoS One.
8:e599362013. View Article : Google Scholar : PubMed/NCBI
|