Introduction
Renal cell carcinoma (RCC) is one of the most common
urological tumors worldwide, and its incidence and mortality have
been rising throughout the world (1). Traditional chemotherapeutic drugs
cannot easily kill kidney cancer cells (2) and the clinical outcomes of patients
with RCC can vary greatly (3). At
present, the prognosis of patients with RCC is primarily determined
by pathological staging (4).
Although various studies have been investigated RCC, the clinical
prognosis of patients with metastatic RCC remains poor (5). Therefore, there is a need to identify
novel and more effective and accurate prognosis biomarkers for
patients with RCC. At present, gene expression profiling has been
increasingly used for the diagnosis of RCC (6). The genomic and molecular
characteristics of tumors, such as RCC and bladder cancer, have
been investigated in recent years (7). Molecular biomarkers should be
considered in addition to standard clinicopathologic criteria to
guide clinical treatment options.
Tumor-associated genes are important contributors to
tumorigenesis and progression of cancer (8,9). In
addition, the tumor microenvironment affects gene expression levels
in tumor tissues, thus affecting clinical outcomes (10,11). In
the tumor microenvironment, immune and stromal cells are the two
main types of non-tumor components and are associated with the
prognosis of tumors (12,13). Gene expression levels data from tumor
databases can be analyzed using algorithms to predict cellular
components in tumor tissues (14,15). For
example, Yoshihara et al. designed an algorithm called
ESTIMATE (16), which uses
expression data to estimate stromal and immune cells in malignant
tumor tissue. The algorithm can predict the infiltration of immune
and stromal cells in the tumor microenvironment by analyzing
specific gene expression profiles and calculating immune and
stromal scores. At present, the value of immune/stromal scores in
RCC has not been elucidated in detail. Novel useful biomarkers are
required to estimate the prognosis and diagnosis of RCC.
In the present study, the RCC cohort of The Cancer
Genome Atlas (TCGA) database and the ESTIMATE algorithm were both
used to analyze the association of immune and stromal scores with
clinicopathological features and a set of tumor
microenvironment-related genes that could predict the prognosis of
patients with RCC were identified. The results of the present study
may provide effective genetic predictors for the diagnosis,
prognosis and treatment of renal cell carcinoma.
Materials and methods
TCGA RCC data
Gene expression data for 885 patients with RCC were
obtained from TCGA database (cancer.gov/tcga). In the data, 289 (32.7%) patients
were female and 596 (67.3%) patients were male, with an age range
of 34–90 years. The following are the selection criteria of TCGA
IDs on the database: i) Disease type was adenocarcinomas; ii)
primary site was the kidney; iii) program name was TCGA; iv)
Workflow Type was HTSeq-FPKM; v) data category was transcriptome
profiling and vi) data type was Gene Expression Quantification. RNA
expression profiles of kidney adenomas and adenocarcinomas were
analyzed using the Affymetrix Human Genome U133 Plus version 2.0
array. Clinical data such as sex, age, histological grading,
Tumor-Node-Metastasis (TNM) stage, clinical stage, survival time
and outcomes were also obtained from TCGA database.
ESTIMATE algorithm
The ESTIMATE algorithm can infer the infiltration of
immune and stromal cells in tumor tissues by analyzing the
transcriptional profile of cancer samples (16). Gene expression values were graded and
ranked for each sample. The statistical significance value was
calculated by integrating the difference between the empirical
cumulative distribution functions of the signature gene and the
remaining genes. The ESTIMATE algorithm output stromal and immune
scores by performing single-sample Gene Set Enrichment
Analysis.
Investigating the association between
ESTIMATE scores and clinical features in renal cell carcinoma
Samples were grouped according to
clinical/pathological stage, and the ESTIMATE scores of each group
were then analyzed to evaluate the association between ESTIMATE
scores and clinical/pathological stage. The mean score was used to
divide these samples into low- and high-stromal/immune score
groups, and the difference in overall survival rate between the two
groups was evaluated using Kaplan-Meier plotter (17) and log-rank tests.
Identification of differentially
expressed genes
Samples were grouped according to stromal/immune
scores. The expression of individual genes was analyzed using the
Limma package in R (18). All R
language operations are performed in R Studio (19). A log2| fold-change (FC)| >2.0 and
P<0.05 were considered to indicate a significant difference when
screening for differentially expressed genes (DEGs). The Pheatmap
package (CRAN.R-project.org/package=pheatmap) was used to
generate heatmaps.
Enrichment analysis of differentially
expressed genes
The Database for Annotation, Visualization and
Integrated Discovery (DAVID v.6.8) database (david.ncifcrf.gov/) was used to identify Gene Ontology
(GO) categories, including biological processes (BPs), cellular
components (CCs) and molecular functions (MFs). Pathway enrichment
analysis was also performed using the DAVID database with reference
to the Kyoto Encyclopedia of Genes and Genomes (KEGG) pathways
(kegg.jp/).
Construction of protein-protein
interaction (PPI) networks
PPI networks provide a valuable framework for an
improved understanding of the interaction of proteins (20). The PPI networks were retrieved from
the STRING database (21) and
reconstructed using Cytoscape software v.3.7.1 (22). Nodes with a high degree of
connectivity in the network were considered as regulatory hubs. The
node size was determined to be proportional to the degree of
interaction. The genes with a degree of connectivity ≥1 were
reserved in the PPI network. Genes with a degree of connectivity
>31.56 were considered hub genes.
Association between the expression of
DEGs and overall survival rate
The log-rank method was used to evaluate the
prognostic value of each gene. Genes that were significantly
associated with overall survival rate were identified as prognostic
genes. Subsequently, a LASSO Cox regression model was used to
construct a prognostic classifier by selecting genes from these
prognostic DEGs. The risk score based on the expression levels for
each patient was calculated using the constructed Cox regression
model. According to the optimum cut-off score (risk score=0.472),
the patients were divided into high-risk and low-risk groups. The
difference in survival rates between the two groups was then
assessed using the Kaplan-Meier method.
Building a clinical predictive model
based on the prognostic genes for RCC
A LASSO Cox regression model was used to select the
most useful prognostic genes. A multiple-gene-based classifier was
constructed to predict the survival rate of patients with RCC.
Patients were randomly divided into training set and testing set
(7:3). Cox regression analysis was performed by using the ‘glmnet’
package. The area under the curve (AUC) of the time-dependent
receiver operating characteristic (ROC) curve was used to measure
the predictive accuracy of the multi-gene based classifier.
Univariate and multivariate survival analyses were performed by
using the Cox regression model and a nomogram plot was generated
according to the Cox regression coefficients.
Statistical analysis
The differences in ESTIMATE scores between different
clinical/pathological staging groups were analyzed using the
Kruskal-Wallis test. The differences in the levels of gene
expression between the high-and low-score groups were compared
using an unpaired t-test. Kaplan-Meier analysis and log-rank tests
were performed in order to compare each prognostic gene signature.
Univariate and multivariate survival analyses were performed with
the Cox regression model. A LASSO Cox regression analysis was used
to built the best classifier according to the regression
coefficients and P-values. P<0.05 was considered to indicate a
statistically significant difference.
Results
ESTIMATE scores were associated with
clinicopathological features in RCC
The gene expression data and clinicopathological
data of 885 patients with kidney adenocarcinomas were downloaded
from TCGA database. Stromal scores were distributed between
−1,897.14 and 1,967.19 and immune scores ranged from 1,673.78 to
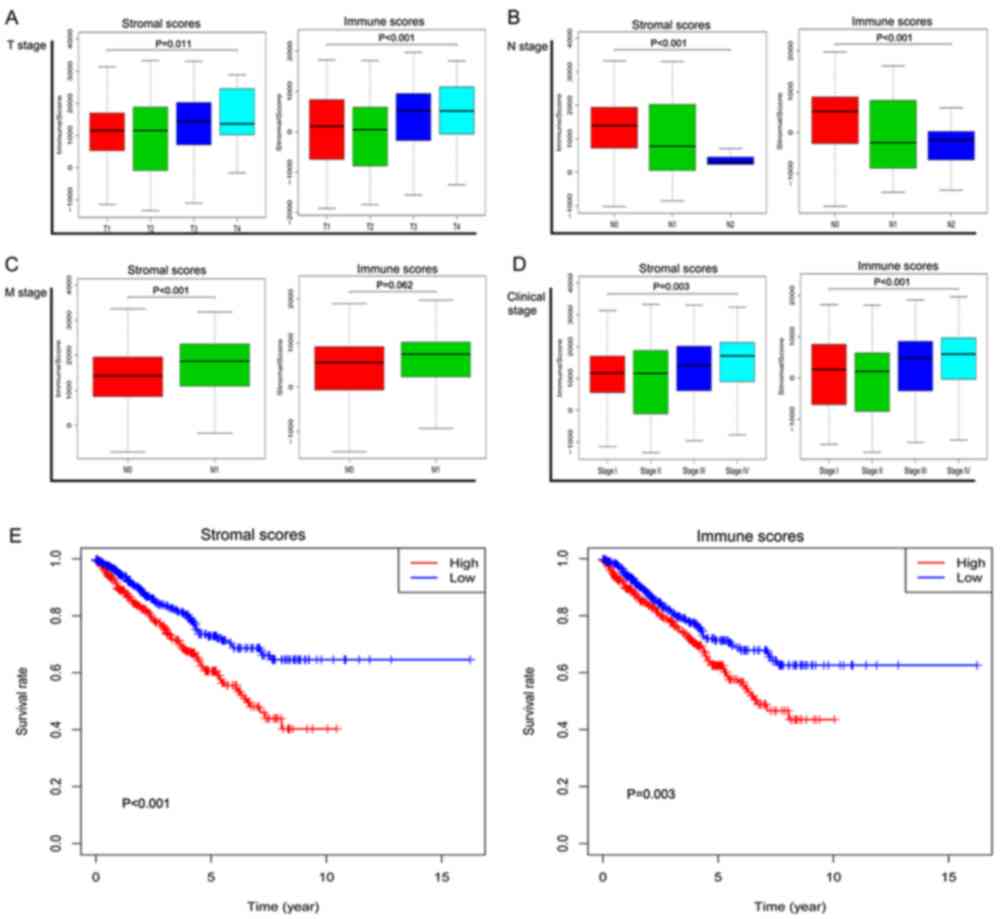
3,459.07 (data not shown). As presented in Fig. 1A-D, apart from the M stage, the
immune scores were significantly associated with T, N and clinical
stage (P<0.001; P<0.001; P<0.001, respectively).
Similarly, the stromal scores significantly increased with
increasing T, N, M and clinical stage (P=0.011; P<0.001;
P<0.001; P=0.003, respectively).
Immune/stromal scores were
significantly associated with overall survival rate
Patients with RCC were divided into high- and
low-groups based on their scores. As presented in Fig. 1E, the overall survival rate of the
low-stromal score group was more favorable compared with the
high-score group (P<0.001). Patients with high immune scores
should theoretically have an improved survival rate, but the
statistical results revealed that the survival rate of the
high-immune score group was lower compared with the low immune
score group (P=0.003).
Differentially expressed genes based
on immune/stromal scores
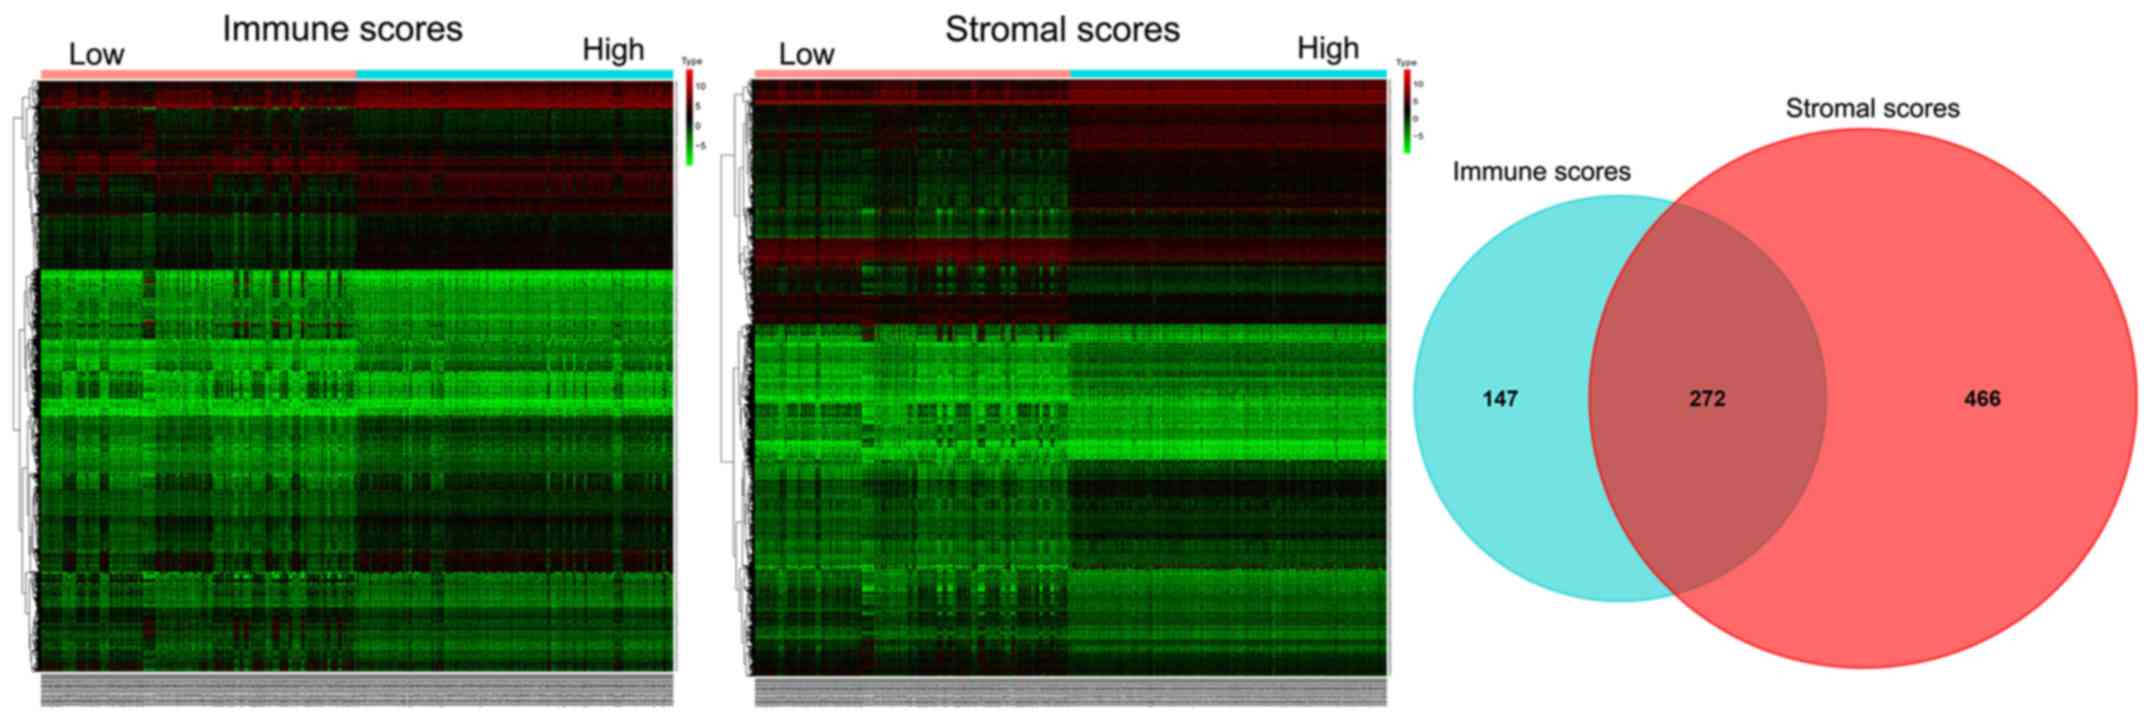
The heatmaps in Fig.
2 present the genes with significant differential expression
levels between the high- and low-immune/stromal score groups. A
total of 141 genes were upregulated and 277 genes were
downregulated in the high-immune score group compared with the low
score group (FC >2.0; P<0.05). Similarly, 327 genes were
upregulated and 410 genes were downregulated in the high stromal
score group compared with the low score group (FC >2.0;
P<0.05). In addition, the Venn diagram demonstrated that there
were 272 common DEGs shared between the high-immune score group and
low-stromal score groups.
Prognostic value of differentially
expressed genes in overall survival rate prediction
As presented in Table
SI, among the 738 DEGs based on stromal scores, 406 DEGs were
significantly associated with overall survival rate (all
P<0.05). Among the 419 DEGs based on immune scores, a total of
252 DEGs were significantly associated with overall survival rate
(P<0.05). Among the 272 common DEGs, a total of 137 DEGs were
significantly associated with overall survival rate
(P<0.05).
Functional enrichment analysis of
differentially expressed genes
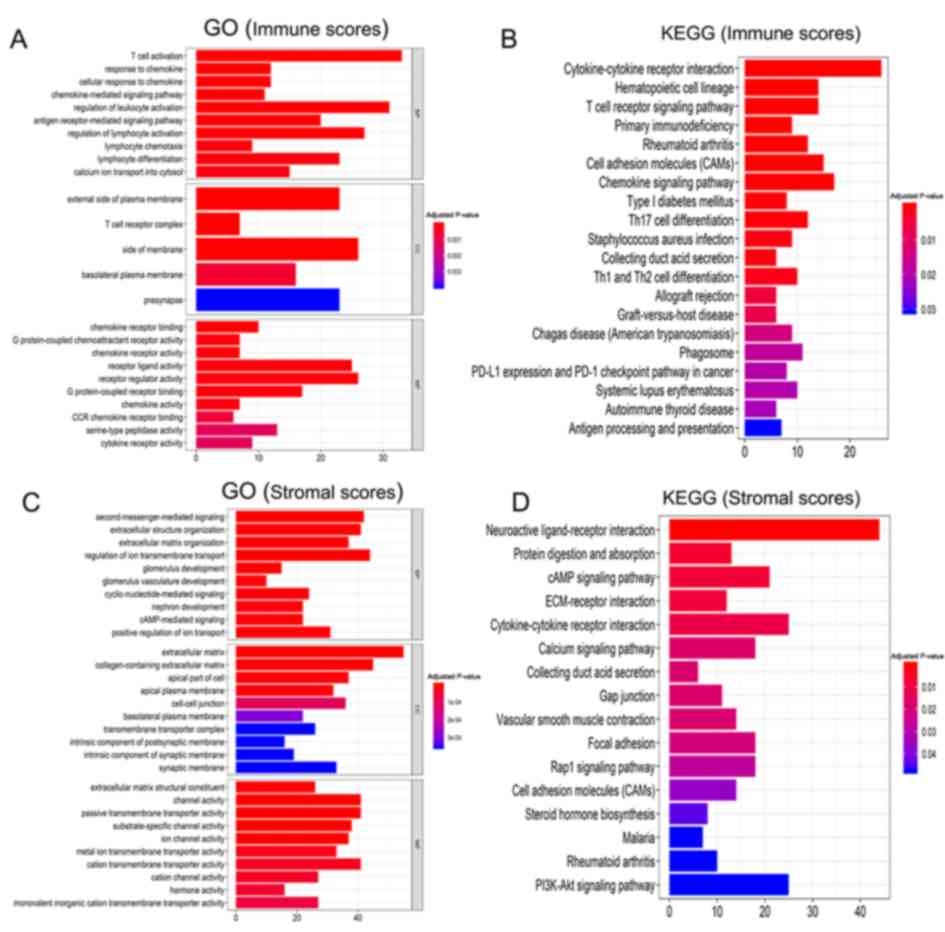
GO analysis of the immune scores demonstrated a
strong association with the ‘immune response’ (Fig. 3A). The BP terms were primarily
enriched in ‘T cell activation’, ‘response to chemokine’, ‘cellular
response to chemokine’, etc. The CC terms primarily included
‘external side of plasma membrane’, ‘T cell receptor complex’,
‘side of membrane’, etc. Top MF terms included ‘chemokine receptor
binding’ ‘G protein-coupled chemoattractant receptor activity’,
etc. The KEGG pathway analysis revealed that a number of these
pathways were associated with the immune response (Fig. 3B), including the ‘T cell receptor
signaling pathway’, ‘Th1/Th2 cell differentiation’,
‘cytokine-cytokine receptor interactions’ and the ‘chemokine
signaling pathway.’
Similarly, the BP terms based on stromal scores were
primarily enriched in ‘extracellular structure organization’ and
‘regulation of cell migration and proliferation’ (Fig. 3C). The CC terms primarily included
‘second-messenger-mediated signaling’, ‘extracellular structure
organization’, ‘extracellular matrix organization’, etc. Top MF
terms included ‘extracellular matrix’, ‘collagen-containing
extracellular matrix’, ‘apical part of cell’, etc. The KEGG pathway
analysis identified pathways associated with ‘PI3K-Akt signaling
pathway’, ‘calcium signaling’, ‘protein digestion and absorption’,
‘Rap1 signaling pathway’ and ‘cAMP signaling’ (Fig. 3D).
PPI networks and hub genes
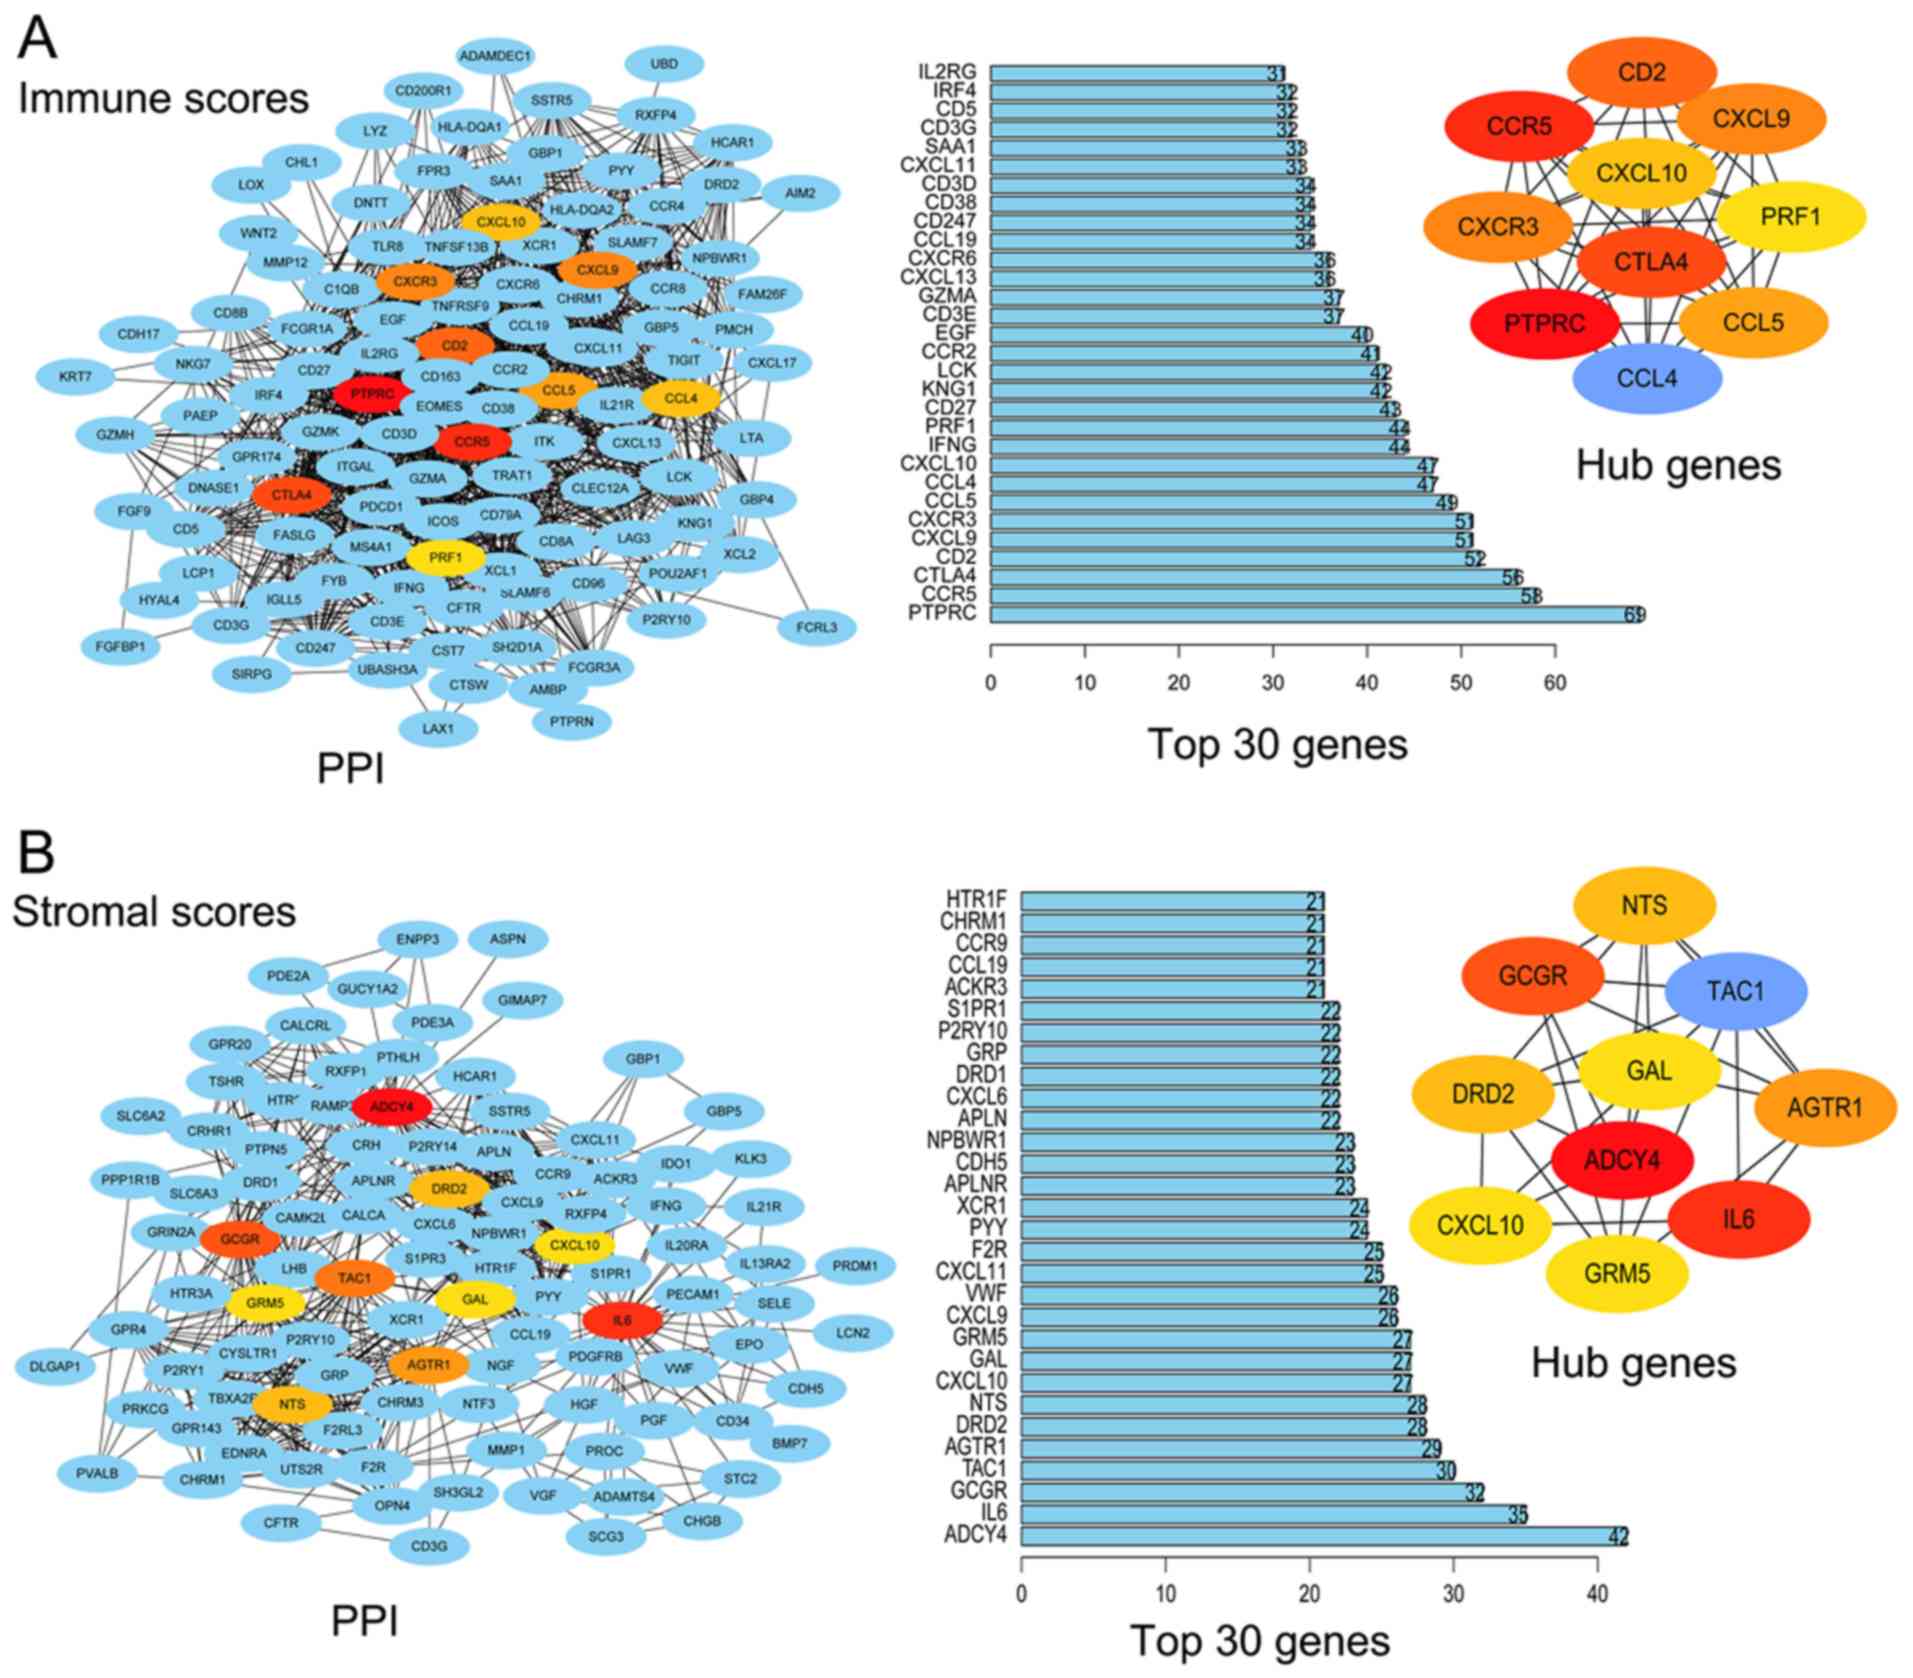
The hub nodes in the regulation network were
identified using Cytoscape software. Fig. 4A presents the PPI network of DEGs
based on immune scores and displays the top 30 DEGs in the network.
The top 10 noteworthy nodes were considered hub genes, including
PTPRC, CCR5, CTLA4, CD2, CXCR3, CXCL9, CCL5, CCL4, CXCL10 and PRF1.
Similarly, Fig. 4B presents the PPI
network of DEGs based on stromal scores and the top 30 DEGs in the
network. The top 10 hub genes were ADCY4, IL6, GCGR, TAC1, AGTR1,
DRD2, NTS, CXCL10, GRM5 and GAL. The results of the log-rank test
demonstrated that all the top 10 hub genes based on immune scores
and all of the top five hub genes based on stromal scores were
significantly associated with overall survival rate (Table I).
 | Table I.List of hub genes that are
significantly associated with overall survival rate of patients
with renal cell carcinoma. |
Table I.
List of hub genes that are
significantly associated with overall survival rate of patients
with renal cell carcinoma.
| A, immune
scores |
|---|
|
|---|
| Hub genes | P-value |
|---|
| CTLA4 | <0.001 |
| CCL5 | <0.001 |
| CXCL9 | <0.001 |
| CXCR3 | <0.001 |
| CD2 | <0.001 |
| PRF1 | <0.001 |
| CCL4 | <0.001 |
| CXCL10 | <0.001 |
| CCR5 | 0.003 |
| PTPRC | 0.026 |
|
| B, stromal
scores |
|
| Hub
genes | P-value |
|
| IL6 | <0.001 |
| CXCL10 | <0.001 |
| NTS | 0.014 |
| GRM5 | 0.015 |
| ADCY4 | 0.026 |
Building a prognostic classifier using
the LASSO Cox regression model
A LASSO Cox regression model was used to construct a
prognostic classifier by selecting 6 genes from the 137 common
prognostic DEGs, including IL21R, ATP6V1C2, GBP1, P2RY10, GBP4 and
TNNC2 (Fig. 5A). The risk score
based on the expression levels of the 6 genes for each patient was
calculated using the constructed Cox regression model. According to
the optimum cut-off score (risk score =0.472), the patients were
divided into high-risk and low-risk groups (AUC=0.776; Fig. 5B). The 6 gene based classifier was a
powerful prognostic factor in the training set [hazard ratio (HR),
2.8; confidence interval (CI), 2.3–3.4; P<0.001; Fig. 5C] and in the testing set (HR, 2.3;
CI, 1.6–3.4; P<0.001; Fig. 5D).
The survival rate of the low-risk score group was more favorable
compared with that of the high-risk score group. These results
suggested that this classifier effectively predicted the prognosis
of patients with RCC.
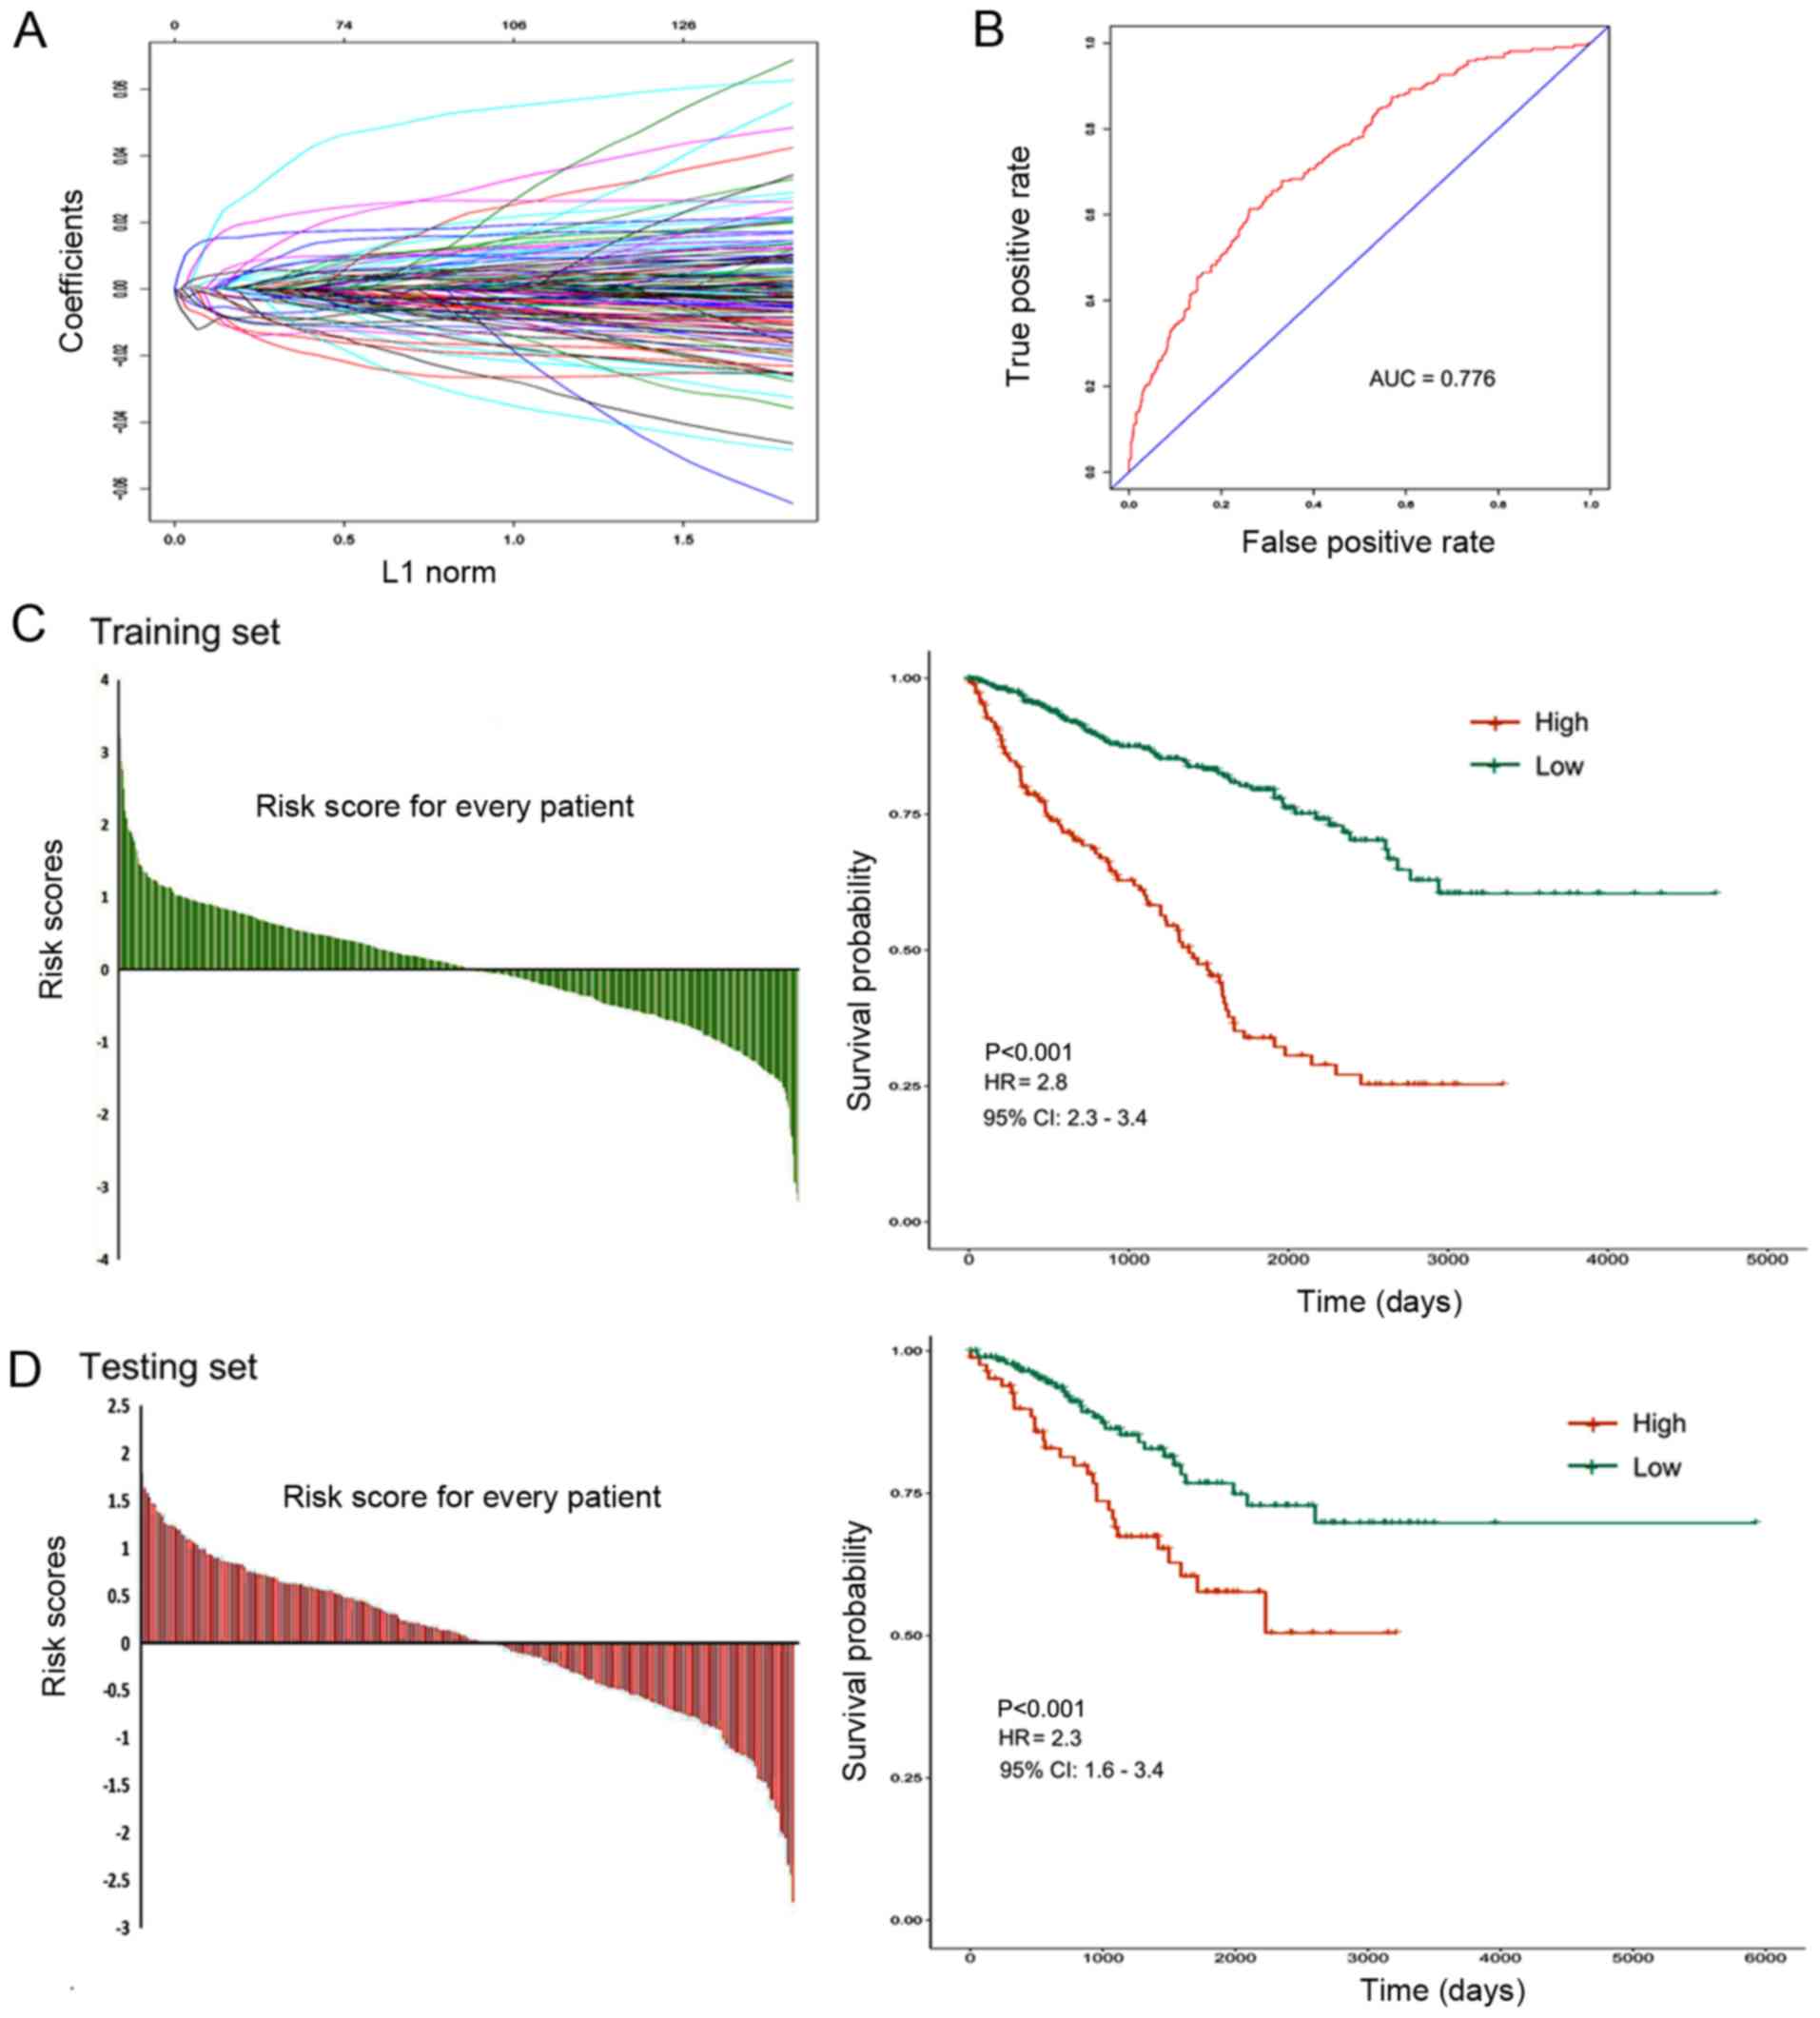 | Figure 5.Construction of the 6 gene based
prognostic classifier. (A) LASSO Cox regression model was used to
build a prognostic classifier that contained 6 genes: IL21R,
ATP6V1C2, GBP1, P2RY10, GBP4 and TNNC2. (B) The receiver operating
characteristic AUC curve was used to measure the predictive
accuracy of the 6-gene-based classifier (AUC=0.776). (C and D)
Training and testing sets were divided into high-risk and low-risk
groups according to the optimum cut-off score (risk score=0.472).
The 6 gene based classifier was a valuable prognostic factor in the
training set (HR 2.8; CI, 2.3–3.4; P<0.001) and in the testing
set (HR, 2.3; CI, 1.6–3.4; P<0.001). L1, Manhattan Distance;
ROC, receiver operating characteristic; AUC, area under the curve;
HR, hazard ratio; CI, confidence interval. |
Clinical predictive model based on
prognostic genes in RCC
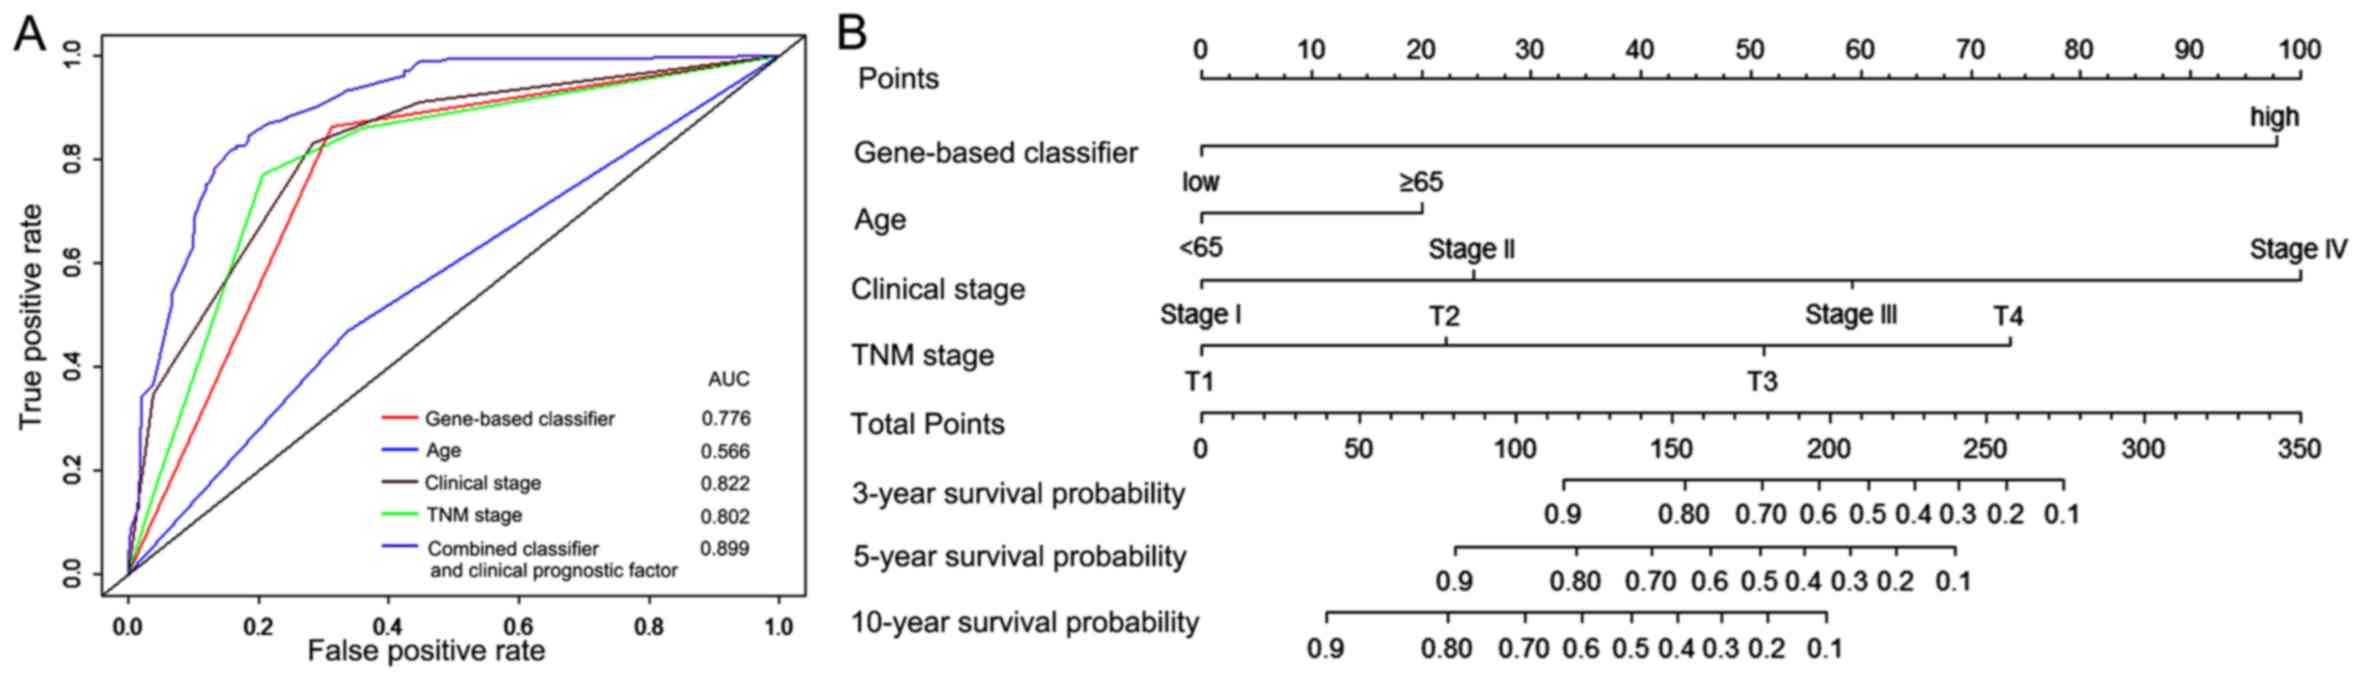
As presented in Fig.
6A, the 6 gene based classifier demonstrated a similar
prognostic accuracy to other clinical prognostic factors. The AUC
values of gene based classifier, age, clinical stage and TNM stage
were 0.776, 0.566, 0.822 and 0.802, respectively. The AUC of the
combined classifier and clinical prognostic factors was 0.899,
thus, this classifier had value in improving the accuracy of
prognosis prediction of patients with RCC. To provide clinicians
with a quantitative tool to predict prognosis of patients with RCC,
a nomogram was constructed that combined the 6 gene based
classifier and clinicopathological prognostic factors (Fig. 6B).
Discussion
RCC is one of the most common primary renal
malignancies (1). Personalized data
from RCC specimens can provide doctors with more accurate
information to select the appropriate treatment for patients
(5). The interaction between tumor
cells and the tumor microenvironment substantially affects the
evolution of tumors, which subsequently affects tumor recurrence,
drug resistance and overall survival rate of patients (23). There is an association between the
components in the tumor microenvironment and tumor outcomes
(24). Different tumor
microenvironmental compositions lead to differences in sensitivity
to different targeted drug therapies (25). Therefore, analyzing the components in
the tumor microenvironment can provide guidance for selecting the
best clinical treatment options for the patient. At present, gene
expression profiling has been increasingly incorporated into
clinical diagnostic criteria (6).
Molecular biomarkers should be considered in addition to standard
clinicopathologic criteria to guide clinical treatment options.
With the rapid development of high-throughput
sequencing, tumor databases with large samples, such as TCGA,
provide a wealth of information to help find ways to solve
difficult clinical problems, such as improving diagnostic rates and
choosing targeted drugs (26). The
present study aimed to identify tumor microenvironment-associated
genes that were associated with the overall survival rate of
patients with RCC. In the tumor microenvironment, immune and
stromal cells are two major types of non-tumor components that are
valuable for the diagnosis and prognosis of tumors (27). The ESTIMATE algorithm is a useful
tool to extract the genetic information of immune and stromal cells
from a complex tumor microenvironment in order to identify the
degree of infiltration of immune and stromal cells (28). Based on ESTIMATE scores, the present
study aimed to evaluate the association between gene expression
signatures of immune/stromal infiltration and RCC outcomes. In
particular, a set of DEGs involved in the immune response and
related to the extracellular matrix were identified. GO term
analysis demonstrated that the majority of these DEGs were involved
in the organization and regulation of the tumor microenvironment.
It has been reported that the function of immune cells and
extracellular matrix molecules are involved in the establishment of
the tumor microenvironment of RCC (29).
The immune components in the tumor microenvironment
are complex (30). Although immune
cell infiltration has been associated with response to immune
checkpoint blockade in metastatic kidney cancer (31), it is difficult to predict prognosis
of patients with cancer using one or several indicators. In the
present study, by analyzing the clinical data, gene expression
profiles and immune scores of 885 patients with RCC, it was
demonstrated that the average immune scores significantly increased
with increasing T, N stage and clinical stage, but were not
associated with M stage. In addition, notable differences in
overall survival rate based on immune gene expression signatures
were observed. The presence of immune cells serves a role in
killing tumor cells and inhibiting tumor growth, therefore, cases
with high immune scores should theoretically have an improved
survival. However, the present study demonstrated that patients
with high-immune scores had less favorable survival rate when
compared with those with low-immune scores. This result warrants
further in-depth investigation, and such a study may identify a
novel direction for immunotherapy in kidney cancer.
Non-immune cell components in the tumor
microenvironment also affect the therapeutic response (32). In kidney cancer, the expression
levels of transforming growth factor β signaling in fibroblasts
surrounding the tumor are associated with immunologically-excluded
phenotypes and a lack of response to immune checkpoint inhibition
(33). Fibroblasts and other matrix
components may also contribute to direct rejection or inactivation
of chemotherapy (34). Based on the
ESTIMATE algorithm, the present study reported that stromal scores
are associated with TNM stage and clinical stage. The average
stromal scores were significantly increased with increasing T
stage, N, M stage and clinical stage. In addition, the overall
survival rate of the low stromal score group was more favorable
compared with that of the high score group. Stromal cells provide a
suitable environment for tumor growth and progression (35). Analyzing the expression profiles of
genes and identifying the underlying molecular mechanisms of gene
expression levels affecting the tumor matrix, promoting
tumorigenesis and development may provide novel insight into the
clinical diagnosis and treatment of kidney cancer.
The aim of precision medicine is to implement
personalized treatment based on the molecular characteristics of
the patient (36). The present study
aimed to identify a set of tumor microenvironment-associated genes
that could predict the outcomes of patients with RCC. By comparing
the gene expression levels low-score vs. high-score groups, a
series of DEGs were identified. Kaplan-Meier analysis demonstrated
that the 406 DEGs based on stromal scores and the 252 DEGs based on
immune scores were significantly associated with overall survival
rate in patients with RCC. The DEGs based on immune scores were
primarily enriched in ‘immune response’ and the DEGs based on
stromal scores were mainly enriched in ‘extracellular structure
organization’ and the ‘regulation of cell migration and
proliferation’. Notably, the present study identified 10 hub genes
based on immune scores and 5 hub genes based on stromal scores that
were significantly correlated with overall survival rate of
patients with RCC. These novel prognostic genes could be used as
potential biomarkers for the diagnosis and selection of clinical
treatment options for patients with RCC.
In order to investigate the prognostic value of
these DEGS, a LASSO Cox regression model was used to construct a 6
gene based classifier, which was demonstrated to be an effective
prognostic factor. The results of the statistical analysis
demonstrated that the survival rate in patients with low-risk
scores was higher compared with patients with high-risk scores.
These results indicate that the 6 gene based classifier had high
accuracy in predicting the prognosis of patients with RCC.
Furthermore, combining this classifier with other clinical
variables could lead to more accurate predictions of patient
survival. A nomogram combining this classifier and clinical risk
factors may aid clinicians in the prediction of prognosis of
patients with RCC.
In summary, the immune/stromal gene signatures of
RCC are associated with clinicopathological factors and overall
survival rate. The present study identified a set of tumor
microenvironment-associated genes that were associated with the
prognosis of patients with RCC. The classifier based on these tumor
microenvironment-associated genes had prognostic value in
predicting the prognosis of patients with RCC. Further study of
these genes may provide a comprehensive understanding of the
association between the tumor microenvironment and the prognosis of
RCC. Although validation in prospective trials is necessary, the
results of the present study suggest that transcriptional analysis
may be valuable to predict the prognosis of patients with RCC.
Supplementary Material
Supporting Data
Acknowledgements
The authors would like to thank Dr. Chen (Sun
Yat-sen University, China) for providing R language software.
Funding
The present study was supported by The National
Natural Science Foundation of China (grant no. 81702516).
Availability of data and materials
The results published in the present study are based
upon data generated by the TCGA Research Network (http://cancergenome.nih.gov/).
Authors contributions
SSC contributed to conception, data analysis, and
final approval of the version to be published. SW contributed to
the data analysis. XGZ and XLC made substantial contributions to
data analysis and revising the manuscript critically for important
intellectual content. XJS and SSC were involved in drafting the
manuscript and contributed to the data analysis. All authors read
and approved the final manuscript.
Ethics approval and consent to
participate
Not applicable.
Patient consent for publication
Not applicable.
Competing interests
The authors declare that they have no competing
interests.
Glossary
Abbreviations
Abbreviations:
|
RCC
|
renal cell carcinoma
|
|
DEGs
|
differentially expressed genes
|
|
GO
|
Gene Ontology
|
|
BP
|
biological processes
|
|
MF
|
molecular functions
|
|
CC
|
cellular components
|
|
KEGG
|
Kyoto Encyclopedia of Genes and
Genomes
|
|
PPI
|
protein-protein interaction
|
References
|
1
|
Siegel RL, Miller KD and Jemal A: Cancer
statistics, 2019. CA Cancer J Clin. 69:7–34. 2019. View Article : Google Scholar : PubMed/NCBI
|
|
2
|
Zhang Q, Shi J, Yuan F, Wang H, Fu W, Pan
J, Huang Y, Yu J, Yang J and Chen Z: Higher expression of XPF is a
critical factor in intrinsic chemotherapy resistance of human renal
cell carcinoma. Int J Cancer. 139:2827–2837. 2016. View Article : Google Scholar : PubMed/NCBI
|
|
3
|
Dos Santos M, Brachet PE, Chevreau C and
Joly F: Impact of targeted therapies in metastatic renal cell
carcinoma on patient-reported outcomes: Methodology of clinical
trials and clinical benefit. Cancer Treat Rev. 53:53–60. 2017.
View Article : Google Scholar : PubMed/NCBI
|
|
4
|
Chen L, Yuan L, Qian K, Qian G, Zhu Y, Wu
CL, Dan HC, Xiao Y and Wang X: Identification of biomarkers
associated with pathological stage and prognosis of clear cell
renal cell carcinoma by co-expression network analysis. Front
Physiol. 9:3992018. View Article : Google Scholar : PubMed/NCBI
|
|
5
|
Goto-Yamaguchi L, Yamamoto-Ibusuki M,
Yamamoto Y, Fujiki Y, Tomiguchi M, Sueta A, Takeshita T and Iwase
H: Therapeutic predictors of neoadjuvant endocrine therapy response
in estrogen receptor-positive breast cancer with reference to
optimal gene expression profiling. Breast Cancer Res Treat.
172:353–362. 2018. View Article : Google Scholar : PubMed/NCBI
|
|
6
|
Tse LA, Dai J, Chen M, Liu Y, Zhang H,
Wong TW, Leung CC, Kromhout H, Meijer E, Liu S, et al: Prediction
models and risk assessment for silicosis using a retrospective
cohort study among workers exposed to silica in China. Sci Rep.
5:110592015. View Article : Google Scholar : PubMed/NCBI
|
|
7
|
Gatto F, Blum KA, Hosseini SS, Ghanaat M,
Kashan M, Maccari F, Galeotti F, Hsieh JJ, Volpi N, Hakimi AA, et
al: Plasma glycosaminoglycans as diagnostic and prognostic
biomarkers in surgically treated eenal cell carcinoma. Eur Urol
Oncol. 1:364–377. 2018. View Article : Google Scholar : PubMed/NCBI
|
|
8
|
Wang SC, Wang ST, Liu HT, Wang XY, Wu SC,
Chen LC and Liu YW: Trichostatin A induces bladder cancer cell
death via intrinsic apoptosis at the early phase and Sp1-survivin
downregulation at the late phase of treatment. Oncol Rep.
38:1587–1596. 2017. View Article : Google Scholar : PubMed/NCBI
|
|
9
|
Sweis RF, Spranger S, Bao R, Paner GP,
Stadler WM, Steinberg G and Gajewski TF: Molecular drivers of the
non-T-cell-inflamed tumor microenvironment in urothelial bladder
cancer. Cancer Immunol Res. 4:563–568. 2016. View Article : Google Scholar : PubMed/NCBI
|
|
10
|
Chen F, Zhang Y, Bossé D, Lalani AA,
Hakimi AA, Hsieh JJ, Choueiri TK, Gibbons DL, Ittmann M and
Creighton CJ: Pan-urologic cancer genomic subtypes that transcend
tissue of origin. Nat Commun. 8:1992017. View Article : Google Scholar : PubMed/NCBI
|
|
11
|
Maniecki MB, Etzerodt A, Ulhøi BP,
Steiniche T, Borre M, Dyrskjøt L, Orntoft TF, Moestrup SK and
Møller HJ: Tumor-promoting macrophages induce the expression of the
macrophage-specific receptor CD163 in malignant cells. Int J
Cancer. 131:2320–2331. 2012. View Article : Google Scholar : PubMed/NCBI
|
|
12
|
Tsai S, McOlash L, Palen K, Johnson B,
Duris C, Yang Q, Dwinell MB, Hunt B, Evans DB, Gershan J, et al:
Development of primary human pancreatic cancer organoids, matched
stromal and immune cells and 3D tumor microenvironment models. BMC
Cancer. 18:3352018. View Article : Google Scholar : PubMed/NCBI
|
|
13
|
Garcia-Gomez A, Rodríguez-Ubreva J and
Ballestar E: Epigenetic interplay between immune, stromal and
cancer cells in the tumor microenvironment. Clin Immunol.
196:64–71. 2018. View Article : Google Scholar : PubMed/NCBI
|
|
14
|
Jia D, Li S, Li D, Xue H, Yang D and Liu
Y: Mining TCGA database for genes of prognostic value in
glioblastoma microenvironment. Aging (Albany NY). 10:592–605. 2018.
View Article : Google Scholar : PubMed/NCBI
|
|
15
|
Gan TQ, Chen WJ, Qin H, Huang SN, Yang LH,
Fang YY, Pan LJ, Li ZY and Chen G: Clinical value and prospective
pathway signaling of microRNA-375 in lung adenocarcinoma: A study
based on the Cancer Genome Atlas (TCGA), Gene Expression Omnibus
(GEO) and bioinformatics analysis. Med Sci Monit. 23:2453–2464.
2017. View Article : Google Scholar : PubMed/NCBI
|
|
16
|
Yoshihara K, Shahmoradgoli M, Martínez E,
Vegesna R, Kim H, Torres-Garcia W, Treviño V, Shen H, Laird PW,
Levine DA, et al: Inferring tumour purity and stromal and immune
cell admixture from expression data. Nat Commun. 4:26122013.
View Article : Google Scholar : PubMed/NCBI
|
|
17
|
Nagy Á, Lánczky A, Menyhárt O and Győrffy
B: Validation of miRNA prognostic power in hepatocellular carcinoma
using expression data of independent datasets. Sci Rep. 8:92272018.
View Article : Google Scholar : PubMed/NCBI
|
|
18
|
R Core Team, . 2012.R: A language and
environment for statistical computing. R Foundation for Statistical
Computing. (Vienna, Austria). Available online at
https://www.R-project.org/.
|
|
19
|
RStudio Team, . RStudio: Integrated
Development for R. RStudio, Inc.; Boston, MA: 2015, http://www.rstudio.com/
|
|
20
|
Haque M, Sarmah R and Bhattacharyya DK: A
common neighbor based technique to detect protein complexes in PPI
networks. J Genet Eng Biotechnol. 16:227–238. 2018. View Article : Google Scholar : PubMed/NCBI
|
|
21
|
Szklarczyk D, Gable AL, Lyon D, Junge A,
Wyder S, Huerta-Cepas J, Simonovic M, Doncheva NT, Morris JH, Bork
P, et al: STRING v11: Protein-protein association networks with
increased coverage, supporting functional discovery in genome-wide
experimental datasets. Nucleic Acids Res. 47(D1): D607–D613. 2019.
View Article : Google Scholar : PubMed/NCBI
|
|
22
|
Shannon P, Markiel A, Ozier O, Baliga NS,
Wang JT, Ramage D, Amin N, Schwikowski B and Ideker T: Cytoscape: A
software environment for integrated models of biomolecular
interaction networks. Genome Res. 13:2498–2504. 2003. View Article : Google Scholar : PubMed/NCBI
|
|
23
|
Patel H, Nilendu P, Jahagirdar D, Pal JK
and Sharma NK: Modulating secreted components of tumor
microenvironment: A masterstroke in tumor therapeutics. Cancer Biol
Ther. 19:3–12. 2018. View Article : Google Scholar : PubMed/NCBI
|
|
24
|
Chevrier S, Levine JH, Zanotelli VRT,
Silina K, Schulz D, Bacac M, Ries CH, Ailles L, Jewett MAS, Moch H,
et al: An Immune Atlas of Clear Cell Renal Cell Carcinoma. Cell.
169:736–749.e18. 2017. View Article : Google Scholar : PubMed/NCBI
|
|
25
|
Herting CJ, Chen Z, Pitter KL, Szulzewsky
F, Kaffes I, Kaluzova M, Park JC, Cimino PJ, Brennan C, Wang B, et
al: Genetic driver mutations define the expression signature and
microenvironmental composition of high-grade gliomas. Glia.
65:1914–1926. 2017. View Article : Google Scholar : PubMed/NCBI
|
|
26
|
Deng M, Brägelmann J, Schultze JL and
Perner S: Web-TCGA: An online platform for integrated analysis of
molecular cancer data sets. BMC Bioinformatics. 17:722016.
View Article : Google Scholar : PubMed/NCBI
|
|
27
|
Andreeva E, Bobyleva P, Gornostaeva A and
Buravkova L: Interaction of multipotent mesenchymal stromal and
immune cells: Bidirectional effects. Cytotherapy. 19:1152–1166.
2017. View Article : Google Scholar : PubMed/NCBI
|
|
28
|
Schelker M, Feau S, Du J, Ranu N, Klipp E,
MacBeath G, Schoeberl B and Raue A: Estimation of immune cell
content in tumour tissue using single-cell RNA-seq data. Nat
Commun. 8:20322017. View Article : Google Scholar : PubMed/NCBI
|
|
29
|
Ghatalia P, Gordetsky J, Kuo F, Dulaimi E,
Cai KQ, Devarajan K, Bae S, Naik G, Chan TA, Uzzo R, et al:
Prognostic impact of immune gene expression signature and tumor
infiltrating immune cells in localized clear cell renal cell
carcinoma. J Immunother Cancer. 7:1392019. View Article : Google Scholar : PubMed/NCBI
|
|
30
|
Dai J, Lu Y, Roca H, Keller JM, Zhang J,
McCauley LK and Keller ET: Immune mediators in the tumor
microenvironment of prostate cancer. Chin J Cancer. 36:292017.
View Article : Google Scholar : PubMed/NCBI
|
|
31
|
Kamal Y, Cheng C, Frost HR and Amos CI:
Predictors of disease aggressiveness influence outcome from
immunotherapy treatment in renal clear cell carcinoma.
OncoImmunology. 8:e15001062018. View Article : Google Scholar : PubMed/NCBI
|
|
32
|
Faurobert E, Bouin AP and Albiges-Rizo C:
Microenvironment, tumor cell plasticity, and cancer. Curr Opin
Oncol. 27:64–70. 2015. View Article : Google Scholar : PubMed/NCBI
|
|
33
|
Wang L, Wen W, Yuan J, Helfand B, Li Y,
Shi C, Tian F, Zheng J, Wang F, Chen L, et al: Immunotherapy for
human renal cell carcinoma by adoptive transfer of autologous
transforming growth factor beta-insensitive CD8+ T cells. Clin
Cancer Res. 16:164–173. 2010. View Article : Google Scholar : PubMed/NCBI
|
|
34
|
Li M, Li M, Yin T, Shi H, Wen Y, Zhang B,
Chen M, Xu G, Ren K and Wei Y: Targeting of cancer-associated
fibroblasts enhances the efficacy of cancer chemotherapy by
regulating the tumor microenvironment. Mol Med Rep. 13:2476–2484.
2016. View Article : Google Scholar : PubMed/NCBI
|
|
35
|
Raguraman R, Parameswaran S, Kanwar JR,
Khetan V, Rishi P, Kanwar RK and Krishnakumar S: Evidence of tumour
microenvironment and stromal cellular components in retinoblastoma.
Ocul Oncol Pathol. 5:85–93. 2019. View Article : Google Scholar : PubMed/NCBI
|
|
36
|
Zhang J, Späth SS, Marjani SL, Zhang W and
Pan X: Characterization of cancer genomic heterogeneity by
next-generation sequencing advances precision medicine in cancer
treatment. Precis Clin Med. 1:29–48. 2018. View Article : Google Scholar : PubMed/NCBI
|