Introduction
Pancreatic cancer (PC) is primarily associated with
diabetes, obesity, smoking and genetic conditions, such as germline
pathogenic variants and somatic pathogenic variants in DNA damage
repair (DDR) genes (1,2). Jaundice, weight reduction, back or
abdominal pain, deep-colored urine, pale-colored stools and
anorexia are the typical symptoms (3). However, at diagnosis, the cancer has
usually metastasized (4,5). The mortality rate of PC is high and
there were 411,600 PC-associated deaths globally in 2015 (6). Pancreatic adenocarcinoma (PAAD) is a
common type of PC, accounting for ~85% of all PC cases (7). The survival rate of PAAD is very low
and the 5-year survival rate was 5% in 2015 (8). A few prognostic indicators are now
available for PC, such as C-reactive protein/albumin ratio and
neutrophil/lymphocytes ratio (9,10).
Therefore, it is of great importance to investigate the prognostic
factors of PAAD for improved prediction.
It has been hypothesized that DNA methylation may
provide a link between environmental factors contributing to cancer
development (11). The stability of
the genome and gene expression levels are primarily maintained by a
pre-determined pattern of DNA methylation (12). It has been reported that DNA
hypermethylation has prognostic value and acts as independent
predictor of survival in other cancer types, such as head and neck
cancer (13). A previous study
reported an association between abnormal methylation of the
Reprimo gene and genetic instability and poor survival
following surgical resection in patients with PC (14). Hypermethylation of Cyclin D2 is also
frequently observed in PC (15).
Meanwhile, another study reported a significant difference in the
hypermethylation frequency of ALX4, BNC1, HIC1, SEPT9V2,SST,
TFPI2 and TAC1 between PAAD samples of stage I, II, III
and IV, and these genes are significantly associated with distant
metastasis of PAAD (16).
A number of clinical markers of PAAD survival have
been recognized, including stage at diagnosis, grading and
performance status and the treatment received, such as resection
versus no resection and chemotherapy vs. no chemotherapy (17–20). It
has also been reported that obesity and smoking are associated with
a less favorable prognosis of PC (21). Cigarette smoking is associated with
the development of ~20% of PC cases and is therefore a consistent
risk factor (22). Bioinformatic
databases may serve as a valuable tool to further our understanding
of the molecular mechanisms underpinning the prognosis of patients
with cancer.
The present study aimed to explore the aberrant
methylation of genes associated with prognosis of patients with
PAAD. The methylation data of genes associated with PAAD were
obtained from The Cancer Genome Atlas (TCGA) database and screened
for differentially methylated genes (DMGs) associated with
prognosis. Subsequently, these data were used to construct a risk
score system, which may be effective in predicting the prognosis of
patients with PAAD.
Materials and methods
Datasets
The methylation data for the training dataset was
obtained from the TGCA database (accessed on 5th June
2018; cancer.gov/tcga), which were based on
the Illumina Infinium Human Methylation 450 BeadChip platform.
There were a total of 184 samples, 168 of which included prognostic
information [mean age, 64.89±11.24 years (range: 40–88); male:
female, 94/75; average overall survival time, 17.09±15.22 months;
death: survival, 88/80]. The methylation data for the validation
training set was obtained from the European Bioinformatics
Institute ArrayExpress database (ebi.ac.uk/arrayexpress/),
specifically the E-MTAB-5008 and E-MTAB-5571 datasets. The
E-MTAB-5008 dataset consisted of 29 PAAD samples with prognostic
information and the E-MTAB-5571 dataset consisted of 24 PAAD
samples which prognostic information. Both of these datasets were
sequenced on the platform of Illumina Infinium Human Methylation
450 BeadChip.
Screening of DMGs
To screen genes associated with PAAD prognosis,
samples in the TCGA dataset were divided into less favorable
prognosis (defined as a survival time <6 months and death) and
more favorable prognosis (defined as survival time >24 months or
alive) groups based on a previously described grouping method
(23). The methylation loci of genes
associated with PAAD prognosis were annotated and combined with the
platform annotation information on the Illumina Infinium Human
Methylation 450 BeadChip platform and the loci within CpG islands
of the genes were selected and used for the following analysis.
Using the limma package in R (version 3.34.7) (24), the DMGs between the less favorable
prognosis and more favorable prognosis groups were screened
according to the following criteria: |log fold change| >0.263
and false discovery rate (FDR) <0.05. Then, the Kernel density
curve of the DMGs was generated by calculating the Log 2 (FC).
Identification of co-methylated genes
based on Weighted Gene Co-expression Network Analysis (WGCNA)
Co-methylation analysis using the WGCNA package
(version 1.63) (25) in R was
performed on genes located in CpG islands to identify
differentially methylated CpG genes (DMCpGs). The sets of CpG genes
with highly related methylation levels under the same biological
process or in different tissues were considered as modules. The
modules which had a significant association with the methylation
levels were identified. The DMCpGs were mapped to the modules and
the significant enrichment parameters and fold enrichment were
calculated using a hypergeometric test (26). The DMCpGs enriched modules were
screened under the following criteria: P<0.05 and a fold
enrichment value of >1 was considered to indicate a
statistically significant difference. Genes in DMCpGs enriched
modules were recognized as key methylation genes and were analyzed
using Gene Ontology (GO) enrichment analysis (27) using the Database for Annotation,
Visualization and Integrated Discovery (version 6.8) (28).
To meet scale-free network distribution, the
weighting parameter ‘power’ in WGCNA algorithm was explored. When
the square of the correlation coefficient between log(k) and
log[p(k)] reached 0.9, the corresponding value of parameter ‘power’
(power=7) was selected. Under power=7, the mean connectivity of
genes was calculated to be 1. Subsequently, the adjacency matrix
elements were serialized, and the topological overlap matrix was
calculated to evaluate the correlation of gene methylation levels
and obtain a system clustering tree. According to the standards of
hybrid dynamic shear tree, pruning height (cutHeight) and the
minimum number of module genes (minSize) separately were set as
0.95 and 50.
Correlation analysis for the
expression levels and methylation levels of key methylated
genes
The expression and methylation levels of key
methylation genes in matched training PAAD samples were collected
and correlation analysis was performed. Pearson correlation
coefficients (PCCs) were calculated and the cor.test function
(stat.ethz.ch/R-manual/R-devel/library/stats/html/cor.test.html)
in R Software was used (29,30). PCCs of single genes were also
calculated and the genes with a negative correlation between
expression level and methylation level were selected as key
methylation genes for subsequent analyses. P<0.05 was considered
to indicate a statistically significant difference.
Identification of the methylated genes
associated with prognosis
Key methylation genes with a negative correlation
between expression level and methylation level were further
analyzed for prognosis associated genes. Univariate Cox regression
analysis was performed to identify prognosis associated methylation
genes using the survival package (version 2.41–1) in R (31). P<0.05 was considered to indicate a
statistically significant difference.
Construction of risk score prognostic
prediction system
The optimal combination of prognosis related
methylation genes was screened using the Cox-Proportional Hazards
(Cox-PH) model using the penalized package (version 0.9–50) in R
(32). The optimal parameter of
‘lambda’ in the Cox-PH model was calculated through 1,000
cross-validation likelihoods (cvl) (33).
The risk score prognostic prediction system was
constructed combining the Cox-PH prognosis coefficients and
methylation levels of the selected optimized genes. The resultant
formula was: Risk score=∑coef gene × Methylation
gene where Coefgene and
Methylationgene represented regression coefficient and
gene methylation levels, respectively.
The risk scores of samples in the TCGA, E-MTAB-5008
and E-MTAB-5571 datasets were calculated and stratified into high
and low risk groups according to the median risk scores.
Kaplan-Meier (KM) survival curves (34) of the high and low samples were
plotted using the survival package, which were compared with the
prognosis of all samples. The area under the receiver operating
characteristic (ROC) curve (AUC) was compared, also using the
survival package.
Correlation analysis between
independent prognostic factors and risk score prognostic prediction
system
Using the Cox regression analysis in the survival
package (31), independent clinical
prognostic factors were screened. Next, the relations between
collected factors and the risk score prognostic prediction system
were analyzed using KM curves.
Results
Screening of DMGs
Median survival time of samples in the training
datasets was 17.09±15.22 months, which is consistent with the time
reported in PC (35). There were
13,903 methylation sites containing CpG islands in the training
dataset. In TCGA training dataset, based on the predefined method
for grouping, each less favorable and more favorable prognosis
group had 19 samples, and a total of 1,067 DMGs between the two
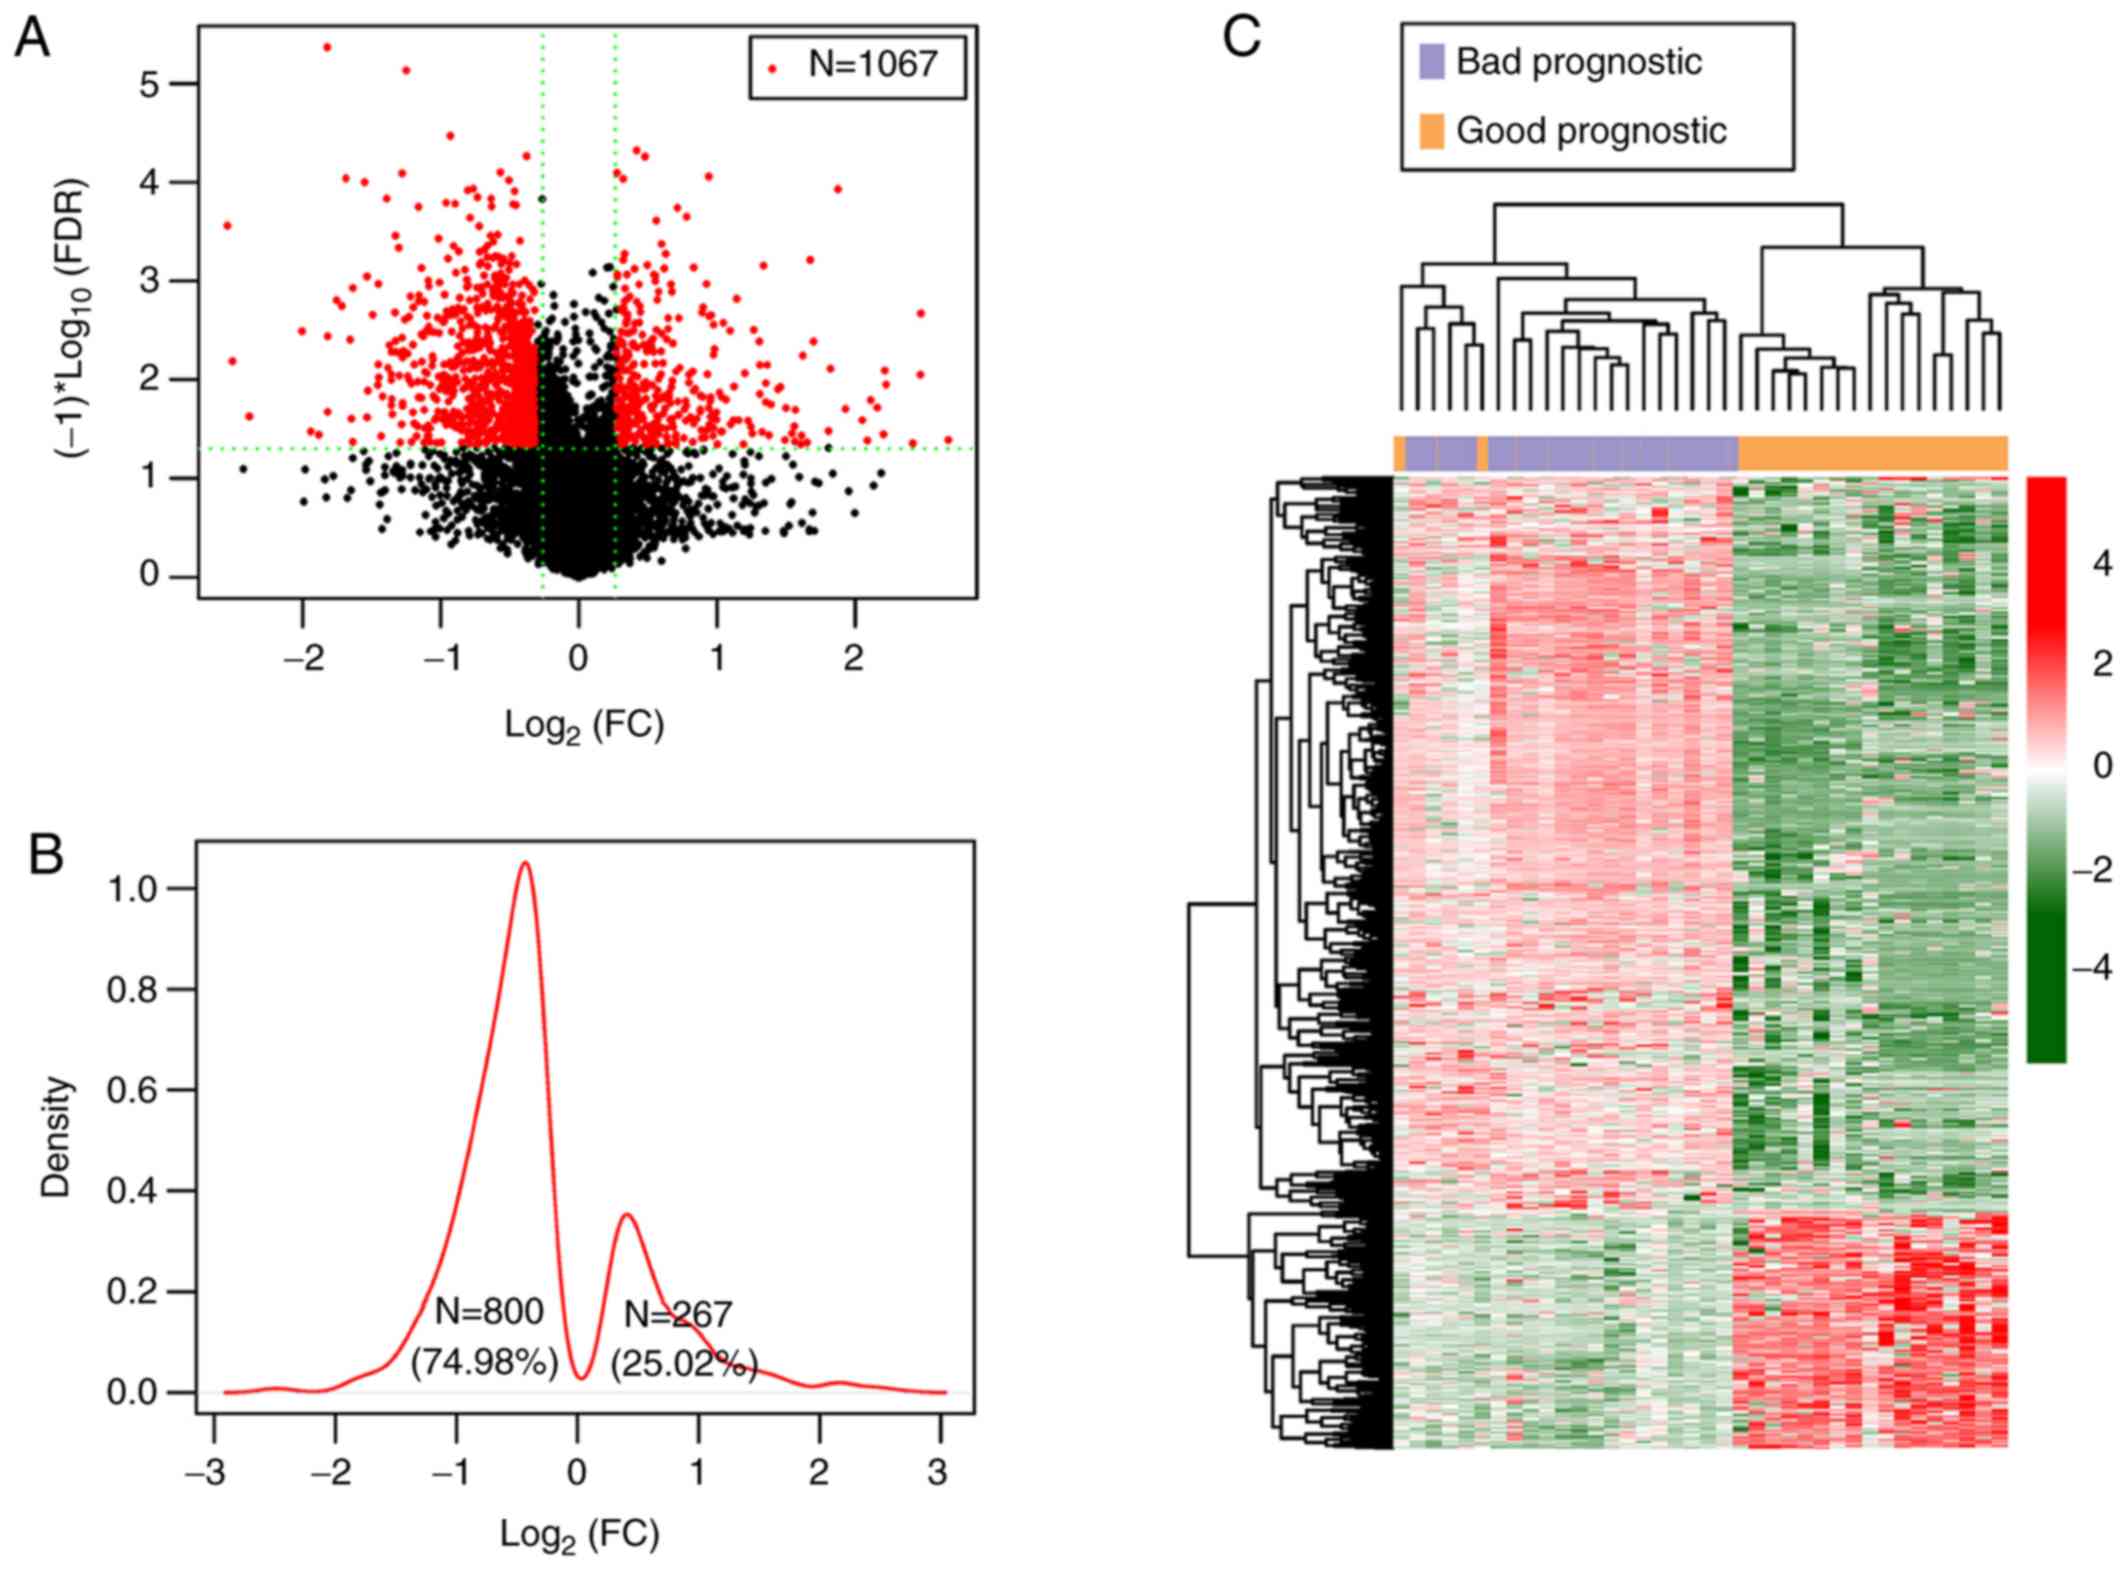
groups were identified (Fig. 1).
As shown in the Log2 Kernel density curve of the
DMGs, 74.98% (800/1,067) of DMGs were significantly hypomethylated
and 25.02% (267/1,067) were significantly hypermethylated in the
good prognostic group (Fig. 1B). The
cluster heatmap of the DMGs suggested that the samples with
different prognoses in the TCGA dataset exhibited different
methylation levels (Fig. 1C).
Furthermore, as the feature factors had different weights in the
calculation process for heatmap analysis, there was a slight
crossover between good and bad prognosis samples.
Among the CpGs in the 1,067 DMGs, 309, 321, 118, 44,
185 and 90 CpGs were separately located in transcription start site
areas, body areas, 5′untranslated regions (UTR), 3′UTR regions,
promoter regions and the first exon regions (data not shown). The
top 20 DMGs with smaller FDR values were screened and presented in
Table I.
 | Table I.Top 20 differentially methylated
genes with significance. |
Table I.
Top 20 differentially methylated
genes with significance.
| Methylation
loci | Chr. | Position | Genes | Location | β-bad | β-good | Effect | P-value | FDR |
|---|
| cg24902557 | chr14 | 104786509 | BTBD6 | Promoter | 0.3277 | 0.0926 | −1.8239 |
5.24×10⁻⁷a |
4.25×10⁻⁶ |
| cg27106909 | chr16 | 30014398 | YPEL3 | Promoter | 0.3150 | 0.1325 | −1.2489 |
8.88×10⁻⁷a |
7.20×10⁻⁶ |
| cg25207224 | chr6 | 34319167 | HMGA1 | Body | 0.5645 | 0.7547 | 0.4188 |
5.80×10⁻⁶a |
4.70×10⁻⁵ |
| cg27543607 | chr16 | 88289602 | CDK10 | 3′UTR | 0.6878 | 0.5288 | −0.3791 |
6.59×10⁻⁶a |
5.34×10⁻⁵ |
| cg27058889 | chr1 | 55237413 | BSND | 1stExon | 0.5441 | 0.7574 | 0.4772 |
6.71×10⁻⁶a |
5.44×10⁻⁵ |
| cg21197594 | chr9 | 139776802 | EHMT1 | Body | 0.7238 | 0.4881 | −0.5683 |
9.65×10⁻⁶a |
7.82×10⁻⁵ |
| cg26789779 | chr5 | 37875700 | GDNF | TSS200 | 0.3598 | 0.1482 | −1.2801 |
9.92×10⁻⁶a |
8.04×10⁻⁵ |
| cg23066982 | chr6 | 26312442 |
HIST1H4E | Promoter | 0.2446 | 0.0759 | −1.6886 |
1.12×10⁻⁵a |
9.08×10⁻⁵ |
| cg27575890 | chr22 | 35237104 | EIF3D | Body | 0.3592 | 0.2527 | −0.5075 |
1.16×10⁻⁵a |
9.44×10⁻⁵ |
| cg24864161 | chr22 | 48870409 | MOV10L1 | TSS200 | 0.2022 | 0.0689 | −1.5531 |
1.21×10⁻⁵a |
9.84×10⁻⁵ |
| cg24460144 | chr5 | 149550073 | SLC6A7 | 5′UTR | 0.3093 | 0.1822 | −0.7637 |
1.43×10⁻⁵a |
1.16×10⁻⁴ |
| cg27576241 | chr1 | 153301194 | ADAM15 | Body | 0.5530 | 0.4002 | −0.4667 |
1.50×10⁻⁵a |
1.21×10⁻⁴ |
| cg23930825 | chr6 | 43721343 | RSPH9 | Body | 0.3502 | 0.2102 | −0.7365 |
1.74×10⁻⁵a |
1.41×10⁻⁴ |
| cg26432961 | chr6 | 41625040 | FOXP4 | 5′UTR | 0.7897 | 0.5080 | −0.6365 |
1.79×10⁻⁵a |
1.45×10⁻⁴ |
| cg27626790 | chr7 | 150305686 | KCNH2 | Body | 0.2627 | 0.1002 | −1.3909 |
1.80×10⁻⁵a |
1.45×10⁻⁴ |
| cg09730123 | chr16 | 1767949 | SPSB3 | Body | 0.4173 | 0.3468 | −0.2670 |
1.81×10⁻⁵a |
1.47×10⁻⁴ |
| cg25499067 | chr8 | 23615933 | NKX2-6 | Body | 0.2310 | 0.1187 | −0.9606 |
1.97×10⁻⁵a |
1.60×10⁻⁴ |
| cg25902939 | chr19 | 18405350 | SSBP4 | Body | 0.4202 | 0.2254 | −0.8986 |
2.01×10⁻⁵a |
1.63×10⁻⁴ |
| cg27390009 | chr17 | 18091226 | FLII | Body | 0.5073 | 0.3645 | −0.4768 |
2.05×10⁻⁵a |
1.66×10⁻⁴ |
| cg24542766 | chr22 | 38043478 | RPL3 | Body | 0.3924 | 0.2856 | −0.4580 |
2.10×10⁻⁵a |
1.70×10⁻⁴ |
Identification of co-methylated genes
based on WGCNA
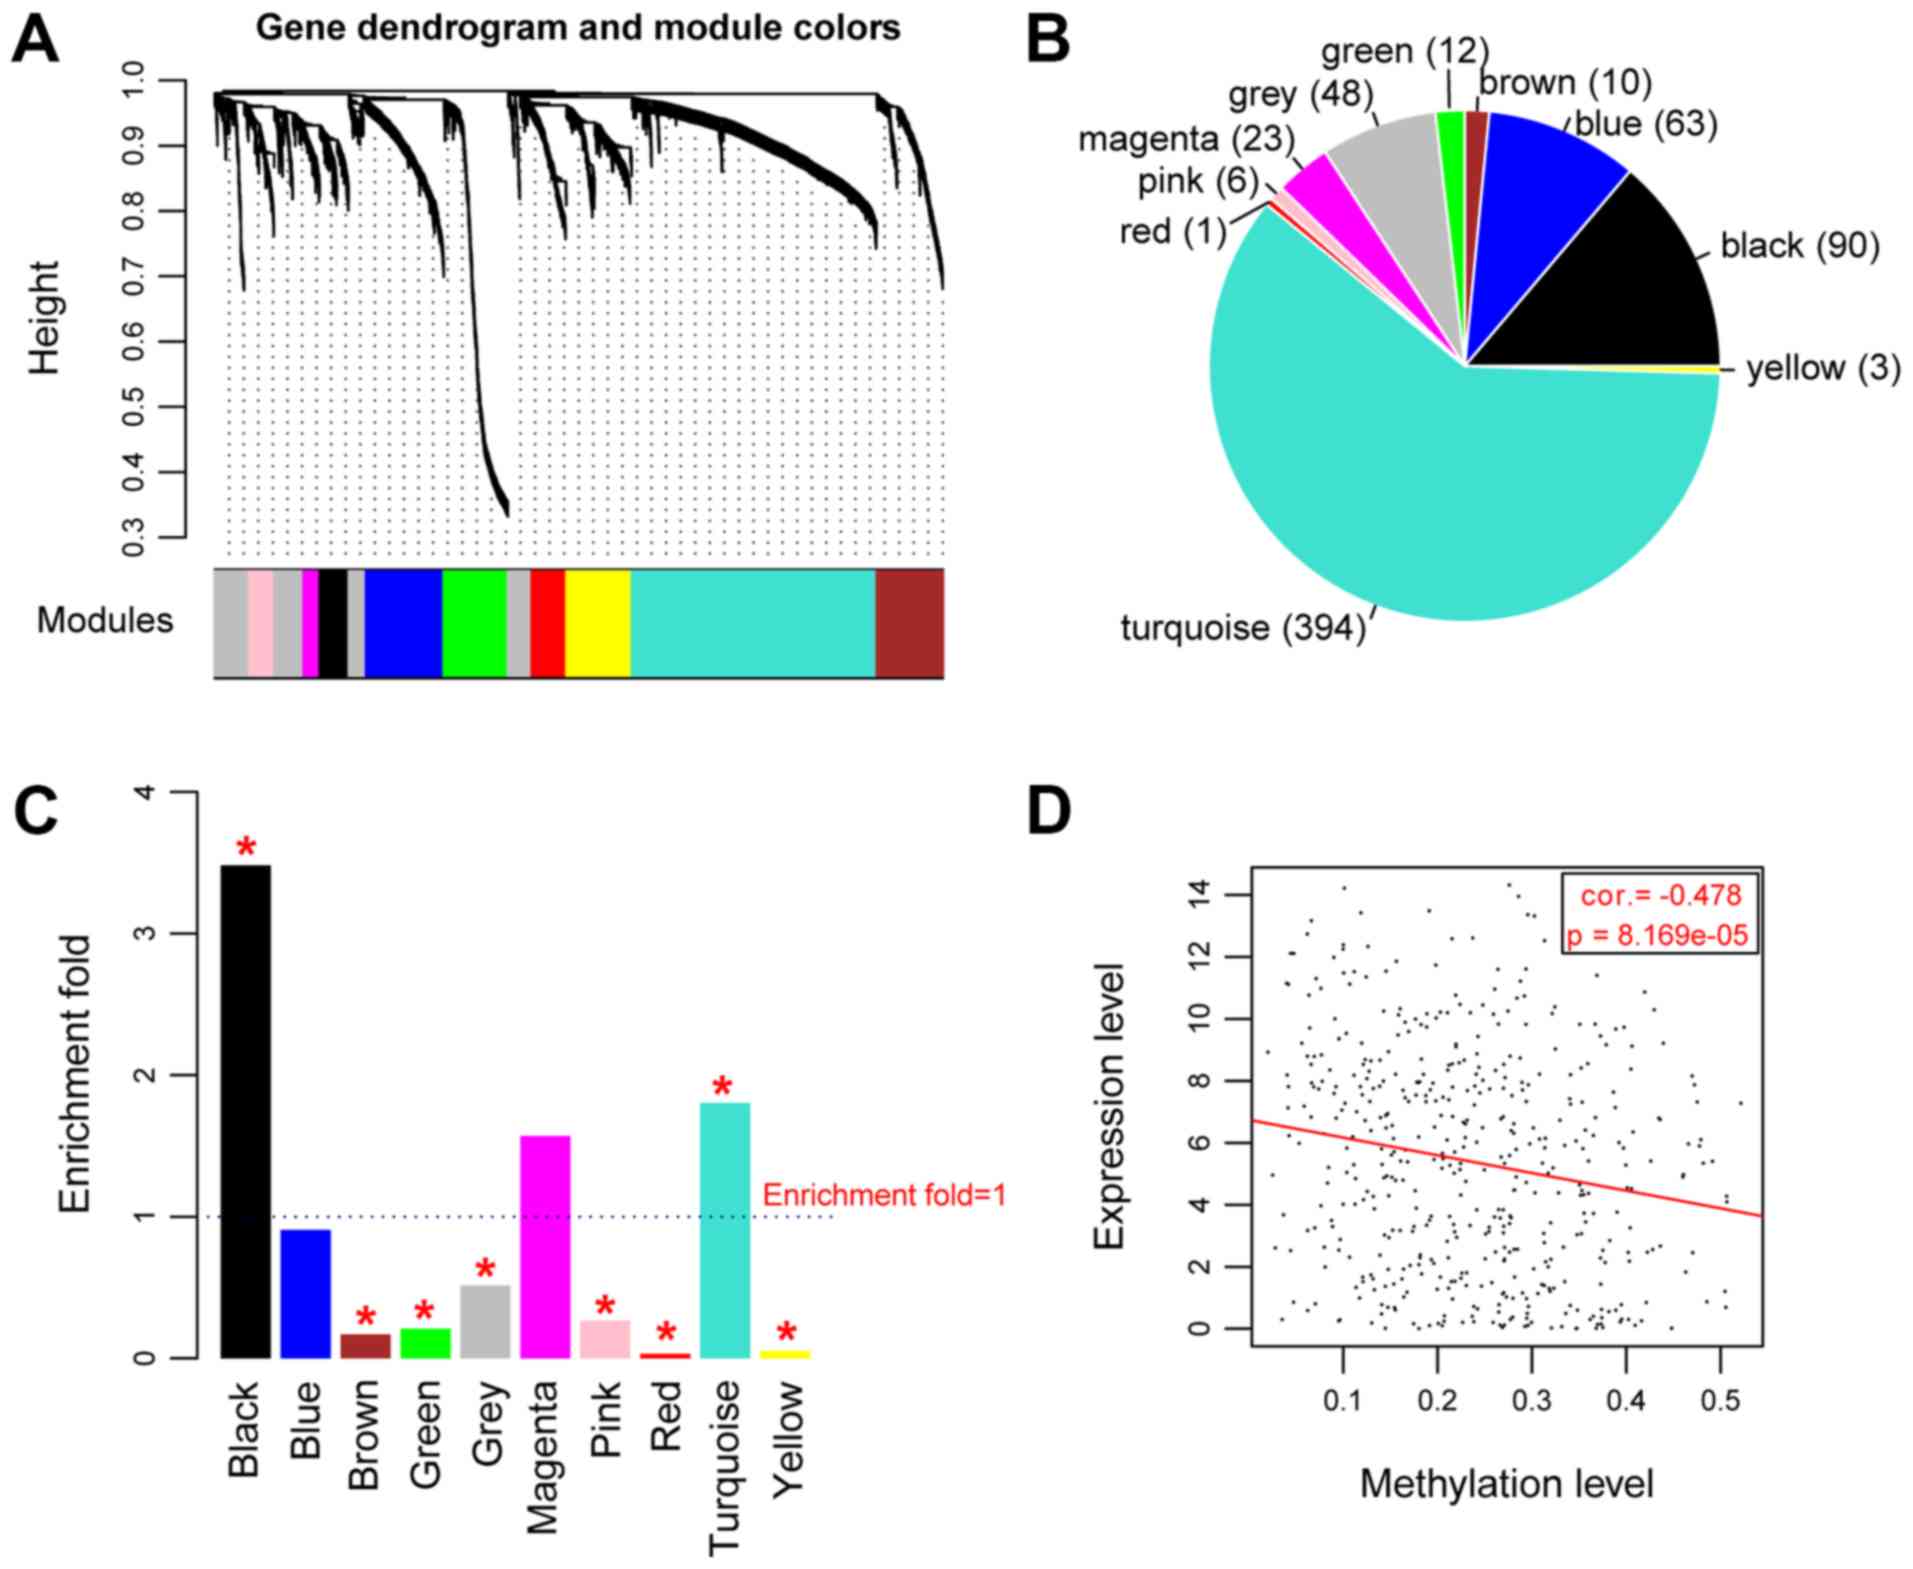
A total of 10 modules were identified (Fig. 2A) and the detailed information of
each module is listed in Table II.
CpG island genes in 9 modules showed significant a association with
methylation levels (P<0.05; correlation coefficients,
0.226–0.729; average correlation coefficient, 0.7742; Table II). The identified DMGs were mapped
into each module and their distribution in the modules is shown in
Fig. 2B. Two modules were identified
as differentially expressed CpG gene enriched modules, black module
(comprised of 90 DMGs) and the turquoise module (comprised of 394
DMGs), in which the CpG genes were significantly associated with
methylations. The DMGs in these two modules were significantly
enriched in 18 GO_Biology Process (BP; such as ‘neuron
differentiation’), 7 GO_cellular component (CC; such as ‘integral
to plasma membrane’), and 9 GO_molecular function (MF; such as
‘sequence-specific DNA binding’) terms (Table III) and were predominantly
associated with transcriptional regulation.
| Table II.A total of 10 modules identified by
weighted gene co-expression network analysis. |
Table II.
A total of 10 modules identified by
weighted gene co-expression network analysis.
| Modules | Count of CpGs | Correlation |
Pcorr | DMGs | Enrichment fold
(95% CI) |
Phyper |
|---|
| Black | 159 | 0.703 |
1.01×10⁻¹³ | 90 | 3.481
(2.622–4.599) |
2.20×10⁻¹⁶ |
| Blue | 427 | 0.587 |
1.68×10⁻⁴ | 63 | 0.908
(0.676–1.202) |
5.37×10⁻¹ |
| Brown | 364 | 0.551 |
2.23×10⁻³ | 10 | 0.169
(0.0799–0.317) |
4.83×10⁻¹³ |
| Green | 352 | 0.616 |
6.05×10⁻² | 12 | 0.209
(0.107–0.374) |
3.49×10⁻¹¹ |
| Grey | 574 | 0.226 |
1.32×10⁻¹ | 48 | 0.514
(0.371–0.701) |
5.31×10⁻⁶ |
| Magenta | 90 | 0.729 |
9.47×10⁻¹⁶ | 23 | 1.572
(0.941–2.529) |
7.38×10⁻² |
| Pink | 138 | 0.679 |
1.44×10⁻⁸ | 6 | 0.267
(0.0961–0.601) |
2.88×10⁻⁴ |
| Red | 191 | 0.308 |
6.69×10⁻⁷ | 1 | 0.0322
(0.000814–0.182) |
3.26×10⁻¹¹ |
| Turquoise | 1344 | 0.687 |
1.72×10⁻⁶ | 394 | 1.803
(1.564–2.077) |
4.11×10⁻¹⁶ |
| Yellow | 359 | 0.609 |
4.27×10⁻⁶ | 3 | 0.0514
(0.0105–0.152) |
2.20×10⁻¹⁶ |
| Table III.Functional terms enriched for the 484
differentially methylated genes involved in black or turquoise
modules. |
Table III.
Functional terms enriched for the 484
differentially methylated genes involved in black or turquoise
modules.
| A, Biological
process |
|---|
|
|---|
| Term | Count | P-value | FDR |
|---|
| GO:0030182-neuron
differentiation | 40 |
1.79×10⁻¹⁰a |
3.13×10⁻⁷ |
|
GO:0006355-regulation of transcription,
DNA-dependent | 95 |
4.27×10⁻¹⁰a |
7.45×10⁻⁷ |
|
GO:0051252-regulation of RNA metabolic
process | 96 |
6.29×10⁻¹⁰a |
1.10×10⁻⁶ |
| GO:0007423-sensory
organ development | 27 |
1.46×10⁻⁹a |
2.55×10⁻⁶ |
| GO:0007389-pattern
specification process | 28 |
8.94×10⁻⁹a |
1.56×10⁻⁵ |
| GO:0045165-cell
fate commitment | 20 |
1.20×10⁻⁸a |
2.10×10⁻⁵ |
|
GO:0048568-embryonic organ
development | 22 |
1.59×10⁻⁸a |
2.77×10⁻⁵ |
|
GO:0048598-embryonic morphogenesis | 28 |
1.66×10⁻⁷a |
2.90×10⁻⁴ |
|
GO:0007267-cell-cell signaling | 40 |
9.79×10⁻⁷a |
1.71×10⁻³ |
| GO:0006928-cell
motion | 34 |
1.66×10⁻⁶a |
2.90×10⁻³ |
|
GO:0045449-regulation of
transcription | 111 |
2.63×10⁻⁶a |
4.60×10⁻³ |
|
GO:0003002-regionalization | 20 |
3.02×10⁻⁶a |
5.27×10⁻³ |
|
GO:0007610-behavior | 33 |
3.54×10⁻⁶a |
6.18×10⁻³ |
| GO:0048666-neuron
development | 27 |
3.76×10⁻⁶a |
6.57×10⁻³ |
| GO:0031328-positive
regulation of cellular biosynthetic process | 42 |
4.11×10⁻⁶a |
7.17×10⁻³ |
| GO:0009891-positive
regulation of biosynthetic process | 42 |
5.85×10⁻⁶a |
1.02×10⁻² |
| GO:0016477-cell
migration | 23 |
1.16×10⁻⁵a |
2.02×10⁻² |
|
GO:0019226-transmission of nerve
impulse | 26 |
1.97×10⁻⁵a |
3.45×10⁻² |
|
| B, Cellular
component |
|
| Term | Count | P-Value | FDR |
|
| GO:0005887-integral
to plasma membrane | 59 |
9.12×10⁻⁷a |
1.21×10⁻³ |
|
GO:0031226~intrinsic to plasma
membrane | 59 |
1.89×10⁻⁶a |
2.50×10⁻³ |
| GO:0044459-plasma
membrane part | 90 |
2.93×10⁻⁶a |
3.88×10⁻³ |
| GO:0034703-cation
channel complex | 15 |
6.78×10⁻⁶a |
8.98×10⁻³ |
|
GO:0034705-potassium channel complex | 12 |
1.11×10⁻⁵a |
1.48×10⁻² |
|
GO:0008076-voltage-gated potassium channel
complex | 12 |
1.11×10⁻⁵a |
1.48×10⁻² |
| GO:0034702-ion
channel complex | 18 |
1.99×10⁻⁵a |
2.64×10⁻² |
|
| C, Molecular
function |
|
| Term | Count | P-value | FDR |
|
|
GO:0043565-sequence-specific DNA
binding | 58 |
4.65×10⁻¹⁶a |
6.55×10⁻¹³ |
|
GO:0003700-transcription factor
activity | 74 |
4.42×10⁻¹⁵a |
6.52×10⁻¹² |
|
GO:0030528-transcription regulator
activity | 85 |
3.53×10⁻¹⁰a |
5.18×10⁻⁷ |
| GO:0003677-DNA
binding | 109 |
2.11×10⁻⁸a |
3.09×10⁻⁵ |
| GO:0022836-gated
channel activity | 25 |
6.95×10⁻⁶a |
1.02×10⁻² |
| GO:0005261-cation
channel activity | 23 |
1.01×10⁻⁵a |
1.48×10⁻² |
| GO:0015267-channel
activity | 29 |
1.41×10⁻⁵a |
2.07×10⁻² |
| GO:0022803-passive
transmembrane transporter activity | 29 |
1.48×10⁻⁵a |
2.18×10⁻² |
| GO:0005216-ion
channel activity | 27 |
3.37×10⁻⁵a |
4.94×10⁻² |
Correlation analysis of the expression
levels and methylation levels of key methylated genes
Overall, the methylation levels and expression
levels of the 484 DMGs in the black and turquoise modules were
significantly negatively correlated (Cor.=−0.478,
P=8.169×10⁻⁵; Fig. 2D). A
total of 192 DMGs exhibited negative correlation between the
expression levels and methylation levels (Table SI).
Construction of the risk score
system
A total of 50 genes among the 192 DMGs were found to
be associated with prognosis. Following this, a Cox-PH model was
utilized to screen the optimal gene combination. When λ=1.1389, the
maximum value of cvl was obtained as −458.1914 (Fig. 3A). Using λ=1.1389, a 12-gene optimal
combination was acquired: CCAAT/enhancer binding protein α
(CEBPα); histone cluster 1 H4E (HIST1H4E); STAM
binding protein-like 1, (STAMBPL1) phospholipase D3
(PLD3); centrosomal protein 55 (CEP55); ssDNA binding
protein 4 (SSBP4); glutamate AMPA receptor subunit 1
(GRIA1); switch-associated protein 70 (SWAP70);
adenylate-cyclase activating polypeptide 1 receptor 1
(ADCYAP1R1); yippee-like 3 (YPEL3); homeobox C4
(HOXC4); and insulin-like growth factor binding protein 1
(IGFBP1) (Fig. 3B; Table IV). Combined with the prognostic
coefficients of these 12 optimal genes, the following risk score
system was constructed (cg is the methylation ID for corresponding
genes.).
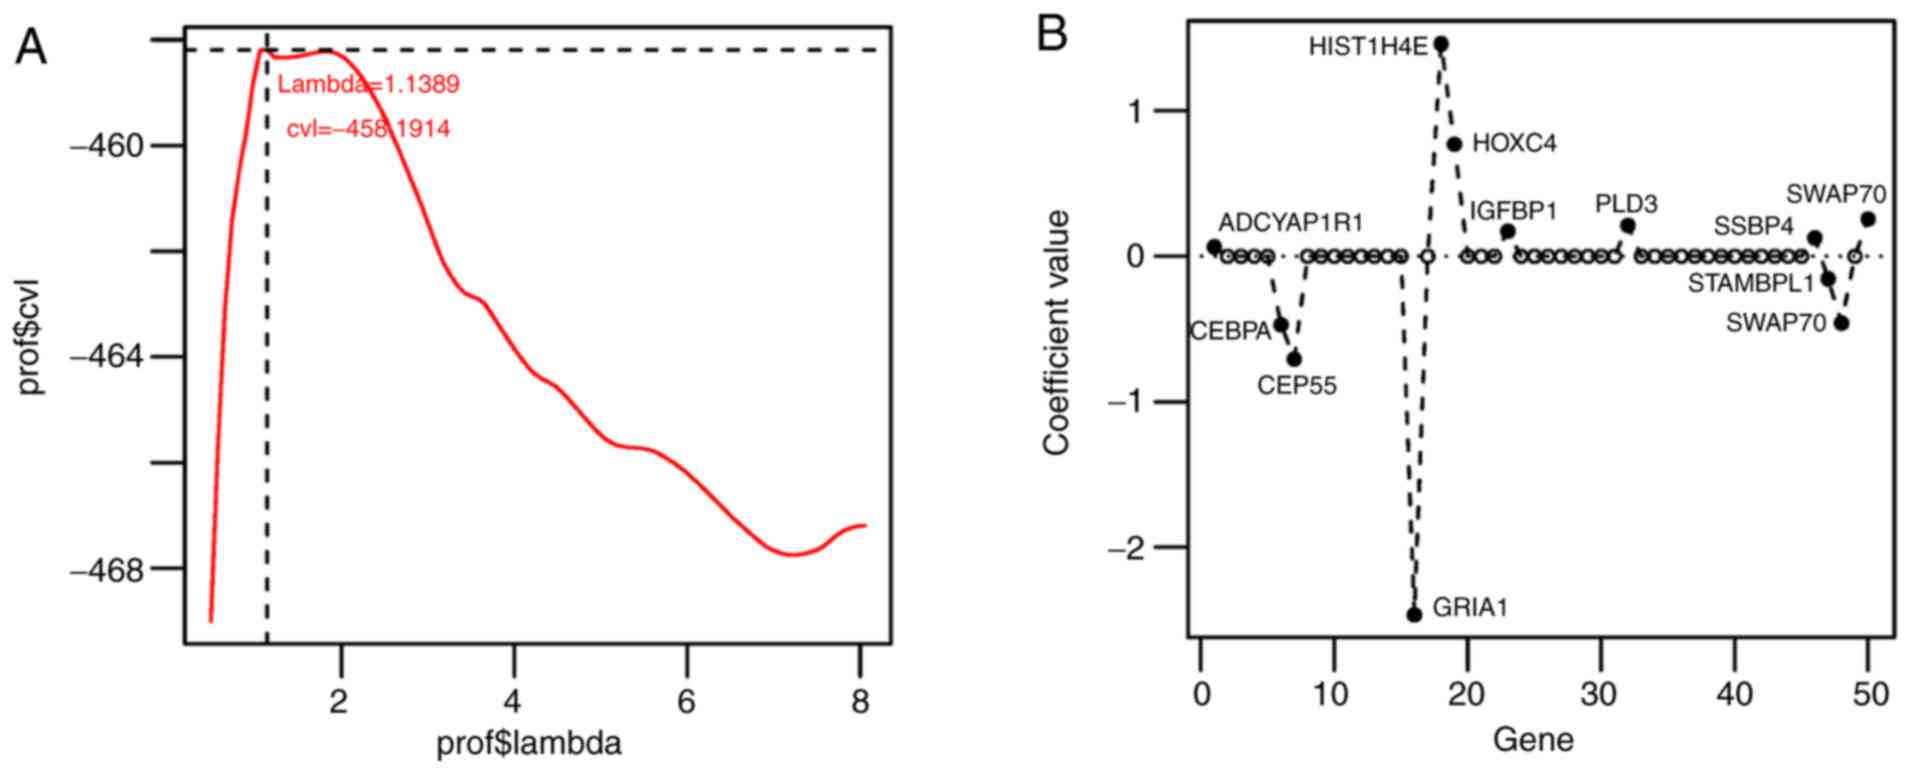 | Figure 3.Selection curve and coefficient
distribution diagram. (A) Selection curve of lambda (the junction
indicates that the maximum value of cvl is −458.1914 when λ=1.1389)
(B) The coefficient distribution diagram of the genes implicated in
the optimal gene combination.cvl, cross validation likelihood;
prof$ in Y-axis indicated the p value using the predictive model,
and in X-axis indicated the lambda value using the predictive
model; CEBPA, CCAAT/enhancer binding protein α; HIST1H4E, histone
cluster 1 H4E; STAMBPL1, STAM binding protein-like 1; PLD3,
phospholipase D3; CEP55, centrosomal protein 55; SSBP4, ssDNA
binding protein 4; GRIA1, glutamate AMPA receptor subunit 1;
SWAP70, switch-associated protein 70; ADCYAP1R1, adenylate-cyclase
activating polypeptide 1 receptor 1; YPEL3, yippee-like 3; HOXC4,
homeobox C4; IGFBP1, insulin-like growth factor binding protein
1. |
| Table IV.Information of the 12 optimal
genes. |
Table IV.
Information of the 12 optimal
genes.
| Methylation ID | Gene | Chr. | Position | Location | Coefficient | Hazard ratio | P-value |
|---|
| cg22250546 | CEBPA | chr19 | 38483210 | Promoter | −0.4701559 | 0.197 |
2.01×10⁻²a |
| cg23066982 |
HIST1H4E | chr6 | 26312442 | Promoter | 1.461097 | 1.228 |
4.11×10⁻²a |
| cg23264429 |
STAMBPL1 | chr10 | 90631983 | 5′UTR | −0.1543761 | 0.369 |
4.53×10⁻²a |
| cg25509871 | PLD3 | chr19 | 45563397 | 5′UTR | 0.2124921 | 1.082 |
4.40×10⁻²a |
| cg25827255 | CEP55 | chr10 | 95246749 | Promoter | −0.7063513 | 0.129 |
2.04×10⁻²a |
| cg25902939 | SSBP4 | chr19 | 18405350 | Body | 0.1268035 | 1.139 |
4.45×10⁻²a |
| cg26343183 | GRIA1 | chr5 | 152988914 | Body | −2.4642526 | 0.276 |
1.33×10⁻²a |
| cg26645401 | SWAP70 | chr11 | 9643090 | Body | −0.4583647 | 0.272 |
2.02×10⁻²a |
| cg27076139 |
ADCYAP1R1 | chr7 | 31058243 | TSS1500 | 0.0652014 | 1.014 |
1.35×10⁻²a |
| cg27106909 | YPEL3 | chr16 | 30014398 | Promoter | 0.2566994 | 1.294 |
4.32×10⁻²a |
| cg27138204 | HOXC4 | chr12 | 52732367 | 5′UTR | 0.7707755 | 1.679 |
1.58×10⁻²a |
| cg27447599 | IGFBP1 | chr7 | 45894465 | TSS200 | 0.172493 | 1.193 |
2.18×10⁻²a |
Risk score=(−0.4701559) × Methylation
cg22250546 + (1.461097) × Methylation
cg23066982 + (−0.1543761) × Methylation
cg23264429 + (0.2124921) × Methylation
cg25509871 + (−0.7063513) × Methylation
cg25827255+ (0.1268035) × Methylation
cg25902939 + (−2.4642526) × Methylation
cg26343183+ (−0.4583647) × Methylation
cg26645401 +(0.0652014) xMethylation
cg27076139+ (0.2566994) × Methylation
cg27106909 + (0.7707755) × Methylation
cg27138204 + (0.172493) × Methylation
cg27447599.
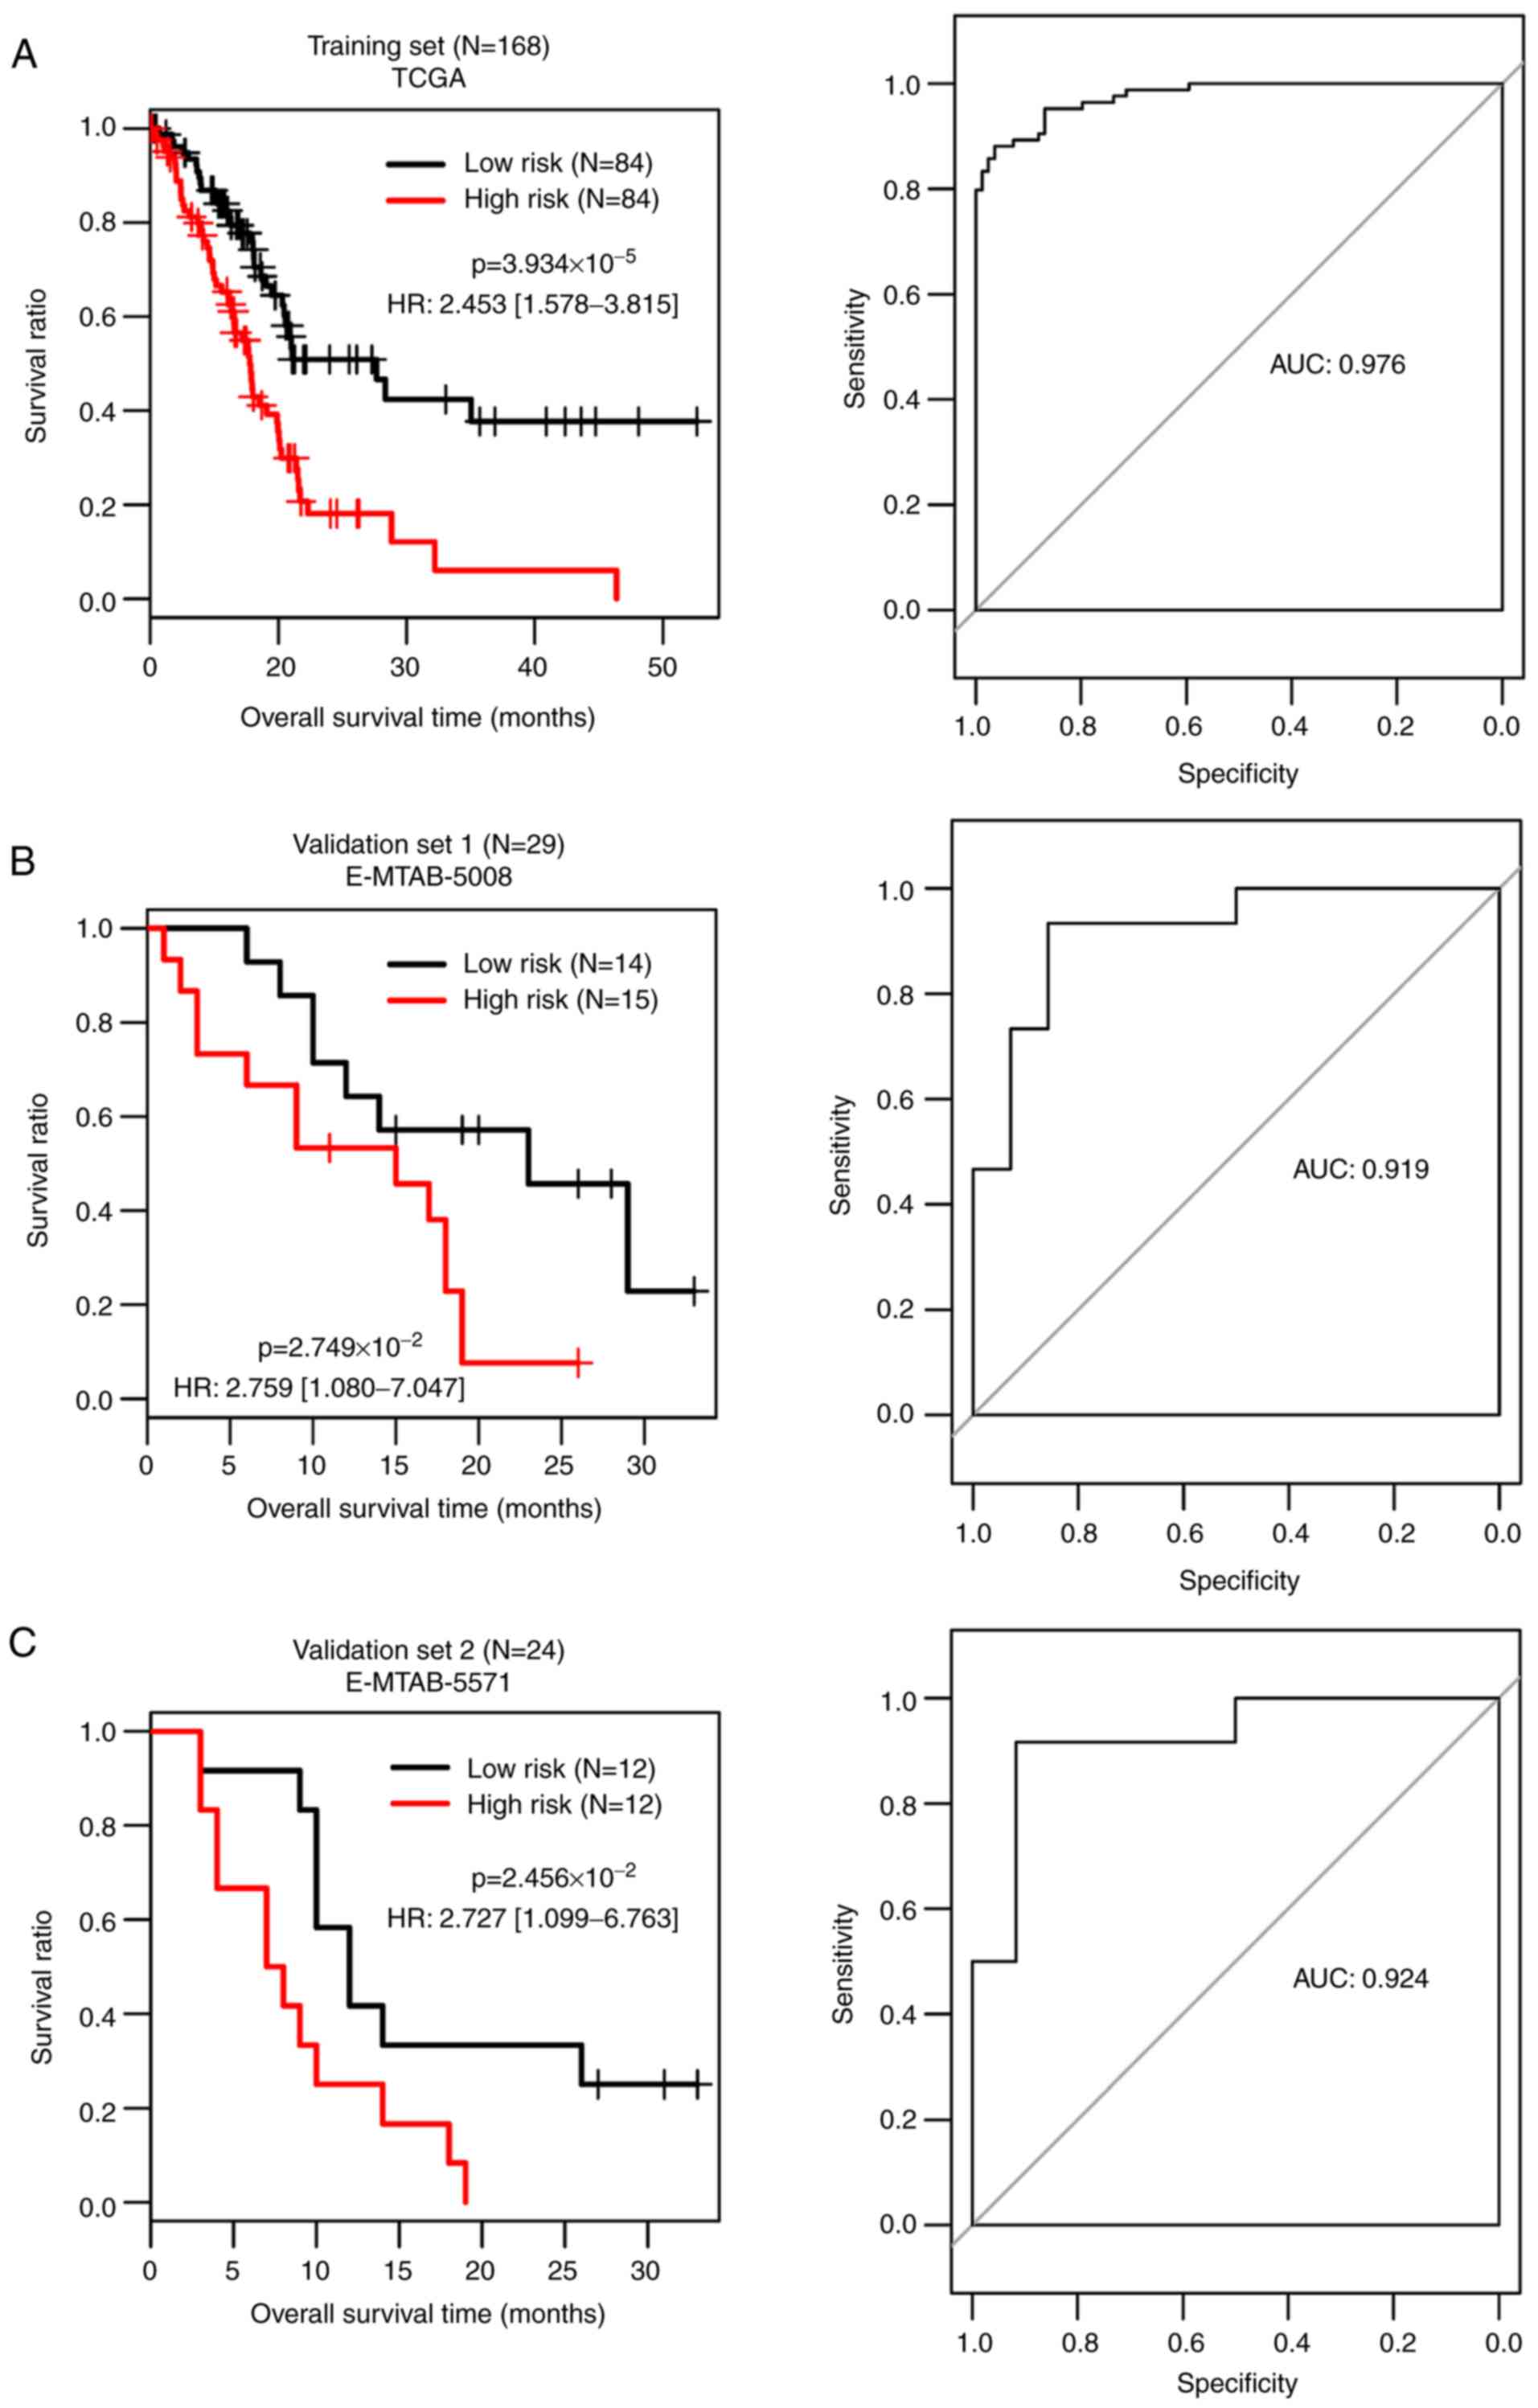
According to the median of the risk scores of the
samples in the TCGA dataset, the samples were divided into high and
low risk groups. For the TCGA dataset, the comparison between the
actual overall survival and risk score system predicting survival
of the risk groups was performed and the AUC was 0.976 (Fig. 4A). Moreover, the risk score system
was validated in the E-MTAB-5008 (Fig.
4B) and E-MTAB-5571 (Fig. 4C)
datasets and the AUCs were 0.919 and 0.924, respectively. The TCGA,
E-MTAB-5008 and E-MTAB-5571 datasets had consistent results and all
the samples in low risk group had improved survival.
Correlation analysis between
independent prognostic factors and risk groups
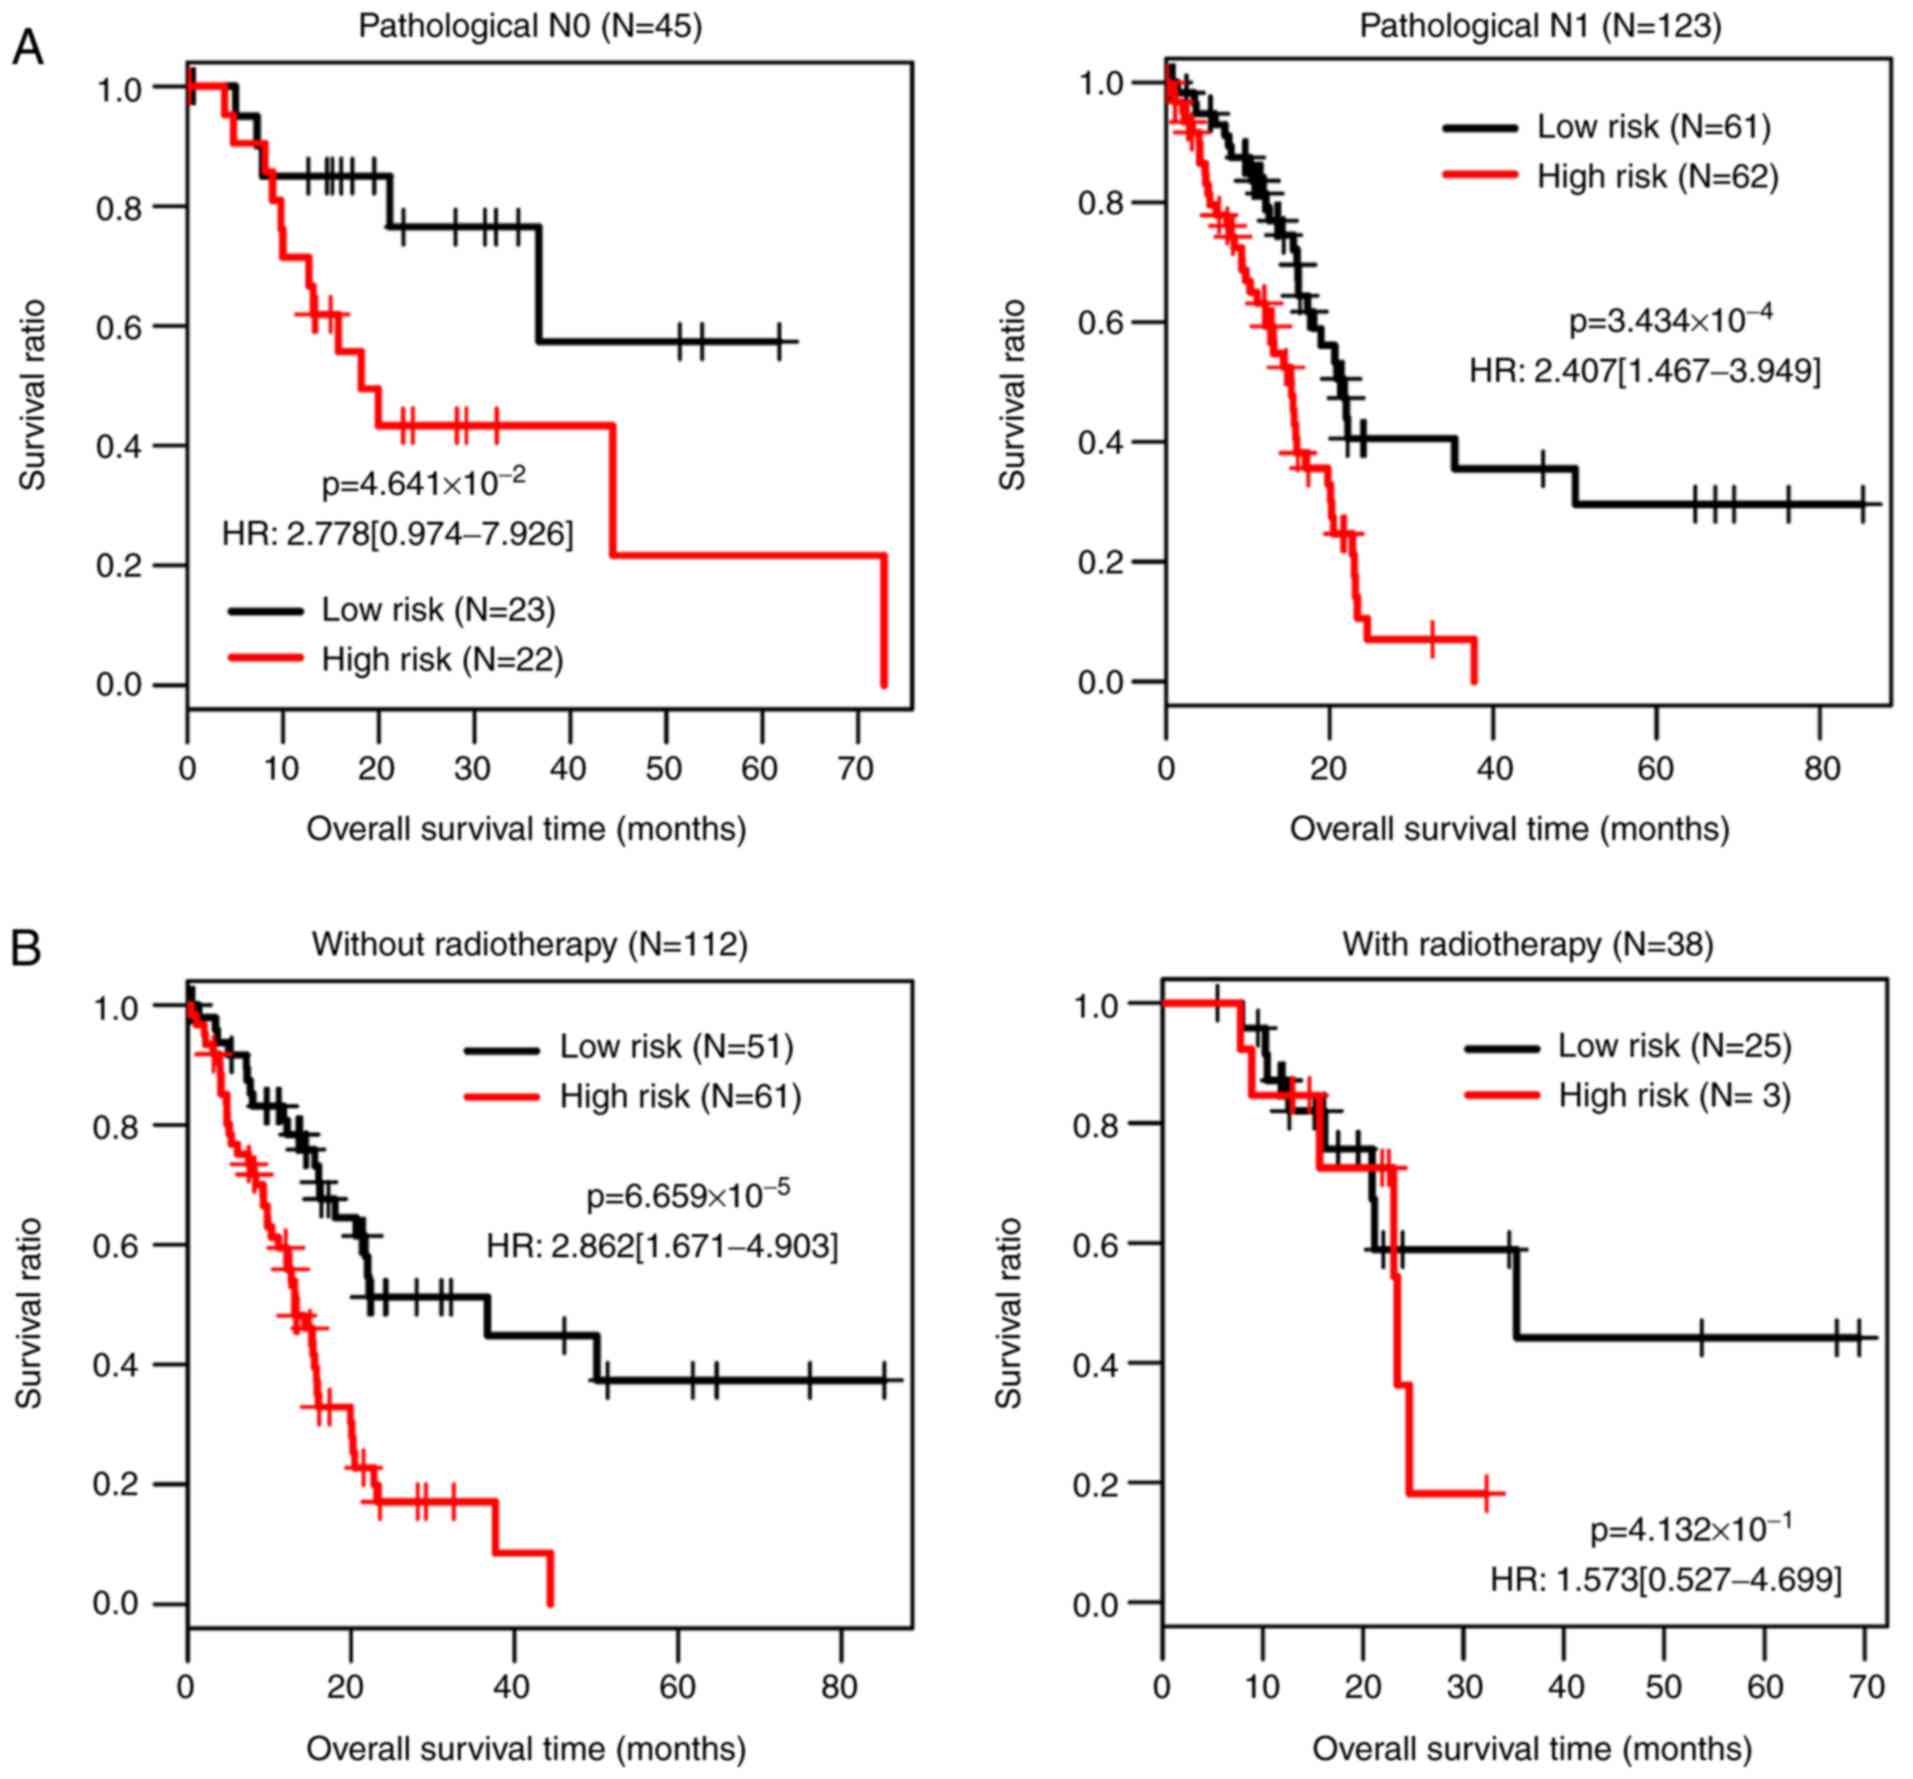
The clinical information of 168 samples in the TCGA
dataset was statistically analyzed, and pathological
tumor-node-metastases (TNM) staging system (36), radiotherapy and risk status were
identified as independent prognostic factors (Table V). Survival status of high and low
risk groups with different pathological N stages (N0 vs. N1) and
treatment with radiotherapy (treatment with radiotherapy vs.
without radiotherapy) were compared (Fig. 5).
| Table V.The results for screening independent
prognostic factors. |
Table V.
The results for screening independent
prognostic factors.
|
|
| Univariate cox | Multivariate
cox |
|---|
|
|
|
|
|
|---|
| Clinical
characteristics | TCGA, n=168 | HR | 95% CI | P-value | HR | 95% CI | P-value |
|---|
| Age, years, mean ±
sd | 64.89±11.24 | 1.029 | 1.008–1.049 |
5.83×10⁻³b | 1.019 | 0.997–1.0413 |
9.46×10⁻² |
| Sex |
| 0.919 | 0.605–1.394 |
6.89×10⁻¹ | Unknown | Unknown | Unknown |
|
Male | 94 |
|
|
|
|
|
|
|
Female | 75 |
|
|
|
|
|
|
| Pathologic M |
| 1.491 | 0.457–4.858 |
5.05×10⁻¹ | Unknown | Unknown | Unknown |
| M0 | 79 |
|
|
|
|
|
|
| M1 | 4 |
|
|
|
|
|
|
|
Unknown | 85 |
|
|
|
|
|
|
| Pathologic N |
| 2.156 | 1.276–3.643 |
3.31×10⁻³b | 2.12 | 1.139–3.947 |
1.19×10⁻²a |
| N0 | 45 |
|
|
|
|
|
|
| N1 | 119 |
|
|
|
|
|
|
|
Unknown | 4 |
|
|
|
|
|
|
| Pathologic T |
| 1.711 | 1.116–2.622 |
1.35×10⁻²a | 1.221 | 0.576–2.585 |
6.03×10⁻¹ |
| T1 | 8 |
|
|
|
|
|
|
| T2 | 19 |
|
|
|
|
|
|
| T3 | 136 |
|
|
|
|
|
|
| T4 | 4 |
|
|
|
|
|
|
|
Unknown | 1 |
|
|
|
|
|
|
| Pathologic
stage |
| 1.488 | 1.040 – 2.129 |
3.12×10⁻²a | 0.996 | 0.473–2.096 |
9.92×10⁻¹ |
| I | 20 |
|
|
|
|
|
|
| II | 138 |
|
|
|
|
|
|
|
III | 5 |
|
|
|
|
|
|
| IV | 4 |
|
|
|
|
|
|
|
Unknown | 1 |
|
|
|
|
|
|
| Pathologic
grade |
| 1.538 | 1.148–2.061 |
3.76×10⁻³b | 1.366 | 0.993–1.879 |
5.56×10⁻² |
| 1 | 30 |
|
|
|
|
|
|
| 2 | 88 |
|
|
|
|
|
|
| 3 | 47 |
|
|
|
|
|
|
| 4 | 2 |
|
|
|
|
|
|
|
Unknown | 1 |
|
|
|
|
|
|
| History of alcohol
usage |
| 1.099 | 0.688–1.757 |
6.92×10⁻¹ | Unknown | Unknown | Unknown |
|
Yes | 96 |
|
|
|
|
|
|
| No | 56 |
|
|
|
|
|
|
| History of alcohol
usage |
| 1.099 | 0.688–1.757 |
6.92×10⁻¹ | Unknown | Unknown | Unknown |
|
Unknown | 16 |
|
|
|
|
|
|
| Tobacco
history |
| 1.117 | 0.874–1.427 |
3.75×10⁻¹ | Unknown | Unknown | Unknown |
|
Never | 61 |
|
|
|
|
|
|
|
Reform | 56 |
|
|
|
|
|
|
|
Current | 19 |
|
|
|
|
|
|
|
Unknown | 32 |
|
|
|
|
|
|
| Chronic
pancreatitis history |
| 1.101 | 0.524–2.314 |
7.99×10⁻¹ | Unknown | Unknown | Unknown |
|
Yes | 117 |
|
|
|
|
|
|
| No | 13 |
|
|
|
|
|
|
|
Unknown | 38 |
|
|
|
|
|
|
| Diabetes
history |
| 0.903 | 0.509–1.602 |
7.27×10⁻¹ | Unknown | Unknown | Unknown |
|
Yes | 36 |
|
|
|
|
|
|
| No | 99 |
|
|
|
|
|
|
|
Unknown | 33 |
|
|
|
|
|
|
| Radiotherapy |
| 0.529 | 0.302–0.928 |
2.39×10⁻²a | 0.502 | 0.279–0.906 |
3.78×10⁻²a |
|
Yes | 38 |
|
|
|
|
|
|
| No | 112 |
|
|
|
|
|
|
|
Unknown | 18 |
|
|
|
|
|
|
| Recurrence |
| 1.558 | 0.951–2.552 |
7.59×10⁻² | Unknown | Unknown | Unknown |
|
Yes | 40 |
|
|
|
|
|
|
| No | 102 |
|
|
|
|
|
|
|
Unknown | 26 |
|
|
|
|
|
|
| Risk status |
| 2.453 | 1.578–3.815 |
3.93×10⁻⁵c | 2.146 | 1.289–3.571 |
3.31×10⁻³b |
|
High | 84 |
|
|
|
|
|
|
|
Low | 84 |
|
|
|
|
|
|
| Dead |
| Unknown | Unknown | Unknown | Unknown | Unknown | Unknown |
|
Death | 88 |
|
|
|
|
|
|
|
Alive | 80 |
|
|
|
|
|
|
| Overall survival
time, months, mean ± sd) | 17.09±15.22 | Unknown | Unknown | Unknown | Unknown | Unknown | Unknown |
Discussion
The mechanisms underlying tumor development and
progression of PAAD are complex, and influencing factors include
epigenetic regulation of gene expression, epigenetic silencing of
genes, oncogenic/tumor suppressor gene mutation, telomere
alteration, genomic instability and DNA methylation (37–40). The
present study aimed to identify potential important key methylated
genes in PAAD. A total of 1,067 DMGs were identified in the less
favorable prognosis and more favorable prognosis groups. From the
10 modules identified by WGCNA, the black (involving 90 DMGs) and
turquoise (involving 394 DMGs) modules, in which the CpG genes were
significantly associated with methylations, were selected for
further analysis. For the 484 DMGs involved in the two key modules,
18 GO_BP, 7 GO_CC and 9 GO_MF terms were enriched. There were 192
DMGs associated with prognosis (less favorable or more favorable).
Correlation analysis indicated that the expression levels and
methylation levels of 192 DMGs among the 484 DMGs were negatively
correlated. Furthermore, 50 prognosis-associated genes were further
screened from the 192 DMGs. After a 12-gene optimal combination
(CEBPA, HIST1H4E, STAMBPL1, PLD3, CEP55, SSBP4, GRIA1, SWAP70,
ADCYAP1R1, YPEL3, HOXC4 and IGFBP1) was identified, the
risk score system was constructed and validated in the TCGA,
E-MTAB-5008 and E-MTAB-5571 datasets. In addition, pathological N
category, radiotherapy and risk status were found to be independent
prognostic factors.
It is demonstrated that upregulation of
CCAAT/enhancer binding protein (C/EBP) beta (C/EBPβ), encoded by
CEBPB, could restore the anti-cancer functions of Menin in
PC (41) The inadequate cytoplasmic
localization and abnormal silencing of C/EBP results in its
dysfunction, and thus, C/EBP may serve as a novel suppressor
in PC cells (42). Downregulated
C/EBPα induced by lysine (K)-specific demethylase 6B
(KDM6B) promotes the aggressiveness of pancreatic ductal
adenocarcinoma (PDAC) cells, indicating that the
KDM6B-C/EBPα axis is associated with the progression of PDAC
(43,44). Histone H3 modification affects the
gene expression and promoter methylation of MUC2, which may
be critical for the prognostic prediction of patients with PC
(45). The mRNA expression levels of
histone H4 is lowered by polyamide-chlorambucil conjugate (1R-Chl)
in the MIA PaCa-2 PC cell line and histone H4 genes have elevated
histone acetylation in tumor cells (46). Therefore, CEBPA and
HIST1H4E may be critical for the survival of PAAD
patients.
STAMBPL1 affects the activation of
NF-κB through mediating the stability and localization of
Tax (47) and NF-κB blockade
can inhibit the oncogenicity and metastasis of PC cells (48). Overexpression of CEP55 can
promote PC cell aggressiveness via activation of the NF-κB pathway;
therefore, CEP55 may be a prognostic factor and therapeutic
target for patients with PC (49).
Downregulated expression of YPEL1 in PAAD samples is
associated with perineural invasion and survival prognosis, thus
YPEL1 may serve a role in the malignant transformation of
pancreatic tissues (50). Low
IGFBP1 plasma levels have a more notable influence in
non-smoking patients with PC and predicts an increased risk of PC
(51). These data suggest that
STAMBPL1, CEP55, YPEL3 and IGFBP1 may be associated
with the prognosis of patients with PAAD.
Although PLD3, SSBP4, GRIA1, SWAP70 and
ADCYAP1R1 do not have reported associations with PAAD to the
best of our knowledge, their influence on other types of human
cancer have been reported. Elevated expression and activity of
PLD is detected in multiple types of cancer, such as
gastric, colorectal, renal, stomach, lung and breast cancers
(52), and PLD serves a role
in mediating cell proliferation, cell transition, survival
signaling and tumor progression (53). SSBP2 is a tumor suppressor
gene and the disruption of SSBP2-associated pathways may be
involved in the malignant transformation of various tissues
(54). GRIA1 is involved in
glutamate receptor signaling, which is an epigenetic marker for
overall mortality rate of basal-like urothelial carcinomas
(55). The oncogene SWAP70
functions in regulating actin rearrangement in basal-like bladder
cancer (55) and serves a role in
the transformation-associated signaling pathway (56). The promoter hypermethylation level of
ADCYAP1 is associated with cervical cancer development and
is considered as a promising methylation marker for the early
detection of cervical cancer (57).
Therefore, PLD3, SSBP4, GRIA1, SWAP70 and ADCYAP1R1
may also be associated with the prognosis of patients with
PAAD.
In the present study comprehensive bioinformatics
analysis of PAAD samples was performed to identify
prognosis-associated genes and to construct a risk score prognostic
prediction system. All findings were obtained from relatively
small-sized cohorts and thus require further experimental
validation. Additionally, the patient cohort samples in the three
datasets may exert different clinical features, such as disease
stage, historical treatment and demographics, which should be
carefully compared in further studies.
In conclusion, 1,067 DMGs were identified and a
12-gene optimal combination consisting of CEBPA, HIST1H4E,
STAMBPL1, PLD3, CEP55, SSBP4, GRIA1, SWAP70, ADCYAP1R1, YPEL3,
HOXC4 and IGFBP1 was obtained. This 12-gene risk score
prognostic prediction system may be valuable for predicting the
prognosis of patients with PAAD.
Supplementary Material
Supporting Data
Acknowledgements
Not applicable.
Funding
No funding was received.
Availability of data and materials
The datasets used and/or analyzed during the current
study are available from the corresponding author on reasonable
request.
Authors' contributions
DD conceived the study design and performed
manuscript drafting, SY was responsible for data collection and
analysis and JZ performed data interpretation and manuscript
writing. All authors read and approved the final manuscript.
Ethical approval and consent to
participate
Not applicable.
Patient consent for publication
Not applicable.
Competing interests
The authors declare that they have no competing
interests.
References
|
1
|
Vincent A, Herman J, Schulick R, Hruban RH
and Goggins M: Pancreatic cancer. Lancet. 378:607–620. 2011.
View Article : Google Scholar : PubMed/NCBI
|
|
2
|
Palacio S, McMurry HS, Ali R, Donenberg T,
Silva-Smith R, Wideroff G, Sussman DA, Rocha Lima CMS and Hosein
PJ: DNA damage repair deficiency as a predictive biomarker for
FOLFIRINOX efficacy in metastatic pancreatic cancer. J Gastrointest
Oncol. 10:1133–1139. 2019. View Article : Google Scholar : PubMed/NCBI
|
|
3
|
Rabow MW, Petzel MQB and Adkins SH:
Symptom management and palliative care in pancreatic cancer. Cancer
J. 23:362–373. 2017. View Article : Google Scholar : PubMed/NCBI
|
|
4
|
Stromnes IM and Greenberg PD: Greenberg,
pancreatic cancer: Planning ahead for metastatic spread. Cancer
Cell. 29:774–776. 2016. View Article : Google Scholar : PubMed/NCBI
|
|
5
|
Kanda M, Fujii T, Nagai S, Kodera Y,
Kanzaki A, Sahin TT, Hayashi M, Yamada S, Sugimoto H, Nomoto S, et
al: Pattern of lymph node metastasis spread in pancreatic cancer.
Pancreas. 40:951–955. 2011. View Article : Google Scholar : PubMed/NCBI
|
|
6
|
McGuire S; World Cancer Report 2014, .
Geneva, Switzerland: World Health Organization, International
Agency for Research on Cancer. WHO press. 2015.Adv Nutr. 7:418–419.
2016. View Article : Google Scholar
|
|
7
|
Giulietti M, Righetti A, Principato G and
Piva F: LncRNA co-expression network analysis reveals novel
biomarkers for pancreatic cancer. Carcinogenesis. 39:1016–1025.
2018. View Article : Google Scholar : PubMed/NCBI
|
|
8
|
Flattet Y, Yasmaguchi T, Andrejevic-Blant
S and Halkic N: Pancreatic adenocarcinoma: The impact of
preneoplastic lesion pattern on survival. Biosci Trends. 9:402–406.
2015. View Article : Google Scholar : PubMed/NCBI
|
|
9
|
Fu YJ, Li KZ, Bai JH and Liang ZQ:
C-reactive protein/albumin ratio is a prognostic indicator in
Asians with pancreatic cancers: A meta-analysis. Medicine
(Baltimore). 98:e182192019. View Article : Google Scholar : PubMed/NCBI
|
|
10
|
Schlick K, Magnes T, Huemer F, Ratzinger
L, Weiss L, Pichler M, Melchardt T, Greil R and Egle A: C-reactive
protein and neutrophil/lymphocytes ratio: Prognostic indicator for
doubling overall survival prediction in pancreatic cancer patients.
J Clin Med. 8:E17912019. View Article : Google Scholar : PubMed/NCBI
|
|
11
|
Esteller M: Relevance of DNA methylation
in the management of cancer. Lancet Oncol. 4:351–358. 2003.
View Article : Google Scholar : PubMed/NCBI
|
|
12
|
Espada J and Esteller M: DNA methylation
and the functional organization of the nuclear compartment. Semin
Cell Dev Biol. 21:238–246. 2010. View Article : Google Scholar : PubMed/NCBI
|
|
13
|
Misawa K, Mochizuki D, Imai A, Endo S,
Mima M, Misawa Y, Kanazawa T, Carey TE and Mineta H: Prognostic
value of aberrant promoter hypermethylation of tumor-related genes
in early-stage head and neck cancer. Oncotarget. 7:26087–26098.
2016. View Article : Google Scholar : PubMed/NCBI
|
|
14
|
Sato N, Fukushima N, Matsubayashi H,
Iacobuzio-Donahue CA, Yeo CJ and Goggins M: Aberrant methylation of
Reprimo correlates with genetic instability and predicts poor
prognosis in pancreatic ductal adenocarcinoma. Cancer. 107:251–257.
2010. View Article : Google Scholar
|
|
15
|
Matsubayashi H, Sato N, Fukushima N, Yeo
CJ, Walter KM, Brune K, Sahin F, Hruban RH and Goggins M:
Methylation of cyclin D2 is observed frequently in pancreatic
cancer but is also an age-related phenomenon in gastrointestinal
tissues. Clin Cancer Res. 9:1446–1452. 2003.PubMed/NCBI
|
|
16
|
Henriksen SD, Madsen PH, Larsen AC,
Johansen MB, Pedersen IS, Krarup H and Thorlacius-Ussing O:
Promoter hypermethylation in plasma-derived cell-free DNA as a
prognostic marker for pancreatic adenocarcinoma staging. Int J
Cancer. 141:2489–2497. 2017. View Article : Google Scholar : PubMed/NCBI
|
|
17
|
Henriksen SD, Madsen PH, Larsen AC,
Johansen MB, Pedersen IS, Krarup H and Thorlacius-Ussing O:
Cell-free DNA promoter hypermethylation in plasma as a predictive
marker for survival of patients with pancreatic adenocarcinoma.
Oncotarget. 8:93942–93956. 2017. View Article : Google Scholar : PubMed/NCBI
|
|
18
|
Bournet B, Muscari F, Buscail C, Assenat
E, Barthet M, Hammel P, Selves J, Guimbaud R, Cordelier P and
Buscail L: KRAS G12D mutation subtype is a prognostic factor for
advanced pancreatic adenocarcinoma. Clin Transl Gastroenterol.
7:e1572016. View Article : Google Scholar : PubMed/NCBI
|
|
19
|
Lee B, Lipton L, Cohen J, Tie J, Javed AA,
Li L, Goldstein D, Burge M, Cooray P, Nagrial A, et al: Circulating
tumor DNA as a potential marker of adjuvant chemotherapy benefit
following surgery for localized pancreatic cancer. Ann Oncol.
30:1472–1478. 2019. View Article : Google Scholar : PubMed/NCBI
|
|
20
|
Loosen SH, Tacke F, Püthe N, Binneboesel
M, Wiltberger G, Alizai PH, Kather JN, Paffenholz P, Ritz T, Koch
A, et al: High baseline soluble urokinase plasminogen activator
receptor (suPAR) serum levels indicate adverse outcome after
resection of pancreatic adenocarcinoma. Carcinogenesis. 40:947–955.
2019. View Article : Google Scholar : PubMed/NCBI
|
|
21
|
Carreras-Torres R, Johansson M, Gaborieau
V, Haycock PC, Wade KH, Relton CL, Martin RM, Davey Smith G and
Brennan P: The role of obesity, type 2 diabetes, and metabolic
factors in pancreatic cancer: A mendelian randomization study. J
Natl Cancer Inst. 109:2017. View Article : Google Scholar : PubMed/NCBI
|
|
22
|
Iodice S, Gandini S, Maisonneuve P and
Lowenfels AB: Tobacco and the risk of pancreatic cancer: A review
and meta-analysis. Langenbecks Arch Surg. 393:535–545. 2008.
View Article : Google Scholar : PubMed/NCBI
|
|
23
|
Wang P, Wang Y, Hang B, Zou X and Mao JH:
A novel gene expression-based prognostic scoring system to predict
survival in gastric cancer. Oncotarget. 7:55343–55351.
2016.PubMed/NCBI
|
|
24
|
R Core Team, . 2012.R: A language and
environment for statistical computing. R Foundation for Statistical
Computing. (Vienna, Austria). ISBN 3-900051-07-0. http://www.R-project.org/
|
|
25
|
Wright RM, et al: Samples and traits for
WGCNA. Cryobiology. 71:5442015.
|
|
26
|
Cao J and Zhang S: A bayesian extension of
the hypergeometric test for functional enrichment analysis.
Biometrics. 70:84–94. 2014. View Article : Google Scholar : PubMed/NCBI
|
|
27
|
Balakrishnan R, Harris MA, Huntley R, Van
Auken K and Cherry JM: A guide to best practices for Gene Ontology
(GO) manual annotation. Database (Oxford). 2013:bat0542013.
View Article : Google Scholar : PubMed/NCBI
|
|
28
|
Huang DW, Sherman BT, Tan Q, Kir J, Liu D,
Bryant D, Guo Y, Stephens R, Baseler MW, Lane HC and Lempicki RA:
DAVID bioinformatics resources: Expanded annotation database and
novel algorithms to better extract biology from large gene lists.
Nucleic Acids Res. 35:(Web Server Issue). W169–W175. 2007.
View Article : Google Scholar : PubMed/NCBI
|
|
29
|
Stadler L, et al: Optimizing R language
execution via aggressive speculation. Symposium on Dynamic
Languages. 2016.
|
|
30
|
Zou KH, Tuncali K and Silverman SG:
Correlation and simple linear regression. Radiology. 227:617–622.
2003. View Article : Google Scholar : PubMed/NCBI
|
|
31
|
Nadarajah S and Bakar AAS: A new R package
for actuarial survival models. Computational Statistics.
28:2139–2160. 2013. View Article : Google Scholar
|
|
32
|
Goeman JJ: L1 penalized estimation in the
Cox proportional hazards model. Biom J. 52:70–84. 2010.PubMed/NCBI
|
|
33
|
Horne JS and Garton EO: Likelihood
cross-validation versus least squares cross-validation for choosing
the smoothing parameter in kernel home-range analysis. J Wildlife
Man. 70:641–648. 2011. View Article : Google Scholar
|
|
34
|
Nagy Á, Lánczky A, Menyhárt O and Győrffy
B: Validation of miRNA prognosis power in hepatocellular carcinoma
using expression data of independent datasets. Sci Rep. 8:92272018.
View Article : Google Scholar : PubMed/NCBI
|
|
35
|
Wakeman CJ, Martin IG, Robertson RW, Dobbs
BR and Frizelle FA: Pancreatic cancer: Management and survival. ANZ
J Surg. 74:941–944. 2015. View Article : Google Scholar
|
|
36
|
Court CM and Hines OJ: The new American
joint committee on cancer TNM staging system for pancreatic
cancer-balancing usefulness with prognostication. JAMA Surg.
153:e1836292018. View Article : Google Scholar : PubMed/NCBI
|
|
37
|
Xia WX, Zhang LH and Liu YW: Weighted gene
co-expression network analysis reveal six hub genes involved in and
tight junction function in pancreatic adenocarcinoma and their
potential use in prognosis. Genet Test Mol Biomarkers. 23:829–836.
2019. View Article : Google Scholar : PubMed/NCBI
|
|
38
|
Gailhouste L, Liew LC, Hatada I, Nakagama
H and Ochiya T: Epigenetic reprogramming using 5-azacytidine
promotes an anti-cancer response in pancreatic adenocarcinoma
cells. Cell Death Dis. 9:4682018. View Article : Google Scholar : PubMed/NCBI
|
|
39
|
Ali S, Cohen C, Little JV, Sequeira JH,
Mosunjac MB and Siddiqui MT: The utility of SMAD4 as a diagnostic
immunohistochemical marker for pancreatic adenocarcinoma, and its
expression in other solid tumors. Diagn Cytopathol. 35:644–648.
2007. View Article : Google Scholar : PubMed/NCBI
|
|
40
|
Sahin IH, Lowery MA, Stadler ZK,
Salo-Mullen E, Iacobuzio-Donahue CA, Kelsen DP and O'Reilly EM:
Genomic instability in pancreatic adenocarcinoma: A new step
towards precision medicine and novel therapeutic approaches. Expert
Rev Gastroenteral Hepatol. 10:893–905. 2016.
|
|
41
|
Cheng P, Chen Y, He TL, Wang C, Guo SW, Hu
H, Ni CM, Jin G and Zhang YJ: Menin coordinates C/EBPβ-mediated
TGF-β signaling for epithelial-mesenchymal transition and growth
inhibition in pancreatic cancer. Mol Ther Nucleic Acids.
18:155–165. 2019. View Article : Google Scholar : PubMed/NCBI
|
|
42
|
Kumagai T, Akagi T, Desmond JC, Kawamata
N, Gery S, Imai Y, Song JH, Gui D, Said J and Koeffler HP:
Epigenetic regulation and molecular characterization of C/EBPalpha
in pancreatic cancer cells. Int J Cancer. 124:827–833. 2010.
View Article : Google Scholar
|
|
43
|
Yamamoto K, Tateishi K, Kudo Y, Sato T,
Yamamoto S, Miyabayashi K, Matsusaka K, Asaoka Y, Ijichi H, Hirata
Y, et al: Loss of histone demethylase KDM6B enhances aggressiveness
of pancreatic cancer through downregulation of C/EBPα.
Carcinogenesis. 35:2404–2414. 2014. View Article : Google Scholar : PubMed/NCBI
|
|
44
|
Yamamoto K, Tateishi K, Miyabayashi K,
Yamamoto S, Yotaro Y, Mohri D, Asaoka Y, Ijichi H, Omata M and
Koike K: Reduced Jmjd3 Expression Enhances Aggressiveness of
Pancreatic Cancer Through Downregulation of C/EBPα.
Gastroenterology. 140:S1442011. View Article : Google Scholar
|
|
45
|
Yamada N, Hamada T, Goto M, Tsutsumida H,
Higashi M, Nomoto M and Yonezawa S: MUC2 expression is regulated by
histone H3 modification and DNA methylation in pancreatic cancer.
Int J Cancer. 119:1850–1857. 2010. View Article : Google Scholar
|
|
46
|
Jespersen C, Soragni E, James Chou C,
Arora PS, Dervan PB and Gottesfeld JM: Chromatin structure
determines accessibility of a hairpin polyamide-chlorambucil
conjugate at histone H4 genes in pancreatic cancer cells. Bioorg
Med Chem Lett. 22:4068–4071. 2012. View Article : Google Scholar : PubMed/NCBI
|
|
47
|
Lavorgna A and Harhaj EW: STAMBPL1 is a
deubiquitinating enzyme that regulates HTLV-I Tax subcellular
localization and NF-kB activation. Retrovirology. 8:1. 2011.
View Article : Google Scholar : PubMed/NCBI
|
|
48
|
Xiong HQ, Abbruzzese JL, Lin E, Wang L,
Zheng L and Xie K: NF-kappaB activity blockade impairs the
angiogenic potential of human pancreatic cancer cells. Int J
Cancer. 108:181–188. 2004. View Article : Google Scholar : PubMed/NCBI
|
|
49
|
Peng T, Zhou W, Guo F, Wu HS, Wang CY,
Wang L and Yang ZY: Centrosomal protein 55 activates NF-κB
signalling and promotes pancreatic cancer cells aggressiveness. Sci
Rep. 7:59252017. View Article : Google Scholar : PubMed/NCBI
|
|
50
|
Abiatari I, Kiladze M, Kerkadze V, Friess
H and Kleeff J: Expression of YPEL1 in pancreatic cancer cell lines
and tissues. Georgian Medical News. 175:60–62. 2009.
|
|
51
|
Wolpin BM, Michaud DS, Giovannucci EL,
Schernhammer ES, Stampfer MJ, Manson JE, Cochrane BB, Rohan TE, Ma
J, Pollak MN and Fuchs CS: Circulating insulin-like growth factor
binding protein-1 and the risk of pancreatic cancer. Cancer Res.
67:7923–7928. 2007. View Article : Google Scholar : PubMed/NCBI
|
|
52
|
Diaz-Aragon R, Ramirez-Ricardo J,
Cortes-Reynosa P, Simoni-Nieves A, Gomez-Quiroz LE and Perez
Salazar E: Role of phospholipase D in migration and invasion
induced by linoleic acid in breast cancer cells. Mol Cell Biochem.
457:119–132. 2019. View Article : Google Scholar : PubMed/NCBI
|
|
53
|
Foster DA and Xu L: Phospholipase D in
cell proliferation and cancer. Mol Cancer Res. 1:789–800.
2003.PubMed/NCBI
|
|
54
|
Wang Y, Klumpp S, Amin HM, Liang H, Li J,
Estrov Z, Zweidler-McKay P, Brandt SJ, Agulnick A and Nagarajan L:
SSBP2 is an in vivo tumor suppressor and regulator of LDB1
stability. Oncogene. 29:3044–3053. 2010. View Article : Google Scholar : PubMed/NCBI
|
|
55
|
Tilley SK, Kim WY and Fry RC: Analysis of
bladder cancer tumor CpG methylation and gene expression within The
Cancer Genome Atlas identifies GRIA1 as a prognostic biomarker for
basal-like bladder cancer. Am J Cancer Res. 7:1850–1862.
2017.PubMed/NCBI
|
|
56
|
Shu CL, Jing-Yang-Lai, Su LC, Chuu CP and
Fukui Y: SWAP-70: A new type of oncogene. PLoS One. 8:e592452013.
View Article : Google Scholar : PubMed/NCBI
|
|
57
|
Jung S, Yi L, Jeong D, Kim J, An S, Oh TJ,
Kim CH, Kim CJ, Yang Y, Kim KI, et al: The role of ADCYAP1,
adenylate cyclase activating polypeptide 1, as a methylation
biomarker for the early detection of cervical cancer. Oncol Rep.
25:245–252. 2011.PubMed/NCBI
|