Introduction
In 2018, there were ~2.1 million newly diagnosed
female breast cancer cases (1).
Although several advancements in early diagnosis and treatment have
been made, the prevalence of breast cancer remains a crucial health
issue worldwide (2–4). Accurate molecular biomarkers for early
diagnosis may be a useful way to improve the current treatments for
breast cancer. Therefore, investigating specific and sensitive
molecular biomarkers involved in breast cancer has significant
clinical value.
DNA helicases unwind or rearrange duplex DNA during
replication, recombination and repair, thus playing an essential
role in the preservation of genome stability (5). A number of studies have demonstrated
that cancer ensues when the activity of DNA helicases is altered,
which indicates that a significant number of helicases are
tumor-associated (6–10). In addition to its fundamental role
within the GINS complex, GINS2 is also a vital component of the CMG
complex (11). The CMG complex is
the eukaryotic replicative helicase that can unwind double-stranded
DNA, including, minichromosome maintenance proteins 2–7 (MCM2-7),
cell division cycle 45 (CDC45) and the GINS complex, at replication
forks (11,12). Close attention should be paid to the
expression of GINS2 in different human malignancies, due to the
inextricable linkage between DNA helicases and human cancer types
(13). In addition, the upregulation
of GINS2 has been reported in various types of human cancer,
including glioma, cervical cancer, rectal cancer and lung
adenocarcinoma (14–17). Regarding breast cancer, GINS2
expression is also increased in triple-negative breast cancer cells
(18). However, to the best of our
knowledge, the prognostic value of GINS2 and its role in other
types of breast cancer remains unknown.
The present study sought to conduct a more in-depth
analysis of GINS2 in order to investigate whether it could be used
as a potential prognostic biomarker for breast cancer. The
following databases were used; Oncomine, Tumor Immune Estimation
Resource (TIMER) and The Human Protein Atlas (HPA), in order to
evaluate the differential expression of GINS2 between breast tumor
tissue and normal tissue. The association between GINS2 expression
and clinical parameters including expression patterns, gene
mutations and distinct prognostic values of GINS2 in breast cancer,
was also analyzed using the publicly accessible databases. The
present study also used the following databases; Oncomine,
GeneMANIA, Gene Expression Profiling Interactive Analysis (GEPIA)
and University of California Santa Cruz Xena (UCSC Xena), in order
to analyze the co-expression and neighboring genes of GINS2.
Materials and methods
The following datasets and patients' information
were acquired from the aforementioned publicly accessible online
databases. No human or animal specimens were used in the present
study.
Oncomine analysis
The Oncomine database (oncomine.org)
is a publicly accessible online database containing 715 datasets
and 86,733 samples (19). Oncomine
was used to compare the mRNA expression of GINS2 in breast cancer
tissues with normal tissues. Paired Student's t-test was used in
order to analyze the differences in transcriptional expression
between datasets derived from cancer specimens and normal controls.
The following values were used as thresholds: Gene rank, 10%; fold
change, 2; and P<0.0001.
Breast cancer Gene-expression miner
v4.1 (bc-GenExMiner v4.1) analysis
bc-GenExMiner v4.1 (bcgenex.centregauducheau.fr) is
a statistical mining tool that contains 36 annotated genomic
datasets and the data of 5,861 patients with breast cancer
(20,21). The association between GINS2
expression levels and different clinical parameters [age,
Tumor-Node-Metastasis stage, Scarff-Bloom-Richardson (SBR) grade,
Nottingham Prognostic Index (NPI), estrogen receptor status,
progesterone receptor status and human epidermal growth factor
receptor 2 status] of patients with breast cancer was analyzed
using this publicly accessible database (22–24).
Welch's t-test was used in order to compare the difference in
expression of GINS2 between the groups of patients according to
different clinicopathological parameters and Dunnett-Tukey-Kramer
test was used for pair-wise comparisons when a significant
difference was observed. P<0.05 was considered to indicate a
statistically significant difference.
Kaplan-Meier (KM) plotter
analysis
The KM plotter database interprets information
regarding gene expression and survival analysis of different types
of cancer including, breast, liver, ovarian, lung and gastric
cancer (25,26). KM plotter was used to analyze the
prognostic values of GINS2 in patients with breast cancer and
relapse-free survival (RFS). The log-rank P-value was presented on
the website, P<0.05 was considered to indicate a statistically
significant difference.
Catalogue of somatic mutations in
cancer (COSMIC) analysis
The COSMIC database (cancer.sanger.ac.uk/cosmic) is
one of the most abundant resources for searching gene mutations in
several types of human cancer (27).
The COSMIC database was used in order to examine the different
types of GINS2 mutations in breast cancer. The following formula
was used in order to calculate the percentage of each type of
mutation in different types of breast cancer: [(Genetic alternation
samples)/(total samples)] ×100%.
UCSC Xena analysis
The UCSC Xena database (xena.ucsc.edu)
is a powerful genomic online tool that provides visualization and
integration heat maps for analyzing the publicly accessible
datasets (28,29). The UCSC Xena database was used to
generate a heat map of GINS2, MCM4 and CENPM expression, according
to PAM50 breast cancer subtypes in The Cancer Genome Atlas (TCGA)
Breast Invasive Carcinoma database (portal.gdc.cancer.gov/).
HPA analysis
The HPA (proteinatlas.org) database aims to map all the human
proteins in cells, tissues and organs (30–32). The
HPA online tool has already helped thousands of researchers in the
fields of biomedicine and disease. The HPA database was used in
order to determine GINS2 protein expression level via
immunohistochemistry (IHC) staining and the IHC images were
obtained from the HPA database.
GEPIA analysis
The GEPIA database (gepia.cancer-pku.cn) is an
online website that can be used to analyze the RNA expression data,
based on TCGA and the Genotype-Tissue Expression (GTEx) Projects
(33,34). Pearson's correlation test was used in
order to assess the association between GINS2, MCM4 and CENPM in
breast cancer via the GEPIA database.
cBioPortal for cancer genomics
analysis
The cBioPortal for Cancer Genomics database
(http://www.cbioportal.org) is an online
website that allows for the visualization, analysis and download of
large-scale cancer genomic datasets (35–37). The
cBioPortal for Cancer Genomics database was used to analyze the
expression of and mutations in GINS2. The breast cancer dataset
(TCGA Cell 2015) was used for further analysis within the database
(38). Kaplan-Meier analysis was
used in order to assess the overall survival (OS) and disease-free
survival (DFS) rates of GINS2, using the database.
GeneMANIA analysis
GeneMANIA (genemania.org)
is an online database that identifies other associated with a set
of input genes. The GeneMANIA database was used to identify genes
that are associated with GINS2 at the genetic level. Furthermore,
the associations between pathways, shared protein domains, and the
co-localization and co-expression of GINS2 were determined using
GeneMANIA.
TIMER analysis
TIMER (cistrome.shinyapps.io/timer) is an online
database used for the systematic analysis of immune infiltrates and
gene expression across different types of cancer (39). Wilcoxon signed-rank test was used to
analyze GINS2 expression levels between breast cancer tissue and
normal breast tissue via the TIMER database.
Results
Expression of GINS2 in human breast
cancer
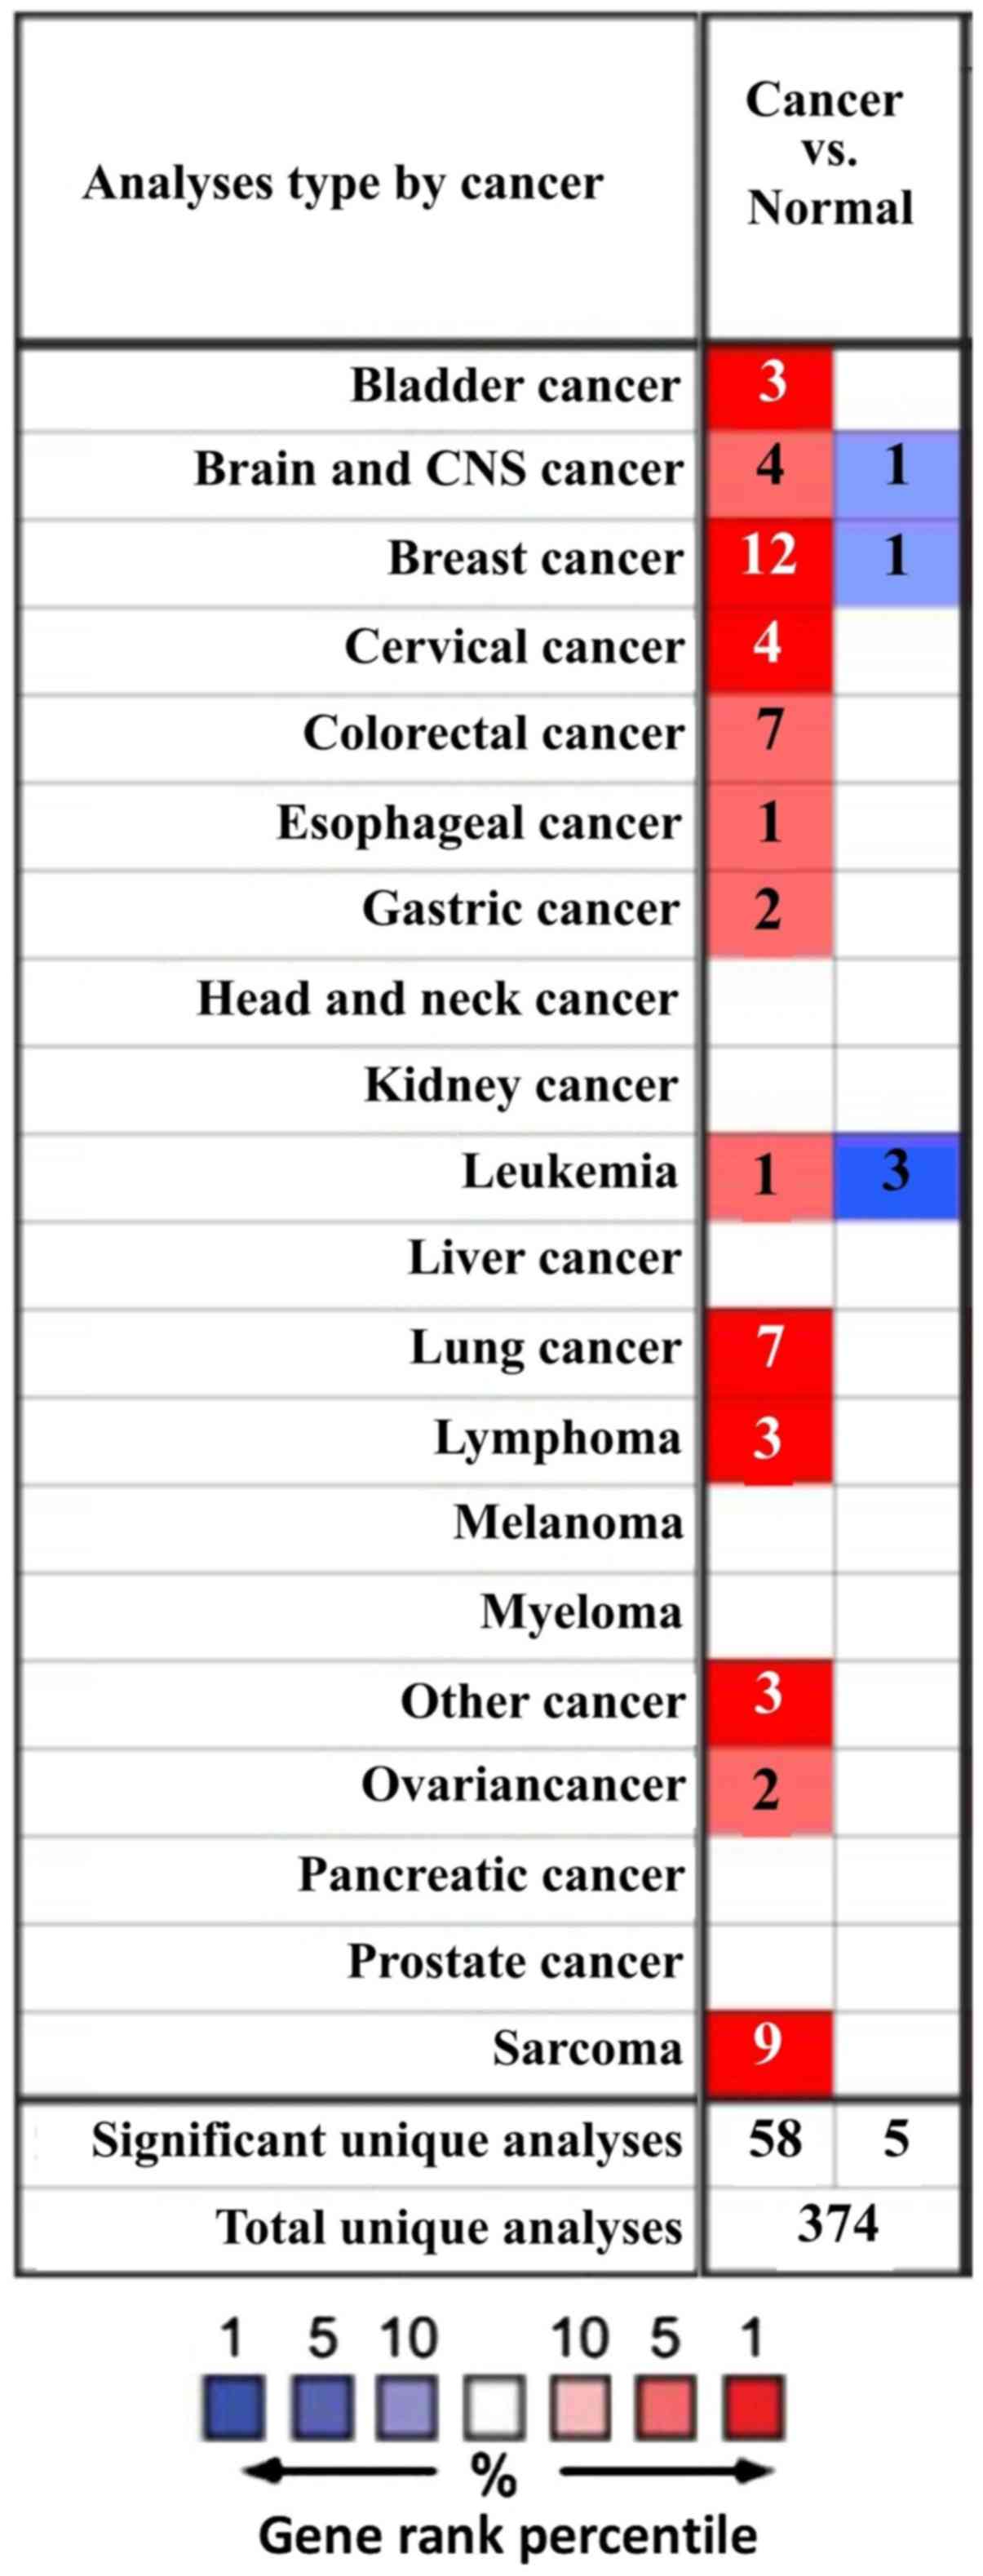
The difference in mRNA expression of GINS2 between
tumor and normal tissues, in multiple types of cancer, was analyzed
in the present study using the online Oncomine database. The
Oncomine database contained a total of 374 uniquely analyzed GINS2.
In the breast cancer analysis, the mRNA expression of GINS2 was
significantly upregulated and downregulated in 12 and one studies,
respectively (Figs. 1 and 2). In these 13 studies, Finak et al
(40) is the only study to have
demonstrated the downregulation of GINS2 in invasive breast
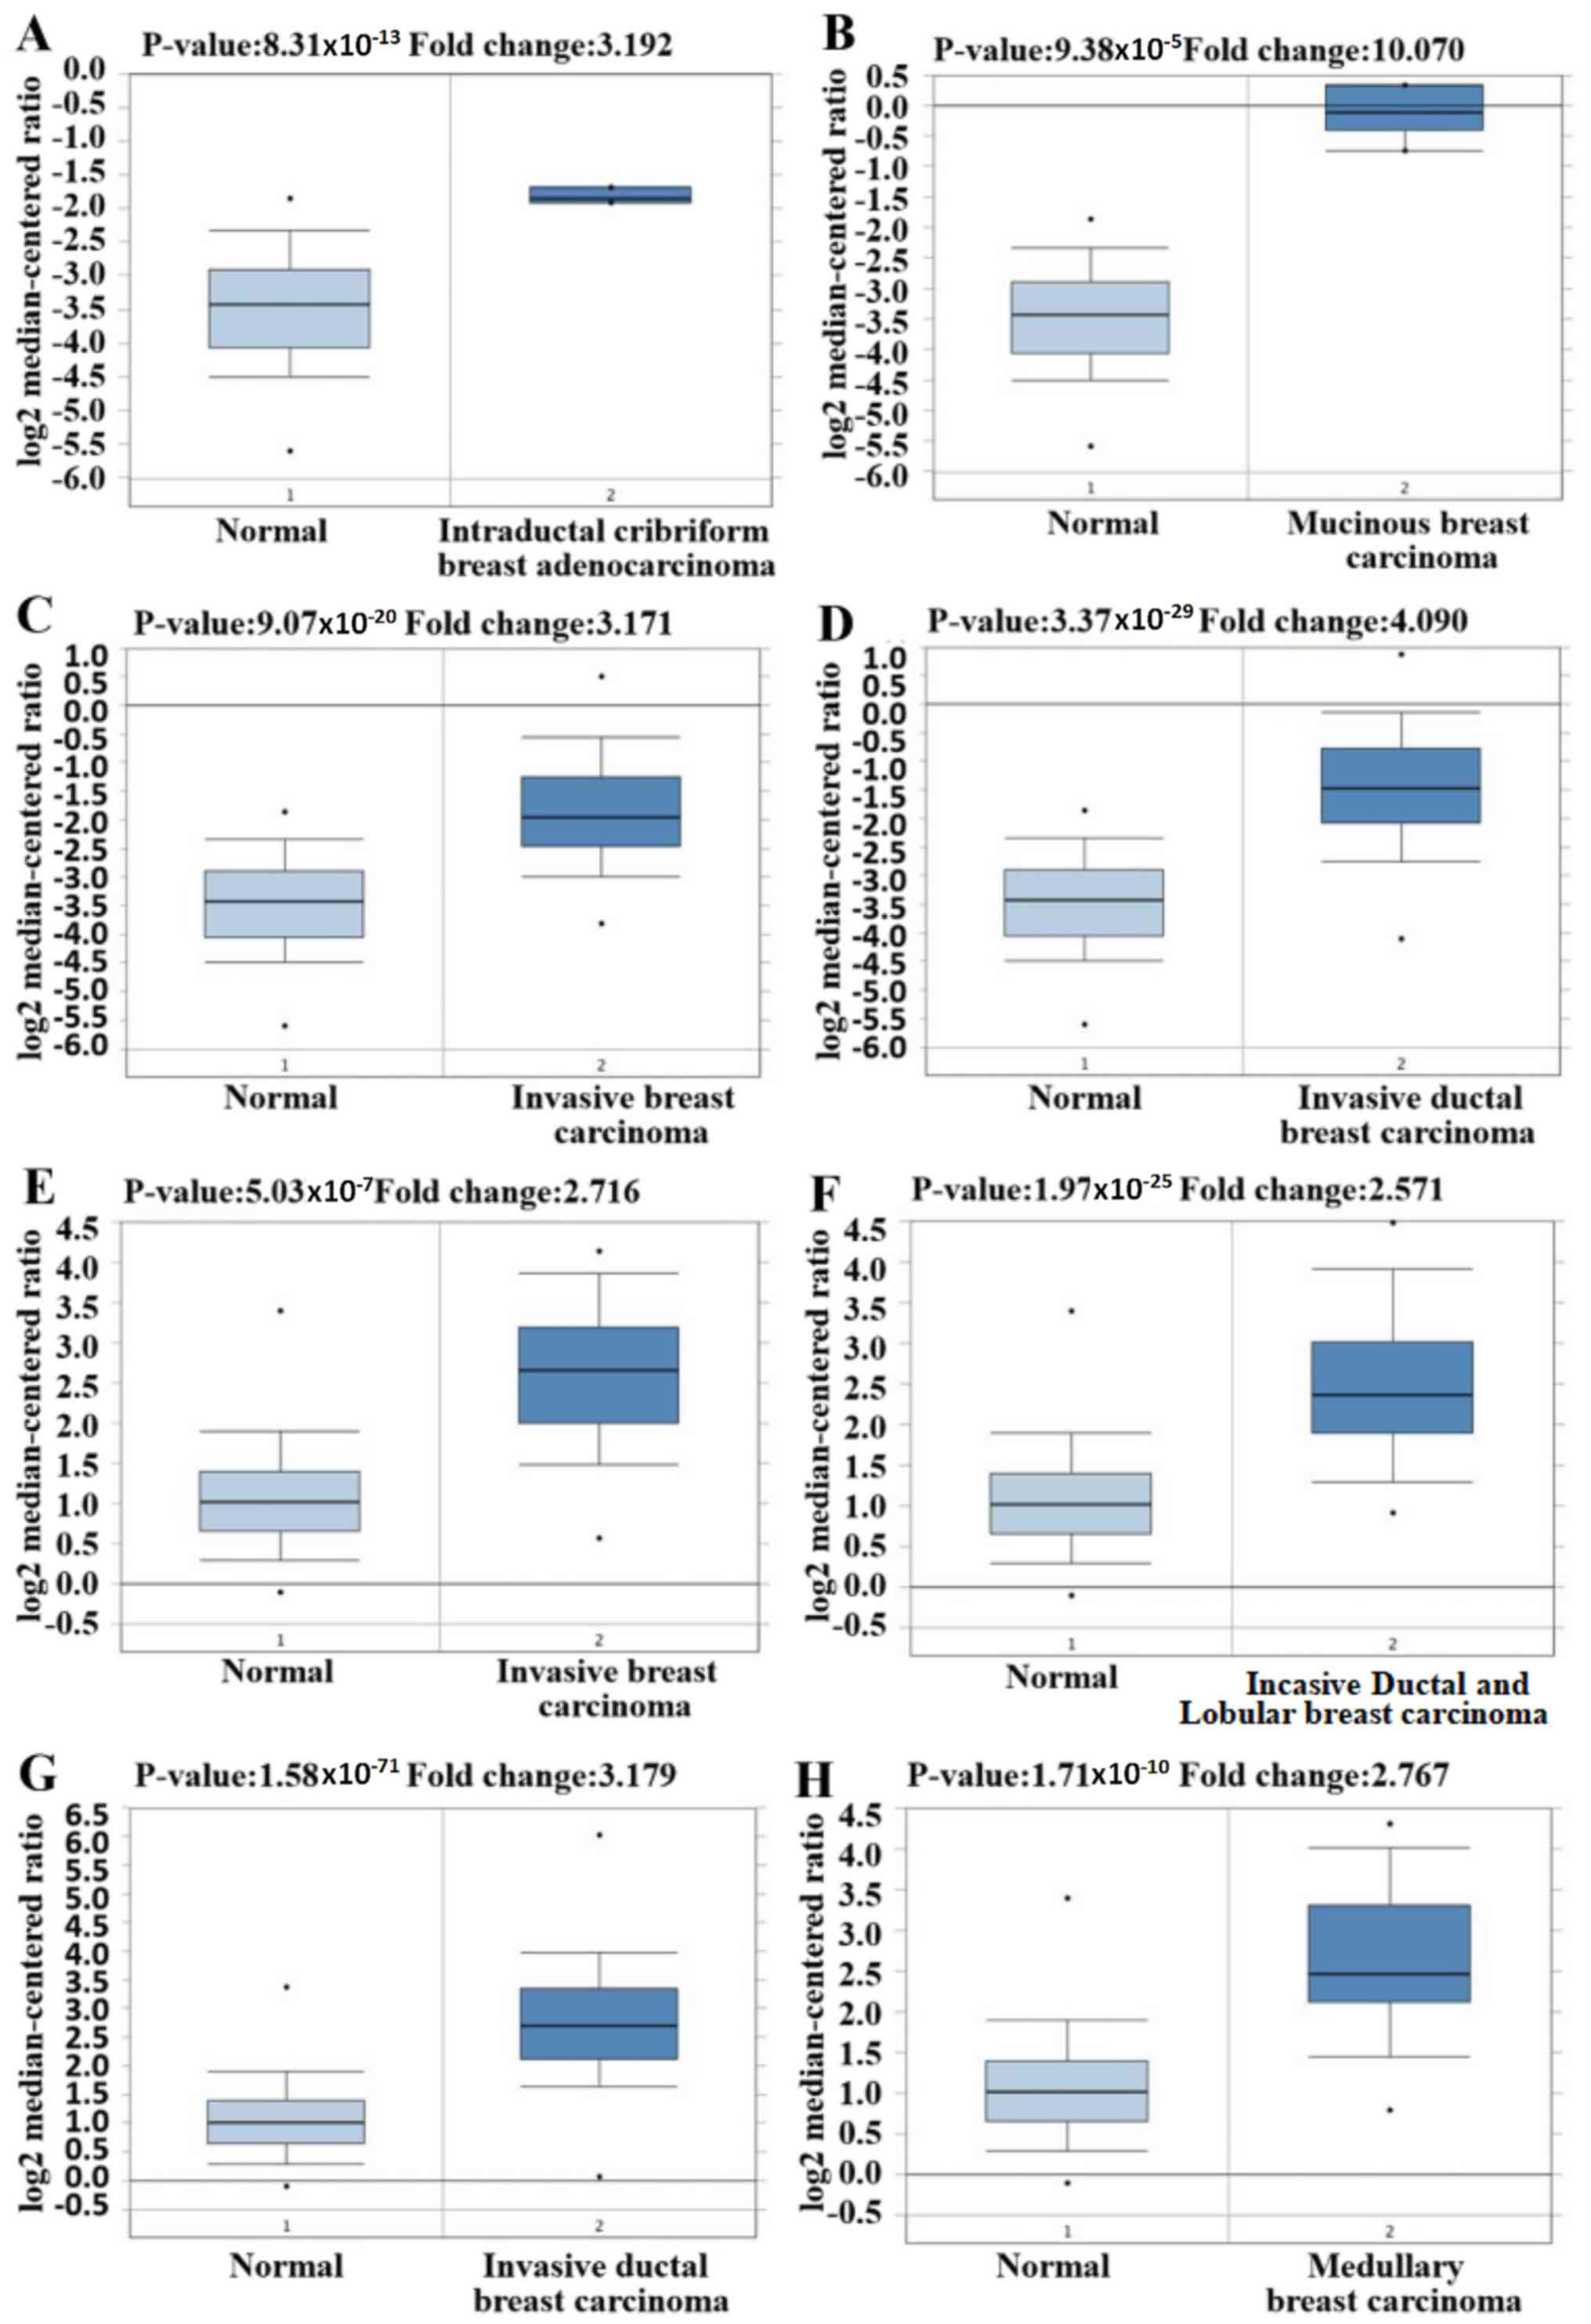
carcinoma, (P=1.88×10⁻²¹; fold change, −7.101; Fig. 2M). In contrast, 12 different datasets
revealed that GINS2 had higher mRNA expression in breast cancer
compared with normal breast tissues (41,42).
Different types of breast cancer, including: Invasive breast
carcinoma (P=5.03×10⁻⁷; fold change, 2.716; Fig. 2E); Invasive Ductal and Invasive
Lobular Breast Carcinoma (P=1.97×10⁻²⁵; fold change,
2.571; Fig. 2F); invasive ductal
breast carcinoma (P=1.58×10−71; fold change, 3.179;
Fig. 2G); medullary breast carcinoma
(P=1.71×10⁻¹⁰; fold change, 2.767; Fig. 2H); invasive lobular breast carcinoma
(P=4.43×10⁻²⁸; fold change, 2.132; Fig. 2K); mucinous breast carcinoma
(P=1.06×10⁻¹²; fold change, 2.586; Fig. 2L) and tubular breast carcinoma
(P=7.01×10⁻¹⁸; fold change, 2.107; Fig. 2I) demonstrated upregulated mRNA
expression of GINS2 in the Curtis Breast dataset (41). Furthermore, increased mRNA expression
of GINS2 in: Intraductal cribriform breast adenocarcinoma
(P=8.31×10⁻¹³; fold change, 3.192; Fig. 2A); mucinous breast carcinoma
(P=9.38×10⁻⁵; fold change, 10.070; Fig. 2B); invasive breast carcinoma
(P=9.07×10⁻²⁰; fold change, 3.171; Fig. 2C) and invasive ductal breast
carcinoma (P=3.37×10⁻²⁹; fold change, 4.090; Fig. 2D) was observed in TCGA datasets
(43) Increased mRNA expression of
GINS2 in ductal breast carcinoma (P=8.32×10⁻⁶; fold
change, 3.935; Fig. 2J) were
demonstrated in the Richardson Breast2 dataset (42). These data all indicate that GINS2
expression is markedly higher in breast cancer samples compared
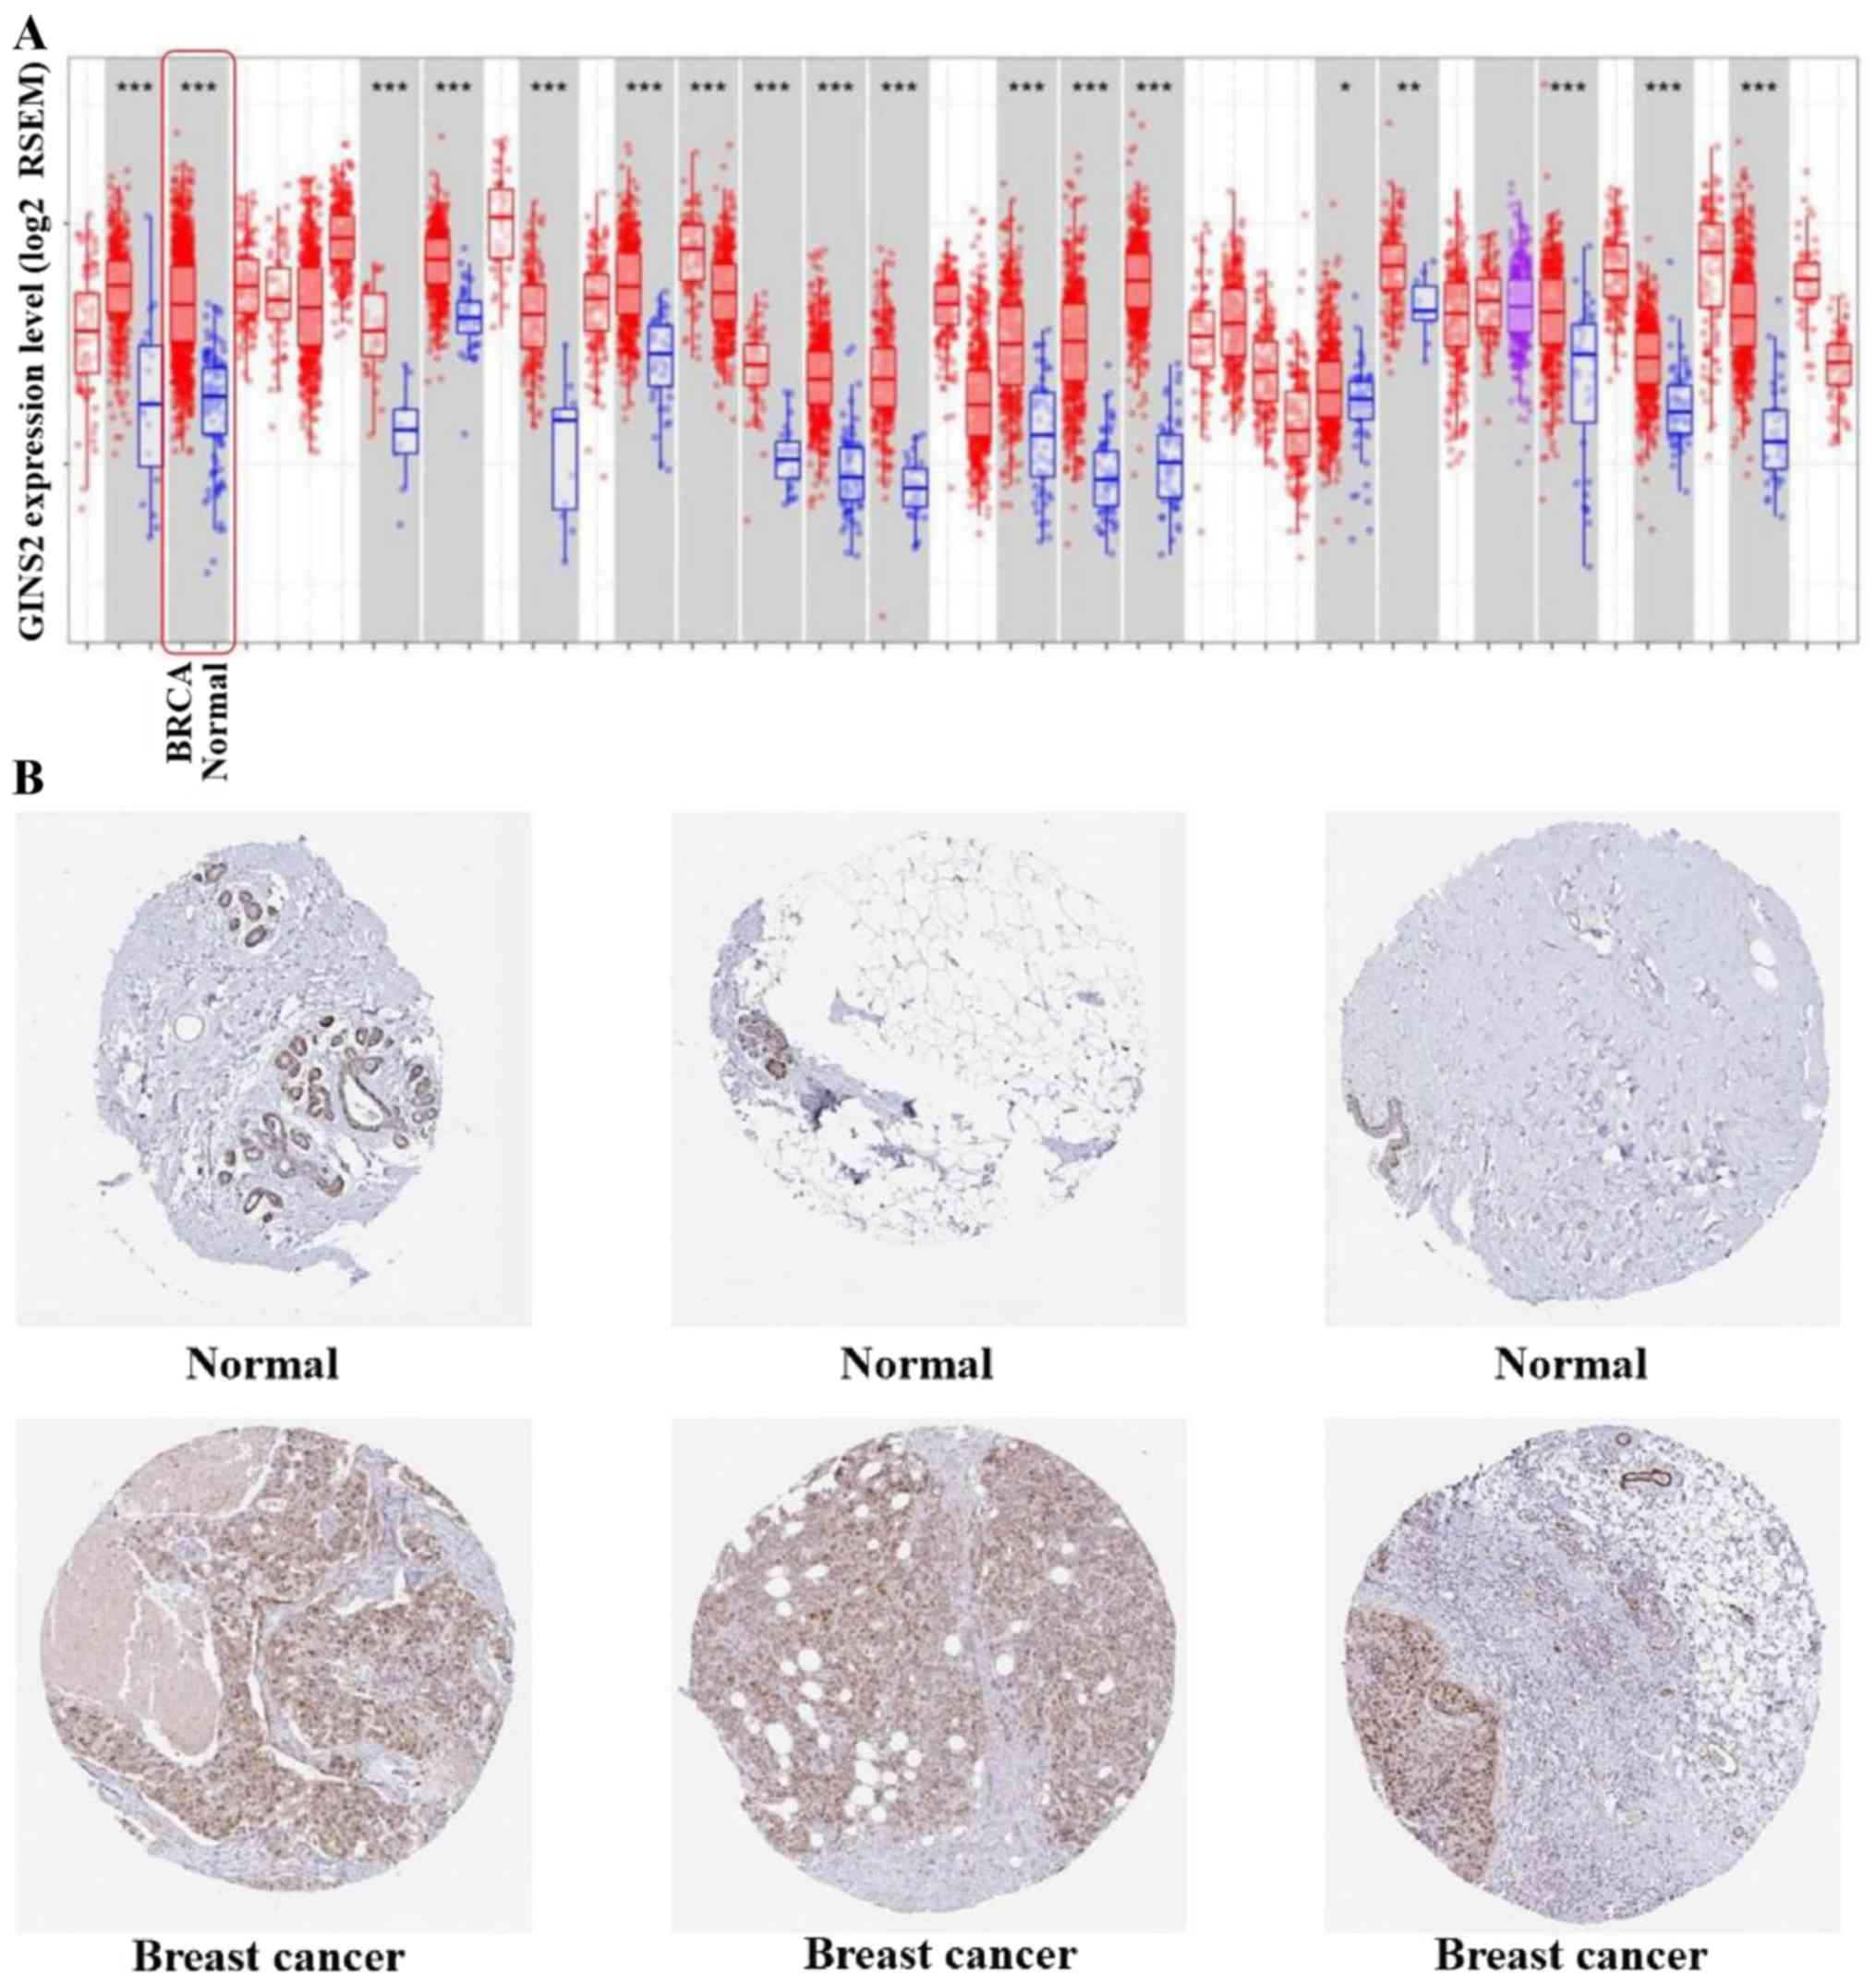
with in normal breast tissues. In order to further evaluate the
upregulation of GINS2 in breast cancer, the present study examined
GINS2 expression using the TIMER database. mRNA expression levels
of GINS2 between breast cancer and normal breast tissues were
compared. The results of the present study indicate that the
expression level of GINS2 is higher in BRCA compared with in normal
breast tissue (Fig. 3A).
However, IHC analysis obtained from the HPA database
contradicts this observation. GINS2 protein was identified across
both instances following staining with the HPA057285 antibody in
the glandular and myoepithelial cells in normal breast tissue and
the breast cancer tissues (all samples; Fig. 3B).
GINS2 mutation in breast cancer
The genetic alterations affecting GINS2 in breast
cancer samples were analyzed using the COSMIC online database. The
GINS2 mutations were tested in 2,522 samples from patients with
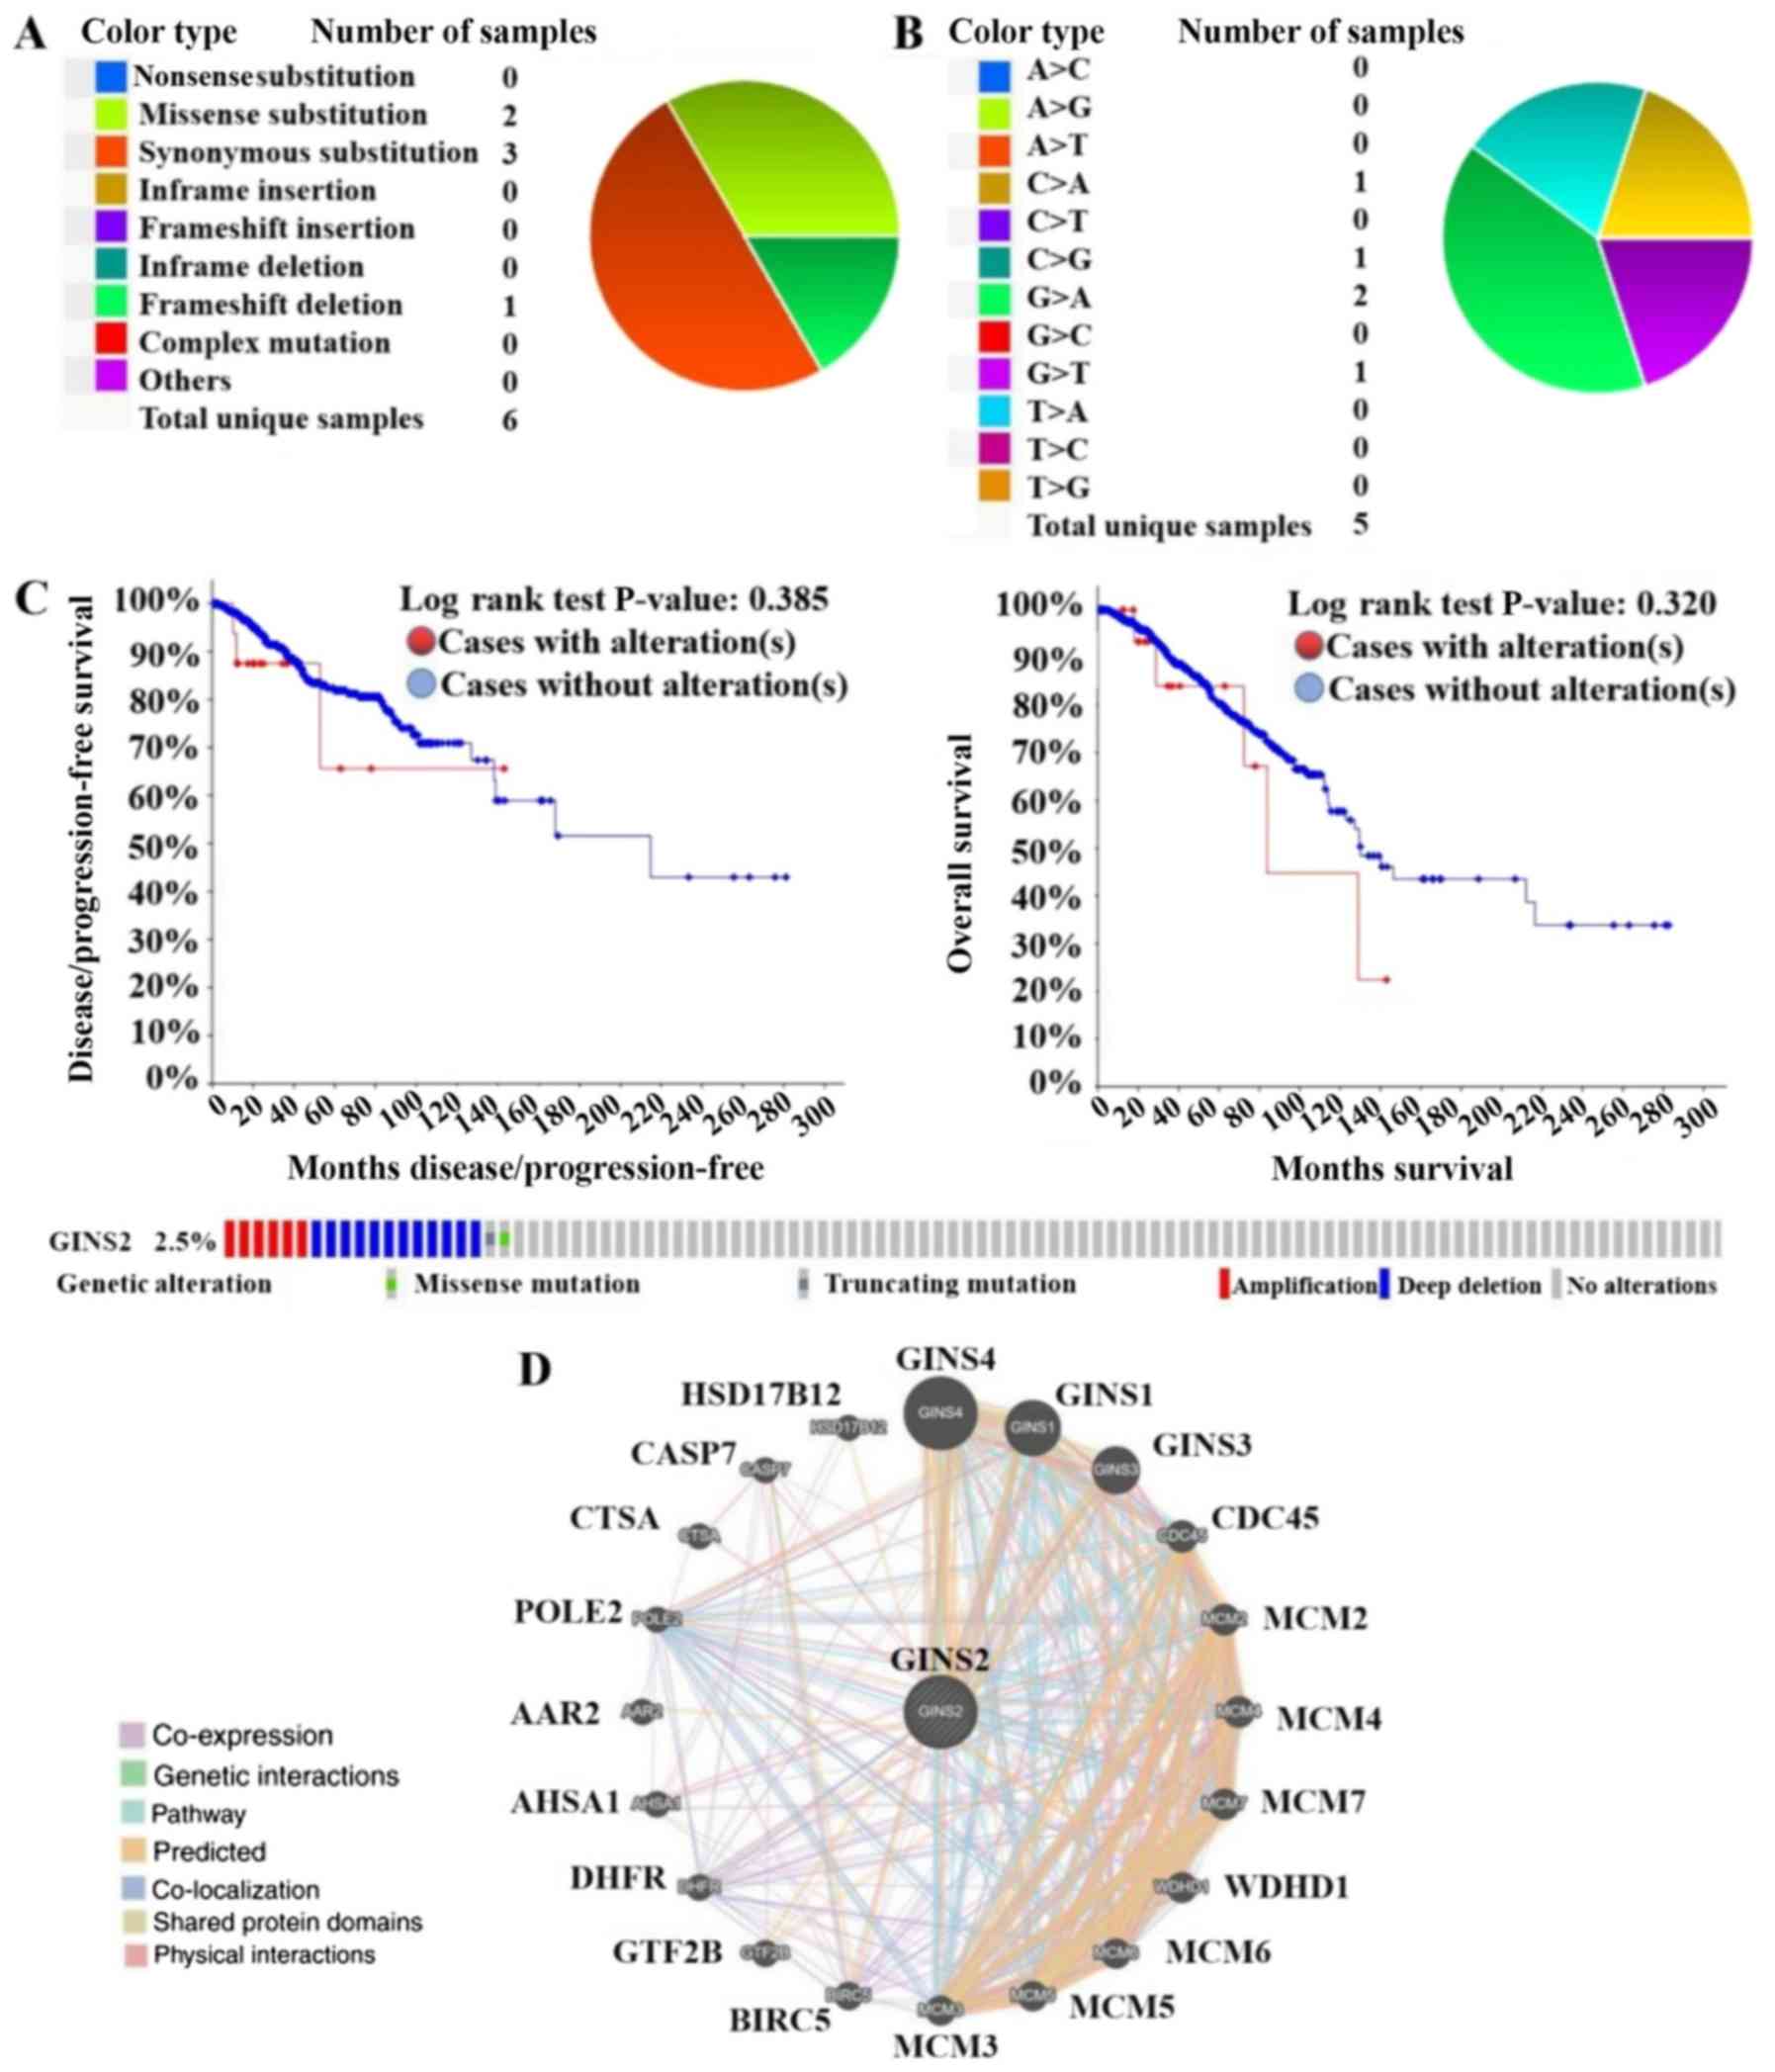
breast cancer. Of the five point mutations in the GINS2 gene, three
were synonymous and two were a missense mutation (Table I). A total of nine copy number
variations (CNV) were identified in breast cancer including, two
CNV gains and seven CNV losses (Table
I). A summary of the types of mutations in GINS2 are presented
on the pie chart in Fig. 4A. The
occurrence of a particular type of mutation is presented in
Table I, with the number next to it
indicating the percentage of mutations in all samples. The most
common type of mutation was synonymous substitution, which accounts
for 50% of all mutations. The mutations of the coding strand in
GINS2 are presented on the pie chart in Fig. 4B and there was 40% G>A mutations
in the GINS2 coding strand.
 | Table I.Genetic alterations affecting GINS2
in 2,522 breast cancer samples Catalogue of Somatic Mutations in
Cancer database. |
Table I.
Genetic alterations affecting GINS2
in 2,522 breast cancer samples Catalogue of Somatic Mutations in
Cancer database.
| Genetic
alteration | No. | Percentage, % |
|---|
| Substitution
missense | 2 | 0.08 |
| Substitution
synonymous | 3 | 0.12 |
| Substitution
nonsense | 0 | 0.00 |
| Copy number
gain | 2 | 0.08 |
| Copy number
loss | 7 | 0.28 |
| Insertion | 0 | 0.00 |
| Deletion | 1 | 0.04 |
In order to investigate the association between
survival time and gene alterations of GINS2 in breast cancer,
genetic alterations affecting GINS2 in breast cancer samples were
analyzed in the present study using the cBioPortal for Cancer
Genomics database. Mutations of GINS2 were tested in 816 samples
from patients with breast cancer in TCGA (38). Gene alterations of GINS2 were
demonstrated to have occurred in 20 of the 816 (2.5%) queried
samples. However, the results of the present study demonstrated
that there were no statistically significant difference between
OS/DFS and patients with breast cancer, with or without GINS2
alterations (P=0.320 and P=0.385, respectively; Fig. 4C).
Co-expression and neighboring genes of
GINS2 gene
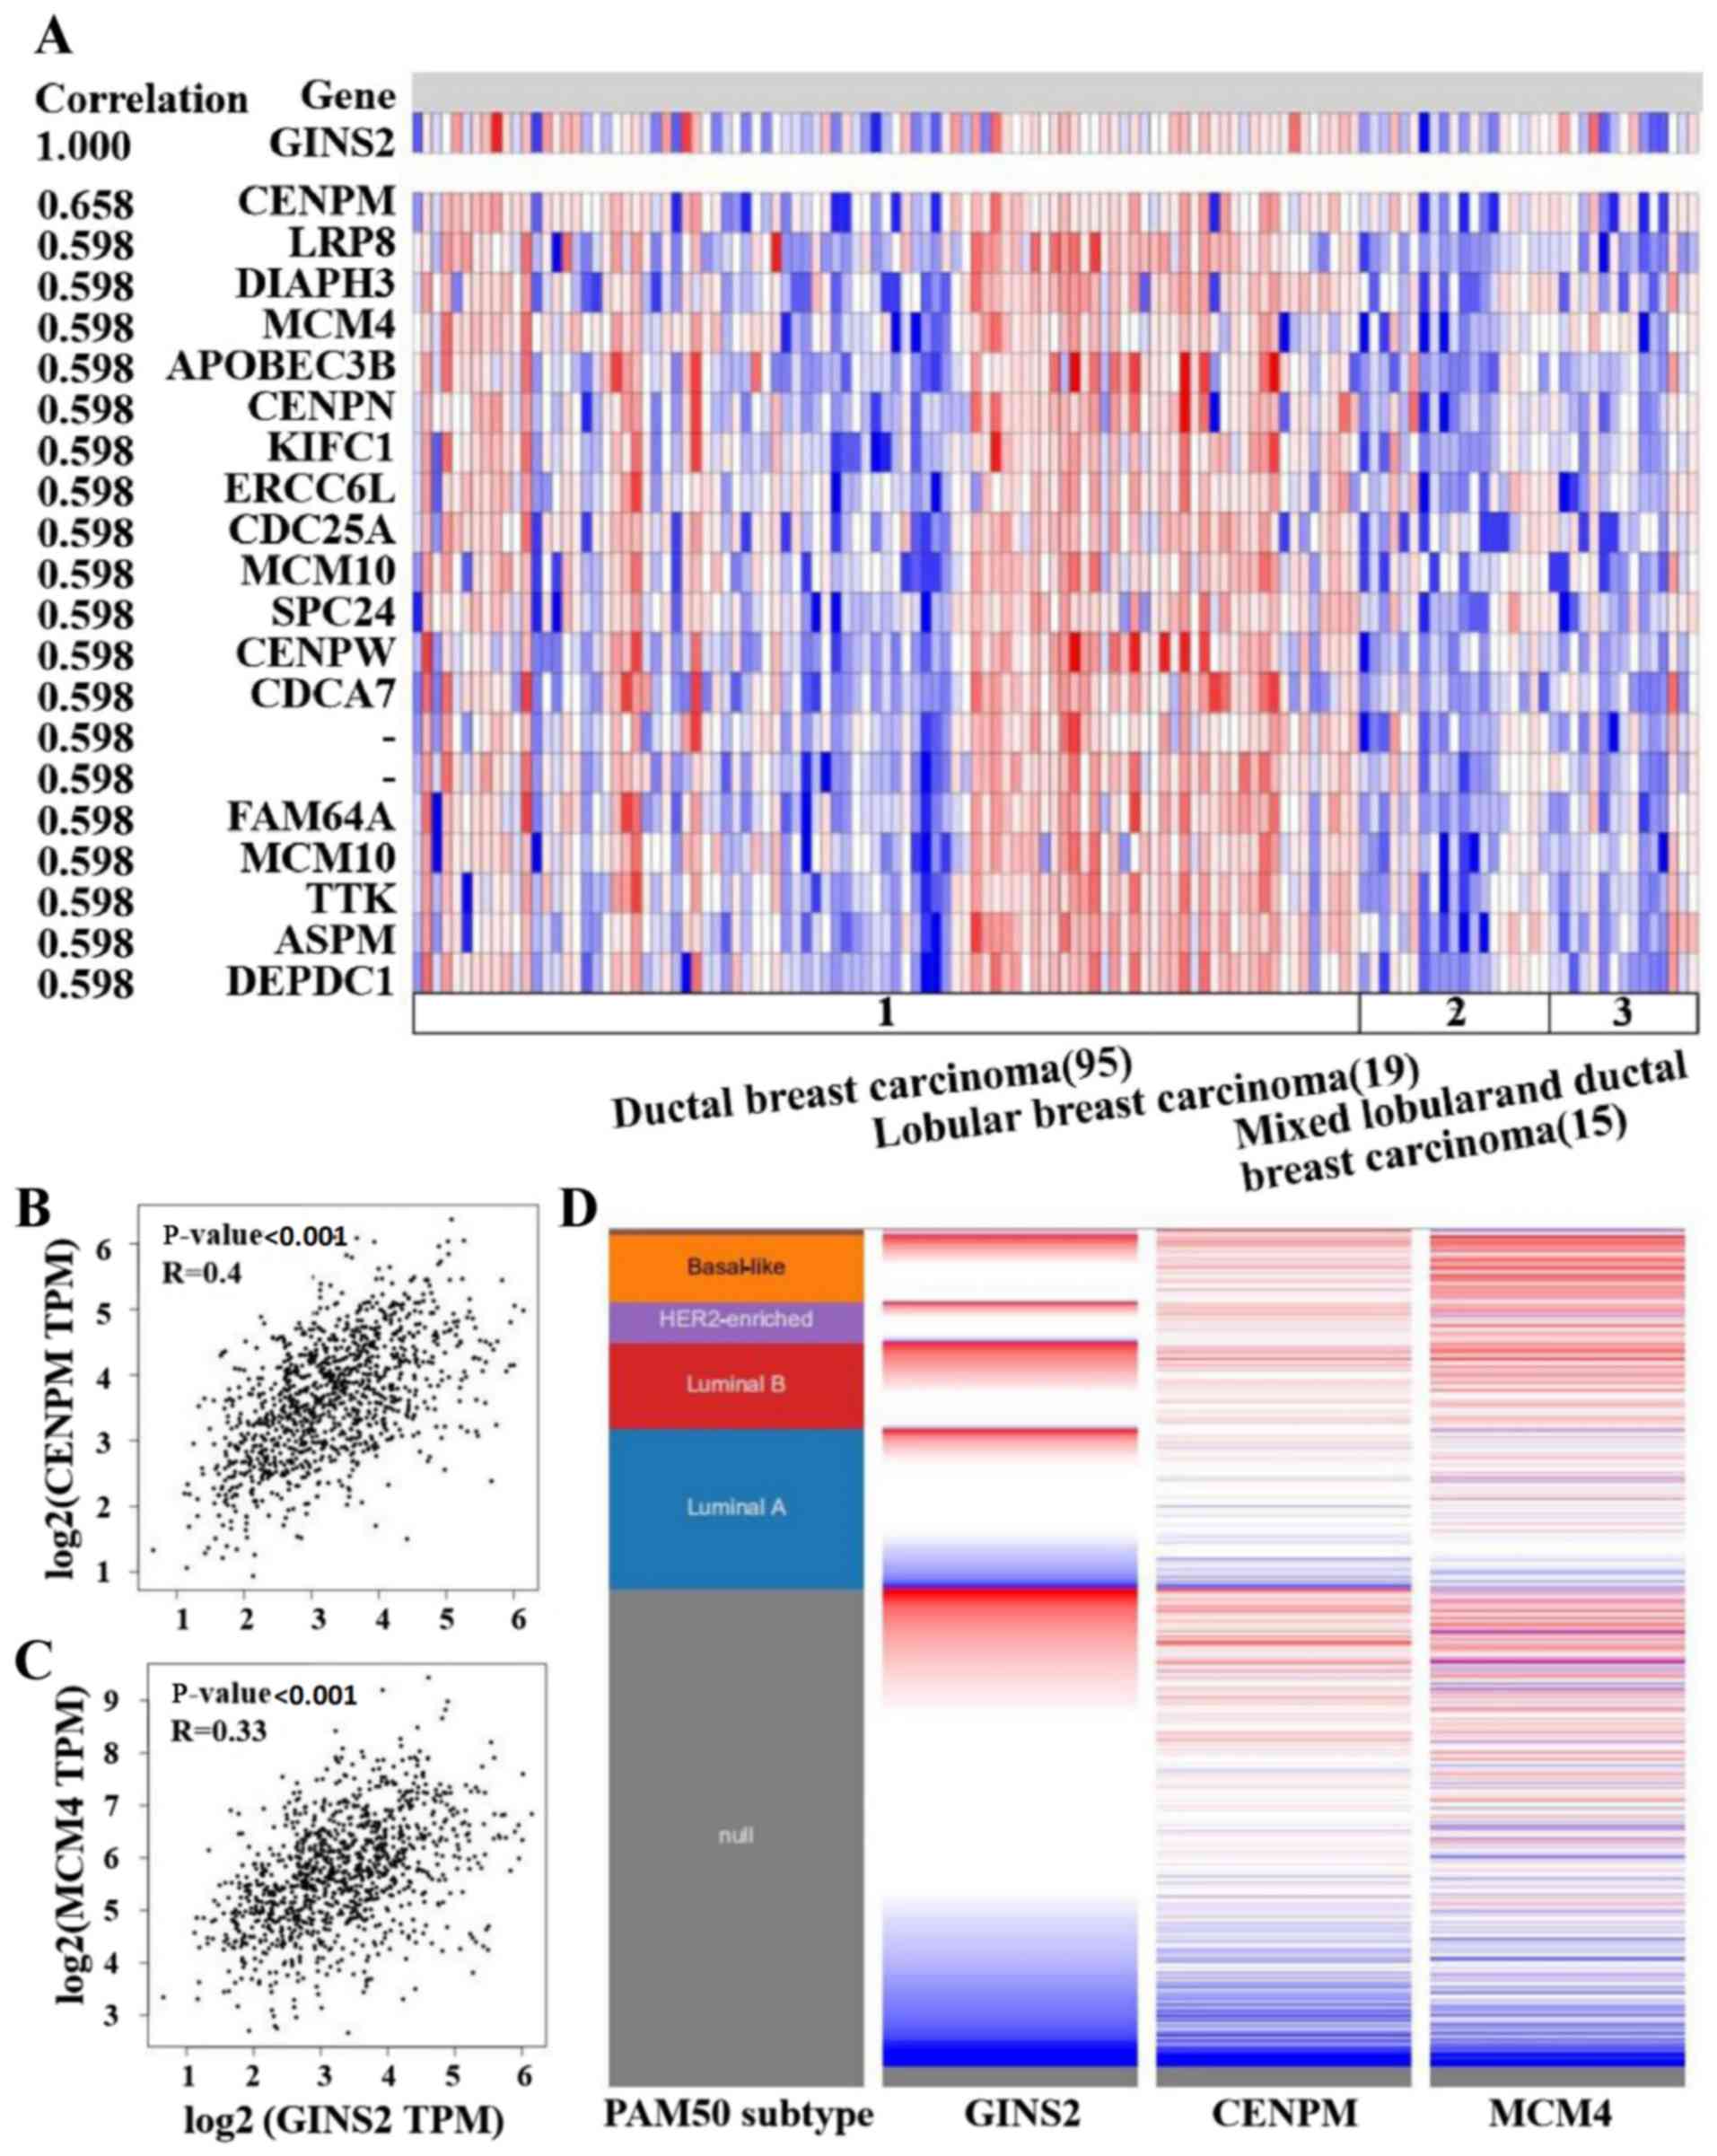
Co-expression of the GINS2 gene in breast cancer was
performed using the Oncomine database and genes co-expressed with
GINS2 were analyzed by Lu et al (44). The present study demonstrated that
GINS2 was associated with CENPM, LRP8, DIAPH3, MCM4, APOBEC3B,
CENPN, KIFC1, ERCC6L, CDC25A, MCM10, SPC24, CENPW, CDCA7, FAM64A,
MCM10, TTK, ASPM and DEPDC1 (Fig.
5A). Subsequently, the present study constructed a network
analysis of the neighboring genes of GINS2 using the GeneMANIA
database. The results of the present study demonstrated that the
following 20 genes; GINS4, GINS1, GINS3, CDC45, MCM2, MCM4, MCM7,
WDHD1, MCM6, MCM5, MCM3, BIRC5, GTF2B, DHFR, AHSA1, AAR2, POLE2,
CTSA, CASP7 and HSD17B12 were closely associated with GINS2
(Fig. 4D). In the Oncomine
co-expression analysis, CENPM ranked first with a score of 0.658.
Furthermore, the MCM4 also ranked with a high score of 0.598 in the
Oncomine co-expression analysis. Thus, heat maps derived from the
UCSC Xena database were used in order to compare GINS2, CENPM and
MCM4 expression. The results of the present study demonstrated that
GINS2 was upregulated when the expression level of CENPM and MCM4
were increased, which was determined using TCGA database (Fig. 5D). Furthermore, data mining in GEPIA
also revealed a positive association between GINS2, CENPM and MCM4.
However, the coefficients were relatively low between GINS2 and
CENPM (0.4) or MCM4 (0.33) (Fig. 5B and
C). Collectively, the results of the present study suggest that
in breast cancer, GINS2 may be associated with the CENPM and MCM4
signaling pathways.
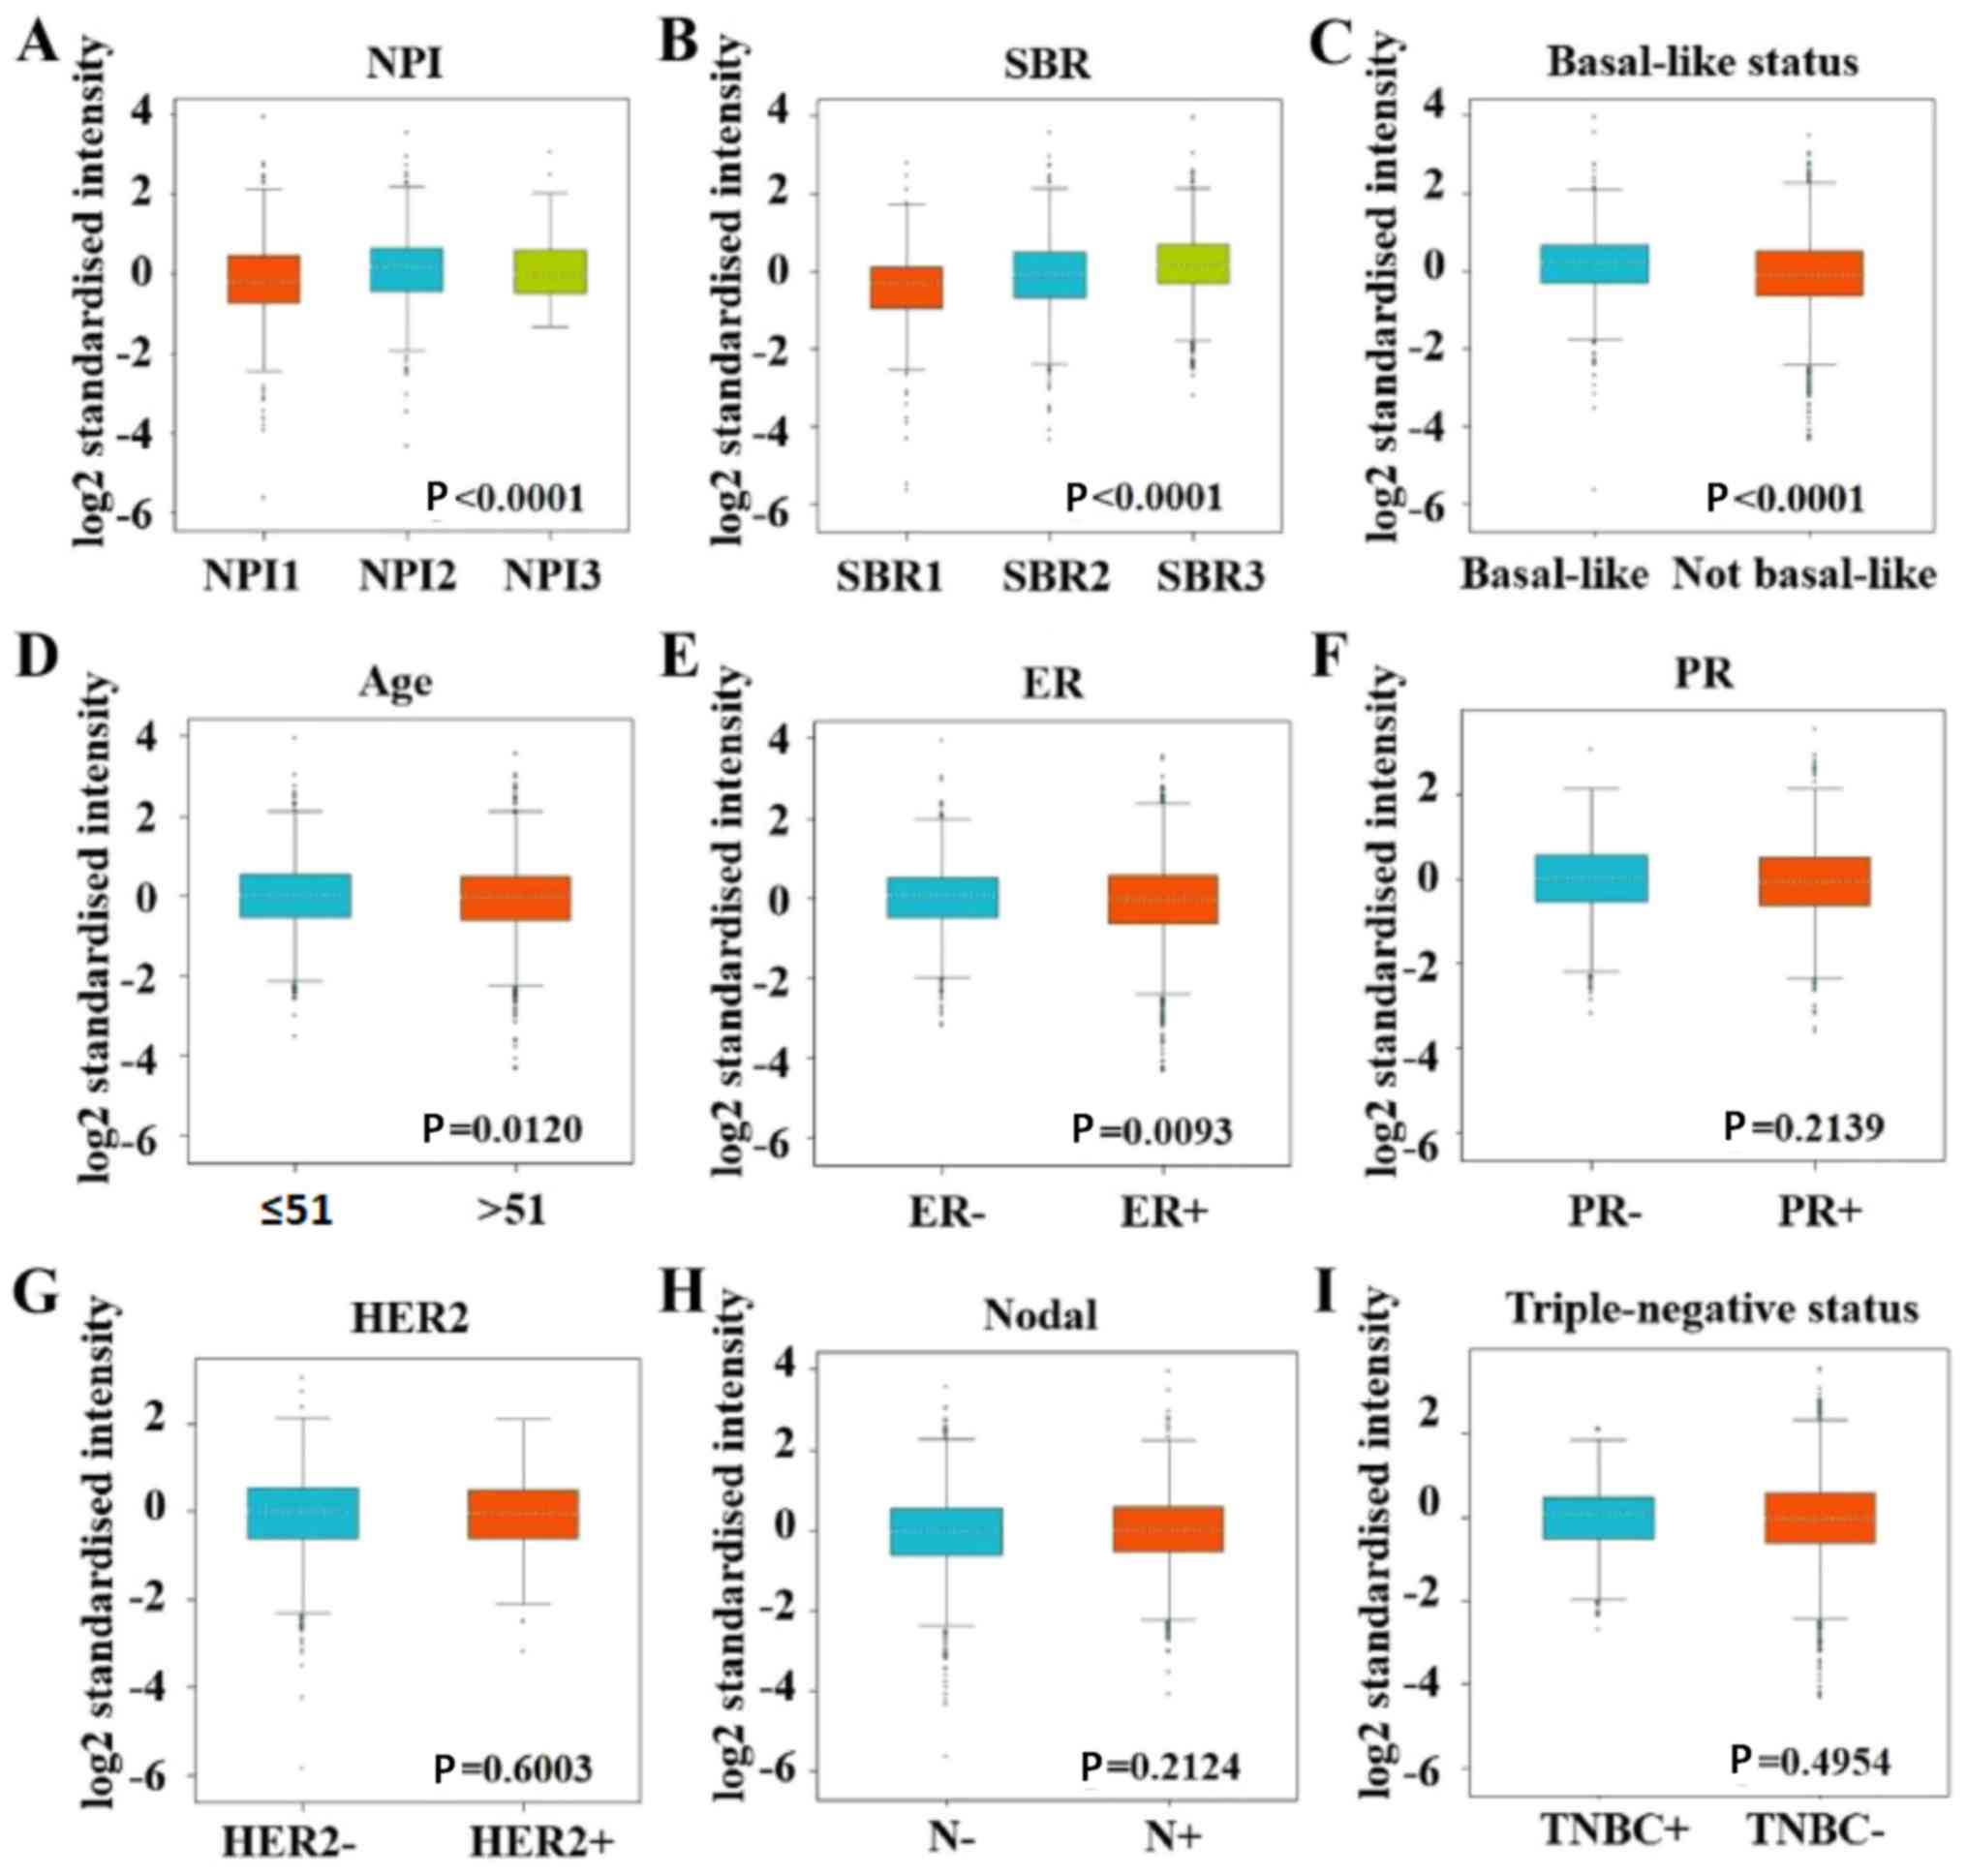
GINS2 expression and clinical
parameters of patients with breast cancer
Using the bc-GenExMiner database, the present study
also evaluated GINS2 expression in different groups, such as age
and ER expression status. Regarding age, GINS2 expression was
demonstrated to be significantly elevated in patients ≤51 years
(P=0.012; Fig. 6D). Patients with
estrogen receptor (ER)-negative breast cancer were demonstrated to
have significantly increased GINS2 gene expression compared with
ER-positive patients (P=0.0093; Fig.
6E). Regarding progesterone receptor (PR) status, human
epidermal growth factor receptor 2 (HER2) and triple-negative
status, there were no statistically significant differences in
GINS2 expression between the positive and negative groups (Fig. 6F, G and I). Similarly, there was no
statistically significant difference in GINS2 expression between
patients with positive and negative lymph nodes in breast cancer
(Fig. 6H). However, GINS2 expression
was significantly elevated in those patients with the basal-like
subtype of breast cancer compared with those with the
non-basal-like subtype (P<0.0001; Fig. 6C). The SBR grade and the NPI are
commonly accepted prognostic factors for histological grade and
tumor grade in breast cancer, respectively (22,23). The
results from the bc-GenExMiner database in the present study
demonstrated that an advanced SBR grade was associated with higher
GINS2 expression (Fig. 6B; Table II). As for NPI, GINS2 expression was
demonstrated to be higher in NPI2 compared with NPI1 (Fig. 6A; Table
II).
| Table II.GINS2 expression levels according to
the SBR grade status and NPI values. |
Table II.
GINS2 expression levels according to
the SBR grade status and NPI values.
| Group comparison
(GINS2) | P-value | Group comparison
(GINS2) | P-value |
|---|
| SBR2>SBR1 | P<0.0001 | NPI2>NPI1 | P<0.0001 |
| SBR3>SBR1 | P<0.0001 | NPI3=NPI2 | P>0.10 |
| SBR3>SBR2 | P<0.0001 | NPI3=NPI1 | P>0.10 |
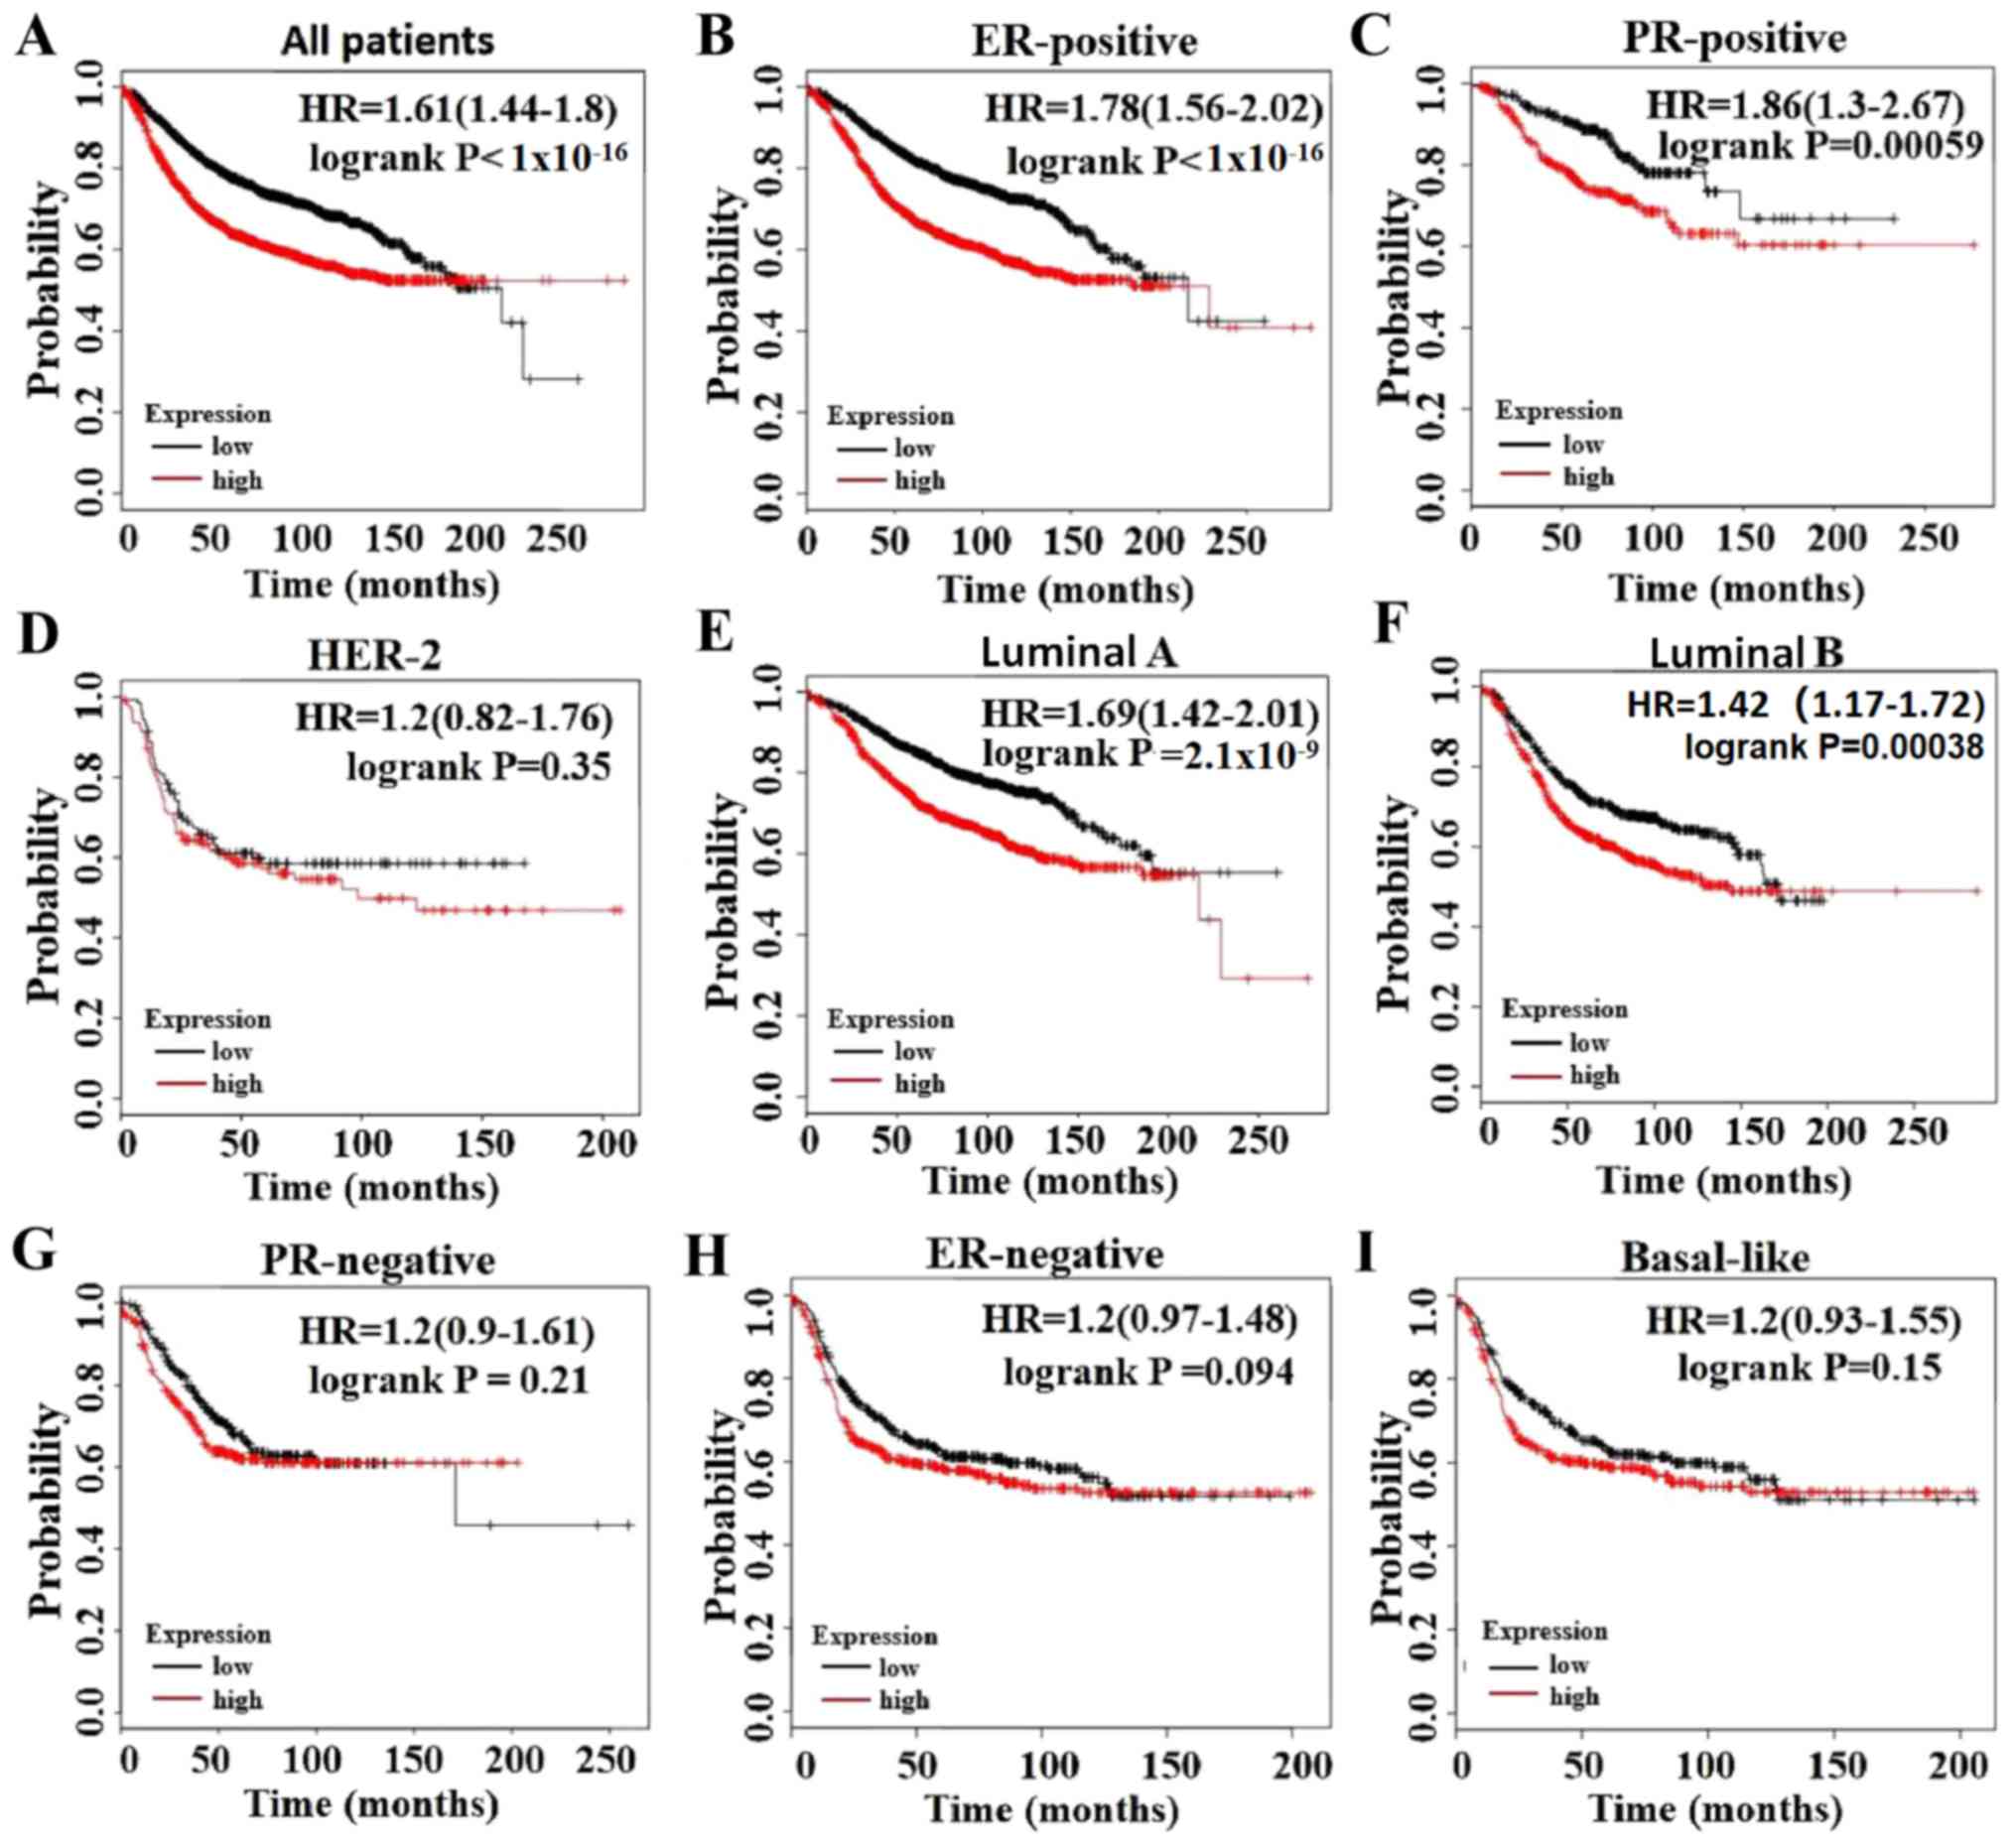
Prognostic value of GINS2 in patients
with breast cancer
The RFS rate was analyzed for GINS2 using the KM
plotter database. The present study demonstrated that elevated
GINS2 expression was associated with a poor prognosis of RFS in
patients with breast cancer [hazard ratio (HR), 1.61;
P<1×10⁻¹⁶; Fig. 7A].
In particular, the sub-analysis revealed that elevated GINS2 mRNA
expression was significantly associated with a poor prognosis of
RFS in the ER-positive (HR, 1.78; P<1×10⁻¹⁶; Fig. 7B) and PR-positive (HR, 1.86;
P=0.00059; Fig. 7C) subgroups of
patients with breast cancer, but not in the ER-negative (HR, 1.2;
P=0.094; Fig. 7H) and PR-negative
(HR, 1.2; P=0.21; Fig. 7G) subgroups
of patients. Furthermore, increased GINS2 mRNA expression was
significantly associated with a poor prognosis of RFS in patients
with unique molecular subtypes in Luminal-A (HR, 1.69;
P=2.1×10⁻⁹; Fig. 7E) and
Luminal-B (HR, 1.42; P=0.00038; Fig.
7F), but not in other molecular subtypes, including basal-like
type (HR, 1.2; P=0.15; Fig. 7I) and
HER2 type (HR, 1.2; P=0.35; Fig.
7D).
Discussion
Breast cancer comprises different subtypes that are
associated with unique biological and clinical features (45,46).
Previously, critical molecular biomarkers, such as ER, PR and
HER-2, have been identified and well characterized in breast cancer
(47,48). Therefore, understanding the role of
biomarkers in determining the prognosis and identifying appropriate
therapies in patients with breast cancer is critical.
The GINS complex is a protein complex that is
composed of SLD5, PSF1, PSF2 and PSF3 subunits, which correspond to
GINS4, GINS1, GINS2 and GINS3 in the human genome, respectively
(5). These four subunits are
structurally similar and are likely to have derived from a single
protein through gene duplication and a subsequent domain swap
(49). Previous studies have
demonstrated that GINS1 expression is elevated in bladder cancer
and GINS4 is upregulated in lung adenocarcinoma (50,51).
Furthermore, upregulation of GINS2 has also been reported in
different types of human cancer, including glioma, cervical cancer,
rectal cancer and lung adenocarcinoma (14–17).
Unlike GINS1 and GINS4, GINS2 is the only GINS subunit that has
previously been reported to be upregulated in patients with breast
cancer (18). Therefore, the role of
GINS2 in breast cancer requires further analyses.
GINS2 is a vital component of the CMG complex
(11). The CMG complex is the
eukaryotic replicative helicase and when the activity of DNA
helicases is altered diseases, such as cancer may occur, suggesting
that the CMG complex is tumor-associated (6–10).
Therefore, as a critical component of the CMG complex, the
upregulation of GINS2 may contribute to breast cancer. Furthermore,
the GINS complex plays an essential role in multiple biological
processes, such as cell cycle regulation, cell proliferation and
apoptosis; thus, as a significant part of the GINS complex, GINS2
may be closely associated with tumorigenesis (52,53).
However, to the best of our knowledge, the function of GINS2 as a
valid biomarker for poor prognosis in breast cancer remains
unknown.
In the present study, analyses of the TIMER,
bc-GenExMiner and Oncomine databases were performed in order to
determine the expression of GINS2 in breast cancer. In the Oncomine
and TIMER analyses, the present study demonstrated that upregulated
GINS2 expression was observed in different types of cancer.
Regarding breast cancer, the results of the present study indicated
that GINS2 expression was markedly higher in breast cancer tissues
compared with normal breast tissues. Furthermore, the results of
the bc-GenExMiner database in the present study demonstrated that
increased GINS2 expression was also associated with a basal-like
status, age ≤51 years and high SBR grade status in patients.
The positive association between increased GINS2
expression and the poor outcome of patients with breast cancer was
confirmed using the KM plotter database. In particular, the
sub-analysis revealed that elevated GINS2 mRNA expression was
associated with a poor prognosis of RFS in the patients with
ER-positive and PR-positive subgroups of breast cancer. In summary,
high GINS2 expression may serve as a useful prognostic biomarker in
patients with breast cancer. The present study also analyzed the
co-expression and neighboring genes of GINS2 using the Oncomine,
GeneMANIA, GEPIA and UCSC Xena databases, and confirmed that the
CENPM and MCM4 genes were positively associated with GINS2
expression. The results of the present study indicate that GINS2
could be associated with the CENPM and MCM4 signaling pathways in
breast cancer.
Overall, the present study demonstrated that
increased GINS2 expression may be a useful and predictive biomarker
for poor prognosis in patients with breast cancer. In addition,
GINS2 may be an effective predictive biomarker for prognosis with
co-expressed CENPM and MCM4 genes in breast cancer. The results of
the present study provide insight into the current understanding of
GINS2 in breast cancer. Nevertheless, further experiments and
clinical trials are required in order to clarify the involvement of
GINS2 in breast cancer.
Acknowledgements
Not applicable.
Funding
No funding was received.
Availability of data and materials
The datasets used and/or analyzed during the present
study are available from the corresponding author upon reasonable
request.
Authors' contributions
SY, SJ and LZ designed the present study. SY, KW and
PX wrote the initial manuscript and performed data analysis. YR, JH
and YL interpreted data, reviewed and edited the manuscript. All
authors read and approved the final manuscript.
Ethics approval and consent to
participate
Not applicable.
Patient consent for publication
Not applicable.
Competing interests
The authors declare that they have no competing
interests.
References
|
1
|
Bray F, Ferlay J, Soerjomataram I, Siegel
RL, Torre LA and Jemal A: Global cancer statistics 2018: GLOBOCAN
estimates of incidence and mortality worldwide for 36 cancers in
185 countries. CA Cancer J Clin. 68:394–424. 2018. View Article : Google Scholar : PubMed/NCBI
|
|
2
|
Denkert C, Loibl S, Noske A, Roller M,
Müller BM, Komor M, Budczies J, Darb-Esfahani S, Kronenwett R,
Hanusch C, et al: Tumor-associated lymphocytes as an independent
predictor of response to neoadjuvant chemotherapy in breast cancer.
J Clin Oncol. 28:105–113. 2010. View Article : Google Scholar : PubMed/NCBI
|
|
3
|
Filipits M, Rudas M, Jakesz R, Dubsky P,
Fitzal F, Singer CF, Dietze O, Greil R, Jelen A, Sevelda P, et al:
A new molecular predictor of distant recurrence in ER-positive,
HER2-negative breast cancer adds independent information to
conventional clinical risk factors. Clin Cancer Res. 17:6012–6020.
2011. View Article : Google Scholar : PubMed/NCBI
|
|
4
|
Park BW, Oh JW, Kim JH, Park SH, Kim KS,
Kim JH and Lee KS: Preoperative CA 15-3 and CEA serum levels as
predictor for breast cancer outcomes. Ann Oncol. 19:675–681. 2008.
View Article : Google Scholar : PubMed/NCBI
|
|
5
|
Lian YF, Li SS, Huang YL, Wei H, Chen DM,
Wang JL and Huang YH: Up-regulated and interrelated expressions of
GINS subunits predict poor prognosis in hepatocellular carcinoma.
Biosci Rep. 38(pii): BSR201811782018. View Article : Google Scholar : PubMed/NCBI
|
|
6
|
Bernstein KA, Gangloff S and Rothstein R:
The RecQ DNA helicases in DNA repair. Annu Rev Genet. 44:393–417.
2010. View Article : Google Scholar : PubMed/NCBI
|
|
7
|
van Brabant AJ, Stan R and Ellis NA: DNA
helicases, genomic instability and human genetic disease. Annu Rev
Genomics Hum Genet. 1:409–459. 2000. View Article : Google Scholar : PubMed/NCBI
|
|
8
|
Kim H and D'Andrea AD: Regulation of DNA
cross-link repair by the Fanconi anemia/BRCA pathway. Genes Dev.
26:1393–1408. 2012. View Article : Google Scholar : PubMed/NCBI
|
|
9
|
Wu Y, Shin-Ya K and Brosh RM Jr: FANCJ
helicase defective in Fanconia anemia and breast cancer unwinds
G-quadruplex DNA to defend genomic stability. Mol Cell Biol.
28:4116–4128. 2008. View Article : Google Scholar : PubMed/NCBI
|
|
10
|
Walne AJ, Vulliamy T, Kirwan M, Plagnol V
and Dokal I: Constitutional mutations in RTEL1 cause severe
dyskeratosis congenita. Am J Hum Genet. 92:448–453. 2013.
View Article : Google Scholar : PubMed/NCBI
|
|
11
|
Onesti S and MacNeill SA: Structure and
evolutionary origins of the CMG complex. Chromosoma. 122:47–53.
2013. View Article : Google Scholar : PubMed/NCBI
|
|
12
|
Kamada K: The GINS complex: Structure and
function. Subcell Biochem. 62:135–156. 2012. View Article : Google Scholar : PubMed/NCBI
|
|
13
|
Brosh RM Jr: DNA helicases involved in DNA
repair and their roles in cancer. Nat Rev Cancer. 13:542–558. 2013.
View Article : Google Scholar : PubMed/NCBI
|
|
14
|
Zheng M, Zhou Y, Yang X, Tang J, Wei D,
Zhang Y, Jiang JL, Chen ZN and Zhu P: High GINS2 transcript level
predicts poor prognosis and correlates with high histological grade
and endocrine therapy resistance through mammary cancer stem cells
in breast cancer patients. Breast Cancer Res Treat. 148:423–436.
2014. View Article : Google Scholar : PubMed/NCBI
|
|
15
|
Ouyang F, Liu J, Xia M, Lin C, Wu X, Ye L,
Song L, Li J, Wang J, Guo P and He M: GINS2 is a novel prognostic
biomarker and promotes tumor progression in early-stage cervical
cancer. Oncol Rep. 37:2652–2662. 2017. View Article : Google Scholar : PubMed/NCBI
|
|
16
|
Fischer U, Kim E, Keller A and Meese E:
Specific amplifications and copy number decreases during human
neural stem cells differentiation towards astrocytes, neurons and
oligodendrocytes. Oncotarget. 8:25872–25884. 2017. View Article : Google Scholar : PubMed/NCBI
|
|
17
|
Liu M, Pan H, Zhang F, Zhang Y, Zhang Y,
Xia H, Zhu J, Fu W and Zhang X: Identification of TNM
stage-specific genes in lung adenocarcinoma by genome-wide
expression profiling. Oncol Lett. 6:763–768. 2013. View Article : Google Scholar : PubMed/NCBI
|
|
18
|
Peng L, Song Z, Chen D, Linghu R, Wang Y,
Zhang X, Kou X, Yang J and Jiao S: GINS2 regulates matrix
metallopeptidase 9 expression and cancer stem cell property in
human triple negative Breast cancer. Biomed Pharmacother.
84:1568–1574. 2016. View Article : Google Scholar : PubMed/NCBI
|
|
19
|
Rhodes DR, Yu J, Shanker K, Deshpande N,
Varambally R, Ghosh D, Barrette T, Pandey A and Chinnaiyan AM:
ONCOMINE: A cancer microarray database and integrated data-mining
platform. Neoplasia. 6:1–6. 2004. View Article : Google Scholar : PubMed/NCBI
|
|
20
|
Jézéquel P, Campone M, Gouraud W,
Guérin-Charbonnel C, Leux C, Ricolleau G and Campion L:
bc-GenExMiner: An easy-to-use online platform for gene prognostic
analyses in breast cancer. Breast Cancer Res Treat. 131:765–775.
2012. View Article : Google Scholar : PubMed/NCBI
|
|
21
|
Jézéquel P, Frénel JS, Campion L,
Guérin-Charbonnel C, Gouraud W, Ricolleau G and Campone M:
bc-GenExMiner 3.0: New mining module computes breast cancer gene
expression correlation analyses. Database (Oxford).
2013:bas0602013. View Article : Google Scholar : PubMed/NCBI
|
|
22
|
Bansal C, Singh US, Misra S, Sharma KL,
Tiwari V and Srivastava AN: Comparative evaluation of the modified
Scarff-Bloom-Richardson grading system on breast carcinoma
aspirates and histopathology. Cytojournal. 9:42012. View Article : Google Scholar : PubMed/NCBI
|
|
23
|
Lee AH and Ellis IO: The Nottingham
prognostic index for invasive carcinoma of the breast. Pathol Oncol
Res. 14:113–115. 2008. View Article : Google Scholar : PubMed/NCBI
|
|
24
|
Cserni G, Chmielik E, Cserni B and Tot T:
The new TNM-based staging of breast cancer. Virchows Arch.
472:697–703. 2018. View Article : Google Scholar : PubMed/NCBI
|
|
25
|
Lánczky A, Nagy Á, Bottai G, Munkácsy G,
Szabó A, Santarpia L and Győrffy B: miRpower: A web-tool to
validate survival-associated miRNAs utilizing expression data from
2178 breast cancer patients. Breast Cancer Res Treat. 160:439–446.
2016. View Article : Google Scholar : PubMed/NCBI
|
|
26
|
Nagy A, Lánczky A, Menyhárt O and Győrffy
B: Validation of miRNA prognostic power in hepatocellular carcinoma
using expression data of independent datasets. Sci Rep. 8:92272018.
View Article : Google Scholar : PubMed/NCBI
|
|
27
|
Forbes SA, Beare D, Boutselakis H, Bamford
S, Bindal N, Tate J, Cole CG, Ward S, Dawson E, Ponting L, et al:
COSMIC: Somatic cancer genetics at high-resolution. Nucleic Acids
Res. 45:D777–D783. 2017. View Article : Google Scholar : PubMed/NCBI
|
|
28
|
Hinrichs AS, Raney BJ, Speir ML, Rhead B,
Casper J, Karolchik D, Kuhn RM, Rosenbloom KR, Zweig AS, Haussler D
and Kent WJ: UCSC data integrator and variant annotation
integrator. Bioinformatics. 32:1430–1432. 2016. View Article : Google Scholar : PubMed/NCBI
|
|
29
|
Hung JH and Weng Z: Visualizing genomic
annotations with the UCSC genome browser. Cold Spring Harb Protoc.
Nov 1–2016.(Epub ahead of print). doi: 10.1101/pdb.prot093062.
View Article : Google Scholar
|
|
30
|
Uhlen M, Zhang C, Lee S, Sjöstedt E,
Fagerberg L, Bidkhori G, Benfeitas R, Arif M, Liu Z, Edfors F, et
al: A pathology atlas of the human cancer transcriptome. Science.
357:eaan25072017. View Article : Google Scholar : PubMed/NCBI
|
|
31
|
Thul PJ, Åkesson L, Wiking M, Mahdessian
D, Geladaki A, Ait Blal H, Alm T, Asplund A, Björk L, Breckels LM,
et al: A subcellular map of the human proteome. Science.
356:eaal33212017. View Article : Google Scholar : PubMed/NCBI
|
|
32
|
Uhlén M, Fagerberg L, Hallström BM,
Lindskog C, Oksvold P, Mardinoglu A, Sivertsson Å, Kampf C,
Sjöstedt E, Asplund A, et al: Proteomics. Tissue-based map of the
human proteome. Science. 347:12604192015. View Article : Google Scholar : PubMed/NCBI
|
|
33
|
Tang Z, Li C, Kang B, Gao G, Li C and
Zhang Z: GEPIA: A web server for cancer and normal gene expression
profiling and interactive analyses. Nucleic Acids Res. 45:W98–W102.
2017. View Article : Google Scholar : PubMed/NCBI
|
|
34
|
GTEx Consortium: The genotype-tissue
expression (GTEx) project. Nat Genet. 45:580–585. 2013. View Article : Google Scholar : PubMed/NCBI
|
|
35
|
Wu P, Heins ZJ, Muller JT, Katsnelson L,
de Bruijn I, Abeshouse AA, Schultz N, Fenyö D and Gao J:
Integration and analysis of CPTAC proteomics data in the context of
cancer genomics in the cBioPortal. Mol Cell Proteomics.
18:1893–1898. 2019. View Article : Google Scholar : PubMed/NCBI
|
|
36
|
Cerami E, Gao J, Dogrusoz U, Gross BE,
Sumer SO, Aksoy BA, Jacobsen A, Byrne CJ, Heuer ML, Larsson E, et
al: The cBio cancer genomics portal: An open platform for exploring
multidimensional cancer genomics data. Cancer Discov. 2:401–404.
2012. View Article : Google Scholar : PubMed/NCBI
|
|
37
|
Gao J, Aksoy BA, Dogrusoz U, Dresdner G,
Gross B, Sumer SO, Sun Y, Jacobsen A, Sinha R, Larsson E, et al:
Integrative analysis of complex cancer genomics and clinical
profiles using the cBioPortal. Sci Signal. 6:pl12013. View Article : Google Scholar : PubMed/NCBI
|
|
38
|
Ciriello G, Gatza ML, Beck AH, Wilkerson
MD, Rhie SK, Pastore A, Zhang H, McLellan M, Yau C, Kandoth C, et
al: Comprehensive molecular portraits of invasive lobular breast
cancer. Cell. 163:506–519. 2015. View Article : Google Scholar : PubMed/NCBI
|
|
39
|
Li T, Fan J, Wang B, Traugh N, Chen Q, Liu
JS, Li B and Liu XS: TIMER: A web server for comprehensive analysis
of tumor-infiltrating immune cells. Cancer Res. 77:e108–e110. 2017.
View Article : Google Scholar : PubMed/NCBI
|
|
40
|
Finak G, Bertos N, Pepin F, Sadekova S,
Souleimanova M, Zhao H, Chen H, Omeroglu G, Meterissian S, Omeroglu
A, et al: Stromal gene expression predicts clinical outcome in
breast cancer. Nat Med. 14:518–527. 2008. View Article : Google Scholar : PubMed/NCBI
|
|
41
|
Curtis C, Shah SP, Chin SF, Turashvili G,
Rueda OM, Dunning MJ, Speed D, Lynch AG, Samarajiwa S, Yuan Y, et
al: The genomic and transcriptomic architecture of 2,000 breast
tumours reveals novel subgroups. Nature. 486:346–352. 2012.
View Article : Google Scholar : PubMed/NCBI
|
|
42
|
Richardson AL, Wang ZC, De Nicolo A, Lu X,
Brown M, Miron A, Liao X, Iglehart JD, Livingston DM and Ganesan S:
X chromosomal abnormalities in basal-like human breast cancer.
Cancer Cell. 9:121–132. 2006. View Article : Google Scholar : PubMed/NCBI
|
|
43
|
Cancer Genome Atlas Network: Comprehensive
molecular portraits of human breast tumours. Nature. 490:61–70.
2012. View Article : Google Scholar : PubMed/NCBI
|
|
44
|
Lu X, Lu X, Wang ZC, Iglehart JD, Zhang X
and Richardson AL: Predicting features of breast cancer with gene
expression patterns. Breast Cancer Res Treat. 108:191–201. 2008.
View Article : Google Scholar : PubMed/NCBI
|
|
45
|
Prat A, Pineda E, Adamo B, Galván P,
Fernández A, Gaba L, Díez M, Viladot M, Arance A and Muñoz M:
Clinical implications of the intrinsic molecular subtypes of breast
cancer. Breast. 24 (Suppl 2):S26–S35. 2015. View Article : Google Scholar : PubMed/NCBI
|
|
46
|
Taherian-Fard A, Srihari S and Ragan MA:
Breast cancer classification: Linking molecular mechanisms to
disease prognosis. Brief Bioinform. 16:461–474. 2015. View Article : Google Scholar : PubMed/NCBI
|
|
47
|
Mar-Aguilar F, Mendoza-Ramírez JA,
Malagón-Santiago I, Espino-Silva PK, Santuario-Facio SK,
Ruiz-Flores P, Rodríguez-Padilla C and Reséndez-Pérez D: Serum
circulating microRNA profiling for identification of potential
breast cancer biomarkers. Dis Markers. 34:163–169. 2013. View Article : Google Scholar : PubMed/NCBI
|
|
48
|
Nicolini A, Ferrari P and Duffy MJ:
Prognostic and predictive biomarkers in breast cancer: Past,
present and future. Semin Cancer Biol. 52:56–73. 2018. View Article : Google Scholar : PubMed/NCBI
|
|
49
|
Carroni M, De March M, Medagli B,
Krastanova I, Taylor IA, Amenitsch H, Araki H, Pisani FM,
Patwardhan A and Onesti S: New insights into the GINS complex
explain the controversy between existing structural models. Sci
Rep. 7:401882017. View Article : Google Scholar : PubMed/NCBI
|
|
50
|
Yamane K, Naito H, Wakabayashi T, Yoshida
H, Muramatsu F, Iba T, Kidoya H and Takakura N: Regulation of SLD5
gene expression by miR-370 during acute growth of cancer cells. Sci
Rep. 6:1–12. 2016. View Article : Google Scholar : PubMed/NCBI
|
|
51
|
Tane S, Sakai Y, Hokka D, Okuma H, Ogawa
H, Tanaka Y, Uchino K, Nishio W, Yoshimura M and Maniwa Y:
Significant role of Psf3 expression in non-small-cell lung cancer.
Cancer Sci. 106:1625–1634. 2015. View Article : Google Scholar : PubMed/NCBI
|
|
52
|
Mohri T, Ueno M, Nagahama Y, Gong ZY,
Asano M, Oshima H, Oshima M, Fujio Y and Takakura N: Requirement of
SLD5 for early embryogenesis. PLoS One. 8:e789612013. View Article : Google Scholar : PubMed/NCBI
|
|
53
|
Zhang J, Wu Q, Wang Z, Zhang Y, Zhang G,
Fu J and Liu C: Knockdown of PSF1 expression inhibits cell
proliferation in lung cancer cells in vitro. Tumour Biol.
36:2163–2168. 2015. View Article : Google Scholar : PubMed/NCBI
|