Introduction
Malnutrition occurs in 20–70% of cancer patients,
and patients with gastrointestinal cancer are at particularly high
risk (1). Also, malnutrition is
reported to occur more frequently with cancer progression (1). According to a study by Zhang et
al, only 2% of patients with advanced gastrointestinal cancer
did not require nutrition intervention, and 57.4% of them required
management of malnutrition-related symptoms and nutritional support
(2).
Proinflammatory cytokines such as interleukin (IL)-6
and tumor necrosis factor (TNF)-α are known to have the
pro-tumorgenic functions (3) and are
also produced by cancer tissues, including interstitial cells
(4). The serum levels of these
cytokines were reported to positively correlate with cancer stages
(4–7). These cytokines can affect
neuroendocrine control of appetite, leading to anorexia and
hypermetabolism, resulting in muscle wasting (1). Cancer-induced metabolic disorder
progresses gradually, eventually leading to refractory cachexia
(8). Inflammatory cytokines
stimulate the activity of anorectic proopiomelanocortin neurons and
inhibit the activity of orexigenic neuropeptide Y (NPY) neurons in
patients with cachexia (9).
Inflammatory cytokines also induce NF-κB activation. NF-κB affects
the expression of genes that regulate the ubiquitin proteasome
pathway (UPP) and promotes the loss of protein (10), resulting in decreased in fat-free
mass (FFM).
Appetite-regulating hormones such as ghrelin and
leptin, play an important role in cancer patients. Ghrelin is
present in two forms: An inactive form known as deacylated ghrelin,
and an active form, the acylated ghrelin that accounts for ~10% of
the total amount of ghrelin and is synthesized under the action of
ghrelin O-acyltransferase (GOAT) (11–13).
GOAT expression and activity are modulated by nutrient
availability, particularly by the availability of medium-chain
fatty acids, which are used as acylation substrates and promote
acyl-ghrelin production and secretion (14). Ghrelin is secreted from the stomach
and acts on the hypothalamic NPY, an appetite promoting peptide, to
increase appetite and suppress energy metabolism (11,15,16),
whereas leptin is secreted from adipocytes and acts on the
hypothalamus to suppress food intake and increase energy metabolism
(15). Total ghrelin levels were
found to be significantly higher in cancer patients with cachexia
than in cancer patients without cachexia (17–19),
which suggests that cachexia could be a state of ghrelin resistance
accompanied by increases in active ghrelin and the ratio of
acylated to total ghrelin levels (20). However, the precise mechanism of
ghrelin resistance is unknown. It is also possible that ghrelin
levels increase to compensate for the increased metabolic rate and
energy often observed in patients with cancer cachexia (21).
Early detection and assessment of weight loss and
undernutrition, as well as provision of adequate nutrition therapy,
enable cancer patients to maintain good nutritional status
(1). In this study, we focused on
the following two screening tools for assessment of nutritional
status: The Subjective Global Assessment (SGA), described by Baker
et al in 1982 (22), which
assesses nutritional status based solely on disease history and
findings of physical examination; and the Patient-Generated
Subjective Global Assessment (PG-SGA), which was proposed by Ottery
in 1994 and has been used by the American Dietetic Association as a
screening tool for cancer patients (23). The PG-SGA comprises items included in
the SGA as well as items to assess problems affecting dietary
intake and nutritional status in cancer patients. Bauer et
al reported that the undernourished status in cancer patients
can be assessed in the early stages using PG-SGA (24).
There is no well-accepted concept of energy
metabolism in patients with gastrointestinal cancer. Some reports
have found that resting energy expenditure (REE) and basal energy
expenditure (BEE) were similar in cancer patients (25,26),
while others have found that REE was greater than BEE in cancer
(27–30). Although increases in REE with cancer
stage progression were shown in one study (31), the differences in nutritional status
and energy metabolism by different cancer locations were not well
investigated.
This study examined nutritional status in patients
with gastrointestinal cancer by cancer stage and also by cancer
location in order to investigate factors influencing REE. The
effect of inflammatory cytokines (IL-6 and TNF-α) and
appetite-regulating hormones (ghrelin and leptin) on FFM and energy
metabolism were also investigated.
Patients and methods
Patients
Subjects were patients aged <80 years who were
admitted to Shiga University of Medical Science Hospital for
treatment (surgery, chemotherapy, and radiotherapy) following a
diagnosis of gastrointestinal cancer (esophageal cancer, gastric
cancer, or colorectal cancer) between June 2014 and October 2018.
To eliminate the influence of prior treatment as much as possible,
the included patients were those who had not undergone the above
types of cancer treatment previously and those who had received the
latest dose of chemotherapy or radiotherapy ≥1 month before
admission and had no adverse reactions to prior treatment.
Exclusion criteria were age <20 years or ≥80 years;
physician-diagnosed refractory cachexia; severe obesity [body mass
index (BMI)] ≥30 kg/m2), hyper- or hypo-metabolic
conditions (e.g., thyroid disorders, liver cirrhosis, pulmonary
disease, cardiac failure, and Wernicke's encephalopathy), and
dialysis. The Union for International Cancer Control (UICC)
classification system was used for staging of gastrointestinal
cancer. The present study was conducted with approval by The Ethics
Committee of Shiga University of Medical Science (approval no.
26-28). Informed consent was obtained from all subjects both
verbally and in writing.
Clinical parameters
The following anthropometric measurements were
obtained on admission: height (cm), body weight (BW; kg), BMI
(kg/m2), percent ideal BW (%IBW), percent triceps skin
fold thickness [%TSC; 100×TSF/reference value in the Japanese
Anthropometric Reference Data (JARD) 2001 (32)] and percent arm muscle circumference
[%AMC; 100×AMC/reference value in the JARD 2001 (32)]. The SGA (22) and PG-SGA (23) were used as nutrition screening tools.
The SGA rating A was regarded as well-nourished status; both B and
C were regarded as malnourished status (B: Moderate; C: Severe).
Given that PG-SGA score ≥4 is a requirement for nutrition
intervention, patients were divided into two groups using a PG-SGA
cutoff score of 4. Bioimpedance analysis was performed to determine
FFM (kg), %FFM, body fat mass (FAT; kg), and %FAT using a body
composition analyzer (MLT-550N; SK Medical Electronics Co., Ltd.).
Blood biochemistry tests were performed to determine the levels of
total protein (g/dl), albumin (g/dl), C-reactive protein (CRP;
mg/dl), serum IL-6 (pg/ml), serum TNF-α (pg/ml), leptin (ng/ml),
active ghrelin (fmol/ml), and inactive (des-acryl) ghrelin
(fmol/ml).
Energy metabolism
BEE was estimated using the Harris-Benedict equation
(33). REE, carbohydrate oxidation,
fat oxidation, and respiratory quotient (RQ) were measured using
indirect calorimetry (Aeromonitor® AE310S, Minato
Medical Science Co., Ltd.). REE was calculated using the Weir
equation without use of urinary nitrogen (34). RQ was calculated as RQ =
VCO2/VO2. Indirect calorimetry was performed
on fasted patients in the morning after resting in the supine
position on a bed for 30 min. The measurements took ~10 min
(35–37).
Energy intake
Mean daily energy intake, calculated based on daily
energy intake on 3 hospital days, was used as energy intake in
principle. Food intake rate (energy intake/energy provided in
hospital food) and energy satisfaction rate (energy intake/energy
requirement) were calculated. Energy requirement was estimated by
multiplying REE by a physical activity coefficient. Because all
patients were ambulant, a physical activity coefficient of 1.3 was
used for all patients.
Statistical analysis
Statistical analysis was performed using statistical
software SPSS version 25 (IBM, Corp.). Results are expressed as the
mean ± standard deviation. Associations between independent groups
were analyzed with the χ2 test, the Student's t-test, or
the Mann-Whitney U test as appropriate. The Kruskal-Wallis test
followed by Dunn's post hoc test was used when comparing three or
more groups. The Jonckheere-Terpstra trend test was used to examine
trends. For correlation analysis, the Spearman's rank correlation
coefficient was used. P<0.05 was used to indicate a
statistically significant difference.
Results
Patient characteristics
Patient characteristics were summarized by cancer
stage and by cancer location (Tables
I and II, respectively).
Subjects were 51 patients (38 men, 13 women) aged <80 years
admitted for treatment of diagnosed gastrointestinal cancer. The
distribution of cancer stages I, II, III, and IV was 16, 11, 13,
and 11 patients, respectively. As for cancer location, the number
of patients with esophageal, gastric, and colorectal cancer was 17,
15, and 19, respectively.
 | Table I.Clinical parameters by cancer
stage. |
Table I.
Clinical parameters by cancer
stage.
|
Characteristics | Stage I, II,
n=27 | Stage III, IV,
n=24 | P-value |
|---|
| Male/female |
21/6 |
17/7 | 0.570a |
| Age, years |
64±7 |
64±11 | 0.571b |
| Cancer stage,
I/II/III/IV |
16/11/0/0 |
0/0/13/11 |
|
| Cancer origin,
esophageal/gastric/colorectal |
7/11/9 |
10/4/10 | 0.158a |
|
Anthropometrics |
|
|
|
| Height,
m |
1.67±0.09 |
1.61±0.10 | 0.054c |
| BW,
kg |
63.6±11.1 |
53.6±10.4 |
<0.01c |
| Body
mass index, kg/m2 |
22.8±3.0 |
20.5±3.5 |
<0.05c |
| Body
fat mass, kg |
15.2±7.2 |
13.0±6.4 | 0.295c |
|
Fat-free mass, kg (n=46) |
47.7±9.0 |
41.0±9.1 |
<0.05c |
| % TSF
(n=49) | 101.5±38.0 |
69.9±30.6 |
<0.01c |
| % AMC
(n=49) | 102.6±12.3 |
96.9±13.6 | 0.131c |
| Nutritional
assessment |
|
|
|
| SGA,
well-nourished/malnourishedd |
22/5 |
9/15 |
<0.01a |
| PG-SGA,
<4/≥4 (n=49) |
13/13 |
3/20 |
<0.01a |
| BW loss
in 6 months, % |
1.7±3.5 |
6.3±7.4 |
<0.05b |
| Food
intake rate, % (n=42) |
99±3 |
76±33 |
<0.01b |
| Energy
metabolism |
|
|
|
| BEE,
kcal/day | 1,348±182 | 1,189±187 |
<0.01c |
| REE,
kcal/day | 1,371±193 | 1,260±265 | 0.091c |
|
REE/BEE |
1.02±0.09 |
1.06±0.12 | 0.214c |
| REE/BW,
kcal/kg/day |
22.0±2.3 |
23.8±3.9 | 0.086c |
|
BEE/FFM, kcal/kg/day
(n=46) |
29.1±3.9 |
31.5±5.7 | 0.095c |
| RQ |
0.82±0.10 |
0.80±0.08 | 0.507c |
| Blood
biochemistry |
|
|
|
| Total
protein, g/dl |
6.8±0.5 |
6.7±0.5 | 0.302c |
|
Albumin, g/dl |
4.1±0.4 |
3.6±0.4 |
<0.01c |
|
C-reactive protein, mg/dl
(n=49) |
0.2±0.2 |
1.4±2.1 |
<0.01b |
| IL-6,
pg/ml (n=49) |
1.9±1.2 |
6.6±7.3 |
<0.01b |
| TNF-α,
pg/ml (n=49) |
0.9±0.4 |
1.4±0.6 |
<0.01c |
| Leptin,
ng/ml (n=48) |
7.4±6.8 |
8.5±12.5 | 0.691c |
| Active
ghrelin, fmol/ml (n=49) |
11.8±9.4 |
14.9±15.6 | 0.398c |
|
Des-acyl ghrelin, fmol/ml
(n=49) | 146.0±121.6 | 133.6±68.4 | 0.489b |
| Table II.Clinical parameters by cancer
location. |
Table II.
Clinical parameters by cancer
location.
|
Characteristics | Esophageal
(n=17) | Gastric (n=15) | Colorectal
(n=19) | P-value |
|---|
| Male/female |
16/1 |
11/4 |
11/8 |
<0.05b |
| Age, years |
65±9 |
65±8 |
63±0 | 0.844c |
| Cancer stage,
I/II/III/IV |
6/1/6/4 |
7/4/1/3 |
3/6/6/4 | 0.189b |
|
Anthropometrics |
|
|
|
|
| Height,
m |
1.67±0.08 |
1.63±0.11 |
1.63±0.10 | 0.600c |
| BW,
kg |
57.0±11.2 |
61.6±14.8 |
58.5±9.8 | 0.387c |
| Body
mass index, kg/m2 |
20.4±3.0 |
22.7±3.3 |
22.2±3.6 | 0.161c |
| Body
fat mass, kg |
11.4±5.5 |
17.3±6.6 |
14.2±7.4 | 0.565c |
|
Fat-free mass, kg (n=46) |
45.6±10.1 |
43.8±10.8 |
43.9±8.4 | 0.943c |
| % TSF
(n=49) |
68.1±30.7 | 108.5±44.7 |
86.3±30.5 |
0.048c |
| % AMC
(n=49) |
97.2±10.9 |
99.2±12.4 | 102.6±15.3 | 0.643c |
| Nutritional
assessment |
|
|
|
|
| SGA,
well-nourished/malnourisheda |
9/8 |
10/5 |
12/7 | 0.704b |
| PG-SGA,
<4/≥4 (n=49) |
6/10 |
6/8 |
4/15 | 0.368b |
| BW loss
in 6 months, % |
4.2±6.3 |
3.5±6.8 |
3.9±5.6 | 0.910c |
| Food
intake rate, % (n=42) |
79±29 |
90±25 |
74±39 | 0.077c |
| Energy
metabolism |
|
|
|
|
| BEE,
kcal/day | 1,249±198 | 1,312±234 | 1,265±175 | 0.500c |
| REE,
kcal/day | 1,311±222 | 1,319±227 | 1,324±262 | 0.892c |
|
REE/BEE |
1.05±0.10 |
1.01±0.07 |
1.05±0.13 | 0.462c |
| REE/BW,
kcal/kg/day |
23.5±2.4 |
21.9±3.2 |
22.8±3.9 | 0.091c |
|
REE/FFM, kcal/kg/day
(n=46) |
29.0±3.4 |
30.7±4.8 | 3 1.0±6.2 | 0.624c |
| RQ |
0.81±0.07 |
0.80±0.07 |
0.83±0.12 | 0.823c |
| Blood
biochemistry |
|
|
|
|
| Total
protein, g/dl |
6.8±0.6 |
6.9±0.5 |
6.6±0.5 | 0.225c |
|
Albumin, g/dl |
3.9±0.5 |
4.0±0.5 |
3.8±0.3 | 0.229c |
|
C-reactive protein, mg/dl
(n=49) |
0.9±1.2 |
1.2±2.7 |
0.4±0.7 | 0.522c |
| IL-6,
pg/ml (n=49) |
4.4±4.5 |
4.2±6.7 |
3.8±5.7 | 0.723c |
| TNF-α,
pg/ml (n=49) |
1.0±0.5 |
1.1±0.6 |
1.2±0.6 | 0.688c |
| Leptin,
ng/ml (n=48) |
5.5±2.6 |
6.7±3.9 |
11.3±15.4 | 0.792c |
| Active
ghrelin, fmol/ml (n=49) |
15.2±10.2 |
14.2±19.2 |
10.8±6.9 | 0.310c |
|
Des-acyl ghrelin, fmol/ml
(n=49) | 154.8±99.4 | 110.4±89.3 | 153.1±111.0 | 0.053c |
Nutritional screening
All 51 patients were assessed using the SGA, and 49
were assessed using the PG-SGA. The SGA identified more
well-nourished patients in stages I/II than in stages III/IV
(P<0.01), with more malnourished patients in stages III/IV than
in stages I/II (P<0.01). Also, the PG-SGA identified more
patients requiring nutrition intervention in stages III/IV than in
stages I/II (P<0.01). The proportion of patients with
malnourished status increased with cancer stage progression
(Table I).
When the SGA results were examined by cancer
location, the numbers of well-nourished patients and malnourished
patients were similar in esophageal cancer, whereas there were more
well-nourished patients than malnourished patients in gastric
cancer and colorectal cancer. The PG-SGA identified more patients
requiring nutritional intervention than not requiring nutritional
intervention, irrespective of cancer location. However, nutritional
screening results using both the SGA and PG-SGA showed no
significant association with cancer location. There was no
significant difference between cancer locations, although %TSF was
lower in esophageal cancer than colorectal cancer (Dunn's post hoc
analysis, P=0.043, Table II).
Anthropometric measurements, body
composition analysis, energy intake
BW, BMI, %IBW, and FFM were significantly lower in
stages III/IV than stages I/II. There was no significant difference
in %FAT, but FAT decreased as cancer stage progressed (15.2±7.2 kg
in stages I/II vs. 13.0±6.4 kg in stages III/IV). Also, %TSF was
lower in stages III/IV (69.9%) than in stages I/II (101.5%).
Percent BW loss in 6 months was significantly larger in stages
III/IV (6.3±7.4%) than in stages I/II (1.7±3.5%). Food intake rate
was significantly lower in stages III/IV (76±33%) than in stages
I/II (99±3%) (Table I).
Blood biochemistry
Albumin level tended to be lower while CRP level
tended to be higher in stages III/IV than in stages I/II. Levels of
inflammatory cytokines, such as IL-6 and TNF-α were significantly
higher in stages III/IV than in stages I/II. The trend test of
inflammatory cytokines showed significant increases with cancer
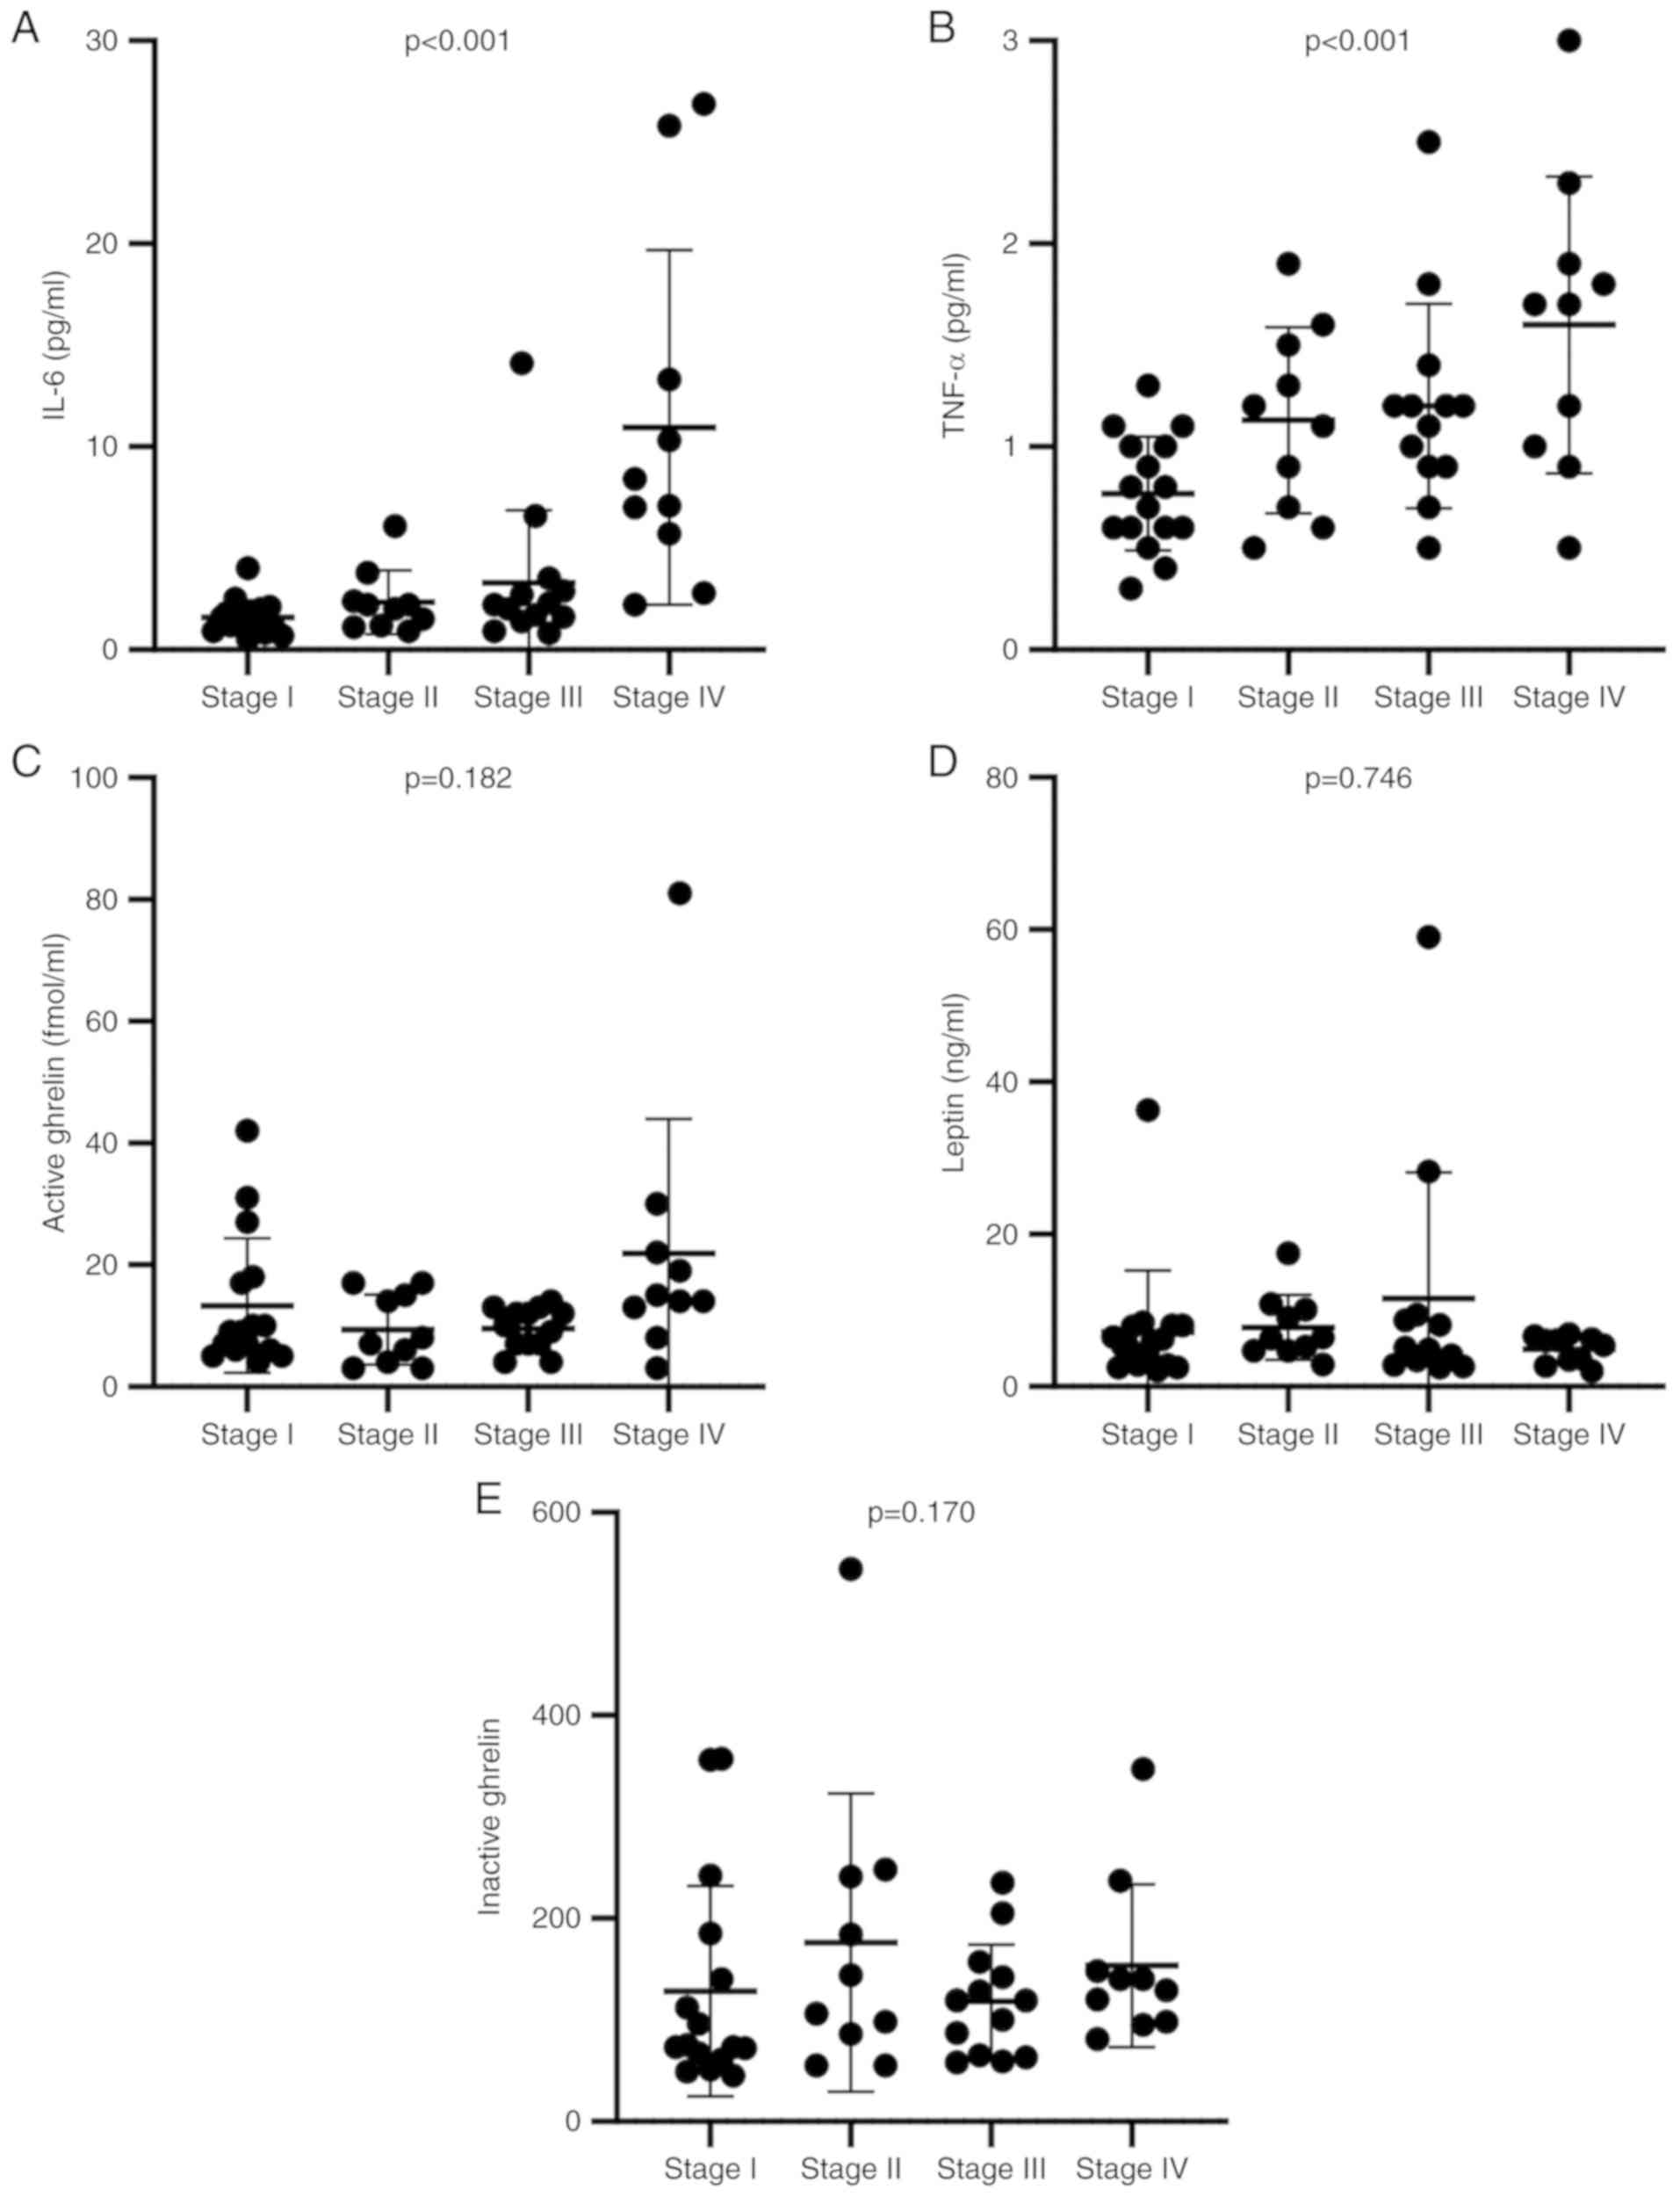
stage progression (Fig. 1A and B).
Also, the levels of the appetite-regulating hormones active ghrelin
and leptin were not associated with cancer stage (Fig. 1C-E). However, the level of active
ghrelin was significantly increased in stage IV compared with stage
III (Mann-Whitney's U test, P=0.009).
Energy metabolism
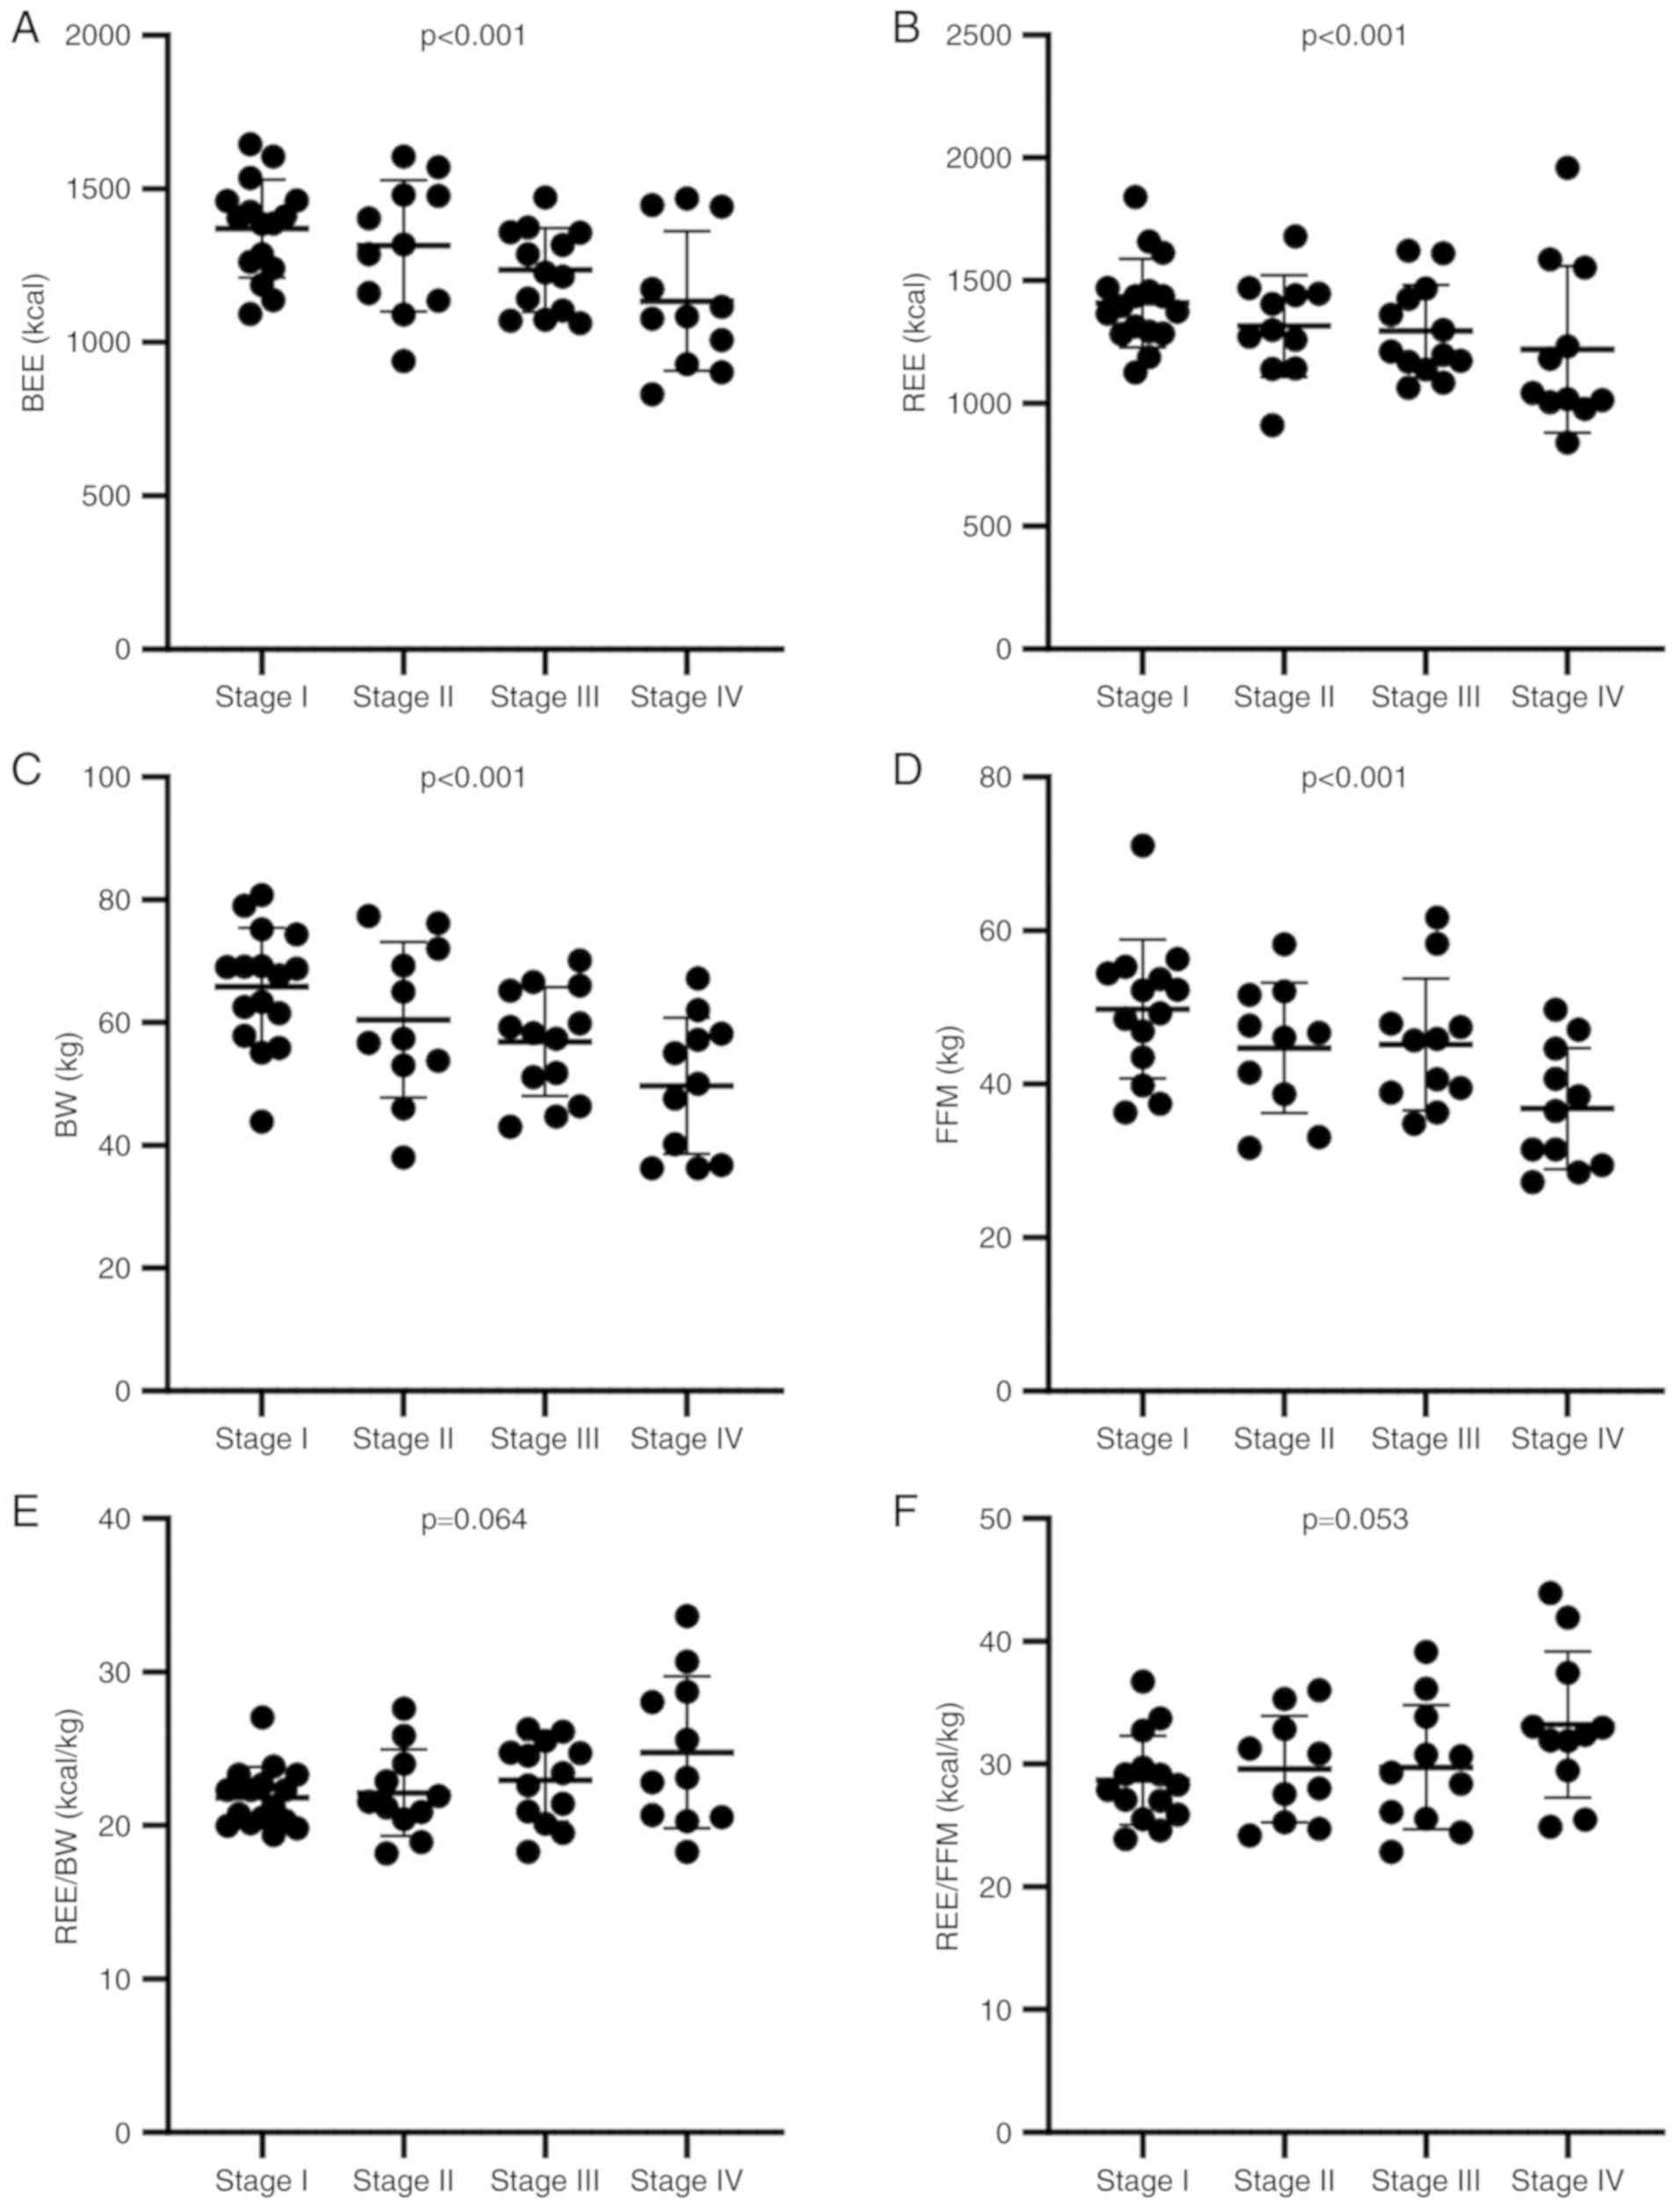
The trend test of BEE and REE showed significant
decreases with cancer stage progression (Fig. 2A and B). Similarly, BW and FFM showed
significant decreases with cancer stage progression (Fig. 2C and D). Indices of energy
metabolism, such as REE/BW and REE/FFM, tended to become higher
with cancer stage progression (Fig. 2E
and F). Results of this study revealed an energy requirement
per BW of 22 kcal and a stress coefficient of 1.0 for patients with
stages I/II disease and an energy requirement per BW of 24 kcal and
a stress coefficient of 1.1 for patients with stages III/IV disease
(stress coefficient was calculated using REE/BEE).
Association of inflammatory cytokines
with FFM and energy metabolism
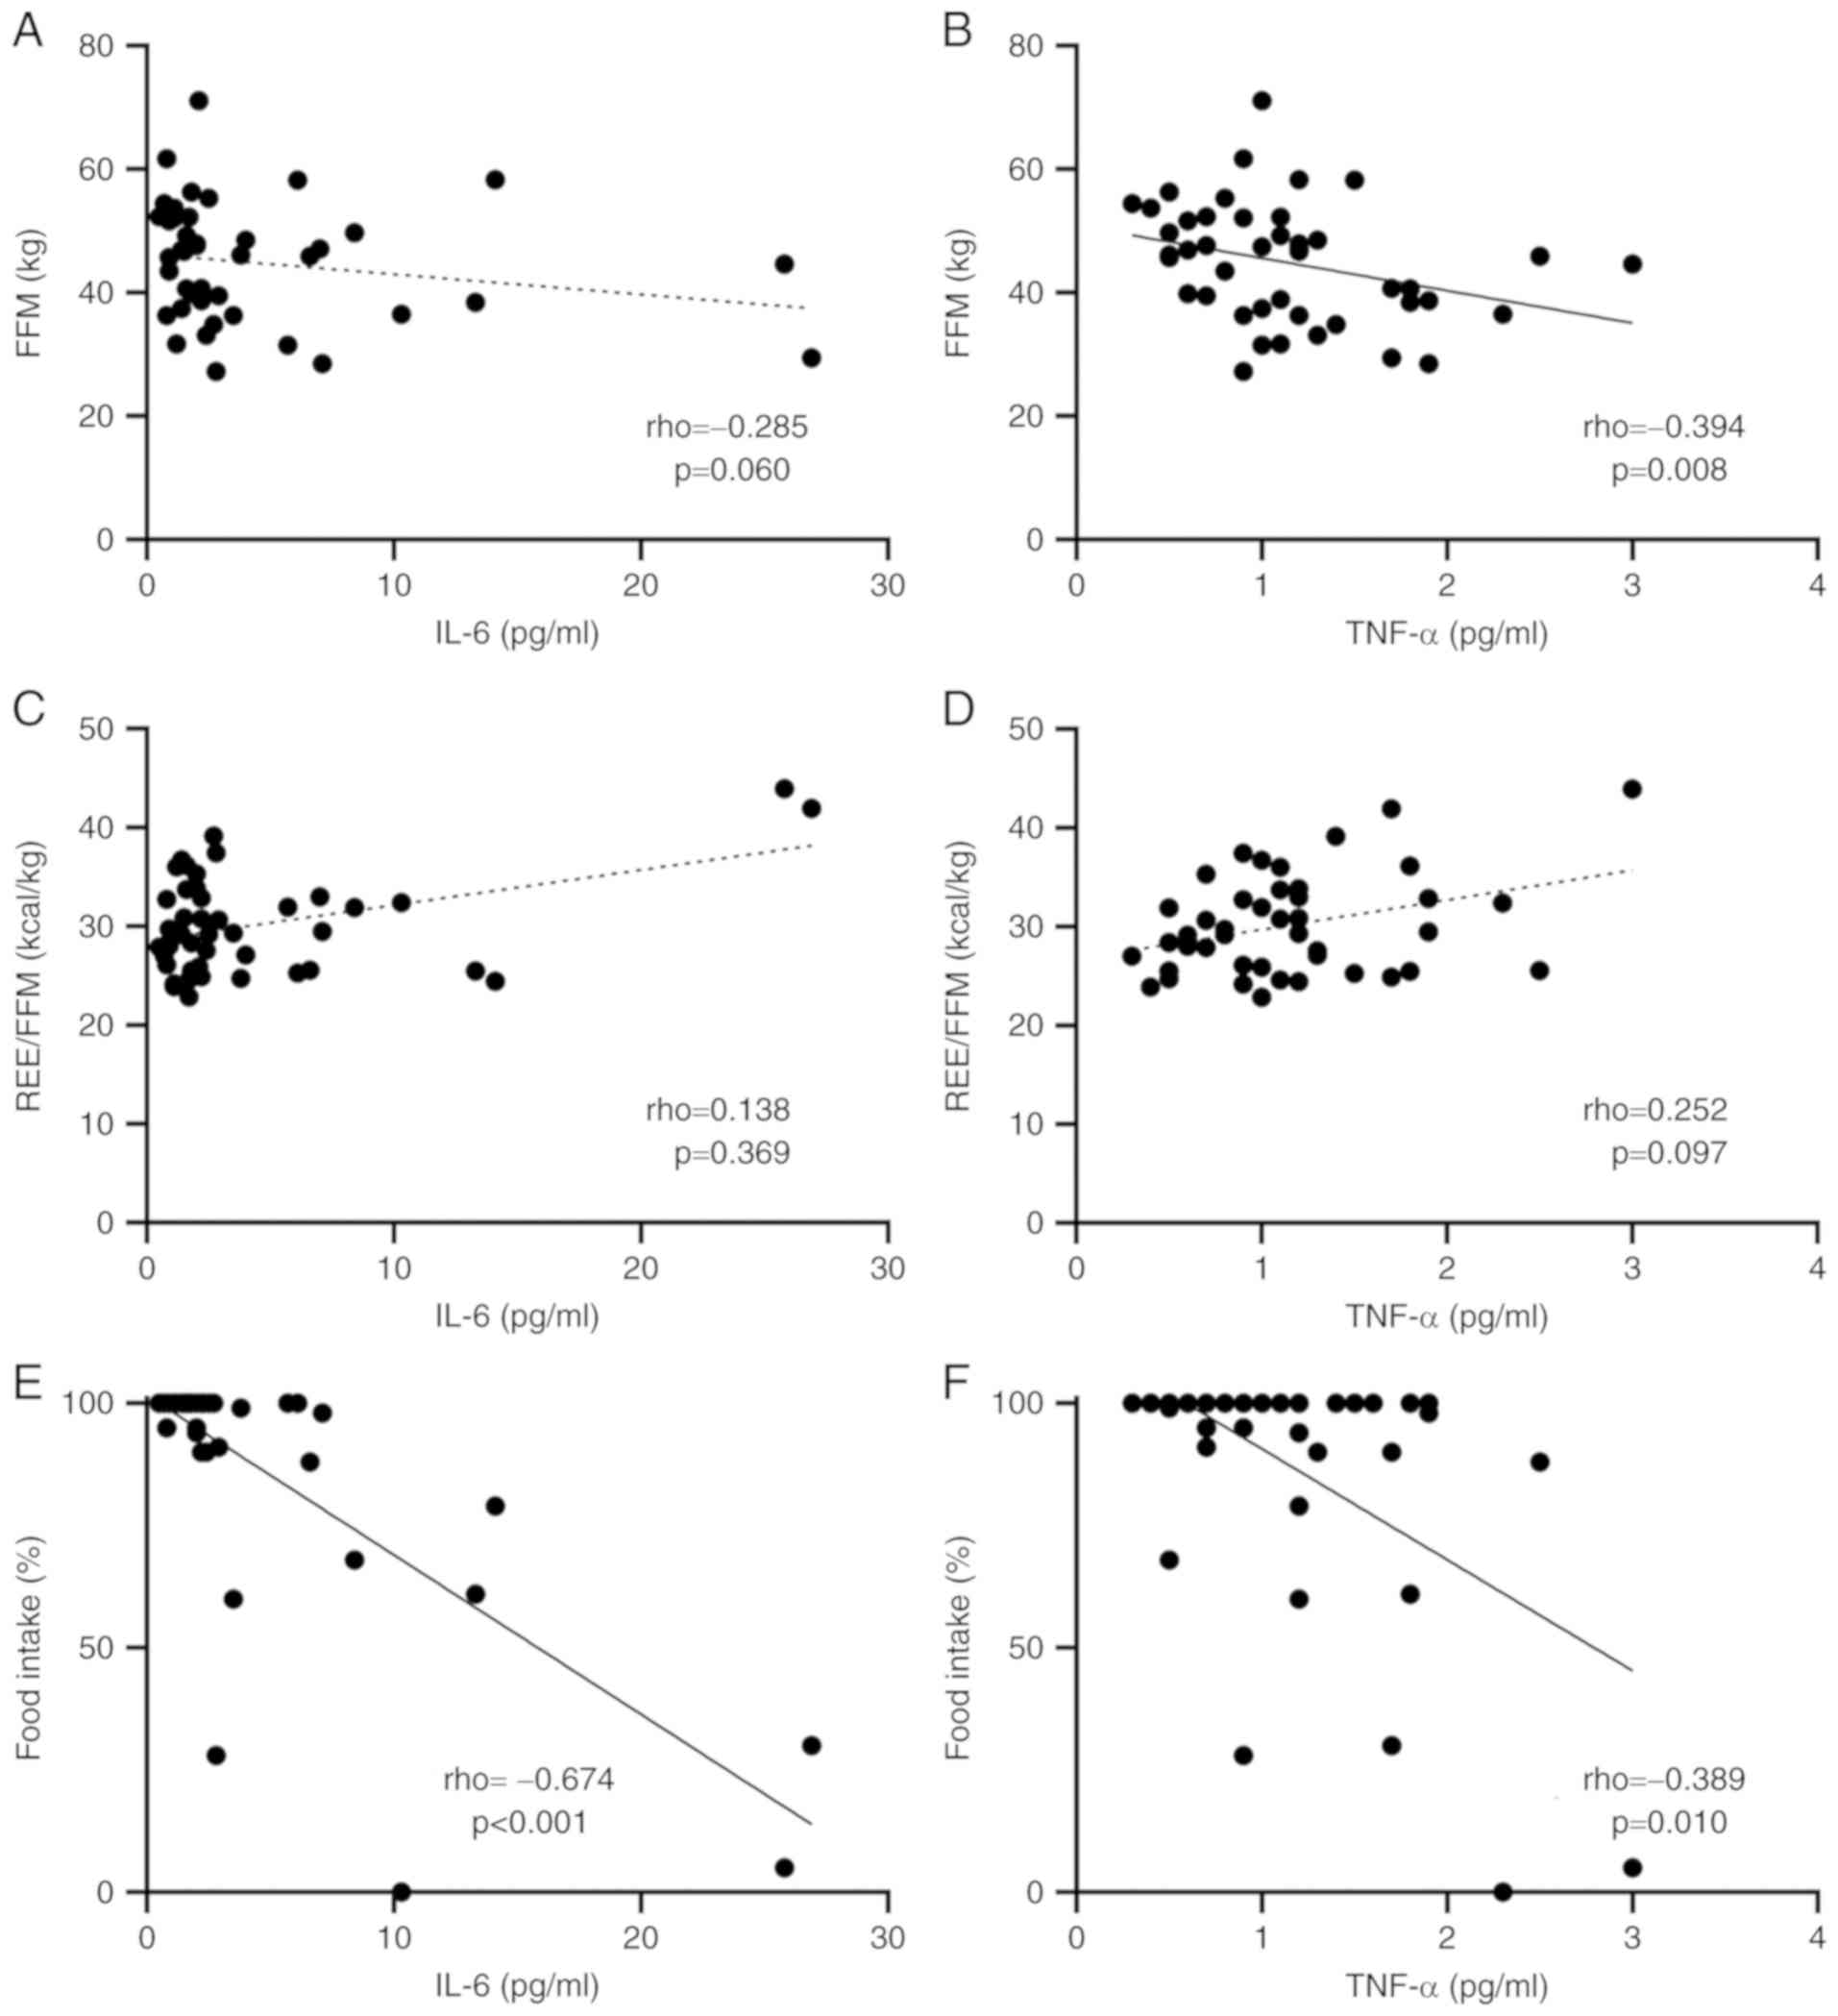
Inflammatory cytokines mediate cancer progression,
and they either decrease FFM or increase energy metabolism.
Therefore, their correlations were analyzed. FFM and inflammatory
cytokines were found to have a negative correlation (Fig. 3A and B).
REE/FFM was used as an energy metabolism index and
showed a positive but insignificant correlation with both IL-6 and
TNF-α (Fig. 3C and D). On the other
hand, food intake rate significantly decreased as the levels of
inflammatory cytokines increased (Fig.
3E and F).
Association of appetite-regulating
hormones with FFM and energy metabolism
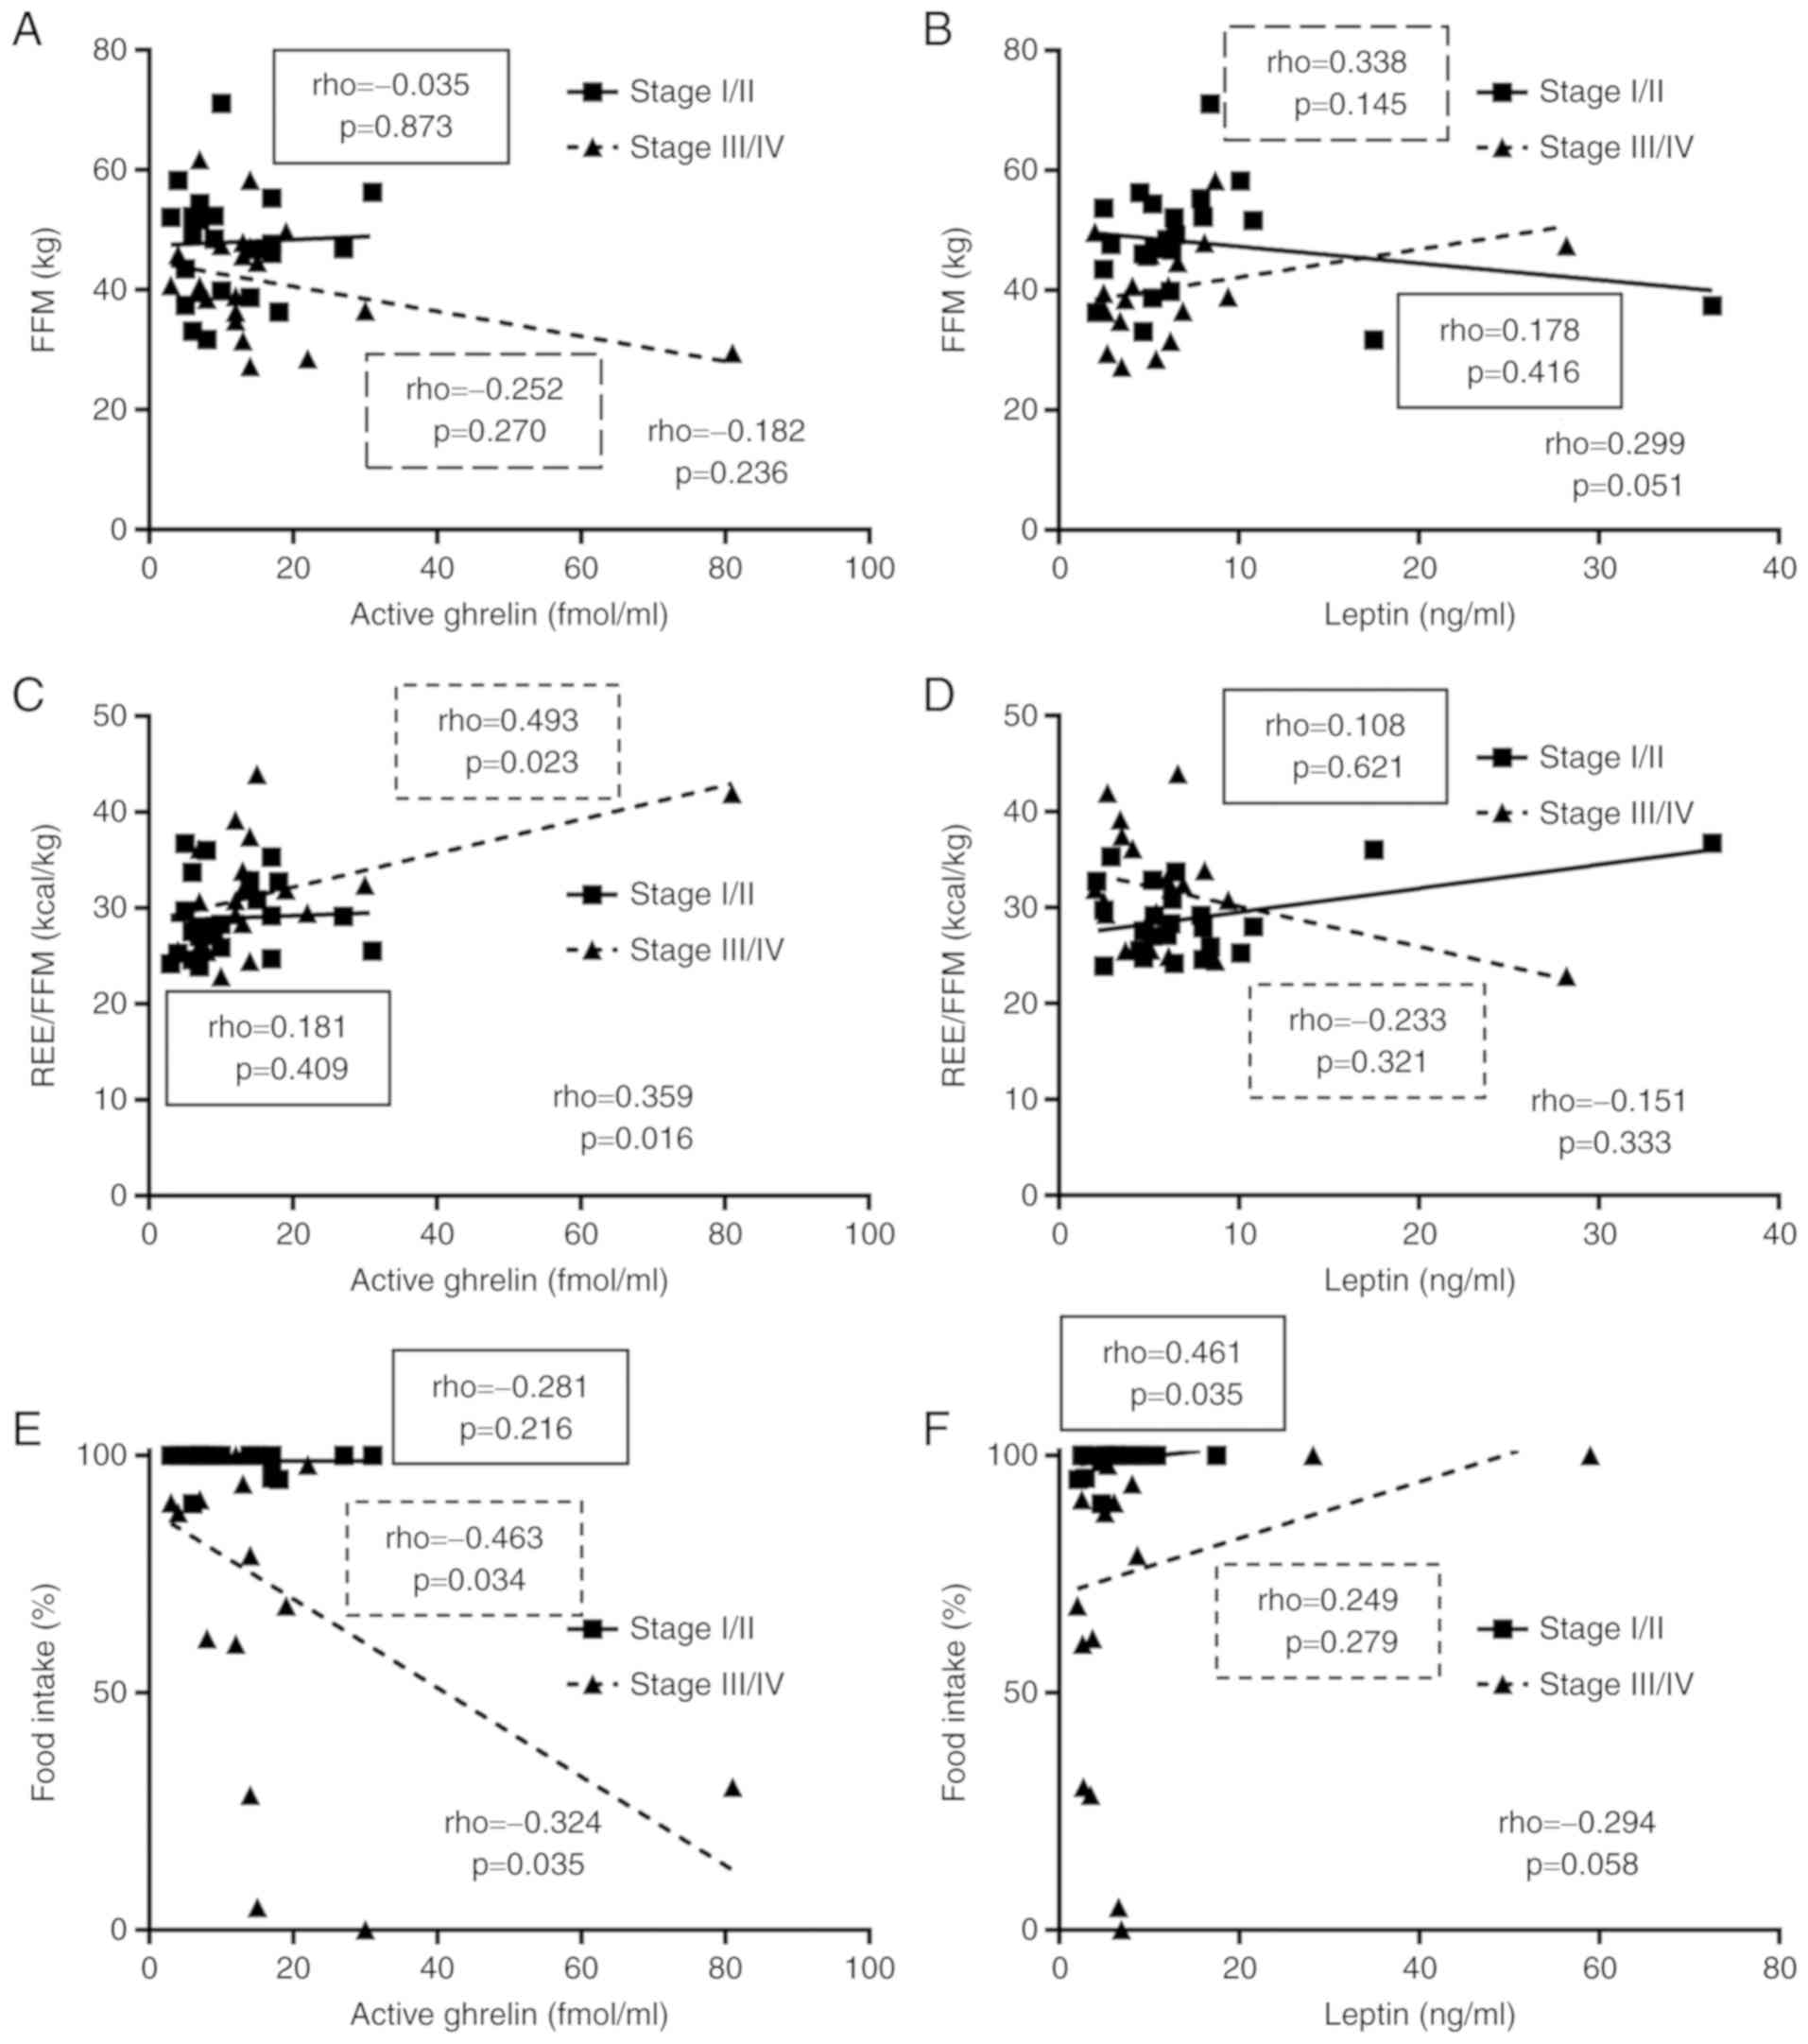
As shown in Fig. 1C,
the level of active ghrelin was increased in patients with stage IV
cancer. This elevated level could have a compensatory function
maintain homeostasis. Therefore, the correlations related to
appetite-regulating hormones are presented separately in Figs. 4 and 5
for stages I/II and stages III/IV, respectively.
The increased level of active ghrelin was correlated
with a significant increase in REE/FFM and a significant decrease
in food intake rate (Fig. 4B and E).
On the other hand, an increased level of leptin tended to be
associated with mild increases in FFM and food intake rate
(Fig. 4B and F).
Fig. 5 also shows the
correlations between the inflammatory cytokines and
appetite-regulating hormones. There was a significant positive
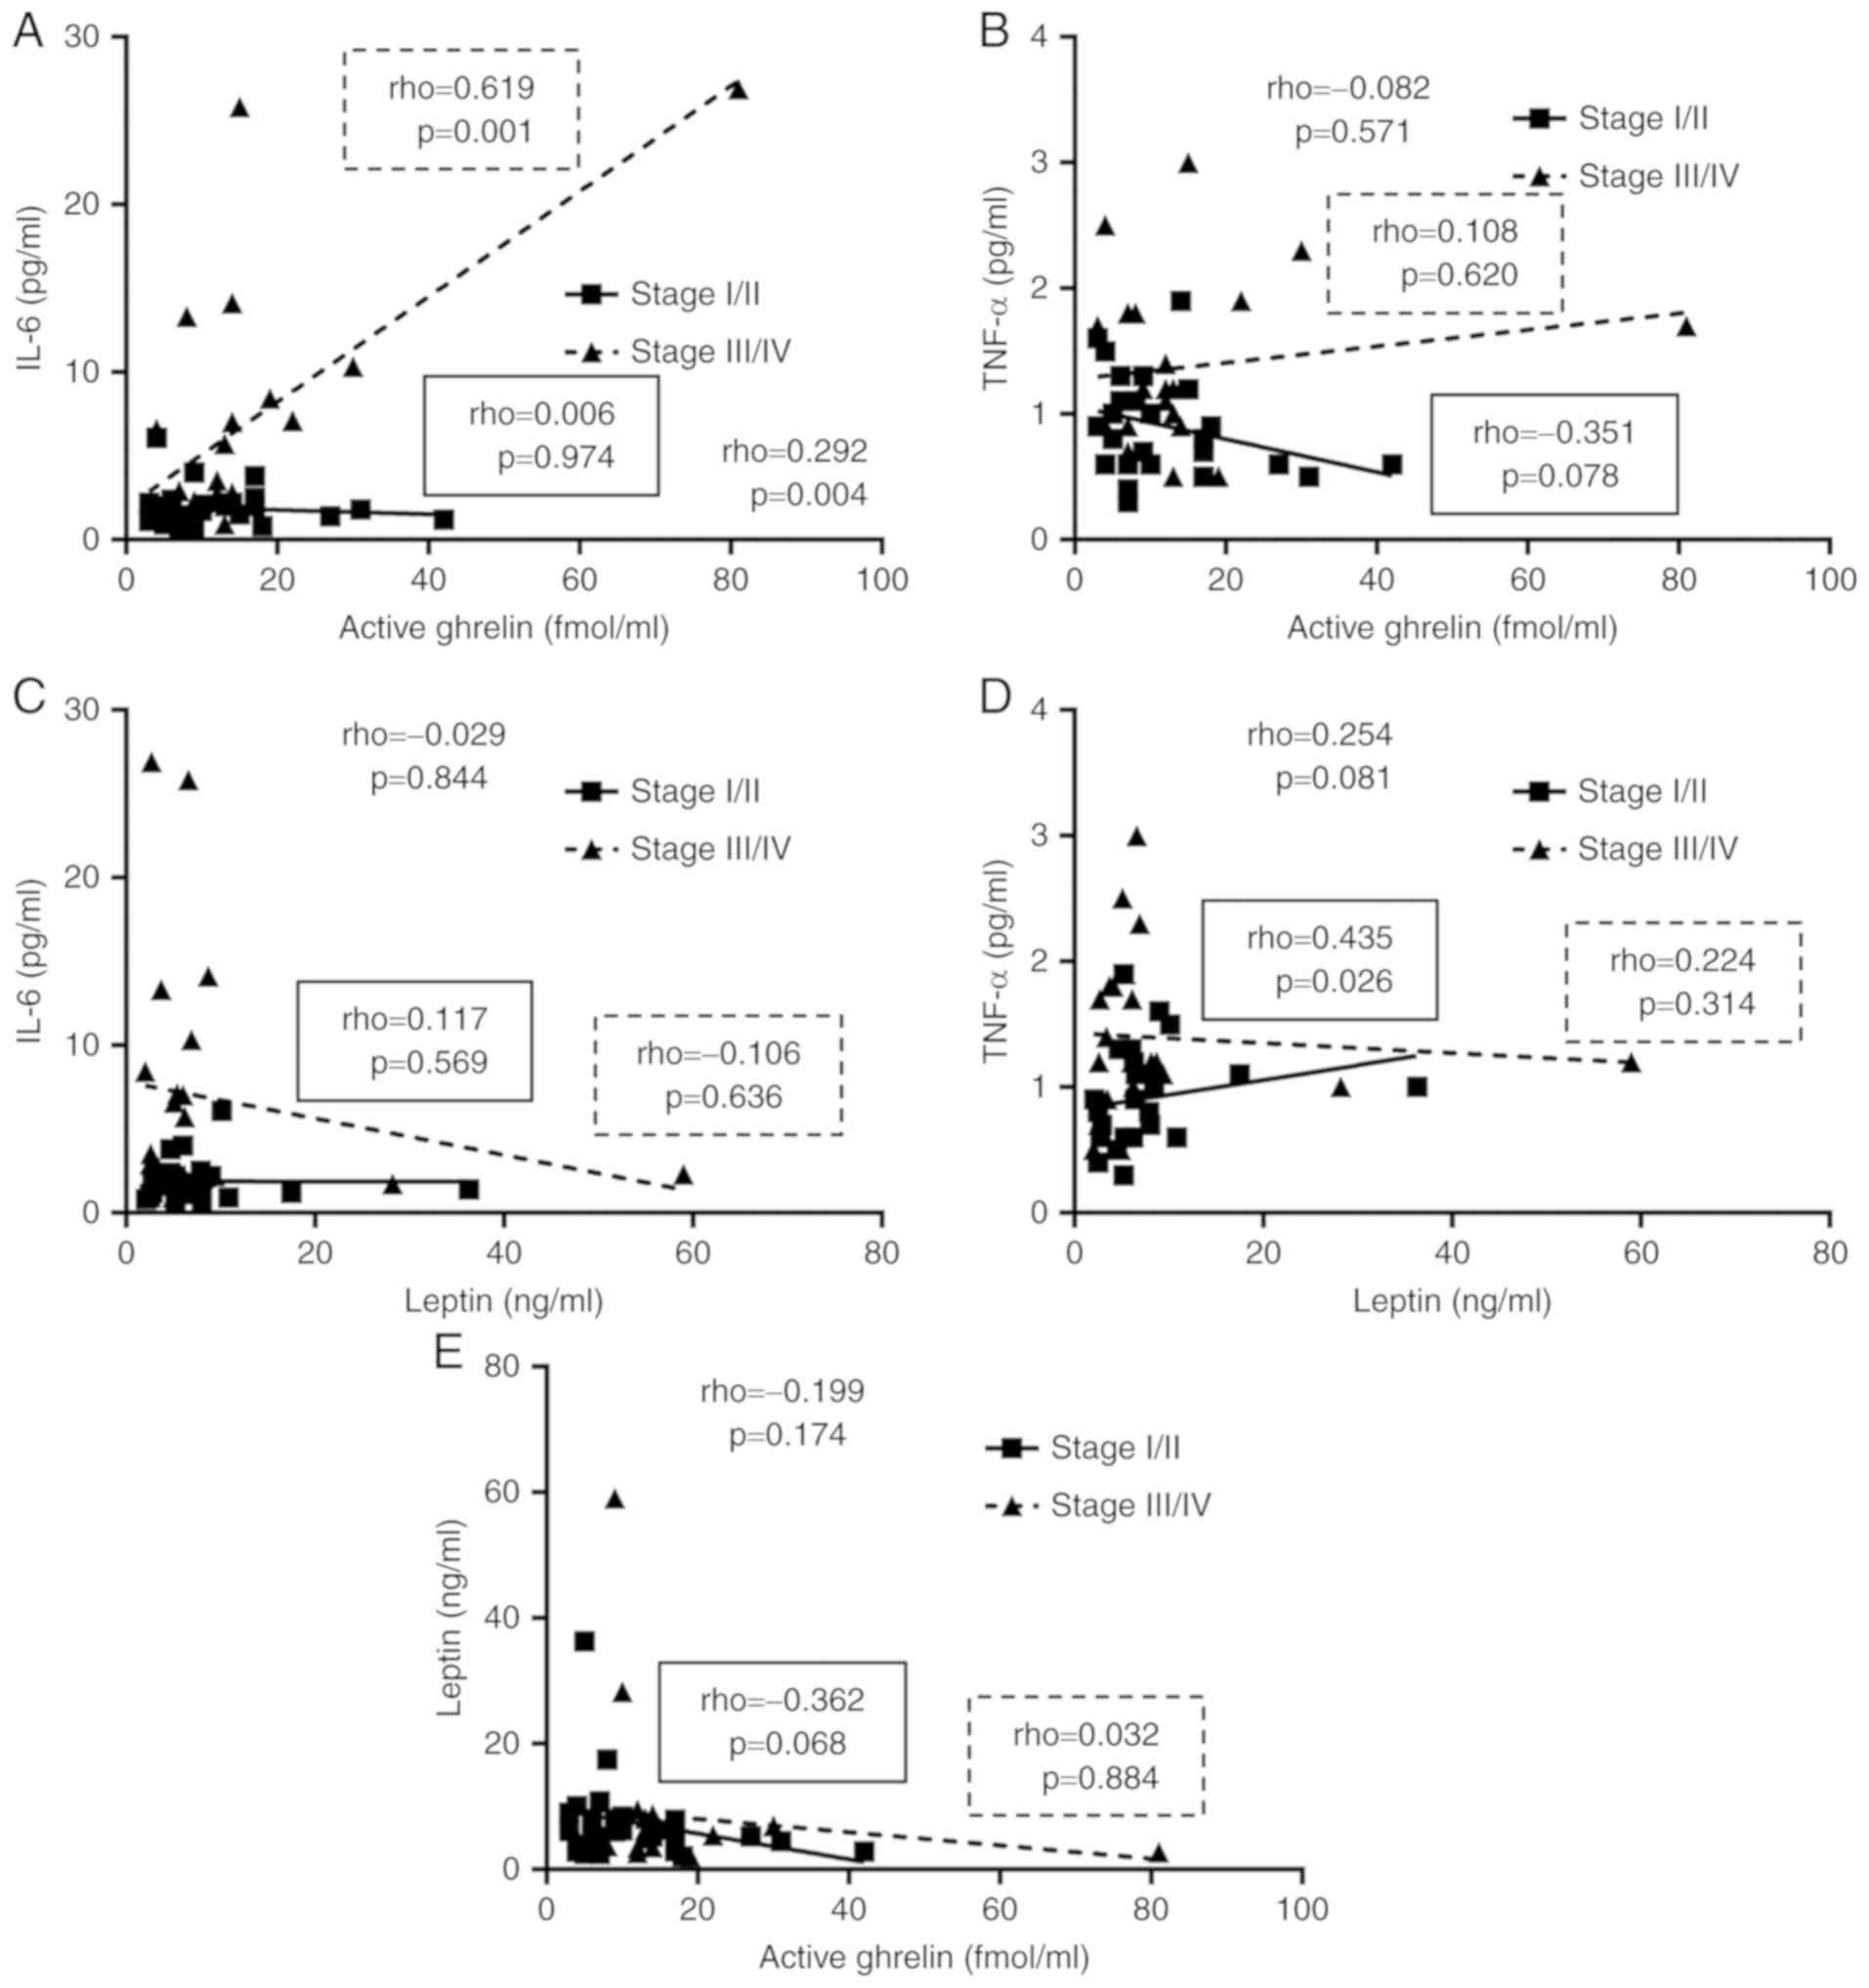
correlation between the level of active ghrelin and IL-6 (Fig. 5A).
Discussion
This study confirmed increases in the inflammatory
cytokine levels with cancer stage progression and suggests the
possible correlation of increases in inflammatory cytokine levels
with an increase in energy metabolism and decreases in food intake
rate and FFM. There were also correlations of the level of active
ghrelin with the level of IL-6 and energy metabolism in cancer
patients.
Nutritional status in cancer patients was assessed
using two screening tools, the SGA and PG-SGA. Regardless of the
tool used, increased numbers of malnourished patients were observed
with cancer stage progression. Also, the PG-SGA identified more
patients requiring nutritional intervention than the SGA did. In
particular, patients requiring nutritional intervention accounted
for 79% of patients with colorectal cancer. The sensitivity of the
PG-SGA appeared to be higher than that of the SGA because the
PG-SGA, but not the SGA, includes patient concerns in the
assessment.
This study confirmed increases in inflammatory
cytokine levels in blood with cancer stage progression. IL-6 tended
to be particularly high in patients with stage IV cancer, while
TNF-α increased stepwise as cancer stage progressed. The proportion
of patients with stage IV cancer was relatively low, which could
explain the non-significant correlations with FFM and energy
metabolism. It is noteworthy that both cytokines showed negative
correlations with food intake rate. Taken together, the levels of
inflammatory cytokines increase with cancer progression, and this
leads to decreases in food intake rate, increased energy
metabolism, and decreased FFM.
Ghrelin is known to suppress energy metabolism and
inflammatory cytokines, such as IL-6 and TNF-α (15). However, in this study, energy
metabolism and IL-6 were positively correlated with active ghrelin.
A state of ghrelin resistance exists in cancer patients. Therefore,
energy metabolism was not suppressed even at high active ghrelin
levels, and IL-6 appeared to correlate with active ghrelin. In line
with this, food intake rate was also negatively correlated with
active ghrelin in cancer patients, suggesting that the increased
ghrelin failed to compensate for increased appetite.
It has been speculated that the level of serum
leptin decreases with cancer progression because it is a hormone
released from fat cells (38) and is
known to suppress appetite (39).
However, this study did not find any significant differences among
cancer stages or among cancer locations.
This study has some limitations. First, this is a
single-center study, and therefore generalization of the results is
limited. Second, data were collected before treatment, and changes
in energy metabolism with time were not examined. Third, the
imbalances in patient sex, cancer stage, and cancer location might
have influenced the results. More accurate findings can be obtained
by using a larger sample size with adjustments for patient sex,
cancer stage, and cancer location.
In conclusion, analysis by cancer stage in patients
with gastrointestinal cancer showed that levels of inflammatory
cytokines increased with cancer stage progression, which may lead
to decreases in food intake rate and FFM, and with increases in
energy expenditure. In particular, the level of IL-6 influenced
energy metabolism. Furthermore, the TNF-α level was significantly
associated with decreases in FFM. In terms of the
appetite-regulating hormones, we found that the level of active
ghrelin was positively correlated with that of IL-6 and with energy
metabolism, which suggests a state of ghrelin resistance.
Acknowledgements
Not applicable.
Funding
The present study was supported in part by a
Grant-in-Aid for Scientific Research from The Ministry of
Education, Culture, Sports, Science and Technology of Japan (grant
no. 18K10990 to SB).
Availability of data and materials
The datasets used and analyzed during the present
study are available from the corresponding author on reasonable
request.
Authors' contributions
ASh, SB and MS conceived the study design. ASh and
SB performed data analysis. ASh, MKu, HM, ASo, OI, AA, KT, MKo, HI,
MT and MS performed the acquisition and interpretation of the data.
ASh, SB and MS wrote the manuscript. MKu, HM, ASo, OI, AA, KT, MKo,
HI and MT revised and edited the manuscript. MKu, HM, ASo, OI, KT,
MKo and HI treated the patients presented in the manuscript. AA, MT
and MS supervised the study. All authors read and approved the
final manuscript.
Ethics approval and consent to
participate
The present study was conducted with approval by The
Ethics Committee of Shiga University of Medical Science (approval
no. 26-28). Informed consent was obtained from all subjects both
verbally and in writing.
Patient consent for publication
Not applicable.
Competing interests
The authors declare that they have no competing
interests.
References
|
1
|
Arends J, Baracos V, Bertz H, Bozzetti F,
Calder PC, Deutz NEP, Erickson N, Laviano A, Lisanti MP, Lobo DN,
et al: ESPEN expert group recommendations for action against
cancer-related malnutrition. Clin Nutr. 36:1187–1196. 2017.
View Article : Google Scholar : PubMed/NCBI
|
|
2
|
Zhang L, Lu Y and Fang Y: Nutritional
status and related factors of patients with advanced
gastrointestinal cancer. Br J Nutr. 111:1239–1244. 2014. View Article : Google Scholar : PubMed/NCBI
|
|
3
|
Grivennikov SI and Karin M: Inflammatory
cytokines in cancer: Tumour necrosis factor and interleukin 6 take
the stage. Ann Rheum Dis. 70 (Suppl 1):i104–i108. 2011. View Article : Google Scholar : PubMed/NCBI
|
|
4
|
Ashizawa T, Okada R, Suzuki Y, Takagi M,
Yamazaki T, Sumi T and Aoki T, Ohnuma S and Aoki T: Clinical
significance of interleukin-6 (IL-6) in the spread of gastric
cancer: Role of IL-6 as a prognostic factor. Gastric Cancer.
8:124–131. 2005. View Article : Google Scholar : PubMed/NCBI
|
|
5
|
Guthrie GJ, Roxburgh CS, Horgan PG and
McMillan DC: Does interleukin-6 link explain the link between
tumour necrosis, local and systemic inflammatory responses and
outcome in patients with colorectal cancer? Cancer Treat Rev.
39:89–96. 2013. View Article : Google Scholar : PubMed/NCBI
|
|
6
|
Shimazaki J, Goto Y, Nishida K, Tabuchi T,
Motohashi G and Ubukata H: In patients with colorectal cancer,
preoperative serum interleukin-6 level and granulocyte/lymphocyte
ratio are clinically relevant biomarkers of long-term cancer
progression. Oncology. 84:356–361. 2013. View Article : Google Scholar : PubMed/NCBI
|
|
7
|
Ma Y, Ren Y, Dai ZJ, Wu CJ, Ji YH and Xu
J: IL-6, IL-8 and TNF-α levels correlate with disease stage in
breast cancer patients. Adv Clin Exp Med. 26:421–426. 2017.
View Article : Google Scholar : PubMed/NCBI
|
|
8
|
Fearon K, Strasser F, Anker SD, Bosaeus I,
Bruera E, Fainsinger RL, Jatoi A, Loprinzi C, MacDonald N,
Mantovani G, et al: Definition and classification of cancer
cachexia: An international consensus. Lancet Oncol. 12:489–495.
2011. View Article : Google Scholar : PubMed/NCBI
|
|
9
|
Braun TP and Marks DL: Pathophysiology and
treatment of inflammatory anorexia in chronic disease. J Cachexia
Sarcopenia Muscle. 1:135–145. 2010. View Article : Google Scholar : PubMed/NCBI
|
|
10
|
Li YP and Reid MB: NF-kappaB mediates the
protein loss induced by TNF-alpha in differentiated skeletal muscle
myotubes. Am J Physiol Regul Integr Comp Physiol. 279:R1165–R1170.
2000. View Article : Google Scholar : PubMed/NCBI
|
|
11
|
Kojima M, Hosoda H, Date Y, Nakazato M,
Matsuo H and Kangawa K: Ghrelin is a growth-hormone-releasing
acylated peptide from stomach. Nature. 402:656–660. 1999.
View Article : Google Scholar : PubMed/NCBI
|
|
12
|
Mihalache L, Gherasim A, Nita O, Ungureanu
MC, Pădureanu SS, Gavril RS and Arhire LI: Effects of ghrelin in
energy balance and body weight homeostasis. Hormones (Athens).
15:186–196. 2016. View Article : Google Scholar : PubMed/NCBI
|
|
13
|
Cui H, Lopez M and Rahmouni K: The
cellular and molecular bases of leptin and ghrelin resistance in
obesity. Nat Rev Endocrinol. 13:338–351. 2017. View Article : Google Scholar : PubMed/NCBI
|
|
14
|
Kirchner H, Gutierrez JA, Solenberg PJ,
Pfluger PT, Czyzyk TA, Willency JA, Schürmann A, Joost HG, Jandacek
RJ, Hale JE, et al: GOAT links dietary lipids with the endocrine
control of energy balance. Nat Med. 15:741–745. 2009. View Article : Google Scholar : PubMed/NCBI
|
|
15
|
Suzuki H, Asakawa A, Amitani H, Nakamura N
and Inui A: Cancer cachexia-pathophysiology and management. J
Gastroenterol. 48:574–594. 2013. View Article : Google Scholar : PubMed/NCBI
|
|
16
|
Nakazato M, Murakami N, Date Y, Kojima M,
Matsuo H, Kangawa K and Matsukura S: A role for ghrelin in the
central regulation of feeding. Nature. 409:194–198. 2001.
View Article : Google Scholar : PubMed/NCBI
|
|
17
|
Shimizu Y, Nagaya N, Isobe T, Imazu M,
Okumura H, Hosoda H, Kojima M, Kangawa K and Kohno N: Increased
plasma ghrelin level in lung cancer cachexia. Clin Cancer Res.
9:774–778. 2003.PubMed/NCBI
|
|
18
|
Wolf I, Sadetzki S, Kanety H, Kundel Y,
Pariente C, Epstein N, Oberman B, Catane R, Kaufman B and Shimon I:
Adiponectin, ghrelin, and leptin in cancer cachexia in breast and
colon cancer patients. Cancer. 106:966–973. 2006. View Article : Google Scholar : PubMed/NCBI
|
|
19
|
Kerem M, Ferahkose Z, Yilmaz UT, Pasaoglu
H, Ofluoglu E, Bedirli A, Salman B, Sahin TT and Akin M: Adipokines
and ghrelin in gastric cancer cachexia. World J Gastroenterol.
14:3633–3641. 2008. View Article : Google Scholar : PubMed/NCBI
|
|
20
|
Garcia JM, Garcia-Touza M, Hijazi RA,
Taffet G, Epner D, Mann D, Smith RG, Cunningham GR and Marcelli M:
Active ghrelin levels and active to total ghrelin ratio in
cancer-induced cachexia. J Clin Endocrinol Metab. 90:2920–2926.
2005. View Article : Google Scholar : PubMed/NCBI
|
|
21
|
Nagaya N, Uematsu M, Kojima M, Date Y,
Nakazato M, Okumura H, Hosoda H, Shimizu W, Yamagishi M, Oya H, et
al: Elevated circulating level of ghrelin in cachexia associated
with chronic heart failure: Relationships between ghrelin and
anabolic/catabolic factors. Circulation. 104:2034–2038. 2001.
View Article : Google Scholar : PubMed/NCBI
|
|
22
|
Baker JP, Detsky AS, Wesson DE, Wolman SL,
Stewart S, Whitewell J, Langer B and Jeejeebhoy KN: Nutritional
assessment: A comparison of clinical judgement and objective
measurements. N Engl J Med. 306:969–972. 1982. View Article : Google Scholar : PubMed/NCBI
|
|
23
|
Isenring EA, Capra S and Bauer JD:
Nutrition intervention is beneficial in oncology outpatients
receiving radiotherapy to the gastrointestinal or head and neck
area. Br J Cancer. 91:447–452. 2004. View Article : Google Scholar : PubMed/NCBI
|
|
24
|
Bauer J, Capra S and Ferguson M: Use of
the scored Patient-Generated Subjective Global Assessment (PG-SGA)
as a nutrition assessment tool in patients with cancer. Eur J Clin
Nutr. 56:779–785. 2002. View Article : Google Scholar : PubMed/NCBI
|
|
25
|
Dempsey DT, Feurer ID, Knox LS, Crosby LO,
Buzby GP and Mullen JL: Energy expenditure in malnourished
gastrointestinal cancer patients. Cancer. 53:1265–1273. 1984.
View Article : Google Scholar : PubMed/NCBI
|
|
26
|
Hansell DT, Davies JW and Burns HJ: The
relationship between resting energy expenditure and weight loss in
benign and malignant disease. Ann Surg. 203:240–245. 1986.
View Article : Google Scholar : PubMed/NCBI
|
|
27
|
Bosaeus I, Daneryd P, Svanberg E and
Lundholm K: Dietary intake and resting energy expenditure in
relation to weight loss in unselected cancer patients. Int J
Cancer. 93:380–383. 2001. View
Article : Google Scholar : PubMed/NCBI
|
|
28
|
Moses AW, Slater C, Preston T, Barber MD
and Fearon KC: Reduced total energy expenditure and physical
activity in cachectic patients with pancreatic cancer can be
modulated by an energy and protein dense oral supplement enriched
with n-3 fatty acids. Br J Cancer. 90:996–1002. 2004. View Article : Google Scholar : PubMed/NCBI
|
|
29
|
Staal-van den Brekel AJ, Schols AM, ten
Velde GP, Buurman WA and Wouters EF: Analysis of the energy balance
in lung cancer patients. Cancer Res. 54:6430–6433. 1994.PubMed/NCBI
|
|
30
|
Falconer JS, Fearon KC, Plester CE, Ross
JA and Carter DC: Cytokines, the acute-phase response, and resting
energy expenditure in cachectic patients with pancreatic cancer.
Ann Surg. 219:325–331. 1994. View Article : Google Scholar : PubMed/NCBI
|
|
31
|
Omagari K, Iwami H, Kaji M, Ishii Y,
Matsutake S, Ichimura M, Kato S, Takeshhita, Ichikawa T and Nakao
K: The relationship between energy expenditure and type or stage of
cancer. Acta Medica Nagasakiensia. 57:33–40. 2012.
|
|
32
|
Moriwaki H, Aoyagi S, Ishizuka Y, et al:
Japanese Anthropometric Reference Data 2001. JARD 2001. Jpn Nutr
Assess. 19:45–81. 2002.
|
|
33
|
Harris JA and Benedict FG: A biometric
study of human basal metabolism. Proc Natl Acad Sci USA. 4:370–373.
1918. View Article : Google Scholar : PubMed/NCBI
|
|
34
|
Weir JB: New methods for calculating
metabolic rate with special reference to protein metabolism. J
Physiol. 109:1–9. 1949. View Article : Google Scholar : PubMed/NCBI
|
|
35
|
Sasaki M, Johtatsu T, Kurihara M, Iwakawa
H, Tanaka T, Bamba S, Tsujikawa T, Fujiyama Y and Andoh A: Energy
expenditure in Japanese patients with severe or moderate ulcerative
colitis. J Clin Biochem Nutr. 47:32–36. 2010. View Article : Google Scholar : PubMed/NCBI
|
|
36
|
Sasaki M, Okamoto H, Johtatsu T, Kurihara
M, Iwakawa H, Tanaka T, Shiomi H, Naka S, Kurumi Y and Tani T:
Resting energy expenditure in patients undergoing pylorus
preserving pancreatoduodenectomies for bile duct cancer or
pancreatic tumors. J Clin Biochem Nutr. 48:183–186. 2011.
View Article : Google Scholar : PubMed/NCBI
|
|
37
|
Takaoka A, Sasaki M, Nakanishi N, Kurihara
M, Ohi A, Bamba S and Andoh A: Nutritional screening and clinical
outcome in hospitalized patients with crohn's disease. Ann Nutr
Metab. 71:266–272. 2017. View Article : Google Scholar : PubMed/NCBI
|
|
38
|
Zhang Y, Proenca R, Maffei M, Barone M,
Leopold L and Friedman JM: Positional cloning of the mouse obese
gene and its human homologue. Nature. 372:425–432. 1994. View Article : Google Scholar : PubMed/NCBI
|
|
39
|
Satoh N, Ogawa Y, Katsuura G, Tsuji T,
Masuzaki H, Hiraoka J, Okazaki T, Tamaki M, Hayase M, Yoshimasa Y,
et al: Pathophysiological significance of the obese gene product,
leptin, in ventromedial hypothalamus (VMH)-lesioned rats: Evidence
for loss of its satiety effect in VMH-lesioned rats. Endocrinology.
138:947–954. 1997. View Article : Google Scholar : PubMed/NCBI
|