Introduction
The early diagnosis and treatment of oral squamous
cell carcinoma (OSCC) significantly affects the prognosis and
quality of life of patients. The change in the color of the mucous
membrane is the most important diagnostic parameter for oral mucosa
disorders, because it reflects histopathological alterations.
However, the subjective perception of color varies even when
different individuals simultaneously observe the same color.
Because the human brain does not have the capacity to accurately
reproduce information about color, it is difficult to objectively
record color changes. The appropriate identification of color
associated with an oral mucosa lesion for diagnostic purposes
requires digitization of colors and their evaluation as objective
data. The determination of the extent of excision of precancerous
and OSCC lesions that should be undertaken is often done by vital
staining with iodine solution (1);
however, this approach also relies substantially on the subjective
assessment made by technicians.
The relationship between reduced tissue
autofluorescence and epithelial malformations has been reported in
recent years with the advancements made in optical engineering.
Therefore, fluorescence visualization devices have been widely used
as auxiliary diagnostic tools and have contributed significantly to
the diagnosis and treatment of pathological conditions of the oral
mucosa. The diagnostic instrument, VELscope® (DenMat),
used for the oral mucosa was developed in 2006; it uses the
difference in visible light reflected by the mucous membrane and
has been applied clinically (2–4). This
device visualizes lesions via the irradiation of narrow-band blue
light (400–460 nm) that enables light emission by collagen matrix
or flavin adenine dinucleotide (FAD). Tumors and inflammatory
processes are indicated by reduced FAD levels and fluorescence
visualization loss (FVL) due to collagen cross-link (CCL)
destruction. An oral mucosa fluorescence visualization device that
uses an optical instrument and an analysis software calculating its
G value has also been developed in Japan and has been examined for
its usefulness in distinguishing lesions (5). However, there are cases characterized
by differences between the luminance values and histopathological
presentation, which have led to the hypothesis that a factor other
than the described principle of fluorescence visualization
exists.
In the present study, we aimed to elucidate the
principle of fluorescence visualization. We used a portable,
non-contact oral mucosa fluorescence visualization device to
perform fluorescence visualization and obtain luminance
measurements of pathologically altered oral mucosa; furthermore, we
carried out Picro-Sirius Red staining of CCL and
immunohistochemical staining for CK13, CK17, Ki67, p53, and
E-cadherin.
Materials and methods
Subjects
Oral squamous cell carcinoma was fluorescently
visualized and histopathologically assessed in seven patients
examined at the Department of Oral Surgery, Tokyo Dental College,
Suidobashi Hospital between April 2017 and August 2018. Patients
with distant metastases at the time of clinical examination or
those receiving preventive radiotherapy or chemotherapy were
excluded from the study. This study was conducted with the approval
of the Tokyo Dental College Ethics Committee (approval no. 759).
Informed consent was obtained from all the participants. And this
informed consent included consent to participate in the study and
consent to publish their images. The patient characteristics are
detailed in Table I.
 | Table I.Clinical information. |
Table I.
Clinical information.
| Case | Age, years | Sex | Site | Type |
|---|
| 1 | 62 | Male | Left tongue | Endophytic
growth |
| 2 | 43 | Female | Left tongue | Endophytic
growth |
| 3 | 59 | Male | Left tongue | Endophytic
growth |
| 4 | 73 | Male | Left tongue | Superficial
growth |
| 5 | 76 | Female | Left tongue | Superficial
growth |
| 6 | 66 | Male | Right tongue | Superficial
growth |
| 7 | 64 | Male | Left tongue | Endophytic
growth |
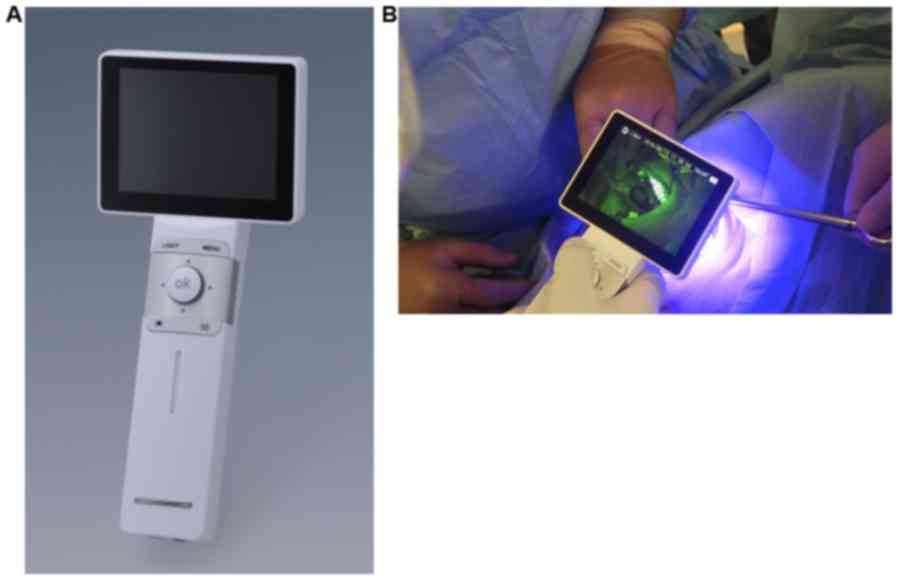
Device
Fluorescent visualization of oral mucosa was
conducted with IllumiScan® (SHOFU Inc.). It is a
lightweight (~320 g), portable device that allows one-handed
operation. IllumiScan® functions in a similar manner as
an intraoral camera, capturing a fluorescent image of the observed
intraoral site, saving it as digital data, and displaying the
fluorescent image on a screen, which enables multiple observers to
view it simultaneously (Fig. 1).
Method for color measurements of
fluorescence images
Fluorescent visualization principle and
assessment parameters
IllumiScan® enables the fluorescent
visualization of oral mucosa through the observation of
autofluorescence emitted by healthy mucosal cells. Fluorophores,
such as the coenzyme FAD in the mucosal epithelium and CCLs in the
stroma are excited by blue excitation light to generate bright
green fluorescence. Cells with premalignant or malignant lesions or
with abnormalities in the TCA cycle exhibit a decreased content of
the above-mentioned epithelial or stromal fluorophores in
comparison with healthy cells, which is consequently revealed as
decreased fluorescence (a loss of fluorescence). More specifically,
a loss of FAD fluorescence occurs in oral premalignant lesions,
whereas in OSCC, a loss of FAD or CCL fluorescence is observed.
Such fluorescence variations were, therefore, used for the
objective assessment of oral mucosa in the present study.
Excitation light and fluorescence wavelength
Oral tissue fluoresces when illuminated with the
excitation light emitted from IllumiScan®. The
horizontal axis in Fig. 2 indicates
the wavelengths at which FAD and CCLs fluoresce, whereas the
vertical axis shows the excitation wavelengths at which FAD and
CCLs are excited to generate fluorescence. The range of these
wavelengths was plotted as a circle and an ellipse for FAD and
CCLs, respectively. A light gray zone in the figure indicates a
band of the excitation wavelengths (peak: 425 nm) at which the
tissue was illuminated. FAD and CCLs were excited at wavelengths in
the range where the circle (for FAD) or ellipse (for CCLs) areas
overlap with the light gray zone; as a result, FAD and CCLs
fluoresced at wavelengths in the range designated as a band of
fluorescence-generated. The tissue was observed through the
fluorescence filter of IllumiScan®, which blocks the
intense reflection of the excitation light (upper limit: ~450 nm).
Therefore, we assessed fluorescence within a band of
fluorescence-observable wavelengths shown as a gray zone in the
figure, using the image analysis software described below (Fig. 2).
Analysis of fluorescence intensity using an image
analysis software
The basic operation of our image analysis software
is described below. An intraoral fluorescence image (1,920×1,080
pixels) captured by the camera integrated in the
IllumiScan® body was loaded onto the image analysis
software on a personal computer (PC) to display the image downsized
to 960×540 pixels. For each pixel of the image, RGB element values
[a color representation with R (red), G (green), and B (blue), each
with values ranging from 0 to 255] were provided; the G value
indicated the intensity of the green color at an arbitrary point in
the fluorescence image. The analysis software also provided: The
ratio between two mean G values obtained from selected regions in
two different fluorescence images; an image showing gradients based
on G values; selection of an area of concern (lesion area) to be
analyzed; and the ratio between G values inside and outside of the
selected area. The gradient expressed in the present study was
computed as follows: The mean G value of a total of 25 pixels
including a target pixel (5×5=25, a region-of-interest) in an
intraoral fluorescence image on the PC was calculated and treated
as a target intensity value in the region. Similarly, the mean G
value was calculated for each of the eight surrounding regions
adjacent to the region-of-interest and treated as an adjacent
intensity value for each surrounding region. The mean of absolute
values of differences between the target intensity value and each
of the adjacent intensity values was calculated and treated as a
gradient value.
Method for the measurement and evaluation of G
values
The measured area was defined as a circle with a
30-pixel diameter. For subjects with an oral mucosa disease, G
values at three arbitrary points from a lesion area and a
lesion-free area were measured, and the respective mean G values
were calculated for lesion and lesion-free areas. The ratio of the
mean G value from the lesion area versus that from the lesion-free
area was also calculated. For healthy subjects, we measured G
values in specific regions of oral mucosa, i.e., the tongue
(lingual edge, sublingual surface, and dorsum of the tongue), the
floor of the oral cavity, buccal mucosa, upper and lower lip
mucosa, and maxillary and mandibular gingiva, excluding the lingual
frenulum and median palatine suture because of abundant expression
of keratinized tissue and resultant tendency for more intensive
fluorescence. Furthermore, for the determination of the extent of
lesion resection, we compared an iodine-unstained area (identified
by the conventional iodine staining method) to an image produced by
the fluorescence visualization method described in the present
study.
Measurement environment
The measurement of fluorescence was performed in a
standardized clinical environment, where natural and artificial
lighting could be blocked.
Resection method
Fluorescence light was irradiated onto the area of
resection (resection range) of OSCC to mark the extent of FVL and
the iodine-unstained area; the resection was performed under
general anesthesia by considering the position that was 5 mm from
the outermost circumference of FVL as the resection stump. The
resection specimen was fixed in an extended position and marked to
confirm the extent of FVL on the tissue specimen. Histopathological
assessments were performed by hematoxylin and eosin (H&E) and
immunohistochemical staining (CK13, CK17, Ki67, p53, and
E-cadherin) of the FVL(+) area and the resection stump FVL(−) as
well as by Picro-Sirius Red staining to examine the CCL.
Histopathological assessment
Approximately 4-mm thick slices were prepared from
the paraffin-embedded blocks of resected tissue, and one slice was
subjected to H&E staining, whereas the others were subjected to
CK13, CK17, Ki67, p53, and E-cadherin staining as well as to
Picro-Sirius Red staining. The following antibodies were employed:
Monoclonal anti-CK13 (Dako, F7), monoclonal anti-CK17 (Dako, E3),
monoclonal anti-Ki67 (Dako, clone MB-1), and monoclonal anti-p53
(Dako, clone p53). Processing was performed using an automatic
stainer (Autostainer 48; Ventana). All the cases included basal
oral epithelial cells, which showed nuclear positivity, as positive
controls. In negative controls, the primary antibody was omitted.
The percentage of positive nuclei in 400 consecutive epithelial
cells in the selected areas representative of the lesion was
determined and provided a semi-quantitative evaluation of the
immunohistochemical results. The assessment method reported by
Shiozaki et al (6) was used
to evaluate the expression. The entire specimen was observed;
samples with protein expression in the cell membrane similar to
that in the FVL(−) area (the positive control) were regarded to be
strongly accumulated, whereas samples that showed protein
expression in an even, weak staining pattern were considered to be
accumulated; no protein expression over the entire specimen was
considered to be negative. Picro-Sirius Red staining was performed
by deparaffinizing the samples, incubating them with
phosphomolybdic acid for 2 min and Picro-Sirius Red F3BA staining
solution for 60 min, and treating them with 0.1 N hydrochloric acid
for 2 min and with 70% ethanol for 45 sec. The color of collagen
was determined in the three categories as proposed by Aparna and
Charu (7) and its density was
evaluated. The assessments were performed by two pathologists.
Statistical analysis
The paired t-test was used to assess the statistical
significance of differences between the samples. P<0.05 was
considered to indicate a statistically significant difference.
Results
Clinical information
This study included seven patients with squamous
cell carcinoma of the tongue. There were five male and two female
individuals, and the mean age of the subjects was 55 years (range,
43–76 years). On the basis of observation of the disease, two
patients had granular tumors, two had diffuse tumors, two had a mix
of vitiligo and diffuse tumors, and one patient had a vitiligo-type
tumor. The detailed clinical information for all the patients is
presented in Table I.
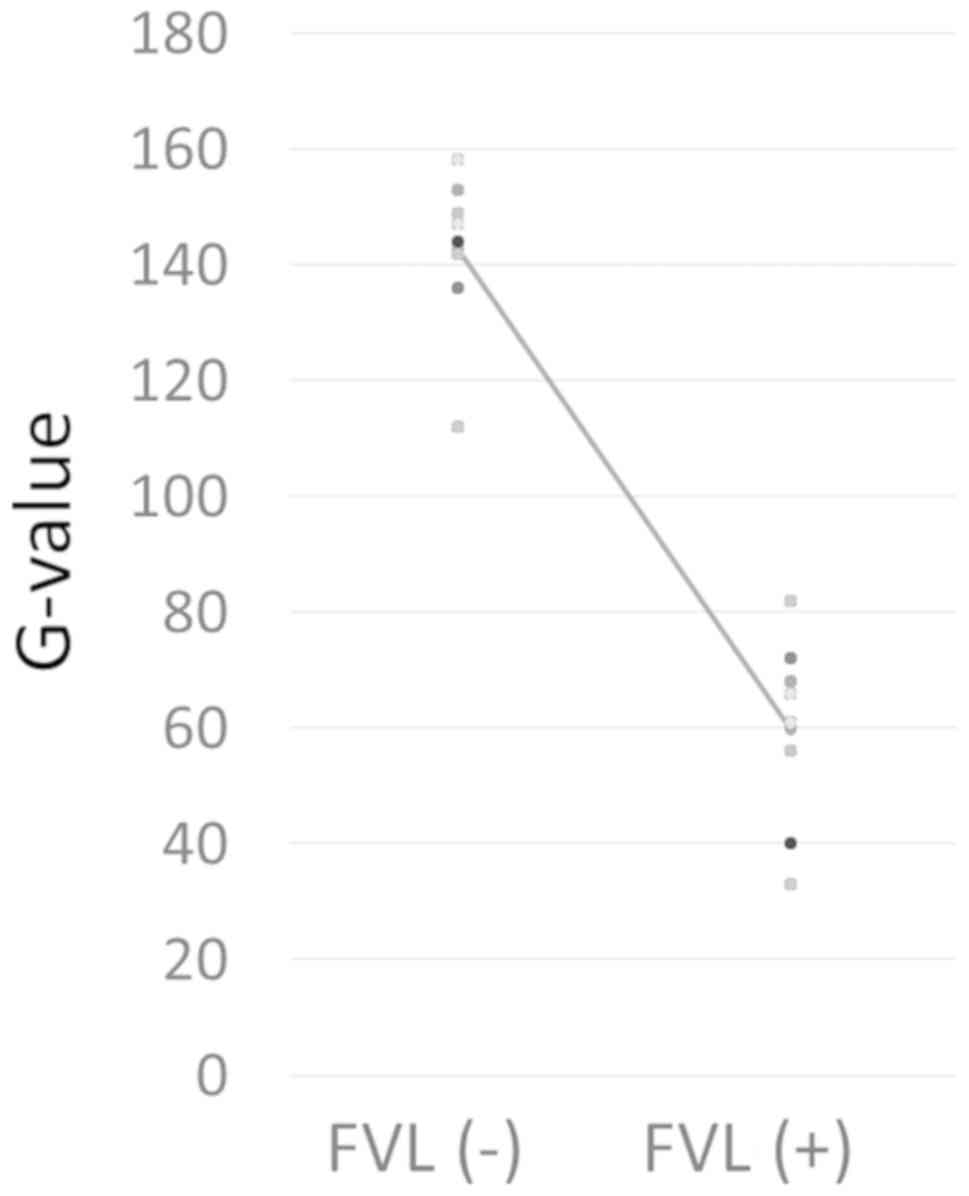
G value measurements
The G values for the FVL(+) and FVL(−) areas in the
tumors of each subject are shown Fig.
3. The G values for the FVL(+) area ranged between 33 and 72,
with a mean of 56, whereas those for the FVL(−) area were between
136 and 158, with a mean of 147. There were statistically
significant differences between the two groups (Fig. 4). The fluorescence luminance G was
lower than 80 in the FVL(+) areas and higher than 130 in the FVL(−)
areas for all the subjects (Fig.
3).
Histopathological assessment
The FVL(+) area showed destruction of collagen and
roughness in the Picro-Sirius Red staining, whereas the FVL(−) area
did not show any disruption of the collagen arrangement. However,
collagen exhibited a slightly rough pattern in the FVL(+) areas in
cases 3, 4 and 7. All specimens showed category 1 (reddish-orange)
birefringence. Although there was pronounced CCL destruction, its
extent varied for the different cases. The staining for CK13 was
negative in the FVL(+) areas and positive in the FVL(−) areas,
whereas the opposite was true for CK17. The expression of p53 was
positive in the FVL(+) areas. The expression of Ki67 was positive
throughout the entire epithelium for the FVL(+) areas and was only
noted in the basal cell layer for the FVL(−) areas. Extensive
staining was observed for E-cadherin in the FVL(−) area but was
sparse in the FVL(+) area in all the subjects. The luminance G
value tended to be lower in the subjects with weaker E-cadherin
staining in the FVL(+) area (Figs. 5
and 6; Table II).
 | Figure 5.Left-sided tongue cancer in a
62-year-old male. (A) Image of the oral cavity. (B) Fluorescence
visualization. (C) Histopathological assessment. H&E, CK13,
CK17, Ki67, p53 and E-cadherin staining (magnification, ×40), and
Picro-Sirius Red staining (magnification, ×200). FVL(+),
fluorescence visualization loss; FVL(−), no fluorescence
visualization loss; H&E, hematoxylin and eosin; SCC, squamous
cell carcinoma. |
 | Figure 6.Left-sided tongue cancer in a
59-year-old male. (A) Image of the oral cavity. (B) Fluorescence
visualization. (C) Histopathological assessment. H&E, CK13,
CK17, Ki67, p53 and E-cadherin staining (magnification, ×40), and
Picro-Sirius Red staining (magnification, ×200). FVL(+),
fluorescence visualization loss; FVL(−), no fluorescence
visualization loss; H&E, hematoxylin and eosin; SCC, squamous
cell carcinoma. |
| Table II.Results of the immunohistological
examination and G-values. |
Table II.
Results of the immunohistological
examination and G-values.
|
|
|
| Case 1 | Case 2 | Case 3 | Case 4 | Case 5 | Case 6 | Case 7 |
|---|
|
|
|
|
|
|
|
|
|
|
|
|---|
| Stain | Normal | Malignant | FVL(−) | FVL(+) | FVL(−) | FVL(+) | FVL(−) | FVL(+) | FVL(−) | FVL(+) | FVL(−) | FVL(+) | FVL(−) | FVL(+) | FVL(−) | FVL(+) |
|---|
| CK13 | Positive | Negative | Positive | Negative | Positive | Negative | Positive | Negative | Positive | Negative | Positive | Negative | Positive | Negative | Positive | Negative |
| CK17 | Negative | Positive | Negative | Positive | Negative | Positive | Negative | Positive | Negative | Positive | Negative | Positive | Negative | Positive | Negative | Positive |
| Ki67 | Positive | Positive | Positive | Positive | Positive | Positive | Positive | Positive | Positive | Positive | Positive | Positive | Positive | Positive | Positive | Positive |
|
| (Parabasal | (all layer) | (Parabasal | (all layer) | (Parabasal | (all layer) | (Parabasal | (all layer) | (Parabasal | (all layer) | (Parabasal | (all layer) | (Parabasal | (all layer) | (Parabasal | (all layer) |
|
| layer) |
| layer) |
| layer) |
| layer) |
| layer) |
| layer) |
| layer) |
| layer) |
| p53 | Negative | Positive | Negative | Positive | Negative | Positive | Negative | Positive | Negative | Positive | Negative | Positive | Negative | Positive | Negative | Positive |
| E-cadherin | Strongly | Accumulate | Strongly | Accumulate | Strongly | Accumulate | Strongly | Accumulate | Strongly | Accumulate | Strongly | Accumulate | Strongly | Accumulate | Strongly | Accumulate |
|
| accumulate |
| accumulate |
| accumulate |
| accumulate |
| accumulate |
| accumulate |
| accumulate |
| accumulate |
| Picro-Sirius | Dense | Sparse | Dense | Sparse | Dense | Sparse | Dense | Dense-Sparse | Dense | Dense-Sparse | Dense | Sparse | Dense | Sparse | Dense | Dense-Sparse |
| Red |
Discussion
Oral squamous cell carcinoma is one of the common
malignancies with significant morbidity and mortality. Its
metastatic and invasive potential results in poor prognosis. Oral
squamous cell carcinoma is often associated with loss of eating and
speech functions, disfigurement, and psychological distress. The
primary treatment for this disease is surgical intervention.
Despite considerable advances in treatment over the past two
decades, the overall disease outcome has improved only modestly
(8). Local tumor recurrence affects
approximately 60% of patients, and metastases develop in 15–25%
(9). The prevention and management
of oral squamous cell carcinoma will greatly benefit from the
identification of molecular biomarkers and therapeutic targets for
the disease (10,11).
Many cases of OSCC occur in readily visualized
areas, and the disease has, therefore, been regarded as easy to
diagnose. In the past, the condition was clinically diagnosed only
by visual observation and palpation followed by cytological and
histological examination. However, a variety of pathological
conditions of the oral mucosa, such as leukoplakia, oral lichen
planus, oral candidiasis, and aphthous stomatitis, may be very
difficult to differentiate from early-stage cancer simply by visual
observation owing to similarities in their clinical presentation.
In recent years, a simple and feasible vital staining by iodine and
toluidine blue has been employed, which reportedly facilitates the
disease staging and diagnosis of advanced epithelial dysplasia and
early-stage cancer. However, this approach cannot be applied in all
cases and in particular in outpatients due to restrictions, such as
patient discomfort and allergies to the staining solutions
(1).
However, the advancement of optical engineering in
recent years has significantly contributed to the diagnosis and
treatment of various oral mucosa diseases including oral cancer.
Since 2008, researchers from North America have attempted to
develop new methods based on optical approaches for the examination
and diagnosis of oral cancer. Optical instruments, such as the
magnifying endoscope NBI® (Narrow Band Imaging) system
(12–14) and VELscope® (DenMat)
(2–5), have been introduced for use in
non-invasive and early discovery of OSCC. The NBI®
system is an image enhancement technology that was jointly
developed by Olympus Medical Systems and the Department of
Gastroenterological Endoscopy, National Cancer Center Hospital
East. It clearly visualizes the vascular structure and minute
changes in the mucosal surface layer by irradiation with light in
two narrow spectral widths of 415 and 540 nm, through a narrow band
filter, which is strongly absorbed by hemoglobin. As a result, the
system clearly depicts the intraepithelial papillary capillary loop
present in the superficial layer of the mucous membrane, thereby,
serving as an indicator to diagnose malignancies, including
esophageal and oral cancer. Because this system is expensive,
large, and requires partial sterilization despite being a
non-contact device, it is not easy to install, and its widespread
deployment in dental clinics has been impeded.
The portable optical instrument manufactured by
Shofu Inc., which was used in the present study, irradiates the
surface with a 425-nm blue light and enables the visualization of
oral mucosal diseases. Using this instrument, an image analysis
software that digitized the color of the mucous membrane (G value)
was developed to obtain objective data that cannot be acquired with
vital staining and conventional fluorescence visualization devices
(5). As a result, minute changes in
fluorescence that could not be recognized by visual inspection
could be recorded in a digitized form, and color changes, otherwise
unrecognizable by direct observation, could be detected by the
software. Although the principle of fluorescence visualization is
presumably related to the decrease in FAD levels and destruction of
CCL, based on clinical experience with presented cases for which
the results of fluorescence visualization did not match the
pathology, we inferred that some other factor is also implicated.
Therefore, in the present study, we focused on immunohistochemical
staining of CK13, CK17, Ki67, p53, and E-cadherin, especially on
the cell adhesion molecule, E-cadherin.
Cell adhesion molecules include members of the
immunoglobulin superfamily, integrin superfamily, and cadherin
family. Among them, E-cadherin, which plays a central role in the
adhesion between epithelial cells, is expressed in epithelial
tissues, and is a classic cadherin involved in the formation of
adherence junctions. It binds to intracellular β- and γ-catenin and
to the cytoskeleton, including α-catenin and actin filaments
(15). In normal stratified squamous
epithelium, E-cadherin is observed in the stratum basale and
stratum spinosum, but not in the basal lamina. In recent years,
cancer infiltration and metastases have been attributed to
epithelial-mesenchymal transition (EMT) of epithelial tumor cells,
which leads to the loss of their epithelial characteristics and
migration through the stroma in a disseminated manner. E-cadherin
has been used as an epithelial marker in the assessment of EMT, and
its attenuation or disappearance is considered an indicator of
complete EMT (16,17). The reduced expression of the
E-cadherin and catenin family members is observed in a variety of
cancer types and is strongly associated with infiltration,
metastasis, and prognosis (18,19).
Schipper et al (20) reported
that the abnormal expression of E-cadherin in head and neck
squamous cell carcinoma was related not only to the degree of
cancer differentiation but also to the presence or absence of
cervical lymph node metastases; furthermore, similar results were
reported for OSCC (21). In these
studies, approximately 50% of the subjects presented with
attenuated E-cadherin expression. However, to the best of our
knowledge, there are no reports on the relationship between
E-cadherin expression and fluorescence visualization.
In the present study, the G value was higher in the
FVL(−) areas than in the FVL(+) areas for all subjects for whom
fluorescence visualization was conducted. Furthermore, the
Picro-Sirius Red staining revealed no CCL destruction in the FVL(−)
areas, whereas the extent of CCL destruction in the FVL(+) areas
varied with the subject. CK13 expression was positive in normal
oral mucosa and negative in intraepithelial tumors, whereas the
opposite tended to be true for CK17 expression. All seven subjects
in the present study showed the same results. Because there is a
positive correlation between the expression level of Ki67 and tumor
malignancy, it would be useful as a marker for the detection of
proliferating cells in tumor tissues. Furthermore, p53 has a very
short half-life in normal cells, and is not present in quantities
that would result in positive immunostaining. E-cadherin was
expressed extensively in the FVL(−) areas. In contrast, although
the FVL(+) areas had lower G values than the FVL(−) areas in all
the subjects, the expression of E-cadherin was attenuated
regardless of the extent of CCL destruction. Furthermore, subjects
with strong attenuation of E-cadherin expression tended to have low
G values.
Even though the number of specimens examined in this
study was small and relationship to local recurrence was not been
studied, the results suggest the involvement of attenuation of
E-cadherin expression regardless of the decrease in G value and
extent of CCL destruction as a factor contributing to the principle
of fluorescence regulation, in addition to a decrease in FAD level
and destruction of CCL. It is our ultimate goal to use this device
for setting the surgical margins for oral squamous cell carcinoma.
The present study describes a preliminary step in this direction.
And we would need to conduct further studies on a larger number of
patients to validate our results, particularly regarding the
relationship between the histopathological appearances and the G
value.
In conclusion, the results of this study suggest
that a decrease in the luminance G value in oral mucosal
fluorescence visualization is related to the cell adhesion factor,
E-cadherin, and that this may contribute to a new principle
underlying the regulation of fluorescence from oral mucosa.
Acknowledgements
The authors would like to thank Dr Eiko Suzuki
(Department of Oral Pathobiological Science and Surgery, Tokyo
Dental College, Tokyo, Japan) for technical advice.
Funding
This research was supported by grants for Private
University Branding Project supported by Ministry of Education,
Culture, Sports, Science and Technology, Japan, and Tokyo Dental
College Branding Project for Multidisciplinary Research Center for
Jaw Disease (MRCJD): Achieving Longevity and Sustainability by
Comprehensive Reconstruction of Oral and Maxillofacial
functions.
Availability of data and materials
The datasets used and/or analyzed during the current
study are available from the corresponding author on reasonable
request.
Authors' contributions
KS and AK developed the study design, analyzed the
data, and wrote the original manuscript. YK and MK analyzed the
data. SM, KO, KK, KN, KM and SA contributed to data analysis, and
manuscript writing and revision. All authors read and approved the
final manuscript.
Ethics approval and consent to
participate
The present study was conducted with the approval of
the Tokyo Dental College Ethics Committee (approval no. 759).
Informed consent was obtained from all the participants, and this
informed consent included consent to participate in the study and
consent to publish their images.
Patient consent for publication
Informed consent was obtained from all the
participants, and this informed consent included consent to
participate in the study and consent to publish their images.
Competing interests
The authors declare that they have no competing
interests.
References
|
1
|
Takano M, Kakizawa T, Takasaki Y, Seta S,
Noma H, Yajima Y and Nomura S: Clinical classification to indicate
stage of oral precancerous lesions and early cancer with iodine and
toluidine blue staining test. Head Neck Cancer. 28:41–46. 2002.
View Article : Google Scholar
|
|
2
|
Lane P: Fluorescence instrumentation for
the direct visualization of oral mucosa. The Inside Summit on Oral
Cancer Discovery and Management. The technologies and the Role of
Dental Clinicians; Boston: 2017
|
|
3
|
Poh CH, Zhang L, Anderson DW, Durham JS,
Williams PM, Priddy RW, Berean KW, Ng S, Tseng OL, MacAulay C and
Rosin MP: Fluorescence visualization detection of field alterations
in tumor margins of oral cancer patients. Clin Cancer Res.
12:6716–6722. 2006. View Article : Google Scholar : PubMed/NCBI
|
|
4
|
Poh CF, Ng SP, Williams PM, Zhang L,
Laronde DM, Lane P, Macaulay C and Rosin MP: Direct fluorescence
visualization of clinically occult high-risk oral premalignant
disease using a simple hand-held device. Head Neck. 29:71–76. 2007.
View Article : Google Scholar : PubMed/NCBI
|
|
5
|
Sugahara K, Futoo E, Bessho H, Sekine R,
Ohno K, Katakura A and Shibahara T: Fluorescence visualization for
oral mucosa using an auto-fluorescence imaging analysis software. J
Jap Soc Oral Diagn/Oral Med. 30:168–175. 2017. View Article : Google Scholar
|
|
6
|
Shiozaki H, Tahara H, Oka H, Miyata M,
Kobayashi K, Tamura S, Iihara K, Doki Y, Hirano S, Takeichi M, et
al: Expression of immunoreactive E-cadherin adhesion molecules in
human cancer. Am J Pathol. 139:17–23. 1991.PubMed/NCBI
|
|
7
|
Aparna V and Charu S: Evaluation of
collagen in different grades of oral squamous cell carcinoma by
using picrosirius red stain-A histochemical study. J Clin Diagn
Res. 4:3444–3449. 2010.
|
|
8
|
Eheman C, Henley SJ, Ballard-Barbash R,
Jacobs EJ, Schymura MJ, Noone AM, Pan L, Anderson RN, Fulton JE,
Kohler BA, et al: Annual Report to the Nation on the status of
cancer, 1975–2008, featuring cancers associated with excess weight
and lack of sufficient physical activity. Cancer. 118:2338–2366.
2012. View Article : Google Scholar : PubMed/NCBI
|
|
9
|
Genden EM, Ferlito A, Bradley PJ, Rinaldo
A and Scully C: Neck disease and distant metastases. Oral Oncol.
39:207–212. 2003. View Article : Google Scholar : PubMed/NCBI
|
|
10
|
Sabichi AL, Demierre MF, Hawk ET, Lerman
CE and Lippman SM: Frontiers in cancer prevention research. Cancer
Res. 63:5649–5655. 2003.PubMed/NCBI
|
|
11
|
Spafford MF, Koch WM, Reed AL, Califano
JA, Xu LH, Eisenberger CF, Yip L, Leong PL, Wu L, Liu SX, et al:
Detection of head and neck squamous cell carcinoma among exfoliated
oral mucosal cells by microsatellite analysis. Clin Cancer Res.
7:607–612. 2001.PubMed/NCBI
|
|
12
|
Inoue H, Honda T, Nagai K, Kawano T,
Yoshino K, Takeshita K and Endo M: Ultra-high magnification
endoscopic observation of carcinoma in situ of the esophagus. Dig
Endosc. 9:16–18. 1997. View Article : Google Scholar
|
|
13
|
Takano JH, Yakushiji T, Kamiyama I, Nomura
T, Katakura A, Takano N and Shibahara T: Detecting early oral
cancer: Narrowband imaging system observation of the oral mucosa
microvasculature. Int J Oral Maxillofac Surg. 39:208–213. 2010.
View Article : Google Scholar : PubMed/NCBI
|
|
14
|
Sekine R, Yakushiji T, Tanaka Y and
Shibahara T: A study on the intrapapillary capillary loop detected
by narrow band imaging system in early oral squamous cell
carcinoma. J Oral Maxillofac Surg. 27:624–630. 2015.
|
|
15
|
Takeichi M: Cadherin cell adhesion
receptors as a morphogenetic regulator. Science. 251:1451–1455.
1991. View Article : Google Scholar : PubMed/NCBI
|
|
16
|
Thiery JP: Epithelial-mesenchymal
transitions in tumour progression. Nat Rev Cancer. 2:442–54. 2002.
View Article : Google Scholar : PubMed/NCBI
|
|
17
|
Thiery JP and Sleeman JP: Complex networks
orchestrate epithelial-mesenchymal transitions. Nat Rev Mol Cell
Biol. 7:131–142. 2006. View
Article : Google Scholar : PubMed/NCBI
|
|
18
|
Ma L, Liu L, Ma Y, Xie H, Yu X, Wang X,
Fan A, Ge D, Xu Y, Zhang Q and Song C: The role of
E-cadherin/β-catenin in hydroxysafflor yellow A inhibiting
adhesion, invasion, migration and lung metastasis of hepatoma
cells. Biol Pharm Bull. 40:1706–1715. 2017. View Article : Google Scholar : PubMed/NCBI
|
|
19
|
Shiozaki H, Doki Y, Kawanishi K, Shamma A,
Yano M, Inoue M and Monden M: Clinical application of malignancy
potential grading as a prognostic factor of human esophageal
cancers. Surgery. 127:552–561. 2000. View Article : Google Scholar : PubMed/NCBI
|
|
20
|
Schipper JH, Frixen UH, Behrens J, Unger
A, Jahnke K and Birchmeier W: E-cadherin expression in squamous
cell carcinomas of head and neck: Inverse correlation with tumor
dedifferentiation and lymph node metastasis. Cancer Res.
51:6328–6337. 1991.PubMed/NCBI
|
|
21
|
Schipper JH, Unger A and Jahnke K:
E-cadherin as a functional marker of the differentiation and
invasiveness of squamous cell carcinoma of the head and neck. Clin
Otolaryngol Allied Sci. 19:381–384. 1994. View Article : Google Scholar : PubMed/NCBI
|