Introduction
Bladder cancer (BC) is the most frequently diagnosed
malignancy of the urinary system. Among all types of cancer, BC is
the 10th most common cancer worldwide with an estimated 549,000 new
cases and 200,000 deaths in 2018 (1). Furthermore, >70% of newly diagnosed
patients with BC exhibit non-muscle invasive BC and ~50–70% of
these cases eventually exhibit invasive potential with more
aggressive characteristics (2). The
standard treatment choice for patients with BC is primarily
surgical resection. Patients with BC undergoing surgery are at
high-risk of the recurrence, as well as occasional stage
progression. In advanced BC, following radical surgery or
radiotherapy, patients still have poor outcomes (3). The anticancer drug cisplatin frequently
serves as first-line chemotherapy. However, the therapeutic effects
in patients with BC remain poor (4).
It is crucial to elucidate the molecular mechanisms of the
malignant properties of BC to increase the survival times of
patients and provide novel strategies and/or molecular targets for
the early diagnosis and more effective treatment of patients with
BC.
MicroRNAs (miRNAs or miRs) are short non-coding RNAs
(18–25 nucleotides in length) that bind to the 3′-untranslated
regions (UTRs) of the mRNAs of their target genes in a
sequence-specific manner, promoting post-transcriptional inhibition
or degradation (5–7). Increasing evidence has indicated that
miRNAs serve pivotal roles in the regulation of numerous cellular
processes including proliferation, differentiation and development
(8–10). Furthermore, miRNAs have been
demonstrated to be frequently dysregulated in a variety of human
cancers, indicated that miRNAs may tightly participate in the
development and/or progression of cancer (11,12). For
example, it has been described that miR-221 is aberrantly
overexpressed in breast cancer and has an ability to stimulate the
migration/invasion of breast cancer cells (13). Liang et al (14) reported that colon cancer tissues
expressed lower levels of miR-141-3p compared with corresponding
normal tissues and that the overexpression of miR-141-3p in colon
cancer cells attenuated proliferation, migration and invasion
rates. These findings indicated that miRNAs may act as oncogenes
and/or tumor suppressor genes.
Schoolmeesters et al (15) demonstrated that miR-489 served a
critical role in the regulation of osteogenesis. Cheung et
al (16) revealed that miR-489
was implicated in mammalian stem cell proliferation. Similar to
other miRNAs, such as miR-26 and let-7 (17,18),
miR-489 may also be involved in carcinogenesis. Zhang et al
(19) demonstrated that miR-489 was
downregulated in gastric cancer tissues compared with corresponding
normal tissues and overexpression of miR-489 in gastric cancer
cells suppressed proliferation and invasion. Yuan et al
(20) reported that miR-489 acted as
an inhibitor of pancreatic cancer invasion. Additionally, Gao et
al (21) revealed that the
elevated expression level of miR-489 was significantly associated
with a prolonged survival rate of patients with colon cancer and
overexpression of miR-489 in colon cancer cells inhibited their
migration and invasion abilities. These observations indicated that
miR-489 may act as a tumor-suppressor in a cancer type-independent
manner.
The current study focused on miR-489-3p and
investigated its functional role in BC. According to the results,
there was an inverse relationship between the expression levels of
miR-489-3p and its downstream target histone deacetylase 2 (HDAC2)
in BC tumor tissues. Depletion of miR-489-3p and HDAC2 increased
and decreased the proliferation and migration abilities of BC
cells, respectively. Consistent with these observations, increased
expression of miR-489-3p suppressed in vivo tumor growth and
markedly reduced HDAC2 expression. In conclusion, the results of
the current strongly indicated that the miR-489-3p/HDAC2 axis
serves a vital role in the regulation of the development and/or
progression of BC.
Materials and methods
Cells and culture
Human BC-derived T24 and 5637 cells and 293T cells
were obtained from The Cell Bank of Type Culture Collection of the
Chinese Academy of Sciences. Cells were maintained in RPMI 1640
medium (Gibco; Thermo Fisher Scientific, Inc.) supplemented with
10% heat-inactivated FBS (Gibco; Thermo Fisher Scientific, Inc.).
Cells were cultured in incubators with humidified atmospheres of 5%
CO2 and 95% air at 37°C.
Transfection
T24 and 5637 cells were seeded in six-well plates at
the density of 0.5×10⁶ cells/well and were transfected
using Lipofectamine® 2000 (Invitrogen; Thermo Fisher
Scientific, Inc.), according to the manufacturer's protocol. The
double-stranded miR-389-3p mimics, agomir and corresponding
negative control (NC) RNAs (Suzhou GenePharma Co., Ltd.) or their
inhibitors and antagomir were introduced into cells at a final
concentration of 50 nM. At 48 h post-transfection, cells were
collected for further experiments. The sequence of miR-489-3p
mimics and its inhibitor were as follows: miR-489-3p mimics/agomirs
forward, 5′-GUGACAUCACAUAUACGGCAGC-3′ and reverse,
5′-UGCCGUAUAUGUGAUGUCACUU-3′; negative control forward,
5′-UUCUCCGAACGUGUCACGUTT-3′ and reverse,
5′-ACGUGACACGUUCGGAGAATT-3′; miR-489-3p inhibitor/antagomir,
5′-GCUGCCGUAUAUGUGAUGUCAC-3′; and miR-489-3p inhibitor/agomir
negative control, 5′-CAGUACUUUUGUGUAGUACAA-3′. Negative control
siRNA and siRNA against histone deacetylase 2 (cat. no. sc-44262;
Santa Cruz Biotechnology, Inc.) were introduced into T24 and 5637
cells at a final concentration of 10 nM. miR-489-3p inhibitor and
siRNA against HDAC2 were simultaneously introduced into T24 cells
at final concentrations of 50 and 10 nM, respectively, for a
duration of 48 h. Empty lentivirus (Lv-NC) vector and miR-489-3p
lentivirus expressing vector (Lv-miR-489-3p,
H1-has-miR-489-3p-CMV-GFP-puro) were purchased from Suzhou
GenePharma Co., Ltd.. To obtain miR-489-3p-overexpressing T24
cells, 5 µl of the miR-489-3p lentivirus expressing vector solution
(virus titer=5×10⁸ TU/ml) with 5 µg/ml polybrene were
added to T24 cells (MOI=10). Puromycin (1 µg/ml) was used to select
transfected cells. The concentration of puromycin used for
transfection maintenance was also 1 µg/ml. At 72 h
post-transfection, miR-489-3p expression levels were determined by
reverse transcription-quantitative PCR (RT-qPCR).
Patients and tissue samples
The 31 BC tissues and 11 corresponding adjacent
non-cancer tissues used in the present study were obtained from 31
patients who were pathologically diagnosed with urothelial BC and
who underwent transurethral bladder tumor resection (20 cases) or
radical cystectomy (11 cases) between January, 2014 and February
2017 at the First Hospital of China Medical University (Shenyang,
China). The average age of patients was 70.6 years (age range,
61–80 years) and the sex distribution was 24 males and 7 females.
The recruitment lasted for 30 months. The freshly collected tissues
were fixed with 10% formalin at room temperature for 24 h, frozen
in liquid nitrogen and stored at −80°C for histological examination
and RT-qPCR. The adjacent normal non-cancerous tissues were
collected at locations >5 cm from tumors. All tissues were
histologically examined by two pathologists. The present study was
approved by the Research Ethics Committee of China Medical
University and written informed consent was obtained from all
patients.
In vivo animal studies
Tumor-formation experiments in nude mice were
performed at the Experimental Animal Center of China Medical
University. The animal study was approved by Institutional Animal
Care and Use Committee of China Medical University (approval no.
2018160). A total of 10 BALB/C nude female mice (body weights,
14–16 g; age, 6 weeks) were obtained from Charles River
Laboratories, Inc.. Mice were randomly divided into 2 groups
randomly: Lv-NC or Lv-miR-489-3p. Each group contained 5 mice,
which is experimentally estimated to be able to satisfactorily
detect the growing difference of xenografted tumors between two
groups (22). T24 cells were
infected with Lv-miR-489-3p or Lv-NC, according to the
manufacturer's protocol. A total of 1×10⁷ T24 cells
transfected with Lv-NC or Lv-miR-489-3p were subcutaneously
implanted into the right axilla of the mice. All mice were housed
and maintained under specific pathogen-free conditions in clear
cages with free access to food and water at room temperature
(22–25°C) and 50% humidity with 12-h light/dark cycles. Animal
health and behavior were monitored every two days. In the current
study, humane endpoints included: i) Tumor size reaching a diameter
of 1.5 cm; ii) tumor surface bleeding; and iii) the presence of
cachexia. When one of these symptoms appeared in the mice, the
experiment was terminated immediately and cervical dislocation was
performed. The protocol was scheduled for 28 days. No mice died
during the experiment. All mice were anaesthetized with an
intraperitoneal injection of 50 mg/kg pentobarbital sodium
(Sigma-Aldrich; Merck KGaA) and cervical vertebrae were dislocated.
Following euthanasia, lack of heartbeat was used to verify death.
The maximum diameter of the observed tumors was 13 mm. No mice had
multiple tumors. The maximum percentage of weight loss observed
from start to endpoint was 14.29%. Tumor volume was calculated as
follows: Volume (mm3)=width2 (mm2)
× length (mm) ×0.4.
Animal tissue staining
Tumors were immersed in 4% paraformaldehyde at room
temperature for 4 h, and transferred to 70% ethanol overnight at
4°C. Then tumors were placed in processing cassettes, dehydrated
through an increasing ethanol gradient (70, 80, 90 and 100%), and
embedded in paraffin wax blocks. Sections (5-µm-thick) were dewaxed
in xylene, rehydrated through decreasing concentrations of ethanol
(100, 90, 80 and 70%), and washed in PBS. Then sections were
stained with hematoxylin and eosin (H&E). After staining,
sections were dehydrated through increasing concentrations of
ethanol and xylene and sealed with neutral gum.
Bioinformatics analysis
To predict the target genes of has-miR-489-3p, the
TargetScan database (www.targetscan.org, Release 7.1) and Oncomir database
(www.oncomir.org) were interrogated, The venn
diagram was generated by FunRich software (version 3.1.3) to
determine the overlapping target genes between TargetScan and
Oncomir.
Transwell assay
Transwell assays were performed to assess the
migration abilities of the transfected T24 and 5637 cells using 6.5
mm Transwell plates with 8.0 µm Pore Polycarbonate Membrane Inserts
(cat. no. 3422; Corning, Inc.). Briefly, 1×10⁴ cells
were suspended in 200 µl of serum-free RPMI 1640 medium and seeded
in the upper chamber. In the lower chamber, the medium was
supplemented with 10% heat-inactivated FBS, which was used as a
chemoattractant. Cells were incubated in a humidified incubator at
37°C and 5% CO2. After 24 h, the non-migrated cells were
removed with a cotton tip. The remaining cells on the bottom
surface were fixed, stained with 0.1% crystal violet at room
temperature for 20 min. Images were captured using a Leica DM3000
microscope (Leica Microsystems GmbH; magnification, ×40 and ×100).
The numbers of cells were counted in ≥5 independent fields of view
fields using ImageJ 1.51v software (National Institutes of
Health).
RNA isolation and RT-qPCR
Total RNA, including micro-RNA from cultured cells
and frozen bladder tissues, was extracted using a miRNeasy Mini kit
(Qiagen; GmbH), according to the manufacturer's protocol. cDNA of
the coding genes was synthesized using a Prime Script RT Master Mix
kit (Takara Biotechnology Co., Ltd.; cat. no. RR360A) and cDNA of
miRNAs was generated using a Mir-XTM miRNA First-Strand Synthesis
kit (Takara Biotechnology Co., Ltd.; cat. no. 638313), according to
the manufacturer's protocol. PCR reactions were performed using
SYBR Premix Ex Taq™ kit (cat. no. RR420A) and SYBR
Premix Ex Taq™ (cat. no. RR820A; Takara Biotechnology Co., Ltd.)
according to the manufacturer's protocol. β-actin and U6 were used
as internal controls. The sequences of the primers were as follows:
miR-489-3p 5′-GTGACATCACATATACGGCAG-3′; HDAC2 forward,
5′-TGTGAGATTCCCAATGAGTTGC-3′ and reverse,
5′-GGTAACATGCGCAAATTTTCAA-3′; and β-actin forward,
5′-ACTTAGTTGCGTTACACCCTT-3′ and reverse, 5′-GTCACCTTCACCGTTCCA-3′.
The primer of miR-489-3p for RT-qPCR was the mRQ 3′ Primer in
Mir-XTM miRNA First-Strand Synthesis kit. The forward and reverse
primers for U6 were also provided in the kit Mir-XTM miRNA
First-Strand Synthesis kit. The thermocycling conditions for miRNA
were as follows: 95°C for 10 sec, 95°C for 5 sec, 60°C for 20 sec
for 50 cycles, 95°C for 1 min, 40°C for 1 min, 65°C for 1 sec and
40°C for 5 sec. The thermocycling conditions for HDAC2 were as
follows: 95°C for 30 sec, 95°C for 5 sec, 60°C for 30 sec for 45
cycles, 95°C for 1 min, 40°C for 1 min, 65°C for 1 sec and 40°C for
5 sec. The relative expression levels were normalized to endogenous
control (U6 or β-actin) and were expressed as 2−ΔΔCq
(23).
Western blotting
T24 and 5637 cells and tumor tissues were lysed
using RIPA protein extraction reagent (Beyotime Institute of
Biotechnology) supplemented with 1% protease inhibitor cocktails
(Roche Applied Science). Protein concentration was measured using
the BCA assay (Beyotime Institute of Biotechnology; cat. no.
P0012). Equal amounts of proteins (20 µg/lane) were separated by
10% SDS-PAGE and transferred onto PVDF membranes (EMD Millipore).
Following blocking with 5% non-fat milk at 4°C overnight, the
membranes were probed with rabbit anti-HDAC2 monoclonal antibodies
(1:2,000; Cell Signaling Technology, Inc.; cat. no. 57156s), mouse
anti-β-actin monoclonal antibodies (1:3,000; Cell Signaling
Technology, Inc.; cat. no. 3700), or rabbit anti-GAPDH (1:5,000;
cat. no. sc-25778; Santa Cruz Biotechnology, Inc.) antibodies at
room temperature for 1 h, followed by incubation with horseradish
peroxidase-conjugated secondary antibodies (1:4,000; OriGene
Technologies, Inc.; cat. no. ZDR-5307, goat anti-mouse IgG/HRP and
cat. no. ZDR-5306, goat anti-rabbit IgG/HRP) at room temperature
for 1 h. Enhanced chemiluminescence reagent (Merck KGaA) was used
to detect the signal on the membrane (Beijing Transgen Biotech Co.,
Ltd.).
Luciferase reporter assay
293T cells were transfected using
Lipofectamine® 2000 (Invitrogen; Thermo Fisher
Scientific, Inc.) with a constant amount of luciferase (Luc)
reporter (GeneChem Co., Ltd.) constructs containing wild-type HDAC2
3′-untranslated region (3′-UTR) (Luc-HDAC2 3′-UTR) or mutant HDAC2
3′-UTR (Luc-HDAC2 MUT 3′-UTR), Renilla luciferase plasmids,
miR-489-3p mimics and control mimics. At 24 h post-transfection,
cell lysates were prepared and luciferase activities were measured
using a Dual-Luciferase reporter assay system (Promega
Corporation), according to the manufacturer's protocol.
Cell proliferation assay
Proliferation of T24 and 5637 cells was examined
using a Cell Counting kit-8 (CCK-8; Nanjing KeyGen Biotech Co.,
Ltd.). Briefly, the transfected T24 and 5637 cells were seeded into
96-well plates at a density of 1×10³ cells/well. At the
time points 0, 24, 48, 72, 96 and 120 h following seeding, 10 µl of
CCK-8 reagent was added to each well. Cell proliferation values
were determined according to the manufacturer's protocol.
Experiments were performed in triplicate.
Colony formation assay
T24 and 5637 cells were seeded into six-well plates
at a density of 1×10³ cells/well in RPMI 1640 medium
supplemented with 10% heat-inactivated FBS. At 1 week post-seeding,
images were acquired using a light microscope (magnification, ×40).
The number of viable colonies was defined as >50 cells/colony.
Results were quantified using ImageJ 1.51v software (National
Institutes of Health).
Wound healing assay
T24 cells and 5637 cells were seeded into six-well
plates at the density of 6×10⁵/well, maintained at 37°C
overnight, and transfected with miR-489-3p mimics or inhibitors as
aforementioned. When the culture had reached ~90% confluency, the
cell layer was scratched with a sterile plastic tip. The cell layer
was then immediately washed twice with PBS and cultured in
serum-free RPMI 1640 medium at 37°C. At 0 and 12 h time points
following scratch, wound healing was measured. The closure area of
wound was calculated as follows: Migration area
(%)=(A0-A12)/A0×100, where A0 represents the area of initial wound
area and A12 represents the remaining area of wound after 12 h. The
areas were quantified using ImageJ 1.51v software.
Tissue arrays
Human BC tumor tissue arrays (cat. no. BlaU066Su01)
were purchased from Shanghai Outdo Biotech Co., Ltd.. All of the
specimens were collected from 56 patients with BC between January
2007 and February 2011. A total of 11 were lost to follow-up and
were excluded, resulting in 45 patients with urothelial BC
included. The average age of the 45 patients was 70.1 years (age
range, 50–85 years), and comprised 37 men and 8 women. All patients
underwent transurethral bladder tumor resection or radical
cystectomy between May 2007 and January 2011, and the tumor
specimens and adjacent specimens were histologically evaluated by
two pathologists. A total of 10 specimens from this tissue array
had their corresponding normal tissues. Aperio ImageScope software
(version no. v12.3.2.8013; Leica Microsystems, Inc.A) was used
according to the manufacturer's protocol. Immunostained microarrays
were scored by multiplying the intensity (0–3) and extent (0–100)
of staining for each tissue sample, as previously described by
Bollag et al (24). The
expression of miR-489-3p and HDAC2 in BC tumor tissues at different
clinical stages (1, 2, 3 and 4) was examined.
Immunohistochemical staining
(IHC)
Briefly, the tissue array blocks were first dewaxed
in xylene and rehydrated with graded ethanol solution (100, 90, 80
and 70%), incubated with methyl alcohol containing 3% hydrogen
peroxide and immersed in a citrate buffer for antigen retrieval.
IHC staining was performed using Streptavidin-Peroxidase IHC assay
kit (OriGene Technologies, Inc. cat. no. SP-9001). After blocking
with normal goat serum for 15 min at room temperature, the tissue
array blocks were incubated with rabbit anti-HDAC2 monoclonal
antibody (Cell Signaling Technology, Inc.; cat. no. 57156s; 1:50)
at 4°C overnight, then washed with PBS three times for 3 min. After
that the tissue array blocks were incubated with biotin-labeled
goat anti-rabbit secondary antibody at 37°C for 15 min, sections
were washed with PBS three times for 3 min. The tissue array blocks
were incubated with streptavidin-biotinylated-complex/horseradish
peroxidase at 37°C for 15 min, then washed with PBS three times for
3 min. DAB staining was conducted at room temperature for 3 min,
and sections were stained with hematoxylin for 2 min. Then the
tissue array blocks were dehydrated with increasing concentrations
of ethanol (70, 80, 90 and 100%). After being immersed in
dimethylbenzene for 15 min, slides of tissue array blocks was
sealed with neutral resin. Immunostaining was evaluated by two
pathologists using a blind protocol design.
For in situ hybridization (ISH),
formalin-fixed paraffin-embedded tissue array blocks with specimens
were deparaffinized in xylene, rehydrated with graded ethanol
solution (100, 96 and 70%), and digested by proteinase K (5 µg/ml;
Beyotime Institute of Biotechnology; cat. no. ST535) for 2 min at
37°C, then dehydrated by increasing concentrations of ethanol (70,
96 and 100%). Then, the tissue array blocks were incubated with
miR-489-3p-probe solution (Exiqon; Qiagen; cat. no. 612051-360) for
1 h at 50°C. The tissue array blocks were then washed with graded
sodium citrate buffer. After blocking with Roche DIG Wash and Block
Buffer (Roche Diagnostics; cat. no. 11585762001) for 15 min at room
temperature, the tissue array blocks were incubated with
Anti-Digoxigenin-AP, Fab fragments (Roche Diagnostics; Cat. no.
11093274910150U) blocking solution at 4°C overnight. After washing
with TBST, the tissue array blocks were stained with NBT/BCIP
(Vector Laboratories, Inc.; cat. no. SK-5400) and nuclear fast red
dye successively and then sealed with neutral resin. Images were
acquired using Leica Aperio Slide Scanner (Leica Microsystems,
Inc., magnifications, ×50 and ×200).
Statistical analysis
Data are presented as the mean ± standard deviation.
Experiments were performed in triplicate. Student's t-test or
one-way ANOVA with Tukey's multiple comparisons post hoc test were
used to analyze the differences between two groups or multiple
groups, respectively. The expression levels between cancer and
adjacent samples were analysed using Wilcoxon test. Pearson's
correlation analysis was used to determine the correlation between
miR-489-3p and HDAC2 mRNA levels in BC tumor tissues. miR-489-3p
and HDAC2 mRNA levels and their tissue array expression scores were
analyzed using linear regression. Survival curves were calculated
using the Kaplan Meier method and log-rank tests were used to
examine the differences in survival rates between the two groups.
All statistical analyses were performed using SPSS software
(version 20.0; IBM Corp.). P<0.05 was considered to indicate a
statistically significant difference.
Results
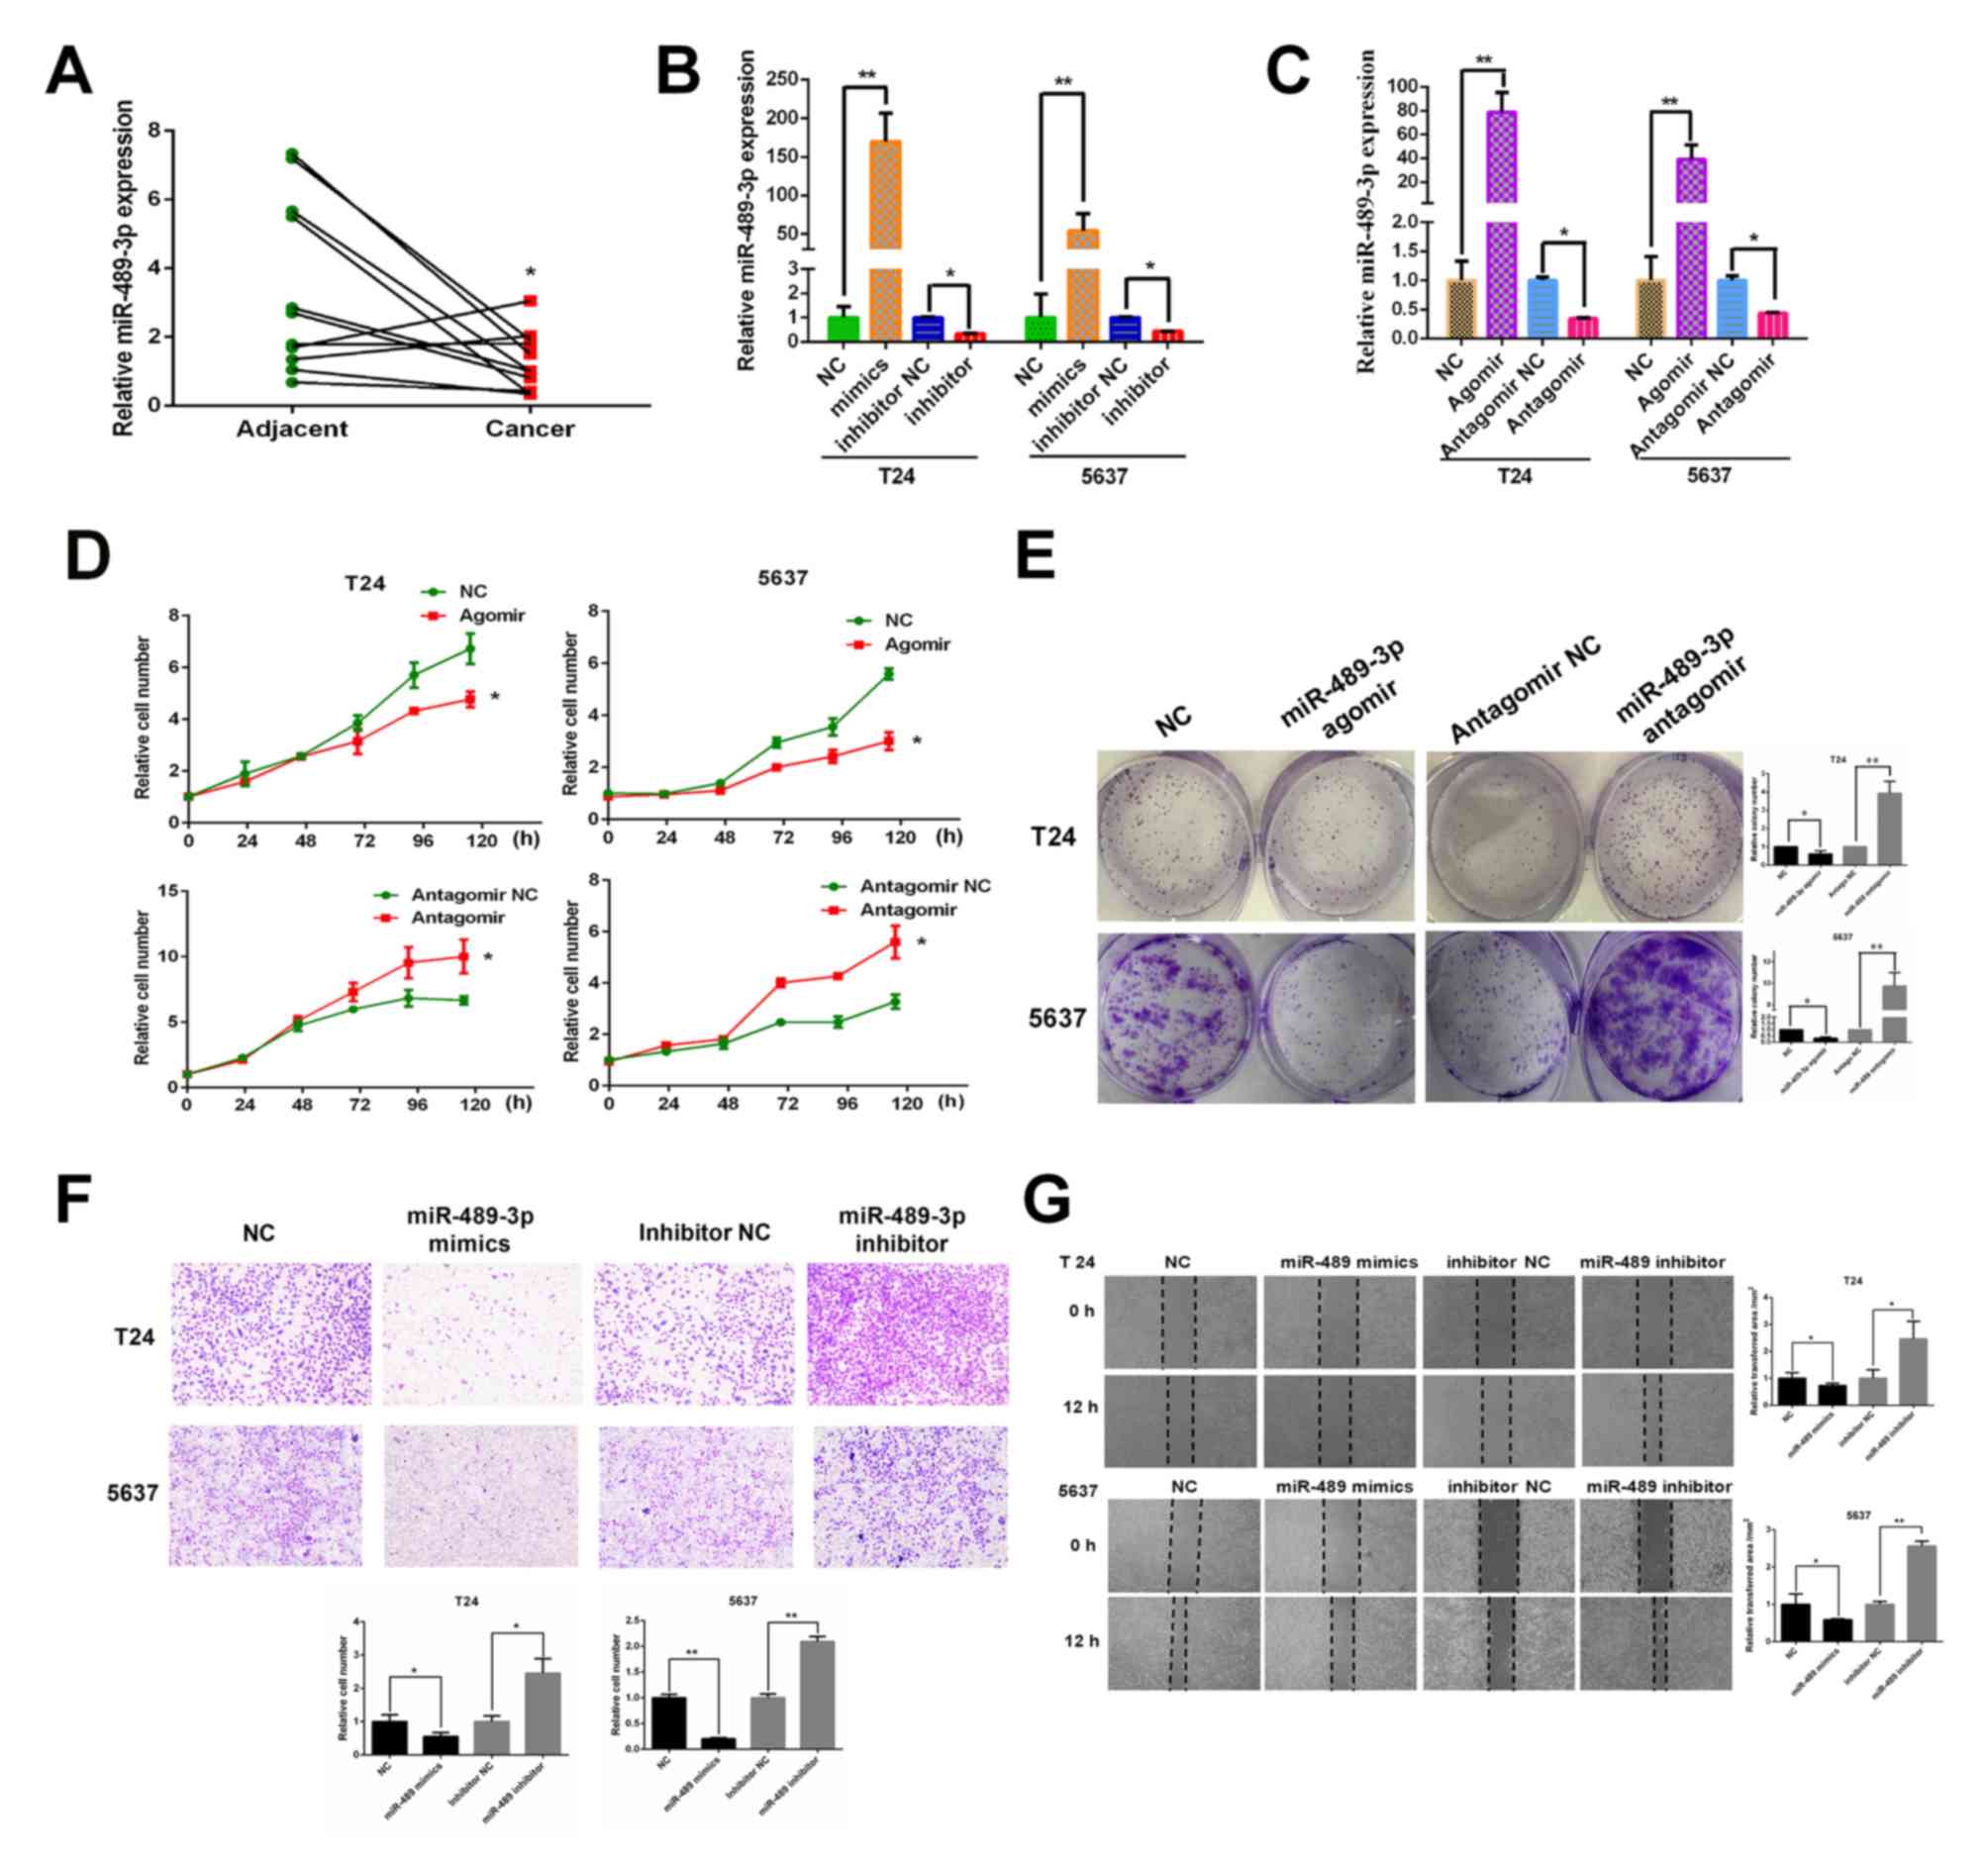
miR-489-3p is significantly
downregulated in BC tumor tissues and attenuates the proliferation
and migration of BC cells
The expression levels of miR-489-3p in 11 BC tumor
tissues and their corresponding normal tissues were measured by
RT-qPCR to determine the potential role of miR-489-3p in the
regulation of human BC. miR-489-3p was expressed at lower levels in
BC tumor tissues compared with corresponding adjacent normal
tissues, indicating that miR-489-3p may exhibit anti-tumor
capabilities against BC (Fig. 1A).
To further investigate this, T24 and 5637 cells were transfected
with miR-489-3p mimics/agomirs or inhibitors/antagomirs. At 48 h
post-transfection, miR-489-3p expression levels were determined by
RT-qPCR. miR-489-3p expression levels were significantly increased
in T24 cells transfected with miR-489 mimics/agomirs and
significantly decreased in cells transfected with miR-489-3p
inhibitors/antagomirs compared with their corresponding NCs
(Fig. 1B and C). 5367 cells
exhibited similar results. Following this, the proliferation rates
of the transfected cells were determined. CCK-8 assay demonstrated
that the proliferation rates of T24 and 5637 cells were
significantly reduced by the increased expression of miR-489-3p and
significantly increased by the repression of miR-489-3p compared
with the respective NCs (Fig. 1D).
In accordance with these results, the colony formation assays
revealed that overexpression and repression of miR-489-3p resulted
in a decrease and an increase in the number of viable colonies,
respectively (Fig. 1E) Furthermore,
the effect of miR-489-3p on the migration ability of BC cells was
examined. Transwell assays demonstrated that the migration ability
of T24 and 5637 cells was significantly decreased and increased by
the overexpression and repression of miR-489-3p, respectively
(Fig. 1F). Similar results were
reported by wound healing assays (Fig.
1G). In summary, the results indicated that miR-489-3p may have
a tumor-suppressive role in human BC.
 | Figure 1.miR-489-3p is expressed at lower
levels in BC tissues and attenuates the proliferation and migration
ability of BC cells. (A) Lower expression levels of miR-489-3p in
BC tissues compared with corresponding normal tissues. A total of
11 pairs of human BC tissues and their corresponding normal tissues
were analyzed for miR-489-3p expression by RT-qPCR. *P<0.05 vs.
adjacent. (B) Overexpression of miR-489-3p mimics in BC cells. T24
and 5637 cells were transfected with NC, miR-489-3p mimics,
inhibitor NC or miR-489-3p inhibitors. At 48 h post-transfection,
RT-qPCR was performed to measure miR-489-3p expression. **P<0.01
vs. NC and *P<0.05 vs. inhibitor NC. (C) RT-qPCR was also
performed to determine the effect of agomirs and antagomirs.
**P<0.01 vs. NC and *P<0.05 vs. antagomir NC. (D)
Proliferation rates of cells post-transfection were examined by
CCK-8 assay at the indicated time points and the results
demonstrated that proliferation rates were reduced by the increased
expression of miR-489-3p. *P<0.05 vs. respective NC group. (E)
At 48 h post-transfection, cells were maintained in medium. At 1
week post-seeding, the numbers of viable colonies were observed.
*P<0.05 and **P<0.01 vs. respective NC group. (F) T24 and
5637 cells were transfected with the indicated mimics or inhibitors
and subjected to Transwell assays. The results demonstrated that
miR-489-3p inhibited the migration ability of BC cells.
Magnification, ×40. *P<0.05 and **P<0.01 vs. respective NC
group. (G) Transfected cells were examined using wound healing
assays. Magnification, ×40. *P<0.05 and **P<0.01 vs. the
respective NC group. miR, microRNA; BC, bladder cancer; RT-qPCR,
reverse transcription-quantitative PCR; NC, negative control. |
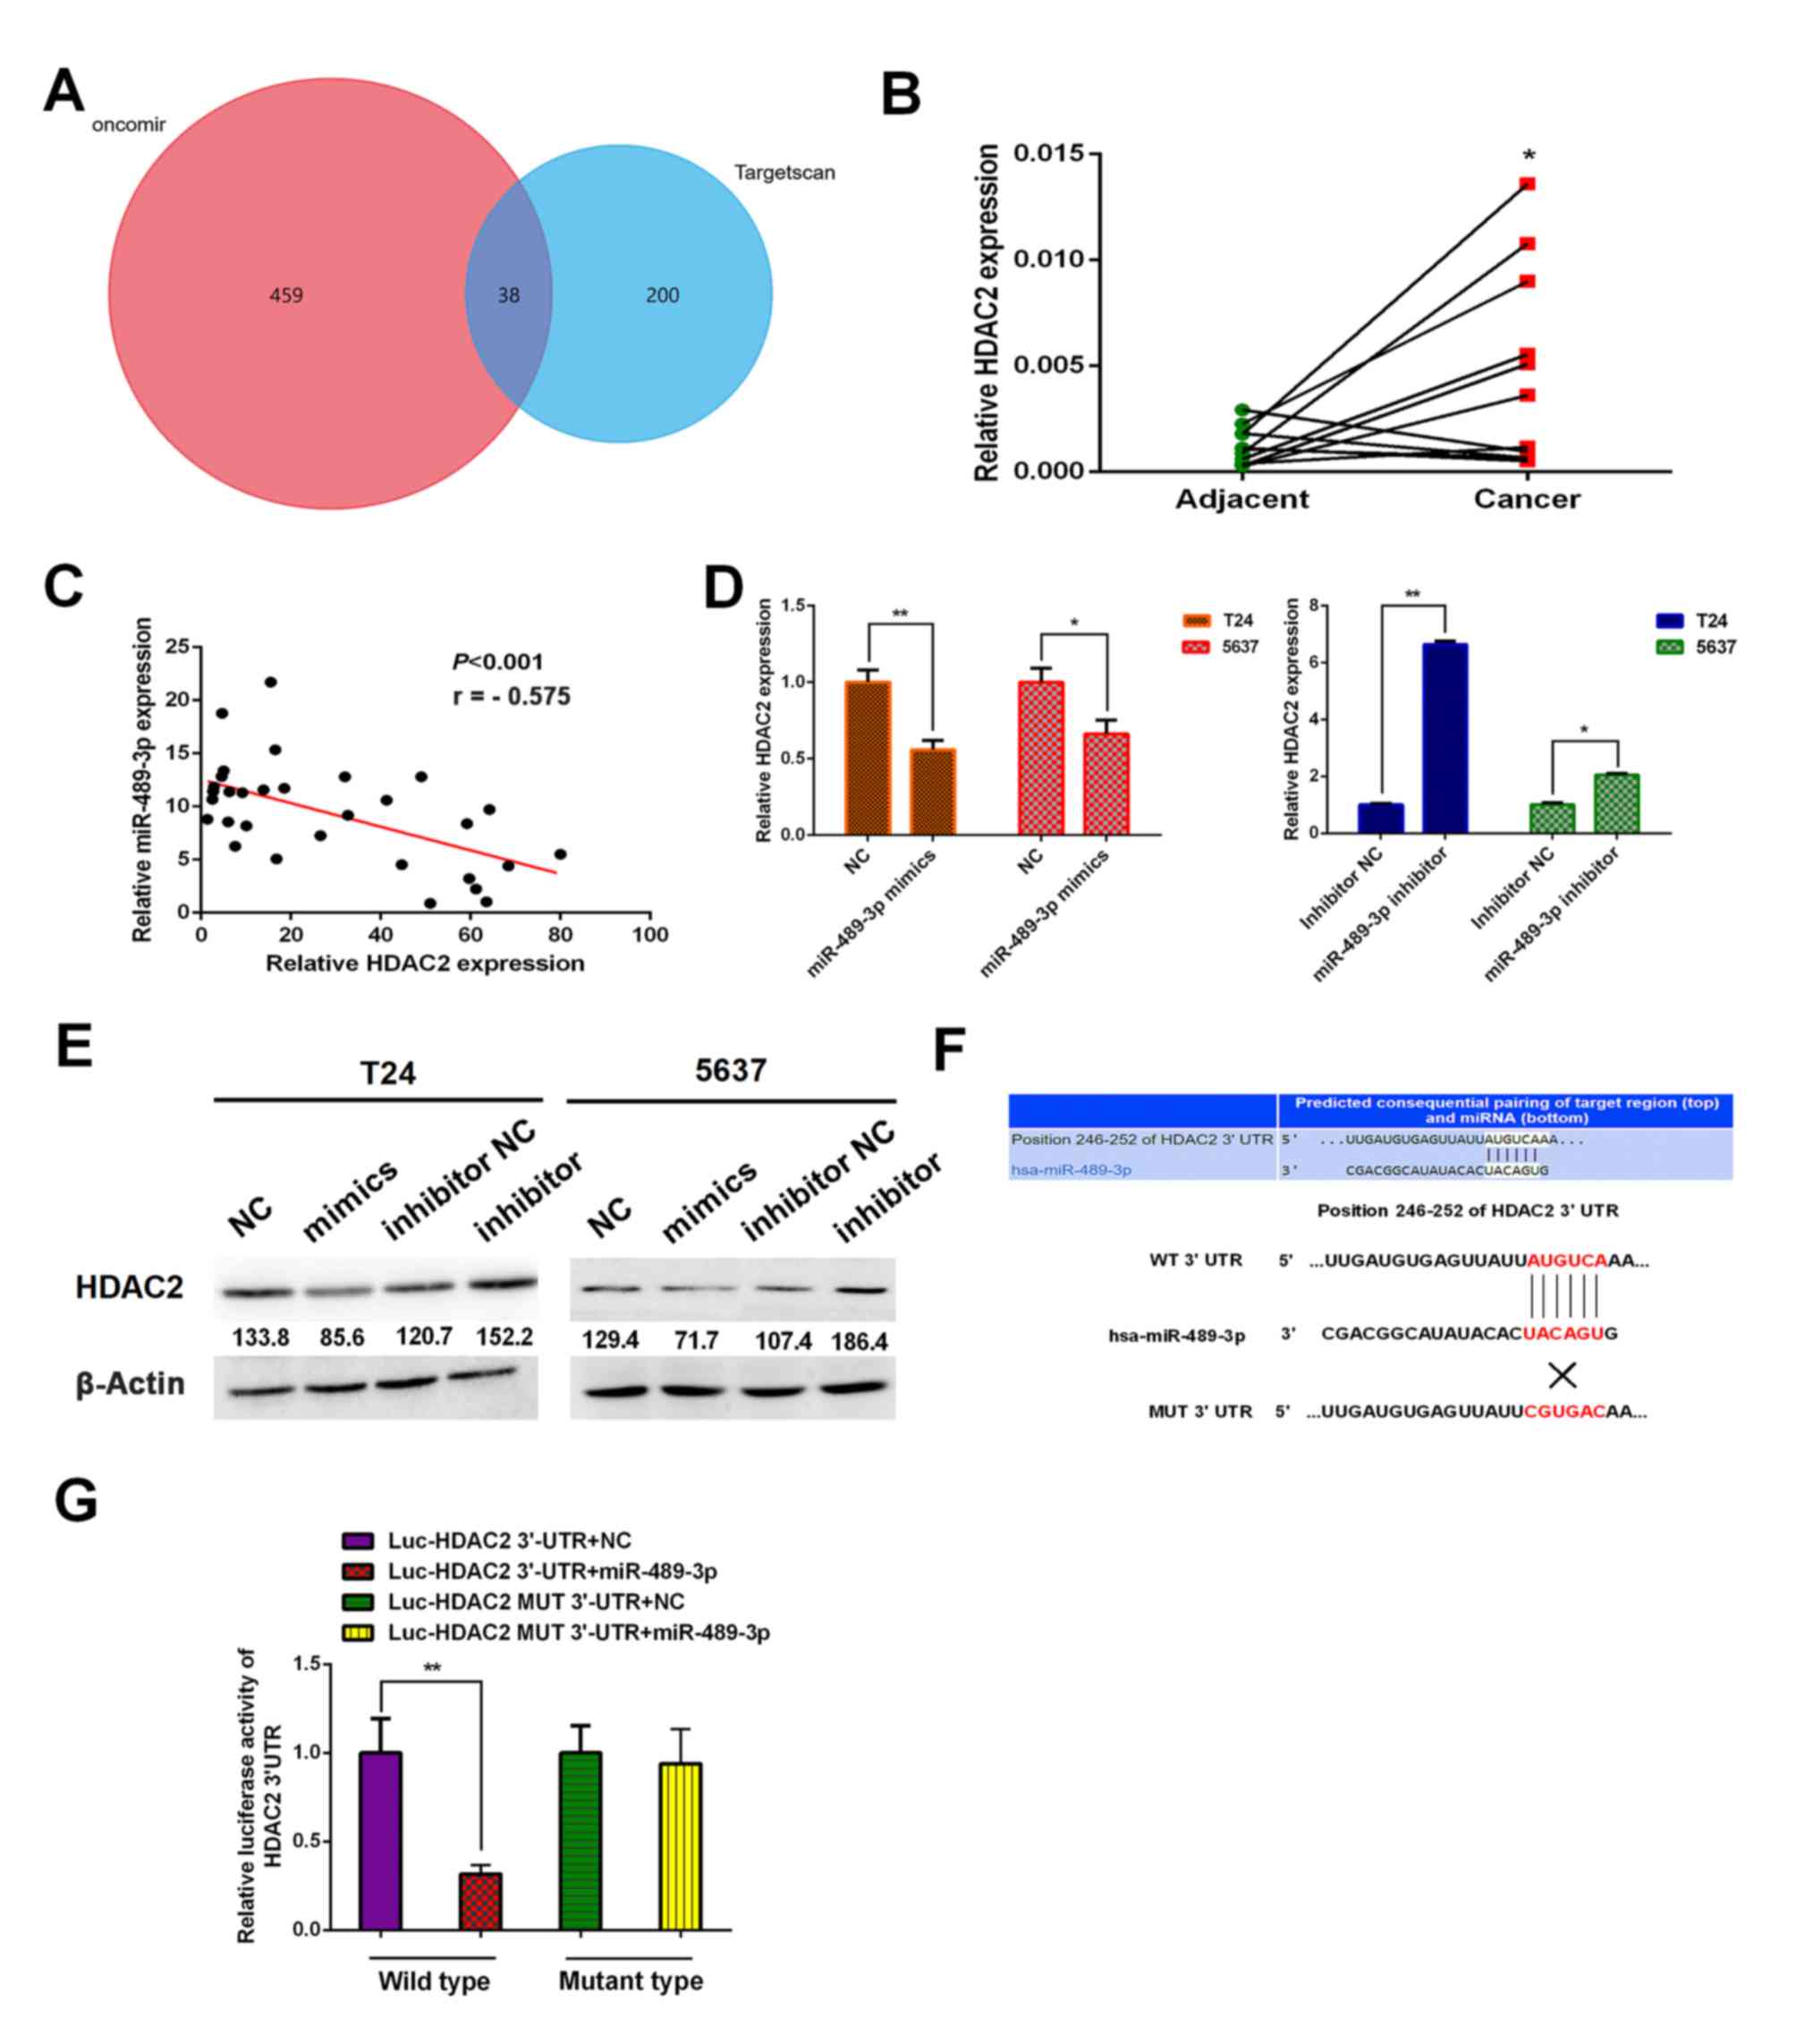
HDAC2 is a direct downstream target of
miR-489-3p
To investigate the underlying molecular mechanism of
miR-489-3p, putative target genes were identified using two
different bioinformatics databases: TargetScan (www.targetscan.org) and Oncomir (www.oncomir.org). The venn diagram was generated by
FunRich software (version 3.1.3). There were 38 overlapping target
genes between TargetScan and Oncomir. The results indicated that
HDAC2 was one of the target genes of miR-489-3p (Fig. 2A). Furthermore, the expression
analysis demonstrated that HDAC2 was significantly upregulated in
BC tumor tissues compared with corresponding normal tissues
(Fig. 2B). The results of Pearson's
correlation analysis demonstrated there was an inverse relationship
between miR-489-3p expression levels and HDAC2 (Fig. 2C). Following this, the possible
effect of miR-489-3p on HDAC2 expression in BC cells was
investigated. T24 and 5637 cells were transfected with miR-489-3p
mimics or inhibitors. The expression levels of HDAC2 were
significantly decreased and increased at the mRNA level in the
presence of mimics and inhibitors, respectively (Fig. 2D). Similar results were obtained at
the protein level (Fig. 2E). Since
HDAC2 3′-UTR contained a putative target site for miR-489-3p
(Fig. 2F), luciferase reporter
vectors Luc-HDAC2 3′-UTR and Luc-HDAC2 MUT 3′-UTR were constructed.
293T cells were transfected with the aforementioned combinations of
vectors and miR-489-3p mimics and the luciferase activities were
measured. miR-489-3p mimics significantly suppressed the luciferase
activity of the Luc-HDAC2 3′-UTR vector; however, the mimics did
not have a significant effect on the Luc-HDAC2 MUT 3′-UTR vector
(Fig. 2G). These results indicated
that HDAC2 may be a direct downstream target of miR-489-3p.
 | Figure 2.Identification of HDAC2 as a direct
target of miR-489-3p in BC cells. (A) Venn diagram demonstrating
the numbers of and overlap of the predicted target genes between
Oncomir and Targetscan. (B) A total of 11 pairs of human BC tissues
and their corresponding adjacent non-cancer ones were analyzed for
HDAC2 by RT-qPCR. The results revealed higher expression levels of
HDAC2 in BC tissues compared with corresponding normal tissues.
*P<0.05 vs. adjacent. (C) Inverse correlation between the
expression levels of miR-489-3p and HDAC2 in BC tissues. Pearson's
correlation analysis was performed to examine the correlation
between the expression levels of miR-489-3p and HDAC2 in BC
tissues. T24 and 5637 cells were transfected with the indicated
microRNAs and at 48 h post-transfection, total RNA and whole cell
lysates were prepared and analyzed by (D) RT-qPCR and (E) western
blotting, respectively. Actin was used as the loading control. The
results demonstrated that miR-489-3p downregulated HDAC2. (F)
3′-UTR of HDAC2 contains a putative miR-489-3p-binding site as
estimated by bioinformatics analysis. The MUT binding sequence is
also presented. (G) 293T cells were co-transfected with miR-489-3p
mimics or with NC together with Luc-HDAC2 3′-UTR or with Luc-HDAC2
MUT 3′-UTR. Luciferase activity was measured 24 h post-transfection
to assess the binding between miR-489-3p and 3′-UTR of HDAC2.
*P<0.05 and **P<0.01. HDAC2, histone deacetylase 2;
miR/miRNA, microRNA; BC, bladder cancer; RT-qPCR, reverse
transcription-quantitative PCR; UTR, untranslated region; NC,
negative control; Luc, luciferase; MUT, mutant; WT, wild-type. |
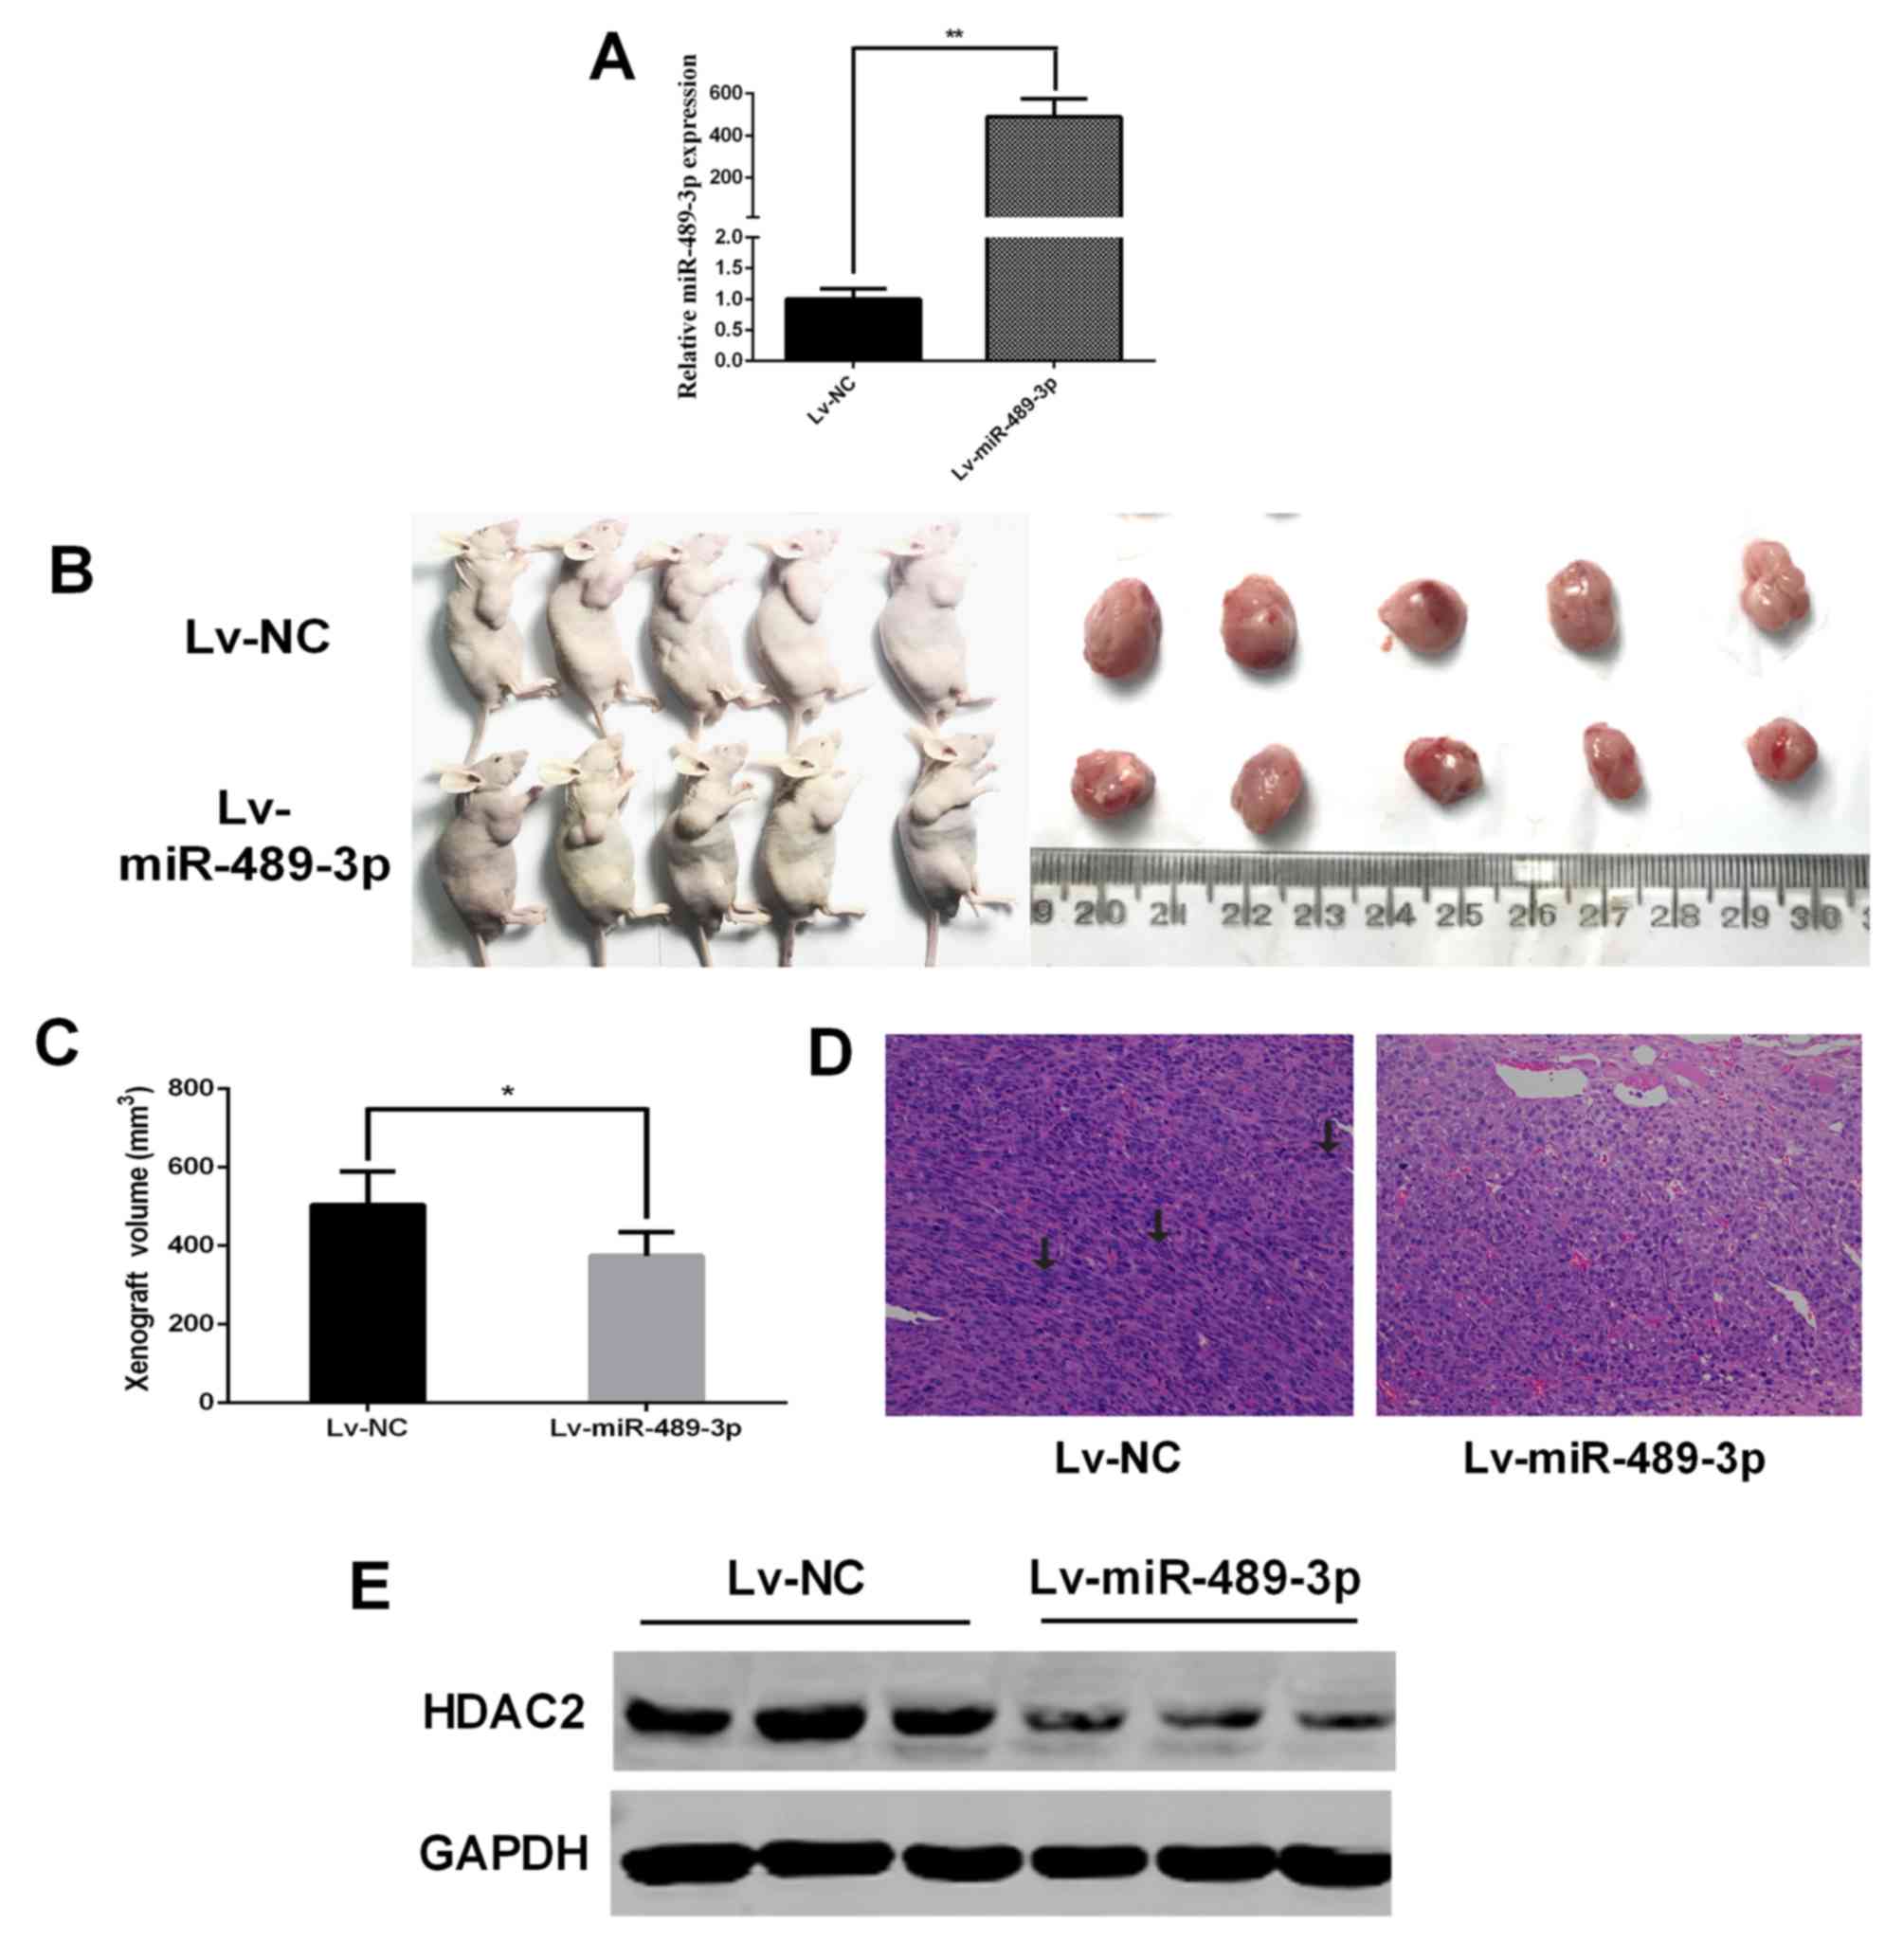
miR-489-3p suppresses the growth of BC
tumors in vivo
In vivo xenograft assays were performed to
further confirm the tumor-suppressive role of miR-489-3p in BC. T24
cells infected with Lv-NC or Lv-miR-489-3p were introduced
subcutaneously into nude mice. RT-qPCR was performed to determine
the expression level of miR-489-3p in the transfected cells
(Fig. 3A). At 28 days
post-injection, a significant decrease in xenograft tumor volumes
was observed in the Lv-miR-489-3p group compared with the Lv-NC
group (Fig. 3B and C). Histochemical
staining demonstrated increased nuclear atypia in the Lv-NC group
compared with the Lv-miR-489-3p group (Fig. 3D). Furthermore, western blotting
revealed marked HDAC2 downregulation in the tumors in the
Lv-miR-489-3p group compared with the Lv-NC group (Fig. 3E). These results indicated that
miR-489-3p attenuates in vivo BC tumor growth through the
downregulation of HDAC2.
Depletion of HDAC2 restores the effect
of miR-489-3p inhibition on BC cells
To further address the functional association
between miR-489-3p and HDAC2 in BC, HDAC2 gene knockdown in T24 and
5637 cells was performed. siRNA-mediated knockdown of HDAC2 was
successful under the experimental conditions (Fig. 4A and B). Following this, the effect
of HDAC2 knockdown on the proliferation rates of T24 and 5637 cells
was examined. CCK-8 assay demonstrated that the depletion of HDAC2
resulted in a significant reduction in the proliferation rates of
both cell lines (Fig. 4C).
Furthermore, Transwell assays revealed that the migration abilities
of T24 and 5637 cells were significantly reduced by HDAC2 silencing
(Fig. 4D). Additionally, T24 cells
were simultaneously transfected with miR-489-3p inhibitor and siRNA
against HDAC2. The results for the wound healing assays
demonstrated that miR-489-3p inhibitor-mediated enhancement of the
migration ability of T24 cells was inhibited by the simultaneous
depletion of HDAC2 (Fig. 4E).
Consistent with these observations, HDAC2 silencing attenuated the
miR-489-3p inhibitor-mediated increase in the proliferation rate of
T24 cells (Fig. 4F). In summary,
these observations indicated that HDAC2, the downstream target of
miR-489-3p, has pro-oncogenic potential in BC.
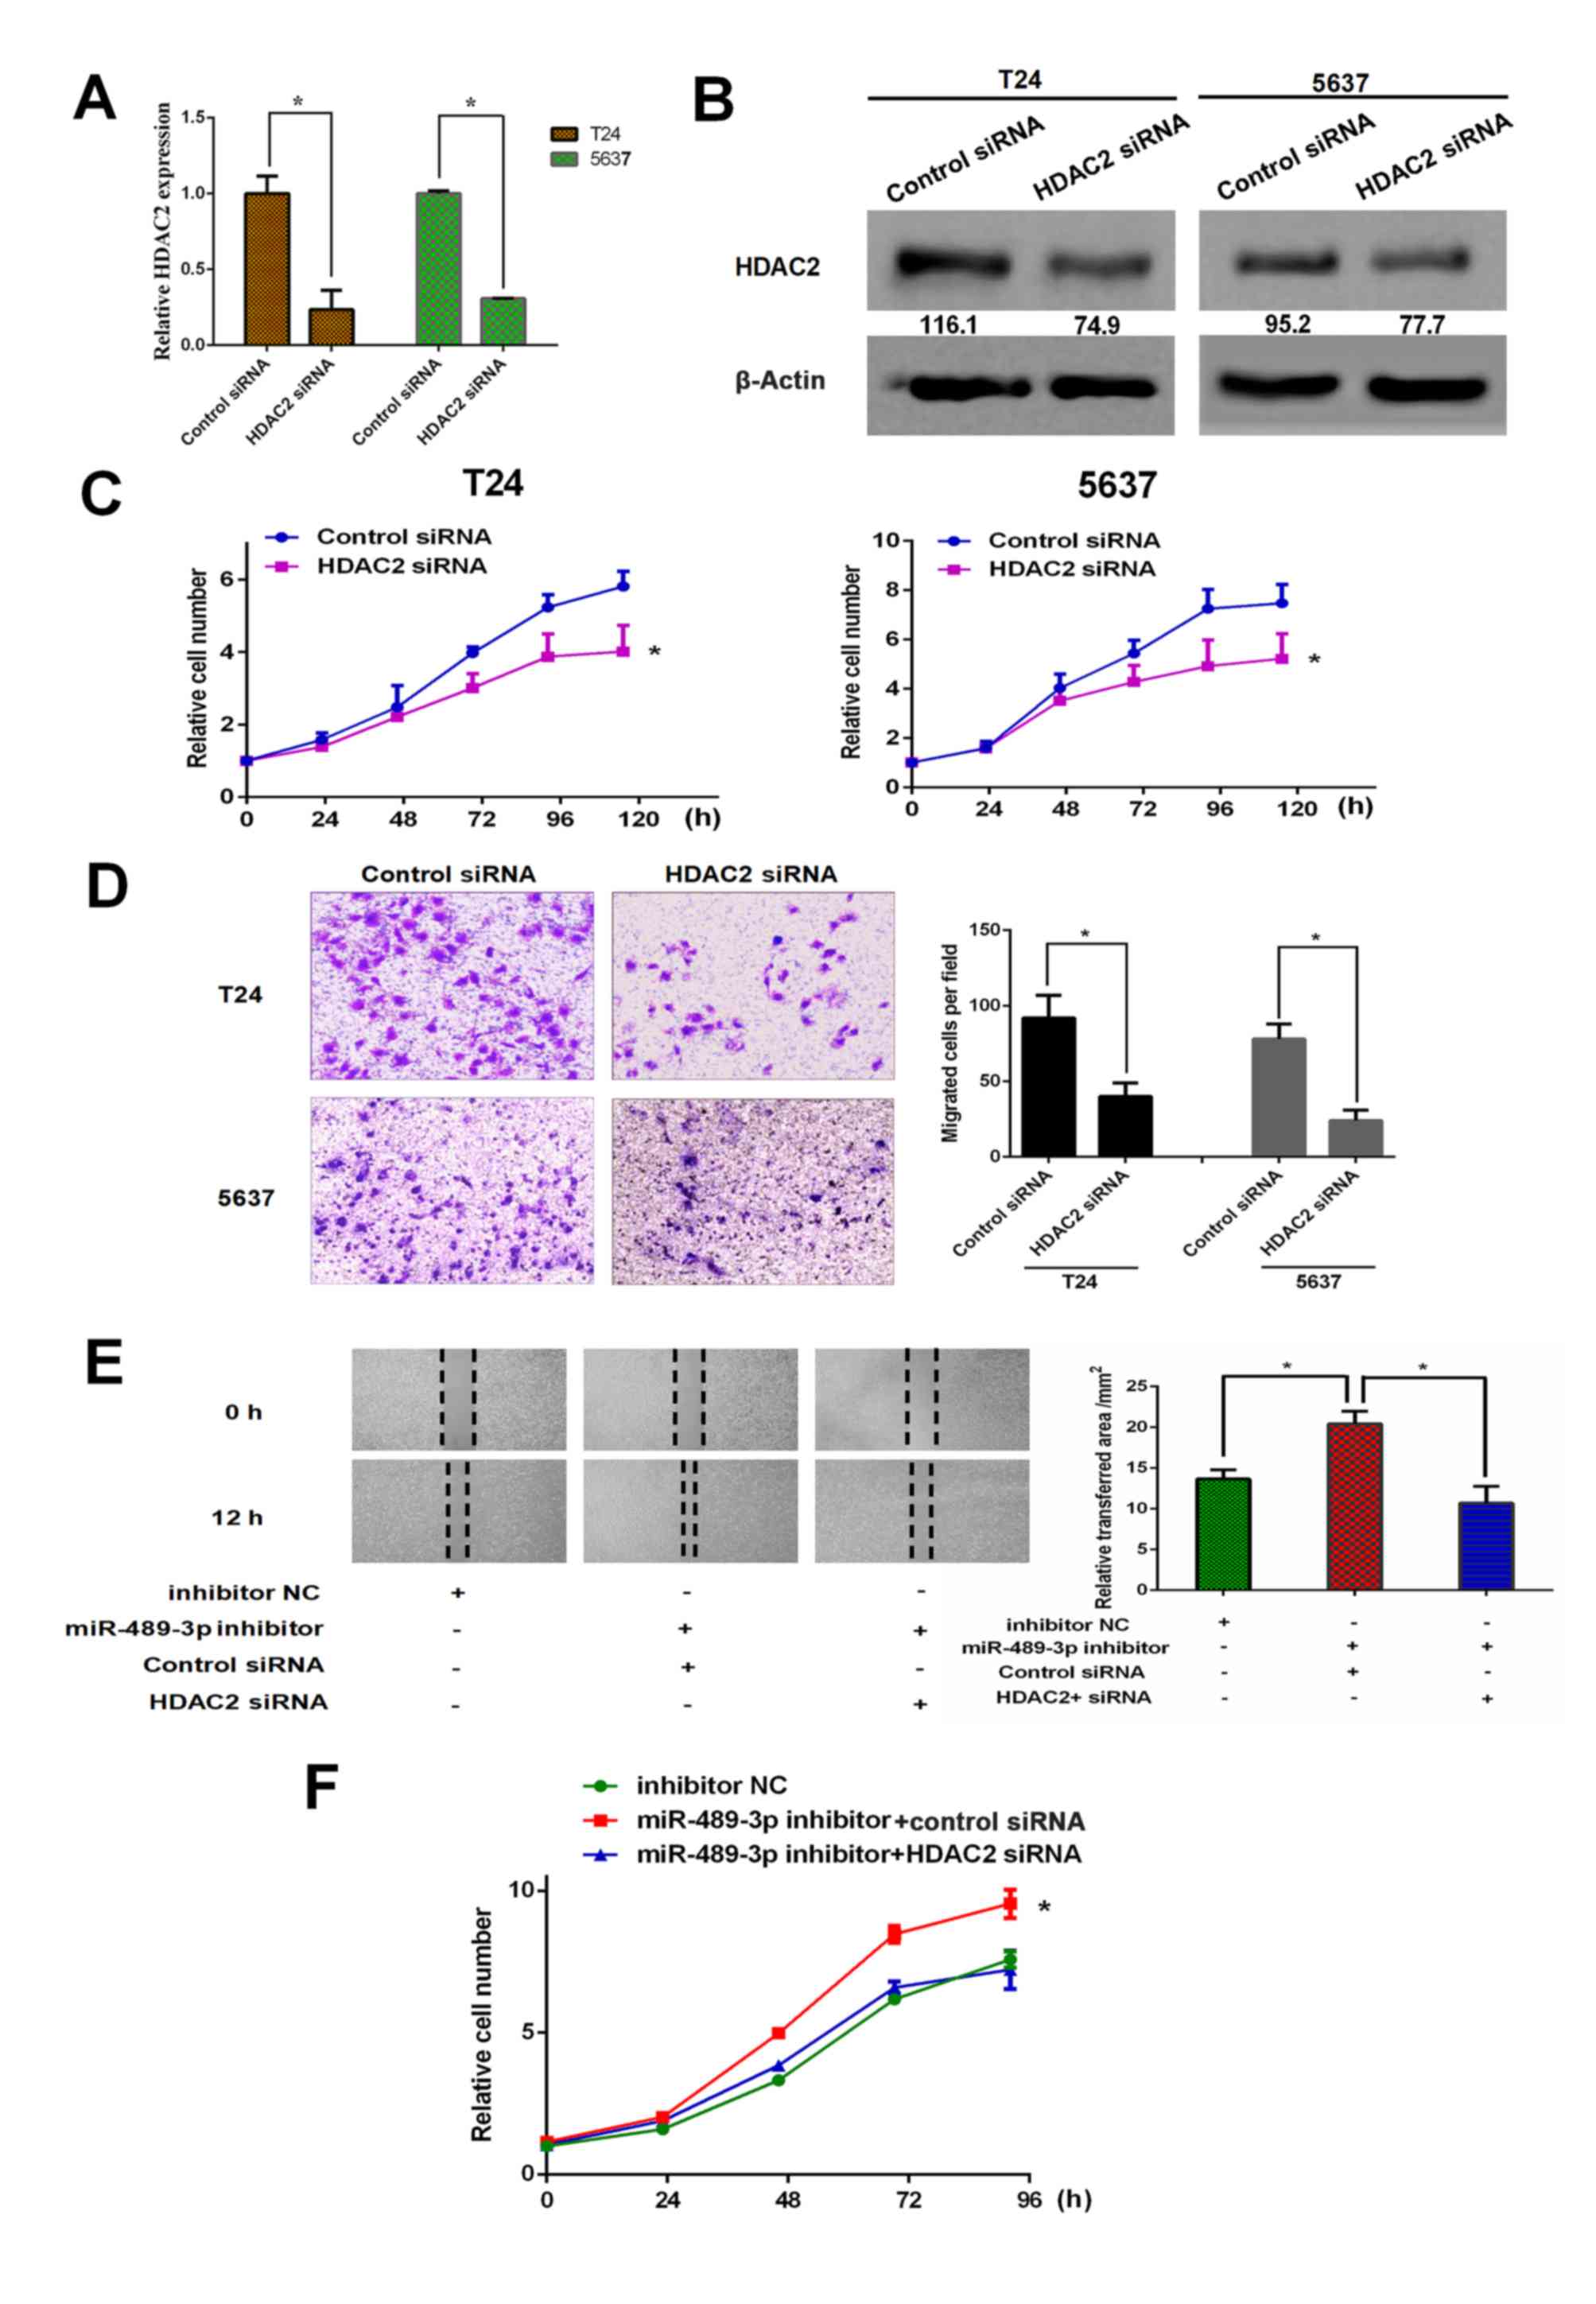 | Figure 4.miR-489-3p inhibition-mediated growth
promotion is attenuated by HDAC2 knockdown in bladder cancer cells.
T24 and 5637 cells were transfected with control siRNA or siRNA
against HDAC2. At 48 h post-transfection, total RNA and whole cell
lysates were prepared and subjected to (A) reverse
transcription-quantitative PCR and (B) western blotting,
respectively. Actin was used as a loading control. *P<0.05. (C)
T24 and 5637 cells were transfected and cell viability was examined
by CCK-8 assays at the indicated time points. *P<0.05 vs.
control siRNA. (D) At 48 h post-transfection, the migration ability
of the indicated cells was examined by Transwell assays.
Representative images were captured and the number of migrated
cells was counted. Magnification, ×100. (E) T24 cells were
transfected and wound healing assays were performed. Relative wound
healing area was calculated. *P<0.05. Magnification, ×40. (F)
T24 cells were transfected as in (E). At the indicated time points
following transfection, cells were processed for CCK-8 assays.
*P<0.05 vs. miR-489-3p inhibitor + HDAC2 siRNA and inhibitor NC.
miR, microRNA; HDAC2, histone deacetylase 2; siRNA, small
interfering RNA; NC, negative control. |
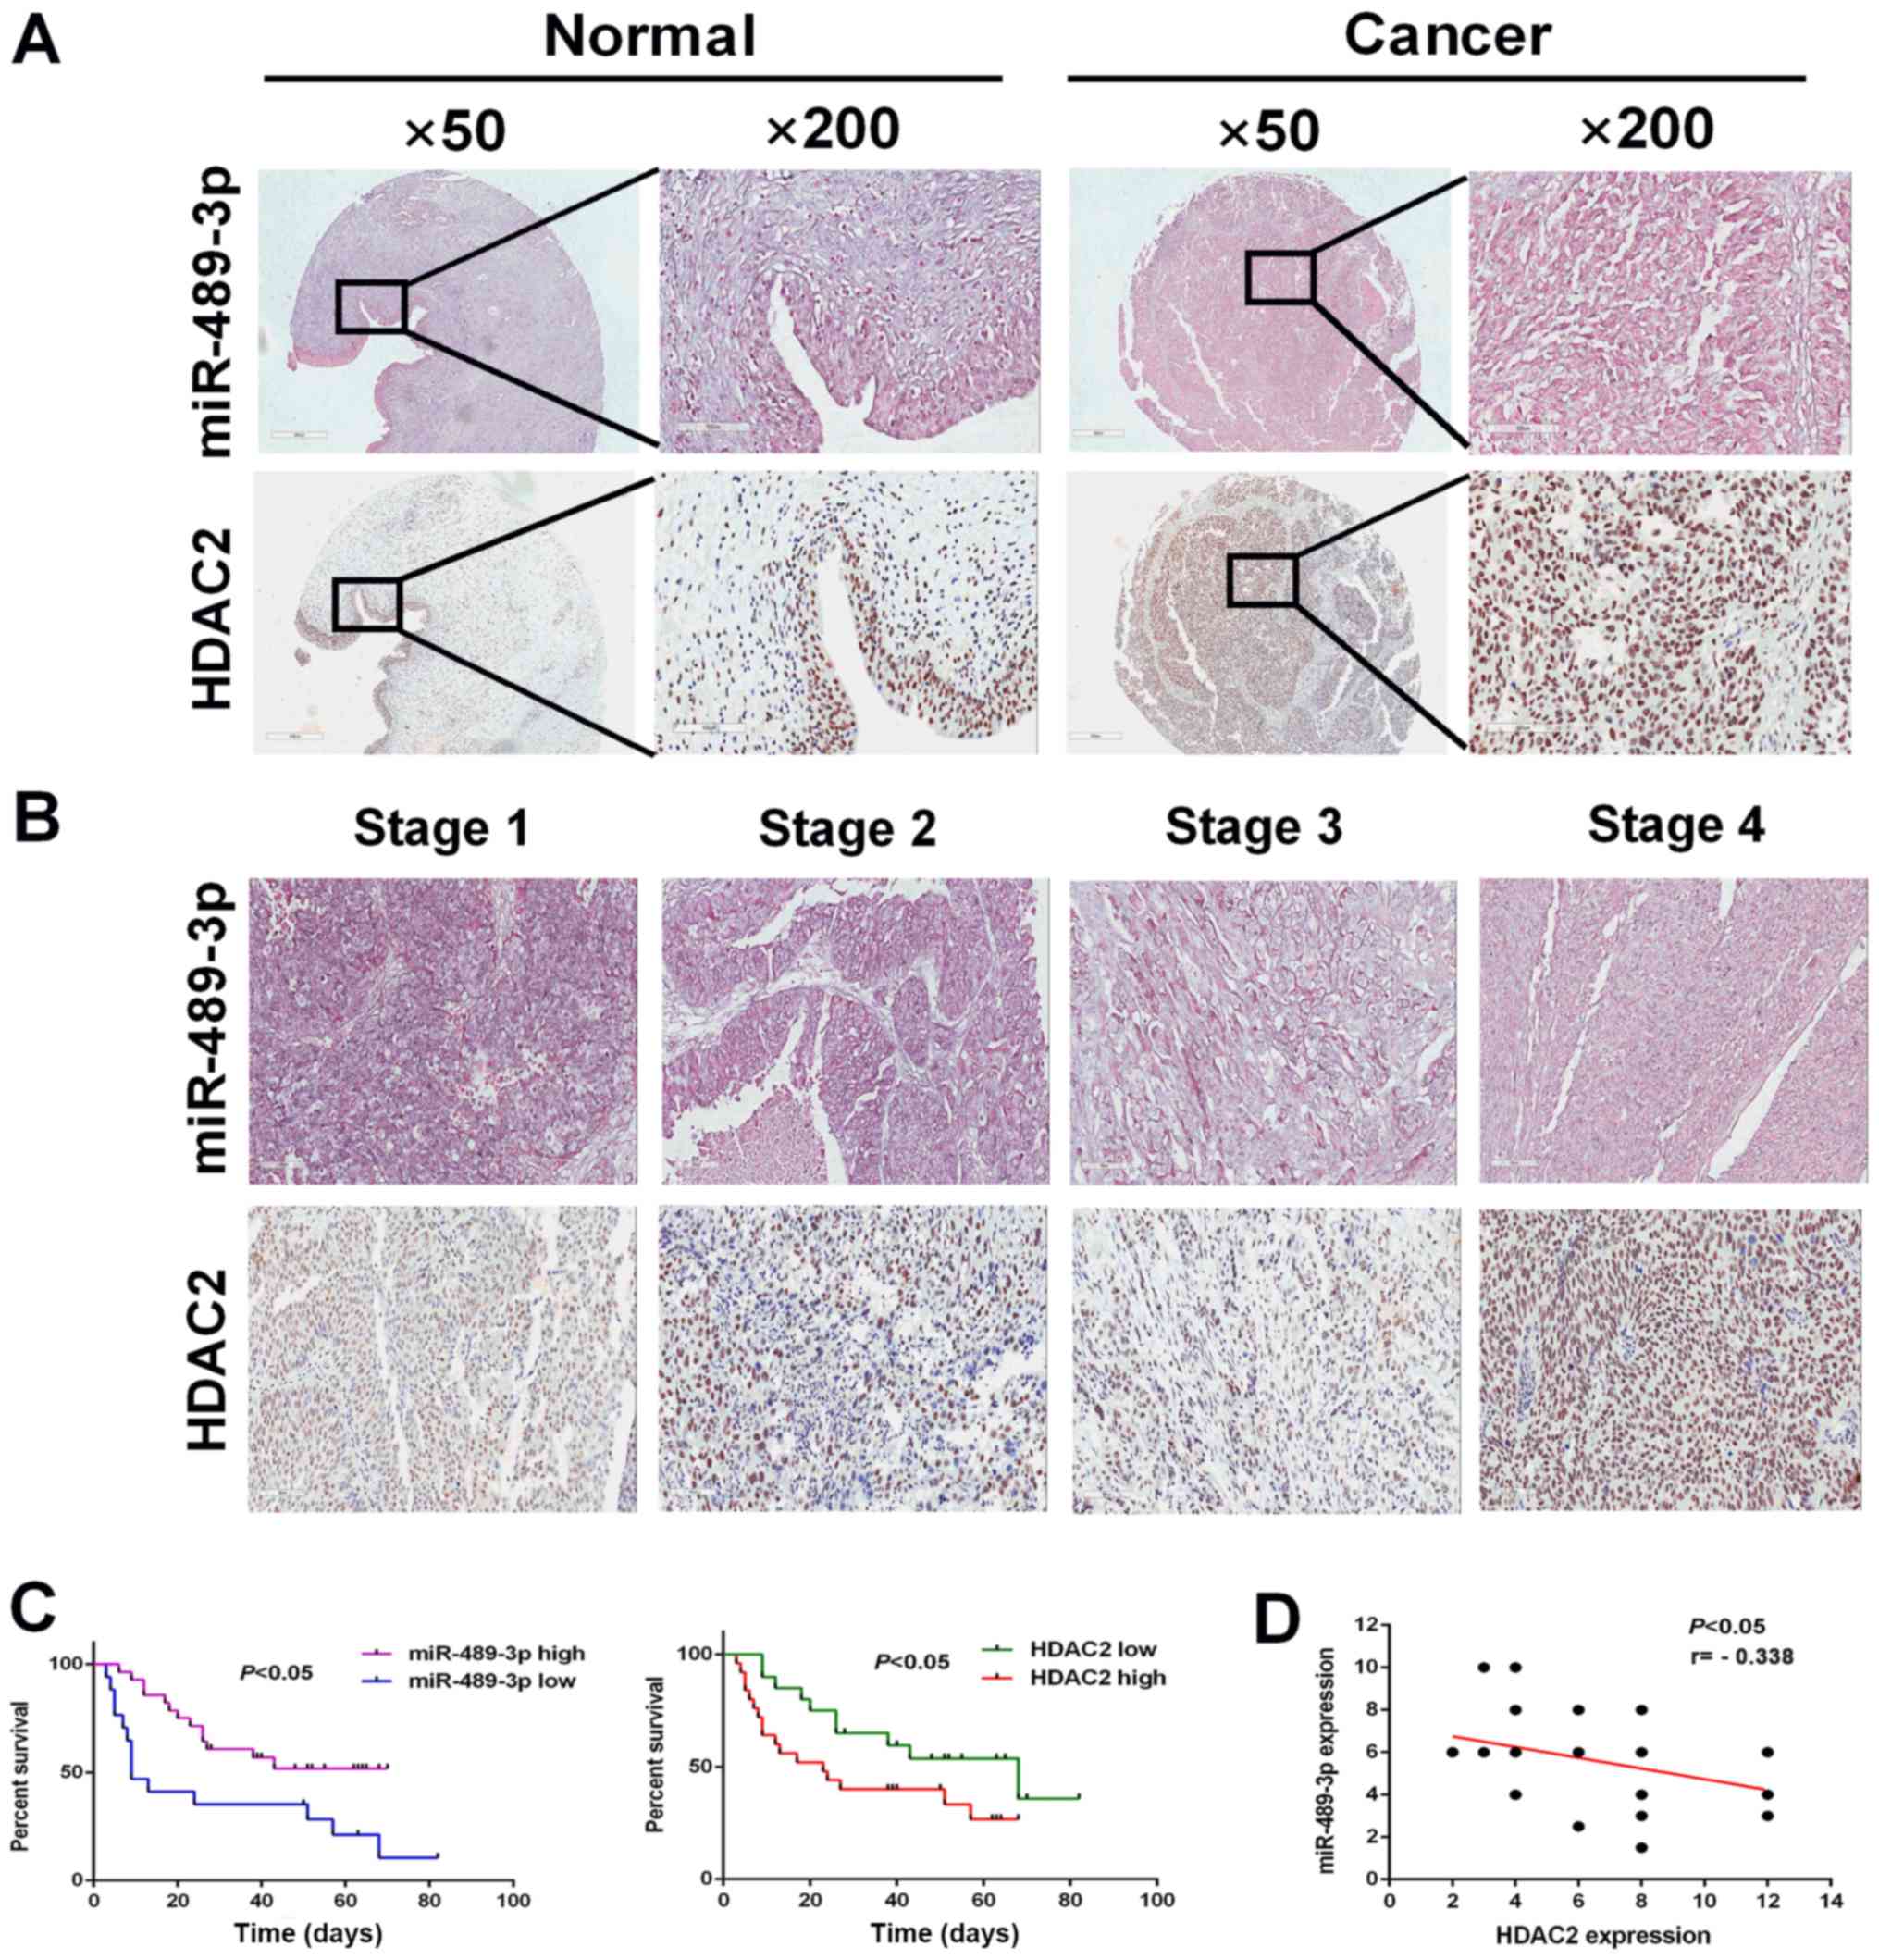
Higher expression levels of miR-489-3p
and HDAC2 are associated with an improved and poor prognosis in
patients with BC, respectively
To investigate the possible clinical impact of
miR-489-3p and HDAC2 on BC, the expression levels of miR-489-3p and
HDAC2 were examined in BC tumor tissues. BC tumor tissues and their
corresponding normal tissues were analyzed for miR-489-3p and HDAC2
by in situ hybridization and IHC staining. miR-489-3p was
expressed at higher level in the corresponding normal tissues
compared with BC tumor tissues (Fig.
5A). Furthermore, BC tumor tissues exhibited higher HDAC
expression compared with the corresponding normal tissues.
Following this, the expression of miR-489-3p and HDAC2 in BC tumor
tissues at different clinical stages (1, 2, 3 and 4) was examined.
The expression levels of miR-489-3p and HDAC2 were decreased and
increased, respectively, in a stage-dependent manner (Fig. 5B). In accordance with these results,
Kaplan-Meier analysis demonstrated that the higher expression
levels of miR-489-3p (expression score ≥180) and HDAC2 (expression
score ≥150) were closely associated with an improved and poor
prognosis, respectively, in patients with BC (Fig. 5C). Additionally, there was an inverse
relationship between the expression levels of miR-489-3p and HDAC2
in BC tumor tissues (Fig. 5D). These
observations indicated that the miR-489-3p/HDAC2 regulatory axis
served a role in the development and/or progression of BC.
Discussion
The results of the current study demonstrated that
there was an inverse relationship between the expression levels of
miR-489-3p and its direct target HDAC2 in BC, and that the
miR-489-3p/HDAC2 axis served a role in the regulation of BC
development and/or progression.
To elucidate the functional role of miR-489-3p in
BC, its expression levels in BC tumor tissues and corresponding
normal tissues were examined. The results revealed that miR-489-3p
was expressed at lower levels in BC tumor tissues compared with the
corresponding normal tissues, which was consistent with previous
observations (25). In addition to
BC, miR-489-3p downregulation has been observed in several types of
cancer, including colon cancer, breast cancer, ovarian cancer, lung
cancer and osteosarcoma, indicating that a decrease in miR-489-3p
expression is not restricted to BC (21,26–29).
Since downregulated miRNAs have been reported in a number of cancer
tissues, they potentially have tumor-suppressive functions
(5). Therefore, it is likely that
miR-489-3p may act as a tumor-suppressor in BC. siRNA-mediated
depletion of miR-489-3p stimulated the proliferation and migration
of BC-derived T24 and 5637 cells. Furthermore, the overexpression
of miR-489-3p in T24 cells attenuated the in vivo xenograft
tumor growth. Similarly, Li et al (25) reported that the overexpression of
miR-489 decreased the proliferation and the invasion rates of
BC-derived T24 and UMUC3 cells. Taken together with previous
observations, the results of the current study indicated that
miR-489-3p exhibits a tumor-suppressive role in BC.
In order to clarify the possible molecular
mechanisms by which miR-489-3p suppresses the malignant properties
of BC, it is crucial to identify its candidate target genes.
Therefore, bioinformatics analysis was performed and HDAC2 was
identified as one of the target genes of miR-489-3p. Accumulating
evidence has indicated that HDAC2 is involved in DNA damage
response, cellular proliferation and apoptosis (30–32). In
addition to these cellular processes, HDAC2 has been reported to
contribute to carcinogenesis (33).
The 3′-UTR of HDAC2 contains a potential target sequence of
miR-489-3p and overexpression of miR-489-3p in BC cells
downregulated HDAC2 expression. However, Li et al (25) demonstrated that jagged canonical
notch ligand 1 (JAG1) may be one of the target genes of miR-489.
Furthermore, it has been demonstrated that JAG1 was expressed at
lower levels in BC tissues compared with corresponding normal
tissues, and that patients with BC and lower levels of JAG1 and
Notch-1 exhibited shorter survival times (34), indicating that JAG1/Notch-1 signaling
pathway may be involved in the suppression of BC. It has been
demonstrated that miR-489 reduced the expression level of JAD1;
however, the underlying mechanism of miR-489-mediated
downregulation of JAG1 in the suppression of BC remains to be
elucidated (25).
In contrast to previous reports regarding JAG1, BC
tissues used in the current study expressed HDAC2 at higher levels
compared with corresponding normal tissues, indicating that there
was an inverse relationship between the expression levels of HDAC2
and miR-489-3p in BC. In addition to BC, the abnormal
overexpression of HDAC2 has been detected in a number of types of
cancer, including gastric cancer, ovarian cancer and breast cancer
(35–37). Therefore, it is likely that the
dysregulated overexpression of HDAC2 is not restricted to BC.
According to the results of the current study, depletion of HDAC2
attenuated the proliferation and migration of BC cells. Moreover,
miR-489-3p overexpression-mediated in vivo xenograft tumor
growth suppression was accompanied by a significant decrease in
HDAC2. These observations indicated that, in contrast to
miR-489-3p, HDAC2 may have an oncogenic role in BC. Consistent with
these results, Niegisch et al (38) reported that the expression level of
HDAC2 was upregulated in BC cells and Pinkerneil et al
(39) demonstrated that the double
knockdown of HDAC1/HDAC2 inhibited the proliferation of BC
cells.
Furthermore, La Noce et al demonstrated that
HDAC2 gene silencing in osteosarcoma-derived cells promoted cancer
stemness and enhanced in vivo xenograft tumor growth
(40). Liu et al (29) reported that miR-489-3p was
downregulated in osteosarcoma cells with a high metastatic
potential and that miR-489-3p depletion in osteosarcoma cells
inhibited metastasis (29).
Therefore, it is possible that the pro-oncogenic function of HDAC2
may be dependent on the type of cancer, whereas the
tumor-suppressive function of miR-489-3p may not be restricted to a
specific cancer type. In addition, it may be hypothesized that
HDAC2 could acquire the tumor-suppressive function observed in
osteosarcoma. Recently, it has been demonstrated that HDAC2 binds
to tumor suppressor p53 and augments its transcriptional activity
in p53-wild-type osteosarcoma cells following DNA damage,
indicating that the tumor-suppressive activity of HDAC2 may be
dependent, at least in part, on p53 (41). Whether the functional conversion of
HDAC2 could be dependent on p53, and whether p53 could directly
regulate the expression of miR-489-3p, will be further
investigated.
The present study demonstrated that HDAC2 may have a
dual role in the regulation of carcinogenesis. HDAC2 acted as an
oncogenic protein and a tumor-suppressor in bladder cancer and
osteosarcoma cells, respectively. How HDAC2 could lose its
anti-oncogenic ability and then acquire pro-oncogenic potential in
bladder cancer cells remains unknown. In conclusion, the results of
the current study indicated that the miR-489-3p/HDAC2 axis is a
potential therapeutic target for patients with BC.
Acknowledgements
Not applicable.
Funding
The current work was supported in part by National
Natural Science Foundation of China (grant nos. 81672523, 81472404,
81472403 and 81572831), 2018 Support Plan for innovative talents in
Colleges and Universities of Liaoning Province, 2018 ‘Million
Talents Project’ funded by the Project of Liaoning Province, 2019
Key R & D projects of Shenyang (grant no. 19-112-4-102) and the
Science and Technology Research Project of Education Department of
Liaoning Province (grant no. LK201616).
Availability of data and materials
The datasets used and/or analyzed during the current
study are available from the corresponding author on reasonable
request.
Authors' contributions
YZ and MY conceived and designed the current study.
DS, TL, HX, JA, JY and JL performed the experiments. TO, XM and BW
contributed to performing the experiments, and analyzed and
interpreted the data. XM and BW revised the manuscript for
important intellectual content. DS, YZ, MY and TO contributed to
writing the manuscript. All authors read and approved the final
manuscript.
Ethics approval and consent to
participate
The present study was approved by the Ethics
Committee of the First Hospital of China Medical University
(Shenyang, China) and written informed consent was obtained from
all patients. The animal study was approved by Institutional Animal
Care and Use Committee of China Medical University (approval no.
2018160).
Patient consent for publication
Not applicable.
Competing interests
The authors declare that they have no conflicts of
interest.
Glossary
Abbreviations
Abbreviations:
|
HDAC2
|
histone deacetylase 2
|
|
BC
|
bladder cancer
|
References
|
1
|
Bray F, Ferlay J, Soerjomataram I, Siegel
RL, Torre LA and Jemal A: Global cancer statistics 2018: GLOBOCAN
estimates of incidence and mortality worldwide for 36 cancers in
185 countries. CA Cancer J Clin. 68:394–424. 2018. View Article : Google Scholar : PubMed/NCBI
|
|
2
|
Enokida H, Yoshino H, Matsushita R and
Nakagawa M: The role of microRNAs in bladder cancer. Investig Clin
Urol. 57 (Suppl 1):S60–S76. 2016. View Article : Google Scholar : PubMed/NCBI
|
|
3
|
Kaufman DS, Shipley WU and Feldman AS:
Bladder cancer. Lancet. 374:239–249. 2009. View Article : Google Scholar : PubMed/NCBI
|
|
4
|
Rose TL and Milowsky MI: Improving
systemic chemotherapy for bladder cancer. Curr Oncol Rep.
18:272016. View Article : Google Scholar : PubMed/NCBI
|
|
5
|
He L and Hannon GJ: MicroRNAs: Small RNAs
with a big role in gene regulation. Nat Rev Genet. 5:522–531. 2004.
View Article : Google Scholar : PubMed/NCBI
|
|
6
|
Filipowicz W, Bhattacharyya SN and
Sonenberg N: Mechanisms of post-transcriptional regulation by
microRNAs: Are the answers in sight? Nat Rev Genet. 9:102–114.
2008. View
Article : Google Scholar : PubMed/NCBI
|
|
7
|
Chen K and Rajewsky N: The evolution of
gene regulation by transcription factors and microRNAs. Nat Rev
Genet. 8:93–103. 2007. View
Article : Google Scholar : PubMed/NCBI
|
|
8
|
Smits M, Nilsson J, Mir SE, van der Stoop
PM, Hulleman E, Niers JM, de Witt Hamer PC, Marquez VE, Cloos J,
Krichevsky AM, et al: miR-101 is down-regulated in glioblastoma
resulting in EZH2-induced proliferation, migration, and
angiogenesis. Oncotarget. 1:710–720. 2010. View Article : Google Scholar : PubMed/NCBI
|
|
9
|
Malizia AP and Wang DZ: MicroRNAs in
cardiomyocyte development. Wiley Interdiscip Rev Syst Biol Med.
3:183–190. 2011. View
Article : Google Scholar : PubMed/NCBI
|
|
10
|
Taft RJ, Pang KC, Mercer TR, Dinger M and
Mattick JS: Non-coding RNAs: Regulators of disease. J Pathol.
220:126–139. 2010. View Article : Google Scholar : PubMed/NCBI
|
|
11
|
van Schooneveld E, Wildiers H, Vergote I,
Vermeulen PB, Dirix LY and Van Laere SJ: Dysregulation of microRNAs
in breast cancer and their potential role as prognostic and
predictive biomarkers in patient management. Breast Cancer Res.
17:212015. View Article : Google Scholar : PubMed/NCBI
|
|
12
|
Cheng L, Yang T, Kuang Y, Kong B, Yu S,
Shu H, Zhou H and Gu J: MicroRNA-23a promotes neuroblastoma cell
metastasis by targeting CDH1. Oncol Lett. 7:839–845. 2014.
View Article : Google Scholar : PubMed/NCBI
|
|
13
|
Pan Y, Li J, Zhang Y, Wang N, Liang H, Liu
Y, Zhang CY, Zen K and Gu H: Slug-upregulated miR-221 promotes
breast cancer progression through suppressing E-cadherin
expression. Sci Rep. 6:257982016. View Article : Google Scholar : PubMed/NCBI
|
|
14
|
Liang Z, Li X, Liu S, Li C, Wang X and
Xing J: MiR-141-3p inhibits cell proliferation, migration and
invasion by targeting TRAF5 in colorectal cancer. Biochem Biophys
Res Commun. 514:699–705. 2019. View Article : Google Scholar : PubMed/NCBI
|
|
15
|
Schoolmeesters A, Eklund T, Leake D,
Vermeulen A, Smith Q, Force Aldred S and Fedorov Y: Functional
profiling reveals critical role for miRNA in differentiation of
human mesenchymal stem cells. PLoS One. 4:e56052009. View Article : Google Scholar : PubMed/NCBI
|
|
16
|
Cheung TH, Quach NL, Charville GW, Liu L,
Park L, Edalati A, Yoo B, Hoang P and Rando TA: Maintenance of
muscle stem-cell quiescence by microRNA-489. Nature. 482:524–528.
2012. View Article : Google Scholar : PubMed/NCBI
|
|
17
|
Dang X, Ma A, Yang L, Hu H, Zhu B, Shang
D, Chen T and Luo Y: MicroRNA-26a regulates tumorigenic properties
of EZH2 in human lung carcinoma cells. Cancer Genet. 205:113–123.
2012. View Article : Google Scholar : PubMed/NCBI
|
|
18
|
Mayr C, Hemann MT and Bartel DP:
Disrupting the pairing between let-7 and Hmga2 enhances oncogenic
transformation. Science. 315:1576–1579. 2007. View Article : Google Scholar : PubMed/NCBI
|
|
19
|
Zhang B, Ji S, Ma F, Ma Q, Lu X and Chen
X: miR-489 acts as a tumor suppressor in human gastric cancer by
targeting PROX1. Am J Cancer Res. 6:2021–2030. 2016.PubMed/NCBI
|
|
20
|
Yuan P, He XH, Rong YF, Cao J, Li Y, Hu
YP, Liu Y, Li D, Lou W and Liu MF: KRAS/NF-κB/YY1/miR-489 signaling
axis controls pancreatic cancer metastasis. Cancer Res. 77:100–111.
2017. View Article : Google Scholar : PubMed/NCBI
|
|
21
|
Gao S, Liu H, Hou S, Wu L, Yang Z, Shen J,
Zhou L, Zheng SS and Jiang B: miR-489 suppresses tumor growth and
invasion by targeting HDAC7 in colorectal cancer. Clin Transl
Oncol. 20:703–712. 2018. View Article : Google Scholar : PubMed/NCBI
|
|
22
|
Cui X, Kong C, Zhu Y, Zeng Y, Zhang Z, Liu
X, Zhan B, Piao C and Jiang Z: miR-130b, an onco-miRNA in bladder
cancer, is directly regulated by NF-κB and sustains NF-κB
activation by decreasing cylindromatosis expression. Oncotarget.
7:48547–48561. 2016. View Article : Google Scholar : PubMed/NCBI
|
|
23
|
Livak KJ and Schmittgen TD: Analysis of
relative gene expression data using real-time quantitative PCR and
the 2(-Delta Delta C(T)) method. Methods. 25:402–408. 2001.
View Article : Google Scholar : PubMed/NCBI
|
|
24
|
Bollag G, Hirth P, Tsai J, Zhang J,
Ibrahim PN, Cho H, Spevak W, Zhang C, Zhang Y, Habets G, et al:
Clinical efficacy of a RAF inhibitor needs broad target blockade in
BRAF-mutant melanoma. Nature. 467:596–599. 2010. View Article : Google Scholar : PubMed/NCBI
|
|
25
|
Li J, Qu W, Jiang Y, Sun Y, Cheng Y, Zou T
and Du S: miR-489 suppresses proliferation and invasion of human
bladder cancer cells. Oncol Res. 24:391–398. 2016. View Article : Google Scholar : PubMed/NCBI
|
|
26
|
Soni M, Patel Y, Markoutsa E, Jie C, Liu
S, Xu P and Chen H: Autophagy, cell viability, and chemoresistance
are regulated by miR-489 in breast cancer. Mol Cancer Res.
16:1348–1360. 2018. View Article : Google Scholar : PubMed/NCBI
|
|
27
|
Wu H, Xiao Z, Zhang H, Wang K, Liu W and
Hao Q: MiR-489 modulates cisplatin resistance in human ovarian
cancer cells by targeting Akt3. Anticancer Drugs. 25:799–809. 2014.
View Article : Google Scholar : PubMed/NCBI
|
|
28
|
Xie Z, Cai L, Li R, Zheng J, Wu H, Yang X,
Li H and Wang Z: Down-regulation of miR-489 contributes into NSCLC
cell invasion through targeting SUZ12. Tumour Biol. 36:6497–6505.
2015. View Article : Google Scholar : PubMed/NCBI
|
|
29
|
Liu Q, Yang G and Qian Y: Loss of
MicroRNA-489-3p promotes osteosarcoma metastasis by activating
PAX3-MET pathway. Mol Carcinog. 56:1312–1321. 2017. View Article : Google Scholar : PubMed/NCBI
|
|
30
|
Thurn KT, Thomas S, Raha P, Qureshi I and
Munster PN: Histone deacetylase regulation of ATM-mediated DNA
damage signaling. Mol Cancer Ther. 12:2078–2087. 2013. View Article : Google Scholar : PubMed/NCBI
|
|
31
|
Tang W, Zhou W, Xiang L, Wu X, Zhang P,
Wang J, Liu G, Zhang W, Peng Y, Huang X, et al: The
p300/YY1/miR-500a-5p/HDAC2 signalling axis regulates cell
proliferation in human colorectal cancer. Nat Commun. 10:6632019.
View Article : Google Scholar : PubMed/NCBI
|
|
32
|
Li S, Wang F, Qu Y, Chen X, Gao M, Yang J,
Zhang D, Zhang N, Li W and Liu H: HDAC2 regulates cell
proliferation, cell cycle progression and cell apoptosis in
esophageal squamous cell carcinoma EC9706 cells. Oncol Lett.
13:403–409. 2017. View Article : Google Scholar : PubMed/NCBI
|
|
33
|
Krämer OH: HDAC2: A critical factor in
health and disease. Trends Pharmacol Sci. 30:647–655. 2009.
View Article : Google Scholar : PubMed/NCBI
|
|
34
|
Shi TP, Xu H, Wei JF, Ai X, Ma X, Wang BJ,
Ju ZH, Zhang GX, Wang C, Wu ZQ and Zhang X: Association of low
expression of notch-1 and jagged-1 in human papillary bladder
cancer and shorter survival. J Urol. 180:361–366. 2008. View Article : Google Scholar : PubMed/NCBI
|
|
35
|
Orenay-Boyacioglu S, Kasap E, Gerceker E,
Yuceyar H, Demirci U, Bilgic F and Korkmaz M: Expression profiles
of histone modification genes in gastric cancer progression. Mol
Biol Rep. 45:2275–2282. 2018. View Article : Google Scholar : PubMed/NCBI
|
|
36
|
Jin KL, Pak JH, Park JY, Choi WH, Lee JY,
Kim JH and Nam JH: Expression profile of histone deacetylases 1, 2
and 3 in ovarian cancer tissues. J Gynecol Oncol. 19:185–190. 2008.
View Article : Google Scholar : PubMed/NCBI
|
|
37
|
Shan W, Jiang Y, Yu H, Huang Q, Liu L, Guo
X, Li L, Mi Q, Zhang K and Yang Z: HDAC2 overexpression correlates
with aggressive clinicopathological features and DNA-damage
response pathway of breast cancer. Am J Cancer Res. 7:1213–1226.
2017.PubMed/NCBI
|
|
38
|
Niegisch G, Knievel J, Koch A, Hader C,
Fischer U, Albers P and Schulz WA: Changes in histone deacetylase
(HDAC) expression patterns and activity of HDAC inhibitors in
urothelial cancers. Urol Oncol. 31:1770–1779. 2013. View Article : Google Scholar : PubMed/NCBI
|
|
39
|
Pinkerneil M, Hoffmann MJ, Deenen R,
Köhrer K, Arent T, Schulz WA and Niegisch G: Inhibition of class I
histone deacetylases 1 and 2 promotes urothelial carcinoma cell
death by various mechanisms. Mol Cancer Ther. 15:299–312. 2016.
View Article : Google Scholar : PubMed/NCBI
|
|
40
|
La Noce M, Paino F, Mele L, Papaccio G,
Regad T, Lombardi A, Papaccio F, Desiderio V and Tirino V: HDAC2
depletion promotes osteosarcoma's stemness both in vitro and in
vivo: A study on a putative new target for CSCs directed therapy. J
Exp Clin Cancer Res. 37:2962018. View Article : Google Scholar : PubMed/NCBI
|
|
41
|
Sun D, Yu M, Li Y, Xing H, Gao Y, Huang Z,
Hao W, Lu K, Kong C, Shimozato O, et al: Histone deacetylase 2 is
involved in DNA damage-mediated cell death of human osteosarcoma
cells through stimulation of the ATM/p53 pathway. FEBS Open Bio.
9:478–489. 2019. View Article : Google Scholar : PubMed/NCBI
|