Introduction
Hepatocellular carcinoma (HCC) is currently the
third leading cause of cancer-associated mortality globally (8.2%
in 2018) (1). The major cause of HCC
is hepatitis B virus (HBV) or (HCV) infection (2), 73.4% of HCC cases are caused by virus
(HCV) and HBV infections (3).
Metabolic stress or viral infections lead to liver damage,
resulting in conditions, such as chronic hepatitis and cirrhosis
with deposited connective tissue, which are premalignant conditions
for HCC (4). To improve the
prediction of hepatocarcinogenesis, a number of studies are
applying molecular profiling. In a previous study, Iizuka et
al (5) evaluated gene expression
in hepatitis B virus-positive and hepatitis C virus-positive HCCs
(HBV- and HCV-HCCs) for an association with liver cirrhosis (LC),
by using oligonucleotide microarray data of 45 hepatocellular
carcinoma (HCC) samples. In another study, Ye et al
(6) predicted hepatitis B
virus-positive metastatic hepatocellular carcinomas using gene
expression profiling.
To improve patient outcomes in HCC, it is important
to understand the genetic features that influence the HCC
phenotypes. The notable progress that has been made in next
generation sequencing technology has enabled the evaluation of the
interaction of multiple genes in all types of cancer (7–10).
Numerous novel mutations have been identified in genes, such as
janus kinase 1 (11), interferon
regulatory factor 2 (12) and
AT-rich interaction domain 1A (10).
Genome-wide transcriptome analysis has demonstrated that the
upregulation of cluster of differentiation-36 in HepG2.2.15 cells
contributes to the metabolism and life-cycle of HBV (13). Weighted-gene co-expression network
analysis identified several hub genes, such as spexin hormone, α
fetoprotein and adhesion G protein-coupled receptor E1 (14). Despite the identification of several
HCC-associated genes, the association between gene expression and
HCC prognosis has not yet been fully elucidated.
In the present study, a bioinformatics analysis was
performed using HCC gene expression profiling data and The Cancer
Genome Atlas (TCGA) HCC RNA sequencing (RNA-Seq) cohort. The study
aimed to identify differentially expressed genes (DEGs) from these
datasets in order to identify potential biomarkers by constructing
protein-protein interaction (PPI) networks, and to verify and
investigate these in vitro.
Materials and methods
RNA-Seq datasets of HCC
The FASTQ-formatted files of the RNA-Seq GSE63863
dataset (15) were downloaded from
the Gene Expression Omnibus database (http://www.ncbi.nlm.nih.gov/geo/). The dataset was
based on the Illumina 2000 platform and included 11 human primary
HCC ith hepatitis B and matched adjacent non-tumor liver tissues
(3-cm away from the tumor).
RNA-Seq data analysis
TopHat v2.0.9 (16)
was used to align and process raw sequencing readswith UCSC hg19
(https://genome.ucsc.edu). Bowtie v0.12.8
algorithm (17) was incorporated
with TopHat to perform this alignment. Subsequently, Cufflinks
v2.2.1 (18) was used to analyze the
aligned read files. Normalized RNA-Seq fragment counts were used to
assess the abundance of transcripts. The unit of measurement was
fragments per kilobase of exon per million fragments mapped (FPKM).
The Bayesian inference method was used to calculate the confidence
intervals for FPKM. After Cufflinks was used to assemble the read
sequences, the output GTF files and the reference GTF annotation
file, which was downloaded from the Ensembl database (http://www.ensembl.org/info/data/ftp/index.html)
[Homo sapiens (H. sapiens); GRCh 37.55.gt], were
imported into Cuffcompare v2.0.9 (http://cole-trapnell-lab.github.io/cufflinks/cuffcompare/).
A combined GTF file was produced using Cuffcompare, which was later
imported into Cuffdiff v2.0.9 (http://cole-trapnell-lab.github.io/cufflinks/cuffdiff/),
together with the BAM documents generated by TopHat. Subsequently,
the differentially expressed genes (DEGs) from Cuffdiff were
screened with the FDR<0.05 and fold change (FC)>1 criteria
and visualized using the CummeRbund program v2.30.0 (https://www.bioconductor.org/packages/release/bioc/html/cummeRbund.html).
All programs were used with the default parameters.
Gene Ontology (GO) and pathway
enrichment analysis
Functional annotation clustering of all genes that
were up- or downregulated in the 11 liver cancer and matched
non-tumor samples with a false discovery rate (FDR)<0.05 was
performed using the DAVID v6.8 software tool (https://david.ncifcrf.gov/) (19). Annotations from the GO resource
(20) and the Kyoto Encyclopedia of
Genes and Genomes (KEGG) (21) were
used to measure the level of enrichment.
PPI network and module analysis
ClusterOne is a platform used to detect potential
overlapping protein complexes in a High-quality INTeractomes (HINT;
http://hint.yulab.org) database (22). ClusterOne (v1.0) covers 18,864
proteins from H. sapiens. To assess the interactive
associations between DEGs, these were mapped using ClusterOne, and
the plug-in module in ClusterOne was performed for the ‘s’ (minimum
size) and ‘d’ (minimum cluster density) parameters. The default
parameters were s=4 and d=0.1.
Survival analysis
OncoLnc is a tool used to interactively explore
survival associations (23).
Additionally, this tool allows the clinical data to be downloaded,
coupled with the expression data. The tool stores the data of 8,467
patients collected from 21 cancer studies conducted by TCGA,
including the RNA-Seq expression profiling data of TCGA HCC cohort
(n=360), 50 HCC and 50 matched adjacent non-tumor liver samples
were included. The 360 cases were ordered according to the relative
expression of the key genes from high to low. The expression of
eight key genes (RNF41, SMYD3, ABAT, GHR, SLC22A3, FCGR2B, CYP4F2
and FCGR2C) were divided into four parts, with cut-off values
defining ‘high’ as expression above the upper quartile (n=90) and
‘low’ as expression below the lower quartile (n=90). The remaining
180 cases were excluded from the analysis. The Kaplan-Meier method
was used to generate the survival curves and the log-rank test was
used to examine the significance. In cases where late-stage
crossover of survival curves occurred, the two-stage test method
was applied (24). According to this
method, separate log-rank tests were used to compare the curves
before and after the late-stage crossover event, generating two
P-values. For each separate P-value before and after crossover,
P<0.05 indicated significant differences in survival for that
phase of the study. Expression levels of the six key genes
(SMYD3, ABAT, CYP4F2, SLC22A3, RNF41 and GHR) in 50
HCC and 50 matched adjacent non-tumor liver samples were compared
separately, paired t-tests were used to examine the significance.
The protein expression levels of the six key genes (SMYD3, ABAT,
CYP4F2, SLC22A3, RNF41 and GHR) were analyzed in clinical specimens
(Fig. 3C) from the Human Protein
Atlas (www.proteinatlas.org) (25), all images in Fig. 3C were from the Human Protein Atlas.
P<0.05 was considered to indicate a statistically significant
difference.
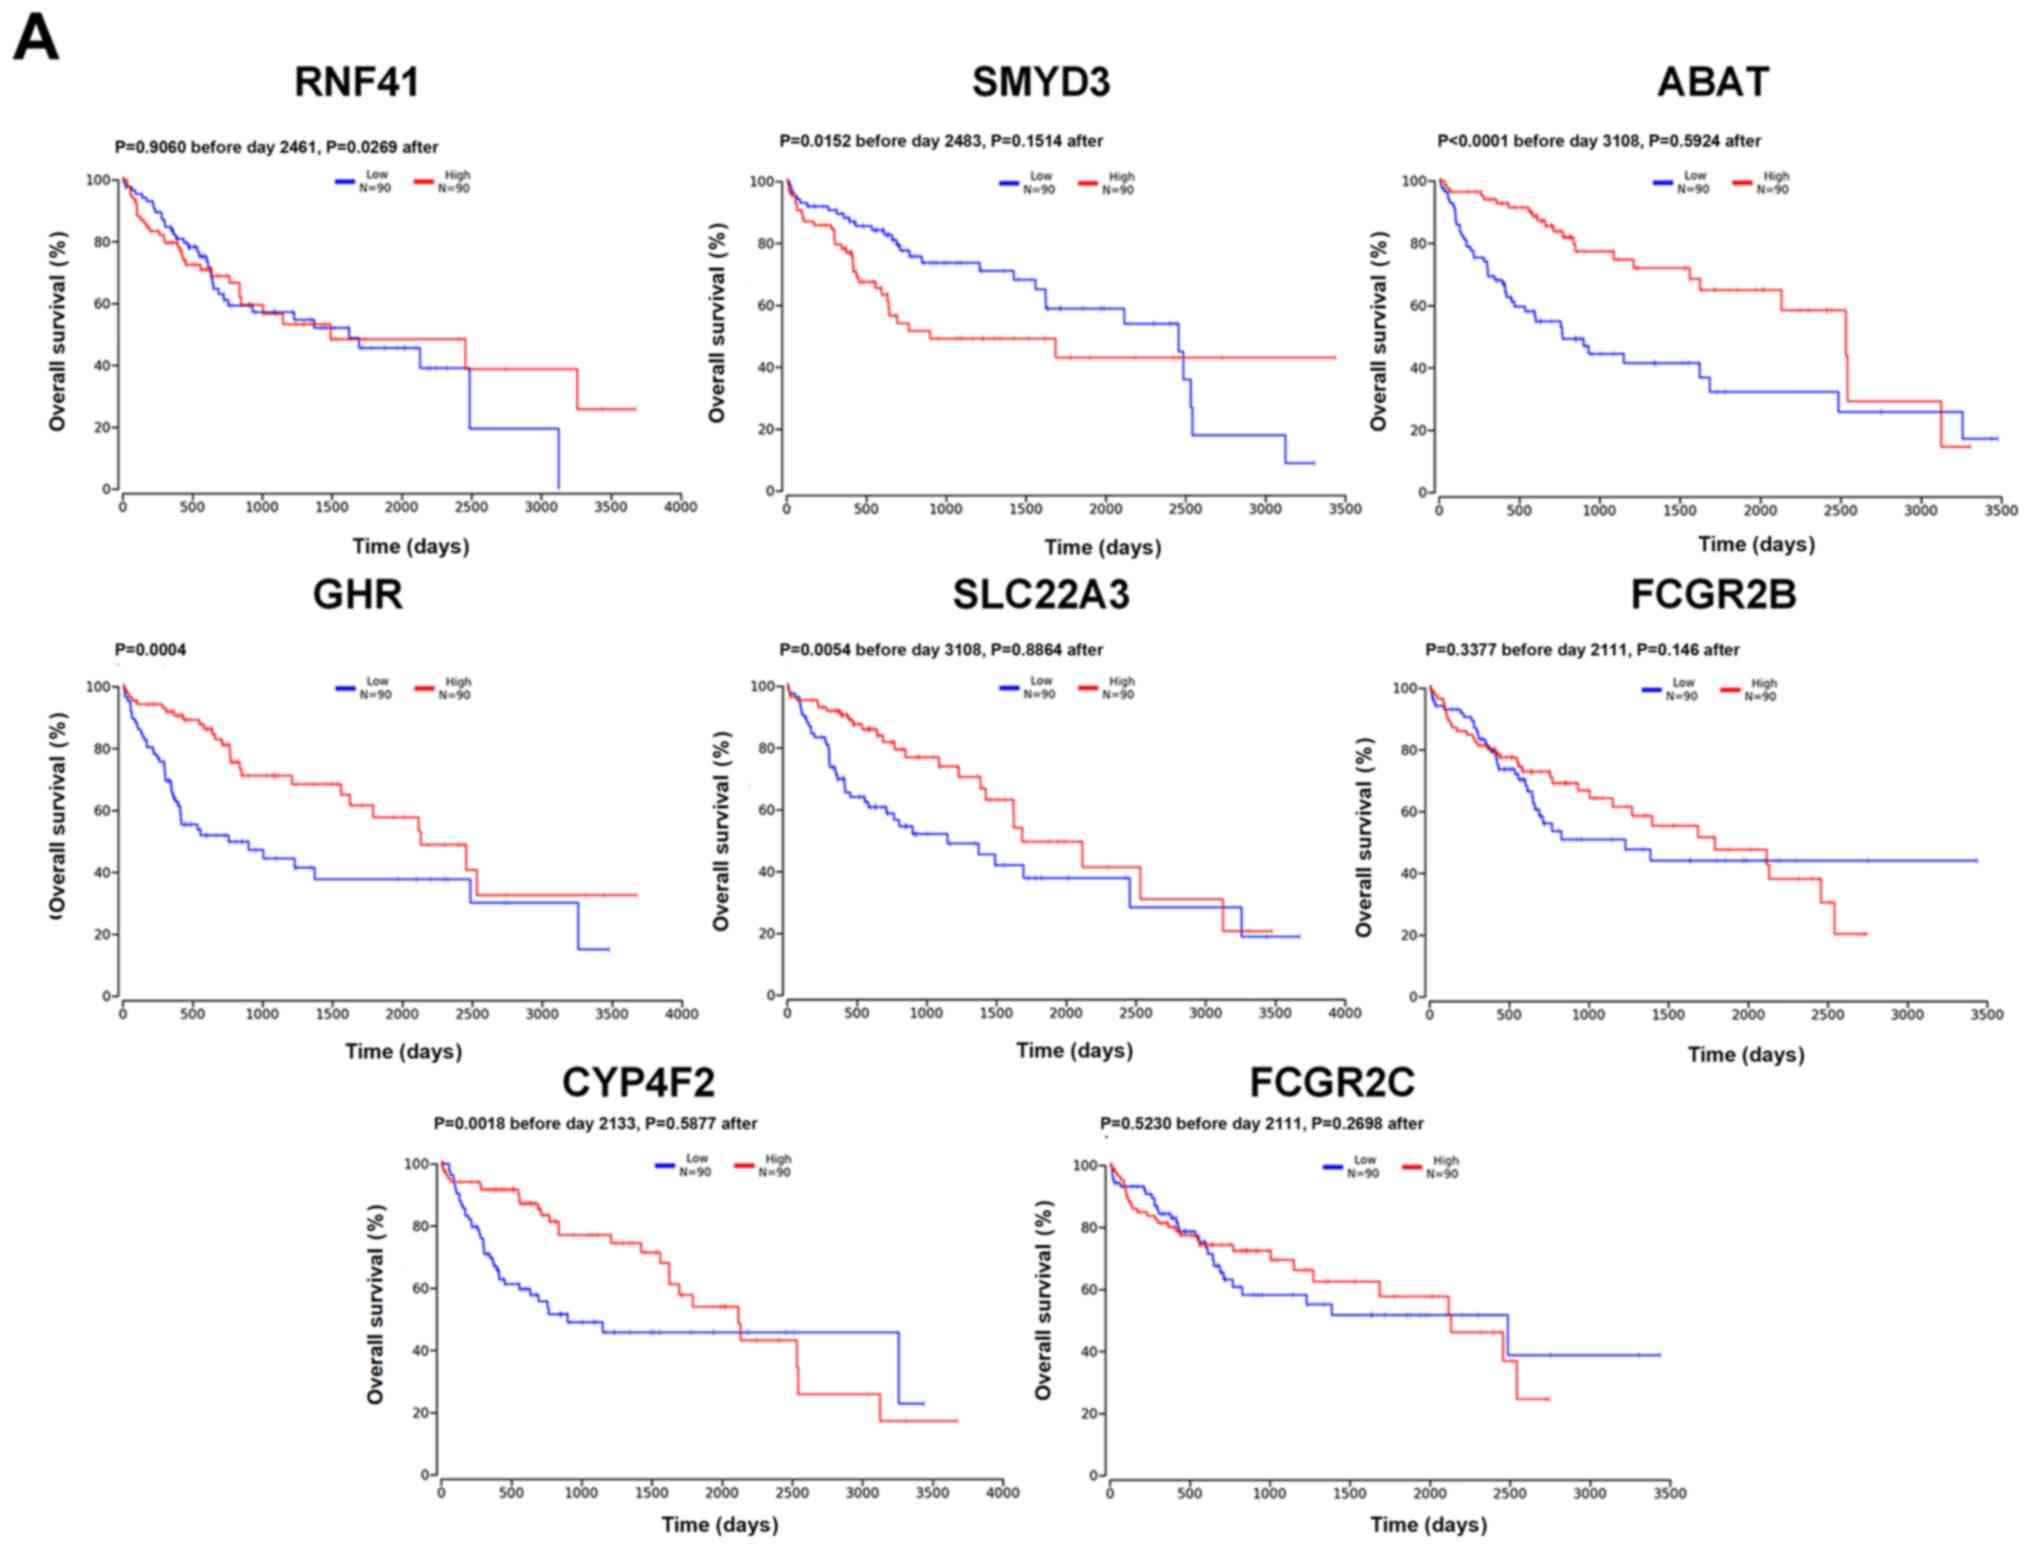 | Figure 3.Kaplan-Meier overall survival
analysis based on differential gene expression levels. (A) Overall
survival. The red line represents the 90 individuals with high
expression in the 25% upper percentile, while the blue line
represents the 90 individuals with low expression in the 25% lower
percentile. Two-stage test was used to examine the significance.
(B) Expression levels of the six key genes in 50 pairs of The
Cancer Genome Atlas hepatocellular carcinoma samples. Paired t-test
was used to examine the significance, ***P<0.001, ns not
significant. (C) Protein expression in liver cancer and normal
liver tissues from the Human Protein Atlas. CYP4F2, cytochrome P450
family 4 subfamily F member 2; RNF41, ring finger protein 41;
SMYD3, SET and MYND domain containing 3; ABAT, 4-aminobutyrate
aminotransferase; growth hormone receptor, GHR; solute carrier
family 22 member 3, SLC22A3; FCGR2 Fc fragment of IgG receptor II
(gene/pseudogene); FPKM, expected number of fragments per kilobase
of transcript sequence per millions base pairs sequenced. |
Cell culture
THLE-2 cells, an immortalized normal human liver
cell line, as well as HepG2 and Hep3B cells derived from human
liver cancer, were purchased from The Cell Bank of Type Culture
Collection of the Chinese Academy of Sciences. The cells were
cultured in DMEM with high glucose (HyClone; Cytiva) containing 10%
FBS (PAN Biotech GmbH) and streptomycin/penicillin (100 U/ml) at
37°C in a humidified incubator with 5% CO2.
RNA extraction and reverse
transcription-quantitative (RT-q)PCR
Total RNA was extracted from the cells using RNAiso
Plus kit (Takara Biotechnology Co., Ltd.) according to the
manufacturer's protocol. Subsequently, the RNA was reverse
transcribed into cDNA using the following temperature protocol:
37°C For 15 min, 85°C for 5 sec and 4°C for 5 mins, using the
PrimeScript™ RT Reagent kit containing gDNA Eraser (Takara
Biotechnology Co., Ltd.). qPCR analysis was performed using SYBR
Premix Ex Taq II (Takara Biotechnology Co., Ltd.) and the CFX96
Touch Real-Time PCR system (Bio-Rad Laboratories, Inc.) with the
following thermocycling conditions: 95°C For 30 sec, 40 cycles of
95°C for 5 sec and 60°C for 30 sec. The relative gene expression
data were quantified using the 2−ΔΔCq method (26). GAPDH served as an internal control.
The following primers were used: GAPDH forward,
5′-CTTTGGTATCGTGGAAGGACTC-3′ and reverse,
5′-GTAGAGGCAGGGATGATGTTCT-3′; CYP4F2 forward,
5′-CTGAGTGCTGGTGACAAGTGGA-3′ and reverse,
5′-TCATGAGGCTGATGTGCTCAA-3′; and Nrf2 forward,
5′-TACTCCCAGGTTGCCCACA-3′ and reverse,
5′-CATCTACAAACGGGAATGTCTGC-3′). All reactions were performed in
triplicate.
Lentivirus (LV) construction and cell
transfection
The LV overexpressing CYP4F2 and the control LV were
constructed and synthesized by Shanghai GenePharma Co., Ltd. Cells
(1×10⁵ per well) were seeded into a 12-well plate for 24
h, following which the medium was replaced with medium containing
LV (LV5-CYP4F2 or vector; multiplicity of infection, 20) and
polybrene (5 µg/ml for enhanced transfection efficiency; Shanghai
GenePharma Co., Ltd.). After 24 h, the medium was substituted with
DMEM supplemented with 10% FBS. The expression of green fluorescent
protein (GFP) was detected to evaluate the infection efficiency
using a fluorescence microscope (as transfected cells emit green
fluorescence, at 100× magnification) after 72 h. Subsequently, the
medium was changed by 5 µg/ml puromycin complete medium and cells
were cultured for 24 h at 37°C to kill the non-transfected cells.
Finally, the medium was exchanged with complete medium. The
aforementioned step was repeated three times. RT-qPCR and western
blot analysis were performed to determine the efficiency of CYP4F2
overexpression.
Cell proliferation assay
The proliferation of cells was determined using the
Cell Counting Kit-8 (CCK-8; Dojindo Molecular Technologies, Inc.)
assay according to the manufacturer's protocol. Briefly, cells
(4×10³ cells/well) were plated in 96-well plates and
cultured for 0, 24, 48, 72 and 96 h at 37°C. Subsequently, CCK-8
solution was added to each well and cells were cultured for 1.5 h
at 37°C in the dark. Cell proliferation was measured at 450 nm.
Wound healing assay
The migration of Hep3B cells was determined using
in vitro wound-healing assays. Briefly, cells
(5×10⁵) were seeded in 6-well plates and cultured to
100% confluence. A sterile pipette tip was used to generate the
wounds. Cells were washed three times with PBS to remove detached
cells, treated with serum-free medium and incubated at 37°C for 24
h. Images were captured at 0, 24 and 48 h using a light microscope
(magnification, ×100). ImageJ v1.8.0 (National Institutes of
Health) was used to measure the area of wound, and then the
migration rate was calculated using the following formula:
Migration rate = areax/area0, ‘area’- area of
wound, ‘x’- time of taking images).
Transwell migration assay
The migratory ability of the Hep3B cell line was
determined using a Transwell insert. Transfected and
non-transfected Hep3B cells were resuspended in serum-free medium
and 100 µl cells (4×10⁴) was added to the upper chamber,
while 600 µl medium containing 10% FBS was added to the lower
chamber. After 24 h, cells were fixed for 15 min in 4%
paraformaldehyde at room temperature until chamber removal.
Subsequently, cells were stained for 10 min with 0.1% crystal
violet at room temperature and then the inner layer of cells was
carefully removed by cotton swab. Finally, three fields of view
were randomly selected for each sample using a light microscope
(magnification, ×100) and then images were captured. ImageJ v1.8.0
was used to count the cells for each image.
Western blot analysis
Cells were harvested and lysed with the Cell lysis
buffer for Western and IP (cat. no. P0013; Beyotime Institute of
Biotechnology). The protein concentration was evaluated using a
bicinchoninic acid kit (Beyotime Institute of Biotechnology). After
separation using 8% SDS-PAGE (10 µg total protein per well),
proteins were transferred onto a polyvinylidene fluoride membrane.
Subsequently, the membrane was blocked using 5% skimmed milk and
incubated overnight at 4°C with primary antibodies against CYP4F2
(cat. no. AF9051; 1:1,000; Affinity Biosciences), Nrf2 (cat. no.
66504-1-Ig; 1:1,000; ProteinTech Group, Inc.), NQO1(cat. no.
67240-1-Ig; 1:5,000; ProteinTech Group, Inc.), HO-1 (cat. no.
66743-1-Ig; 1:1,000; ProteinTech Group, Inc.) and FTH1 (cat. no.
10727-1-AP; 1:1000), GAPDH (cat. no. BA2913; 1:500; Wuhan Boster
Biological Technology, Ltd.) as the internal reference. After three
washes with TBS-Tween-20, the membrane was incubated with a
secondary antibody, Mouse-IgG Rabbit antibody (cat. no. 10283-1-AP;
1:5,000; ProteinTech Group, Inc.) or Goat-IgG Rabbit Polyclonal
antibody (cat. no. 10285-1-AP; 1:5,000; ProteinTech Group, Inc.),
for 1 h at room temperature. All primary and secondary antibodies
were diluted using western blotting Antibody Diluent (cat. no.
AR1017; Wuhan Boster Biological Technology, Ltd.). Subsequently,
the membrane was washed three times with TBS-Tween-20 and
visualized using an enhanced chemiluminescence solution (Wanleibio
Co., Ltd.) and quantified using a multifunctional gel imaging
system (Fusion FX7 Spectra, Vilber Lourmat in the dark.
Apoptosis assay
Cell apoptosis was detected according to the
manufacturer's protocol, using an Annexin V-allophycocyanin (APC)
apoptosis detection kit (Sigma-Aldrich; Merck KGaA) and DAPI
PB450-A. The transfected (including positive group and negative
group) and untransfected cells in were resuspended in 10% phosphate
buffer saline (1×10⁶ cells/ml). Cell mixtures containing
10 µl Annexin V-APC and DAPI PB450-A were incubated for 15 min at
room temperature, and then flow cytometry analysis (CytoFLEX flow
cytometry system; Beckman Coulter, Inc.) was performed and datas
were analysised by CytExpert 2.3.0.84; Beckman Coulter.
Statistical analysis
All experimental were repeated three times. Data
were expressed as the mean ± SD. GraphPad Prism 8 analysis software
(GraphPad Software, Inc.) was used to perform the statistical
analysis. One-way ANOVA were used to examine differences between
two experimental groups, while mean values of >2 groups were
compared using one-way ANOVA corrected with Bonferroni's
correction. P<0.05 was considered to indicate a statistically
significant difference.
Results
Summary of the RNA-Seq data
RNA-Seq data for 11 pairs of HCC with hepatitis B
and matching non-tumor liver samples were downloaded from the
GSE63863 dataset (15), which
resulted in an output of ~250.8 GB of raw sequence. On average,
55.9 million raw sequencing reads were obtained following RNA-Seq,
and ~99.5% of the reads were aligned to the transcribed database of
reference genome (Table I).
 | Table I.Summary of mRNA reads in the 11 pairs
of liver cancer and matched non-tumor tissues. |
Table I.
Summary of mRNA reads in the 11 pairs
of liver cancer and matched non-tumor tissues.
| A, Liver cancer
tissues |
|---|
|
|---|
| Run | Left read | Right read | Overall rate,
% |
|---|
| P01T | 28,297,216 | 28,297,216 | 99.6 |
| P02T | 30,812,501 | 30,812,501 | 99.4 |
| P03T | 23,547,400 | 23,547,400 | 99.5 |
| P04T | 36,705,394 | 36,705,394 | 99.7 |
| P05T | 28,488,560 | 28,488,560 | 99.6 |
| P06T | 28,654,873 | 28,654,873 | 99.6 |
| P07T | 28,909,671 | 28,909,671 | 99.6 |
| P08T | 21,754,053 | 21,754,053 | 99.4 |
| P09T | 27,695,079 | 27,695,079 | 99.7 |
| P10T | 23,844,185 | 23,844,185 | 99.6 |
| P11T | 29,781,102 | 29,781,102 | 99.7 |
|
| B, Matched
non-tumor tissues |
|
| Run | Left
read | Right
read | Overall rate,
% |
|
| P01N | 27,672,329 | 27,672,329 | 99.5 |
| P02N | 24,241,776 | 24,241,776 | 99.6 |
| P03N | 21,819,135 | 21,819,135 | 99.6 |
| P04N | 42,363,508 | 42,363,508 | 99.8 |
| P05N | 28,652,601 | 28,652,601 | 99.6 |
| P06N | 31,060,859 | 31,060,859 | 99.6 |
| P07N | 31,415,753 | 31,415,753 | 99.7 |
| P08N | 26,931,333 | 26,931,333 | 99.6 |
| P09N | 30,377,104 | 30,377,104 | 99.7 |
| P10N | 23,039,779 | 23,039,779 | 99.7 |
| P11N | 27,147,987 | 27,147,987 | 99.7 |
Identification of DEGs and functional
annotation
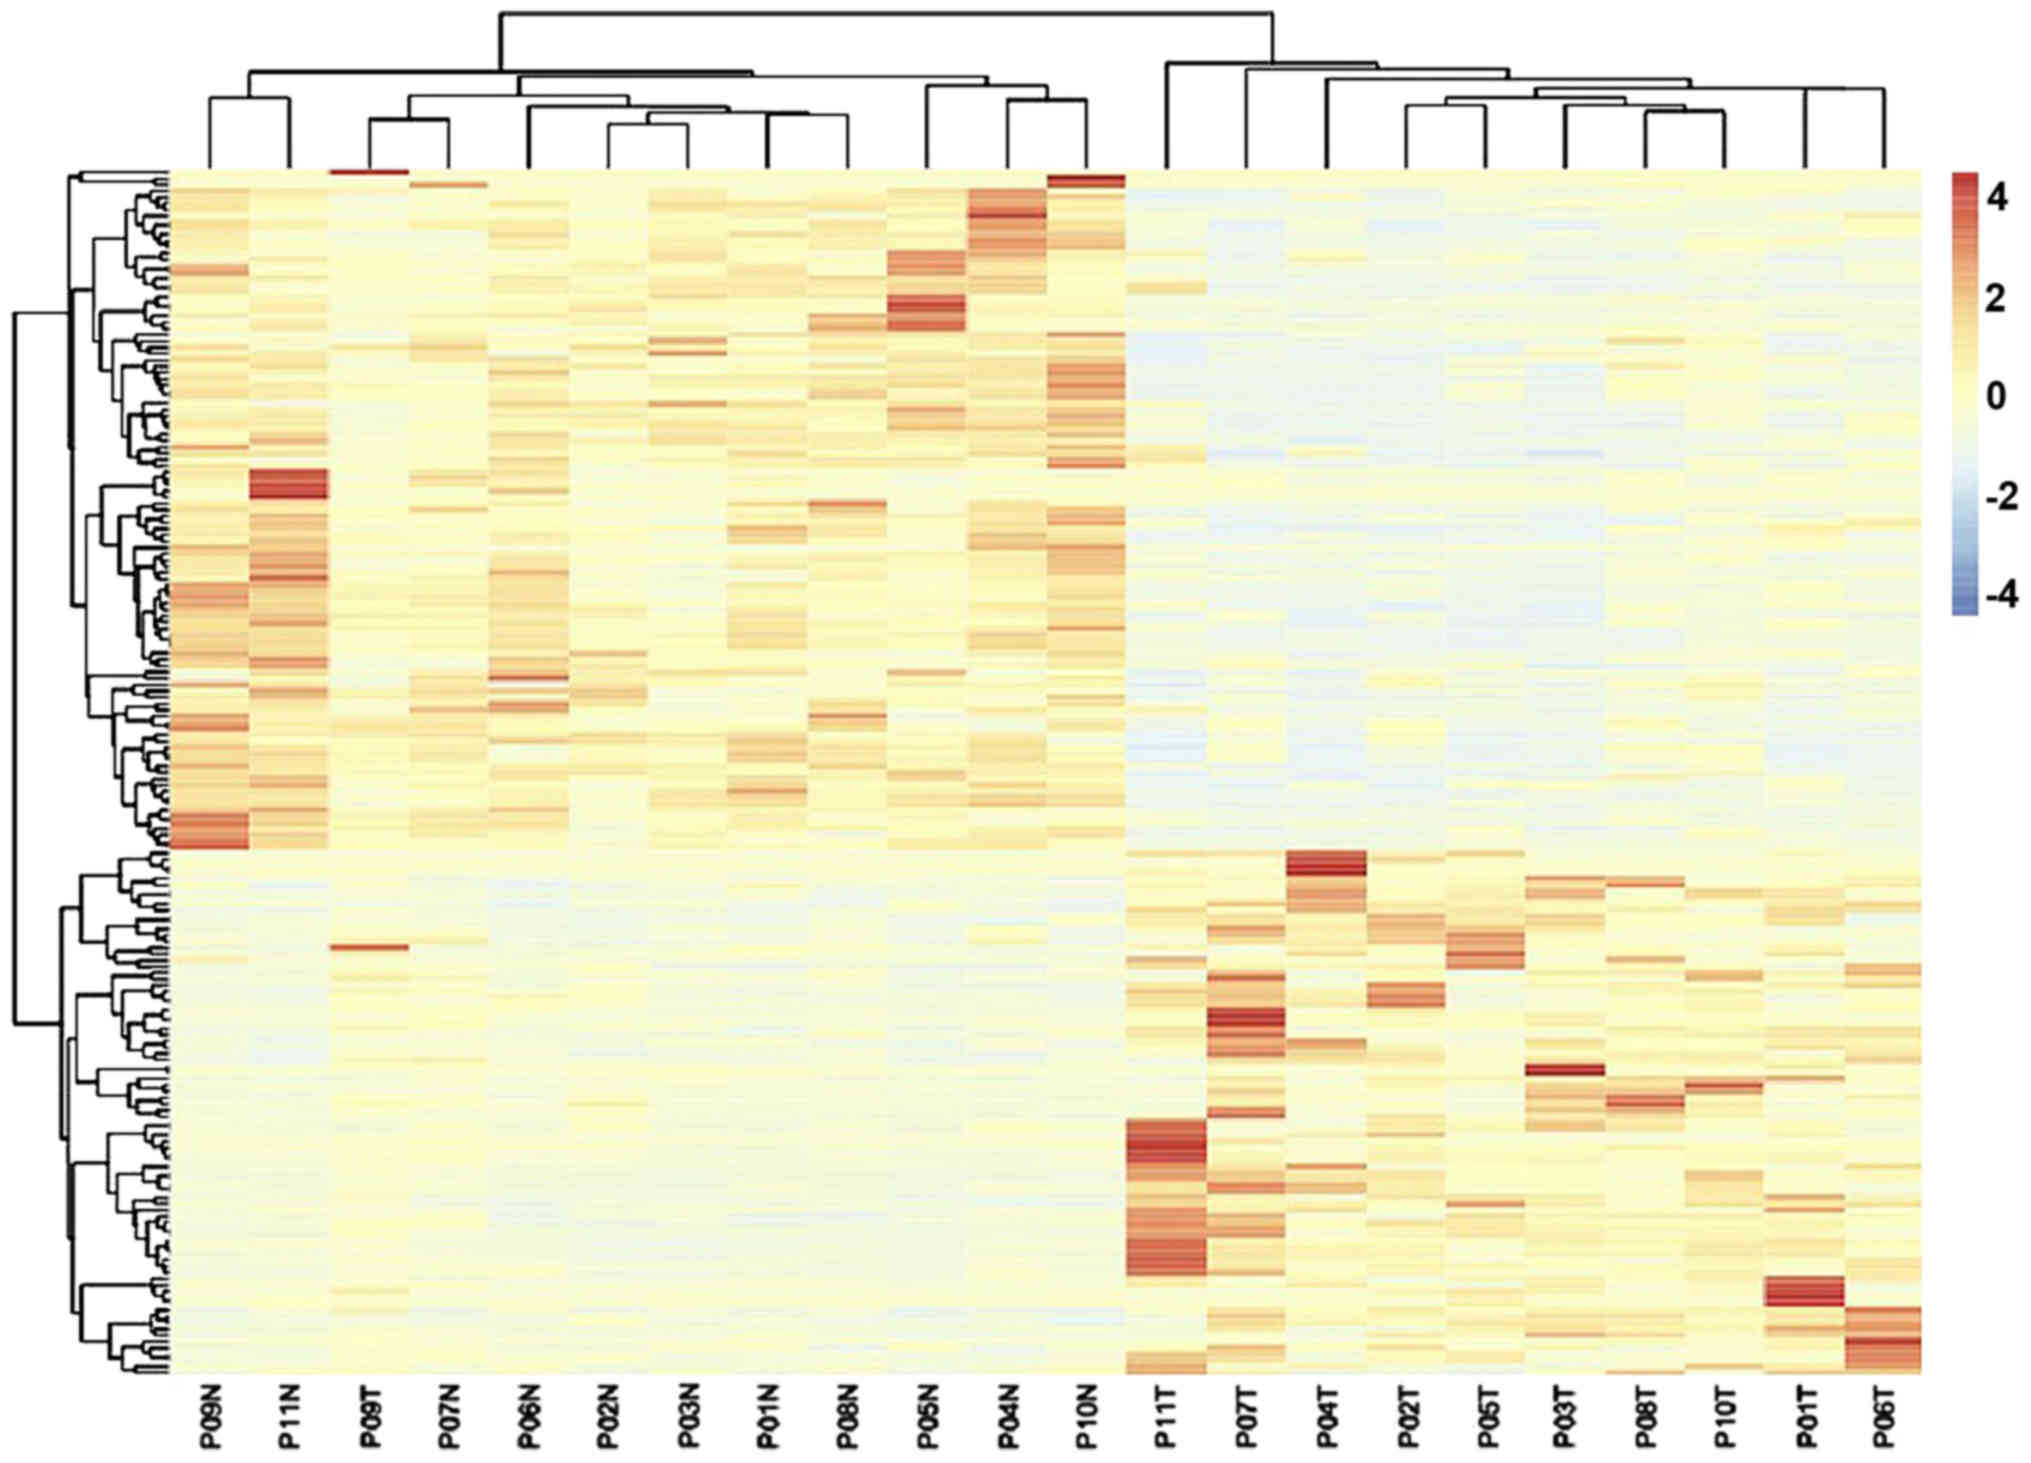
A total of 22,646 genes were identified between the
11 liver cancer and matched non-tumor tissues. Among these, 192
DEGs were identified according to the Cuffdiff software with the
FDR<0.05 and FC>1 criteria; among these DEGs, 109 were
identified as downregulated, while 83 were identified as
upregulated. The expression heatmap of the DEGs is displayed in
Fig. 1. The 192 DEGs were uploaded
into the DAVID online tool for the identification of GO categories.
All GO terms within FDR<0.05 were list in Table II. Among the biological processes,
upregulated DEGs were enriched in ‘daunorubicin metabolic process’
and ‘doxorubicin metabolic process’, whereas the downregulated DEGs
were enriched in ‘acute-phase response’. For molecular function,
upregulated DEGs were enriched in ‘ketosteroid monooxygenase
activity’ and ‘indanol dehydrogenase activity’, and the
downregulated DEGs were enriched in ‘monooxygenase activity’, ‘iron
ion binding’ and ‘oxidoreductase activity, acting on paired donors,
with incorporation or reduction of molecular oxygen’. For cellular
component, the downregulated DEGs were enriched in ‘extracellular
space’, ‘extracellular exosome’ and ‘blood microparticle’.
| Table II.GO analysis of differentially
expressed genes. |
Table II.
GO analysis of differentially
expressed genes.
| Expression | Category | ID | Term | Count | Percentage | FDR |
|---|
| Upregulated | BP | GO:0044597 | Daunorubicin
metabolic process | 4 | 4.97 |
4.19×10⁻³ |
|
| BP | GO:0044598 | Doxorubicin
metabolic process | 4 | 4.97 |
4.19×10⁻³ |
|
| MF | GO:0047086 | Ketosteroid
monooxygenase activity | 3 | 3.73 |
4.61×10⁻² |
|
| MF | GO:0047718 | Indanol
dehydrogenase activity | 3 | 3.73 |
4.61×10⁻² |
| Downregulated | BP | GO:0006953 | Acute-phase
response | 5 | 4.94 |
2.07×10⁻³ |
|
| CC | GO:0005615 | Extracellular
space | 19 | 18.75 |
5.83×10⁻⁴ |
|
| CC | GO:0070062 | Extracellular
exosome | 28 | 27.64 |
2.04×10⁻³ |
|
| CC | GO:0072562 | Blood
microparticle | 13 | 12.83 |
1.62×10⁻¹² |
|
| MF | GO:0004497 | Monooxygenase
activity | 6 | 5.92 |
1.05×10⁻³ |
|
| MF | GO:0005506 | Iron ion
binding | 9 | 8.88 |
1.51×10⁻³ |
|
| MF | GO:0016705 | Oxidoreductase
activity, acting on paired donors, with incorporation or reduction
of molecular oxygen | 6 | 5.92 |
1.05×10⁻³ |
|
| MF | GO:002003 | Heme binding | 9 | 8.88 |
4.18×10⁻⁴ |
In addition, a total of 20 enriched pathways were
identified by KEGG pathway analysis including four enriched
pathways of upregulated DEGs and 16 enriched pathways of
downregulated DEGs. Four KEGG pathways within FDR<0.05 based on
downregulated DEGs was screened. The downregulated DEGs were
significantly enriched in ‘complement and coagulation cascades’,
‘retinol metabolism’, ‘metabolic pathways’ and ‘Staphylococcus
aureus infection’ (Table III),
while there were no enriched pathways for the upregulated DEGs
(FDR>0.05; data not shown).
| Table III.Kyoto Encyclopedia of Genes and
Genomes pathway analysis of the downregulated differentially
expressed genes. |
Table III.
Kyoto Encyclopedia of Genes and
Genomes pathway analysis of the downregulated differentially
expressed genes.
| Pathway ID | Name | Count | Percent | FDR | Genes |
|---|
| hsa04610 | Complement and
coagulation cascades | 12 | 11.84 |
5.11×10⁻⁹ | KNG1, FGG, C9, FGA,
FGB, C3, C1R, SERPING1, C1S, C4BPA, CFI, PLG |
| hsa00830 | Retinol
metabolism | 9 | 8.88 |
8.52×10⁻⁶ | CYP4A11, CYP3A5,
CYP4A22, CYP2C18, CYP2B6, HSD17B6, UGT2B10, RDH16 |
| hsa01100 | Metabolic
pathways | 28 | 27.64 |
5.31×10⁻⁵ | CYP3A5, SORD,
FOLH1B, CYP2C18, CYP2B6, ALDOB, AGXT, CYP4A22, HSD17B6, HPD,
ACSM2B, SUCLG2, BCKDHB, ACMSD, GRHPR, MAN1C1, GBA3, CYP4A11,
HMGCS2, ABAT, AGXT2, UGT2B10, CYP4F2, RDH16, PON3, UGP2 |
| hsa05150 | Staphylococcus
aureus infection | 8 | 7.89 |
2.62×10⁻⁴ | FGG, FCGR2B, C3,
C1R, C1S, FCGR2A, CFI, PLG |
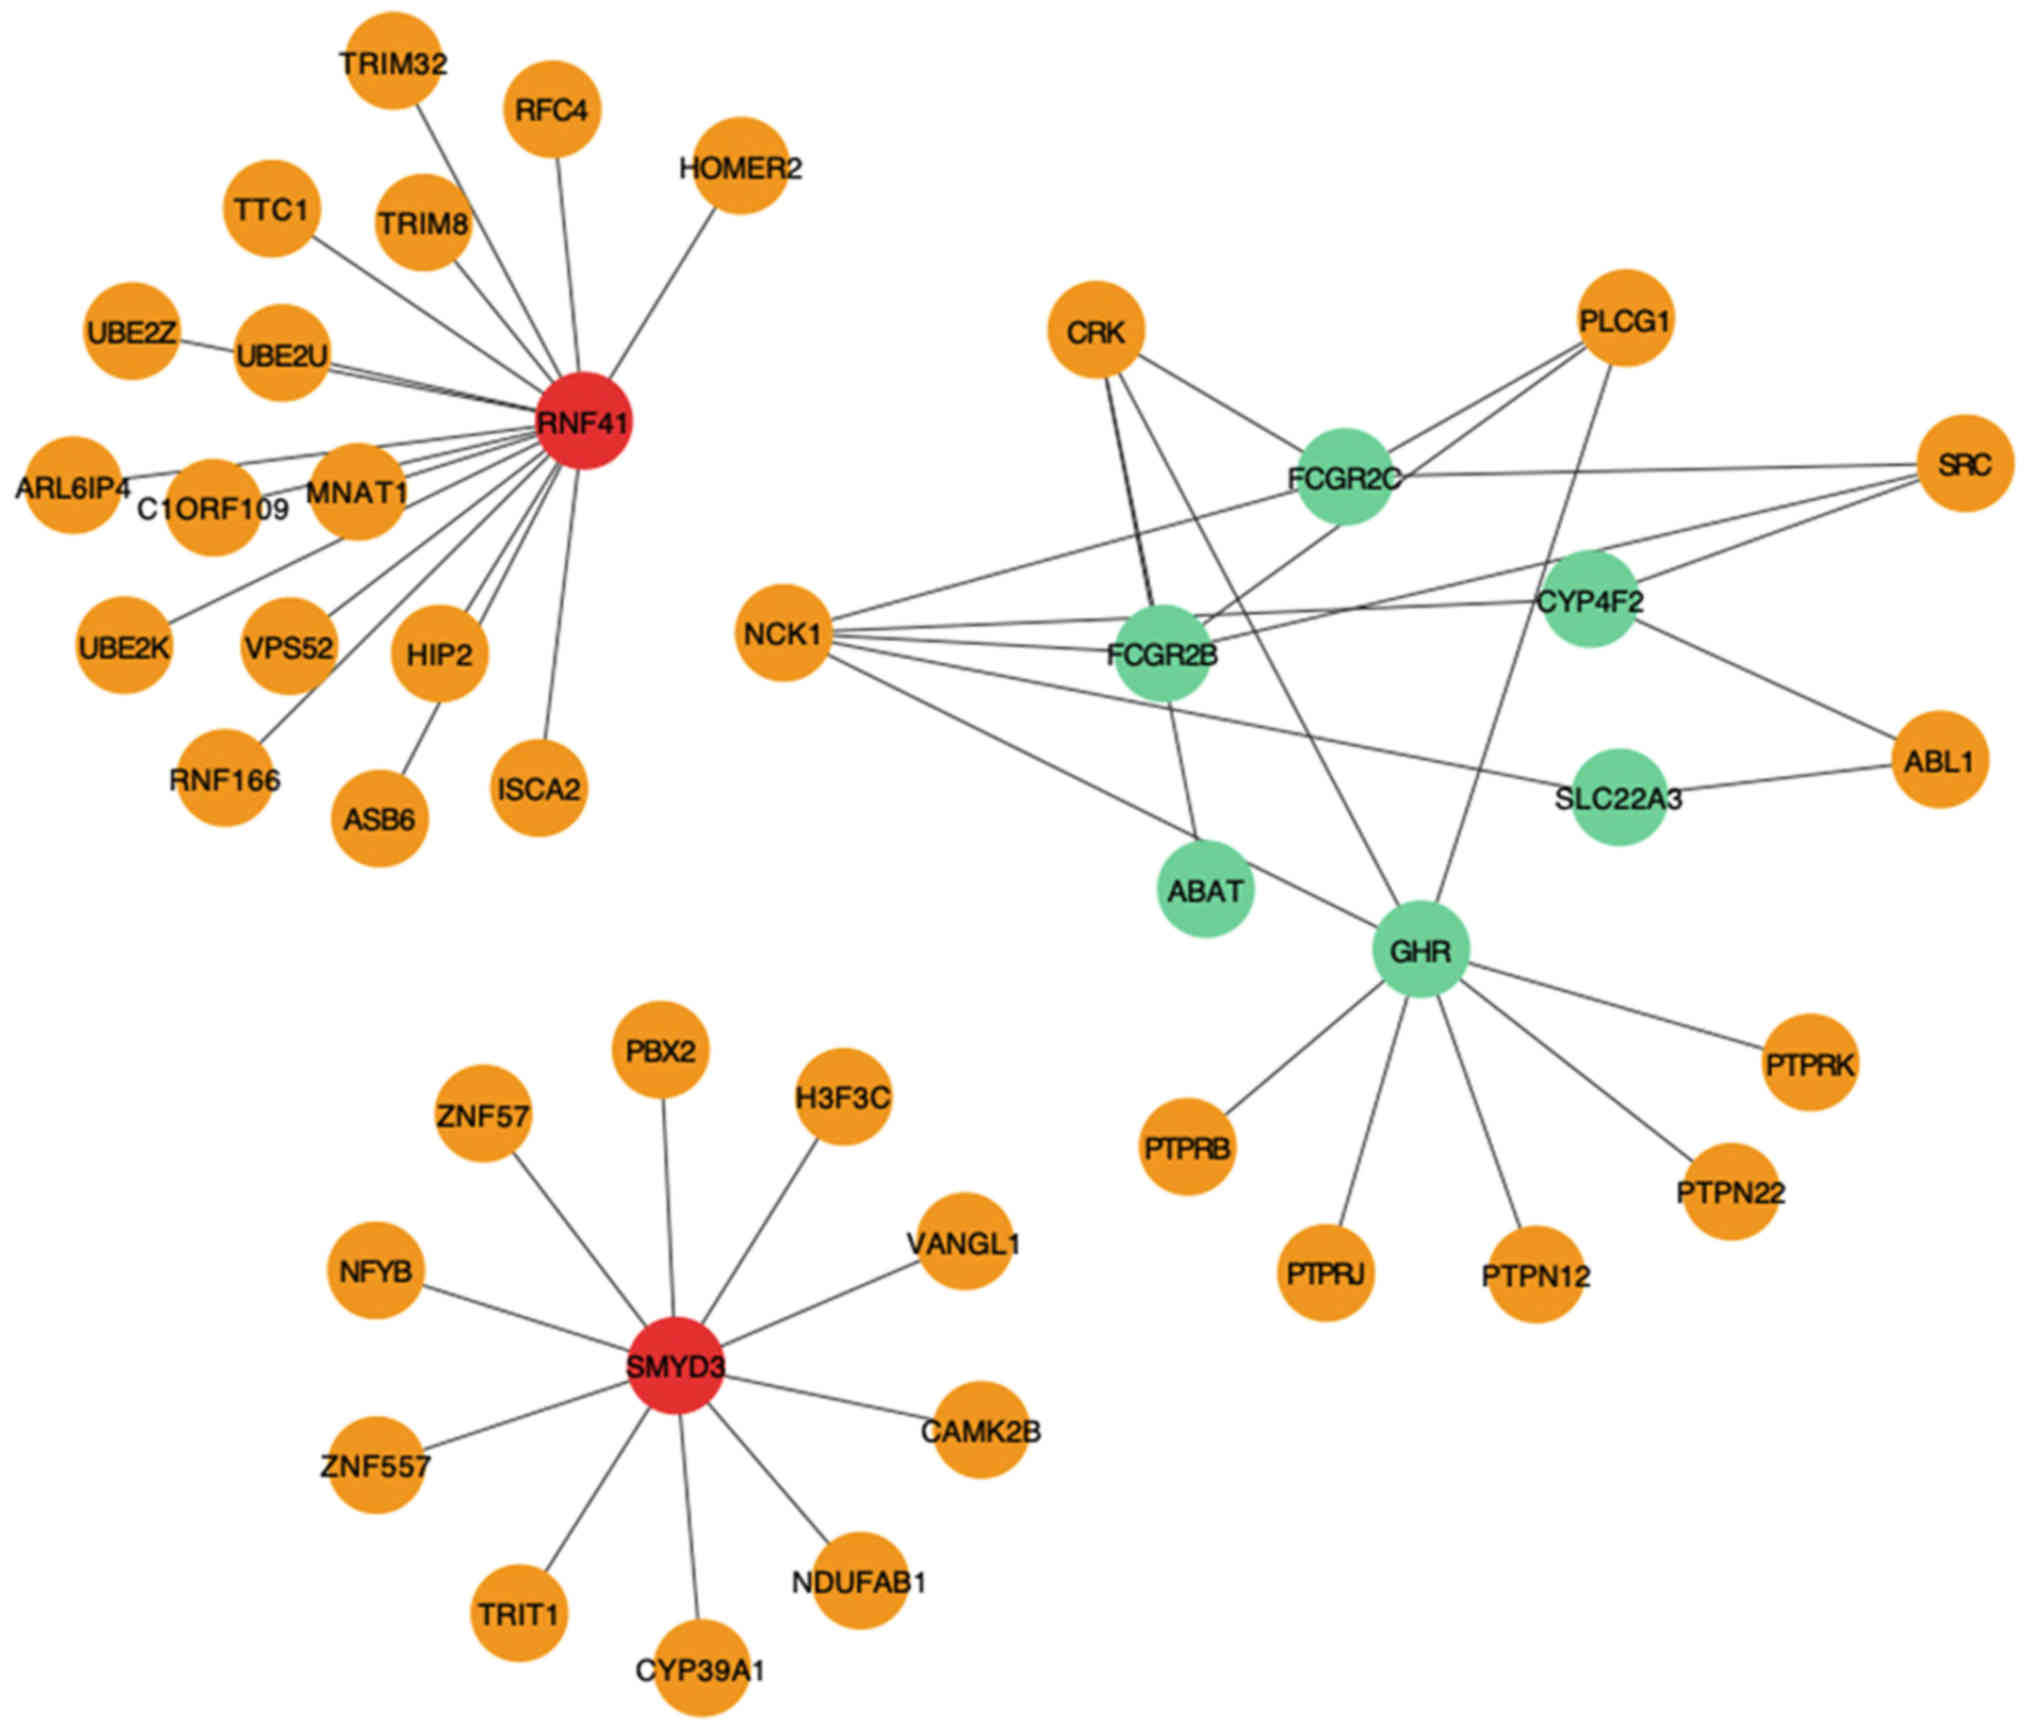
Module filtering from the PPI
network
To identify key genes, a PPI network (27) of the 192 DEGs was constructed using
ClusterOne (22). According to the
HINT database, the top three significant modules were selected
(Fig. 2), from which eight DEGs were
identified, including two upregulated [ring finger protein 41
(RNF41) and SET and MYND domain containing 3 (SMYD3)] and six
downregulated [Fc fragment of IgG receptor IIc (gene/pseudogene)
(FCGR2C), FCGR2B, 4-aminobutyrate aminotransferase (ABAT), growth
hormone receptor (GHR), solute carrier family 22 member 3 (SLC22A3)
and CYP4F2] genes.
Identification of candidate genes
The expression levels of the eight genes identified
from the aforementioned modules were further analyzed in TCGA HCC
cohort to determine their clinical significance (Fig. 3A). Kaplan-Meier curve analysis
revealed that patients with SMYD3 upregulated expression had a
significantly lower overall survival rate compared with those with
SMYD3 downregulated expression (P=0.0152 before day 2483, P=0.1514
after), and that patients with low expression levels of ABAT
(P<0.0001 before day 3,108, P=0.5924 after), CYP4F2 (P=0.0018
before day 2,133, P=0.5877 after), GHR (P=0.0004), SLC22A3
(P=0.0054 before day 3,108, P=0.8864 after) and RNF41 (P=0.9060
before day 2,461, P=0.0269 after) had a significantly lower overall
survival rate compared with those with high expression levels, when
take the patient's 5-year survival rate was used as a reference.
And RNF41 (P=0.9060 before day 2,461, P=0.0269 after) had a
significantly lower overall survival rate compared with those with
high expression levels when the number of days is longer than 2,461
days. However, there were no significant differences in overall
survival associated with FCGR2C (P=0.5230 before day 2,111,
P=0.2698 after) and FCGR2B (P=0.3377 before day 2,111, P=0.146
after) expression levels. To determine the clinical relevance of
the expression levels of these genes, the expression levels of the
key genes were analyzed in the specified TCGA HCC that contains
both 50 HCC and 50 corresponding adjacent non-tumor liver samples.
As shown in Fig. 3B, the six key
genes that were significant in the aforementioned survival analysis
were analyzed. The expression of GHR, SLC22A3, ABAT, CYP4F2 in
tumor tissue were significantly lower than normal tissue, but SMYD3
were significantly higher, and RNF41 was no significant difference.
In addition, the protein expression levels of four out of the six
key genes (SMYD3, ABAT, CYP4F2, SLC22A3, RNF41 and GHR) were
analyzed in clinical specimens (Fig.
3C) from the Human Protein Atlas. The results revealed that
SMYD3 expression was positive in liver cancer specimens and
negative in normal liver specimens, while the expression levels of
ABAT, CYP4F2, SLC22A3 and GHR were negative in liver cancer
specimens and positive in normal liver specimens, but there was no
difference in RNF41.
CYP4F2 overexpression regulates the
proliferation, migration and apoptosis of Hep3B cells
Emerging evidence has revealed that human CYP4
enzymes serve crucial roles in liver cancer progression (28). To detect whether CYP4F2 was involved
in hepatocarcinogenesis and whether it may act as a biomarker,
CYP4F2 was selected for validation in subsequent functional
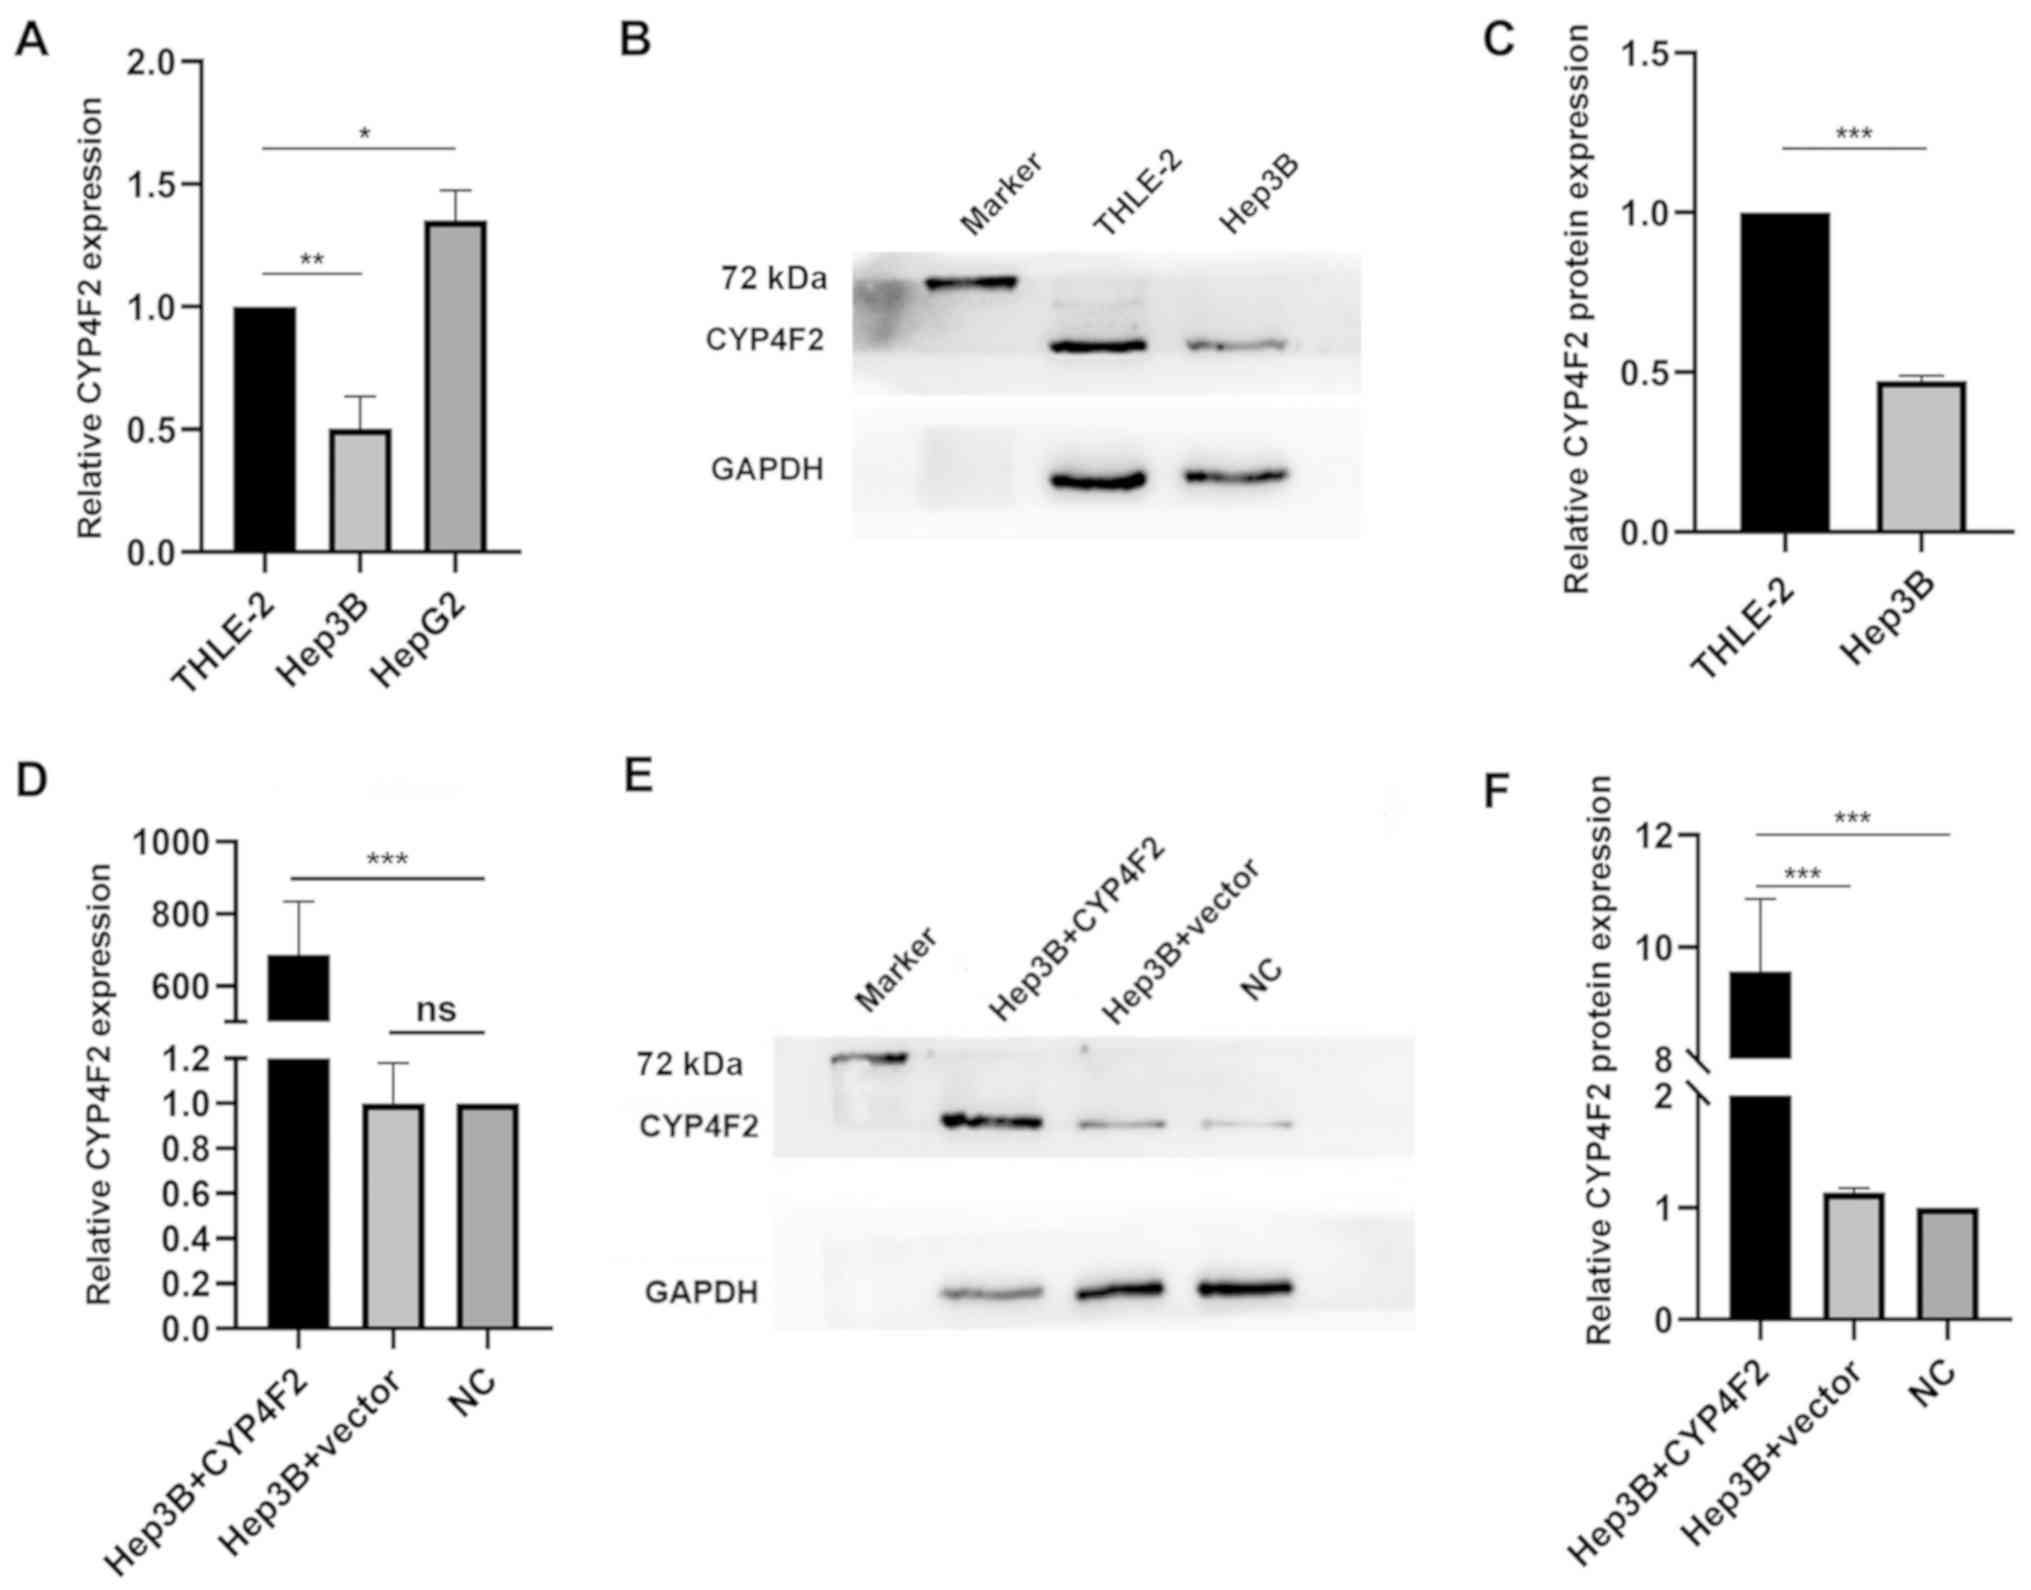
experiments. To explore the role of CYP4F2 in HCC, the endogenous
levels of CYP4F2 were first determined in liver cancer cell lines
and THLE-2 cells (an immortalized human liver cell line). CYP4F2
mRNA and protein expression were significantly downregulated in
Hep3B cells compared with that in THLE-2 cells, but CYP4F2 mRNA
expression was significantly upregulated in HepG2 cells compared
with that in THLE-2 cells. (Fig.
4A-C). A recombinant lentivirus encoding CYP4F2 (Hep3B+CYP4F2)
was constructed to overexpress CYP4F2, and a lentivirus expressing
GFP (Hep3B+vector) served as a negative control, and untransfected
Hep3B cells were used as a normal control (NC). CYP4F2 expression
was significantly increased in the Hep3B cell line following
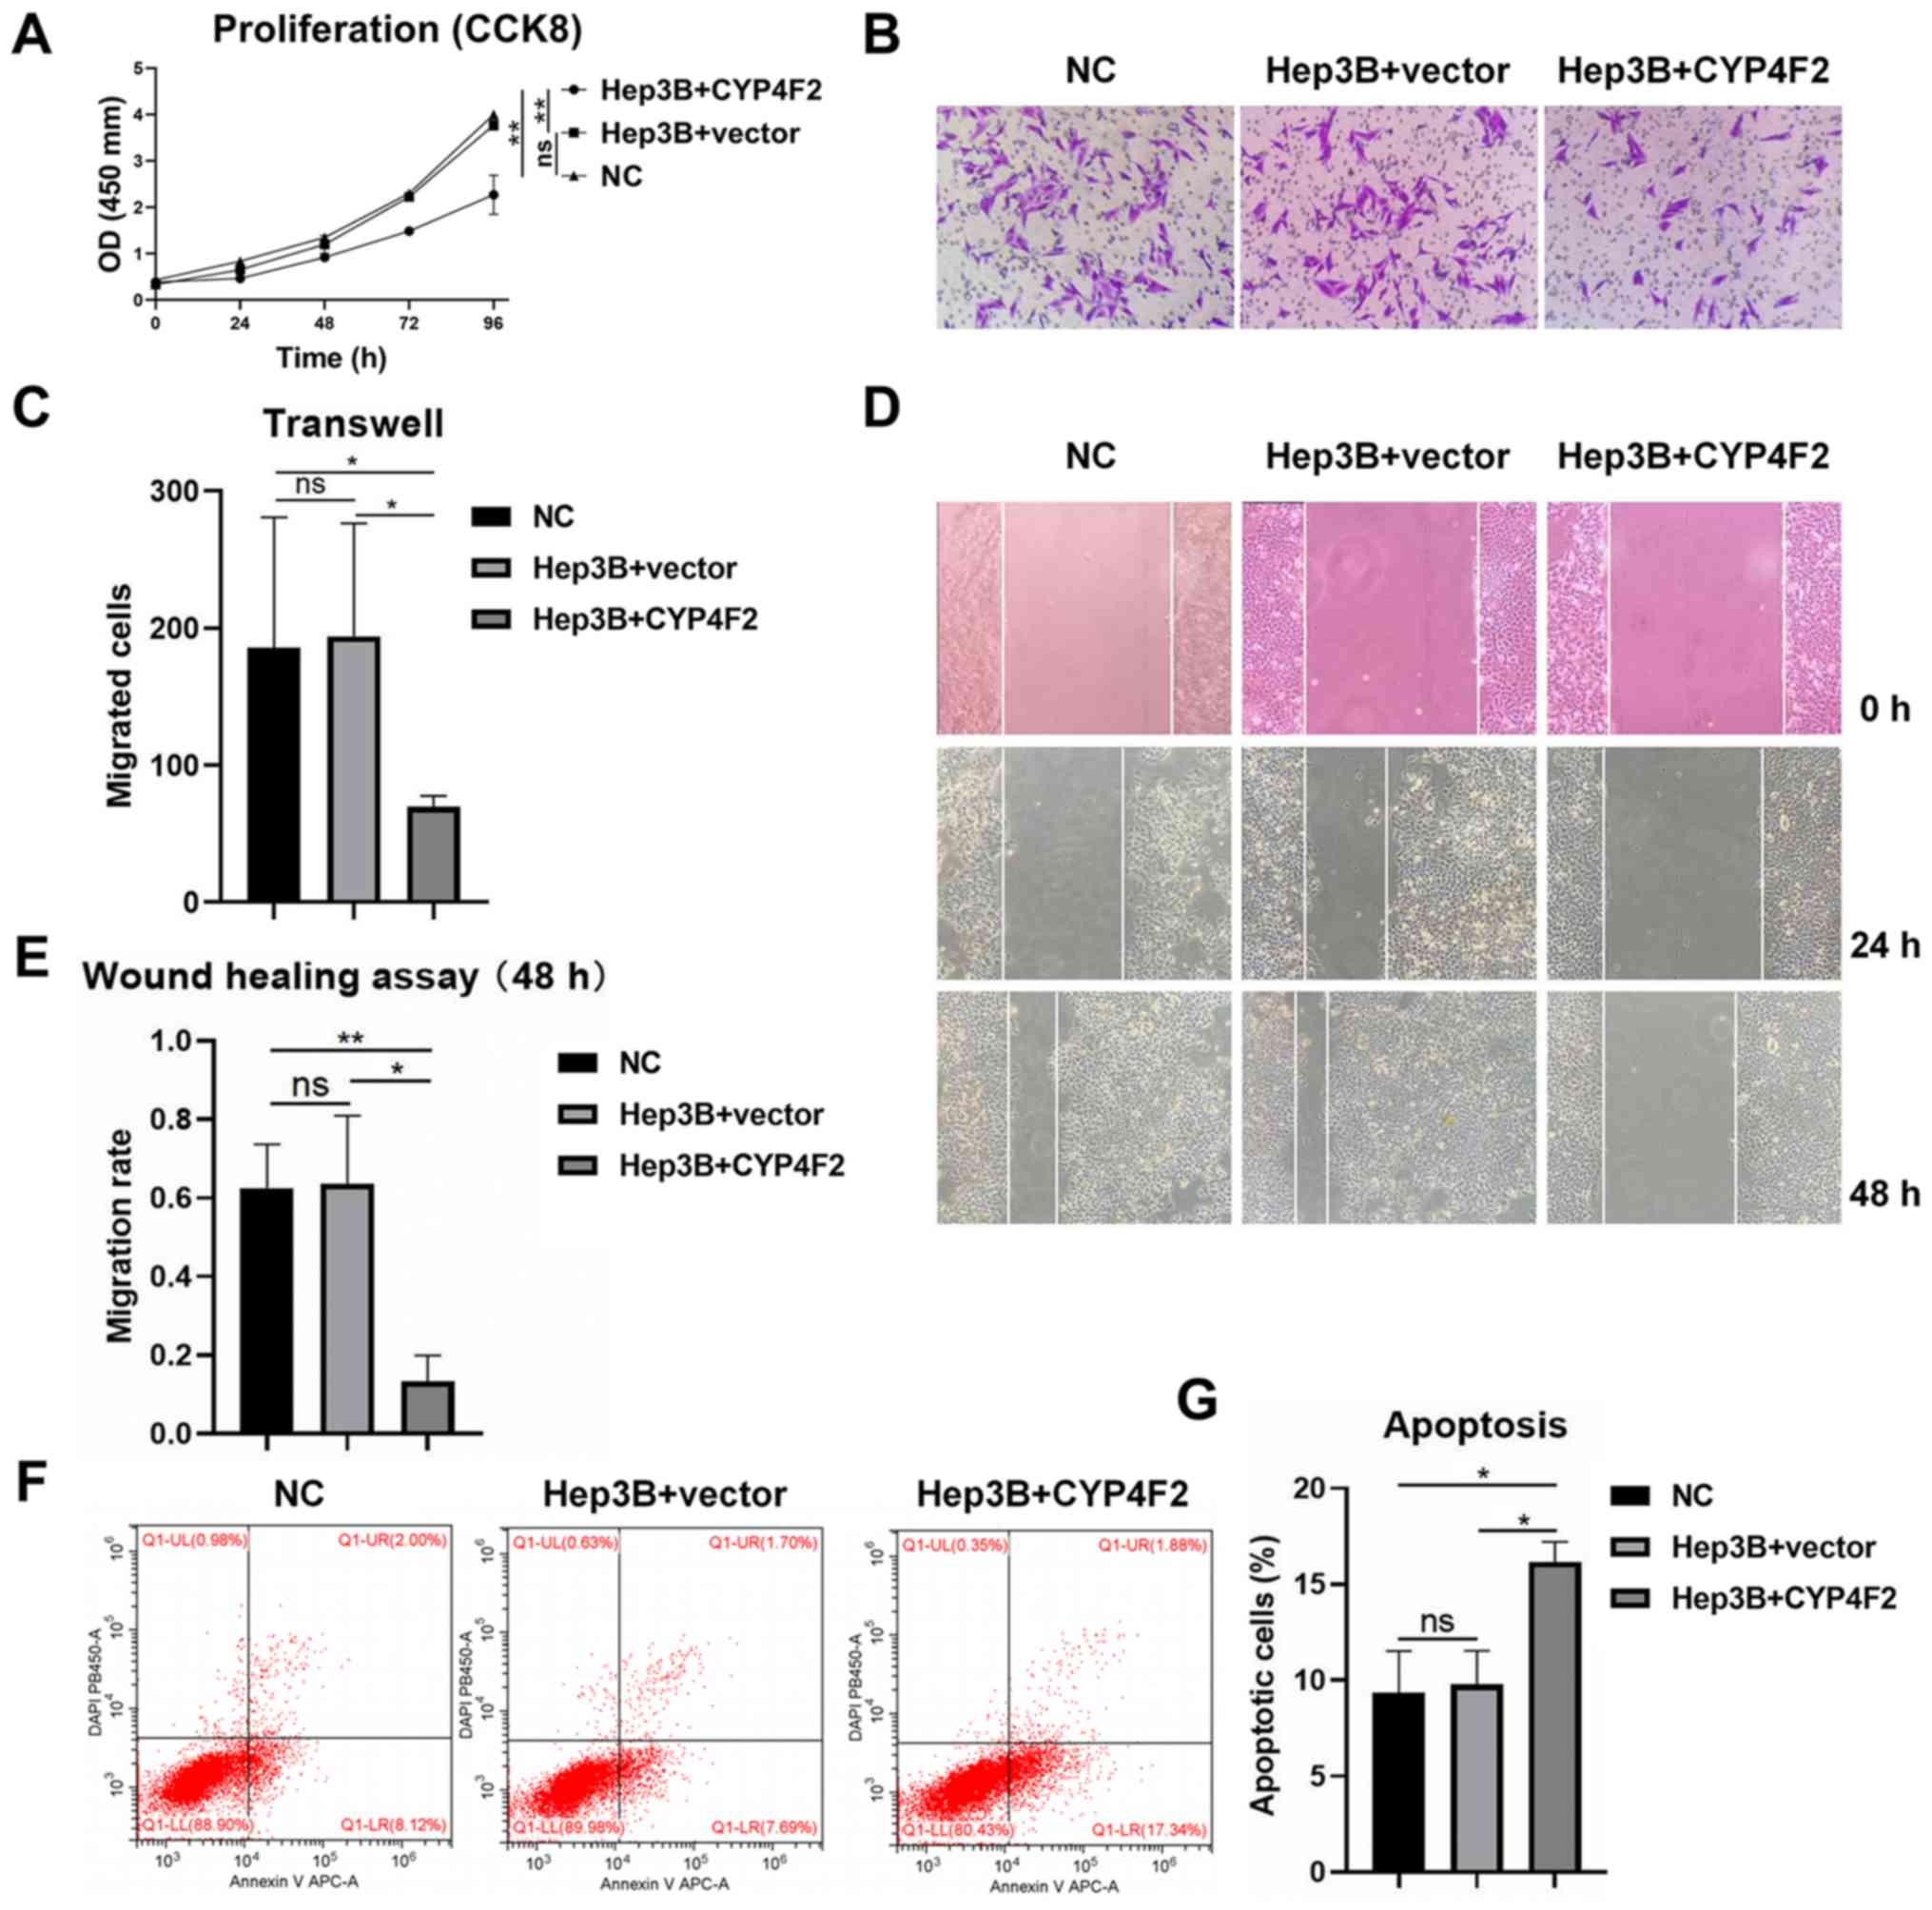
transfection with the CYP4F2 lentivirus (Fig. 4D-F). CYP4F2 overexpression
(Hep3B+CYP4F2) significantly reduced the proliferation of Hep3B
cells compared with negative control (Hep3B+vector) and normal
control (NC). as shown by the CCK-8 assays (Fig. 5A). In addition, cells in which CYP4F2
was overexpressed exhibited a lower migratory ability compared with
that in cells in the control group (negative control and empty
vector control) (Fig. 5B-E). The
present findings indicated that CYP4F2 may be required for the
metastasis of Hep3B cells. To determine the effects of CYP4F2
overexpression on the apoptosis of Hep3B cells, apoptosis was
determined using flow cytometry analysis. The apoptosis rate of
Hep3B cells was significantly higher in CYP4F2-overexpressing cells
compared with that in the control cells (negative control and empty
vector control) (Fig. 5F and G). The
present results indicated that CYP4F2 may serve a crucial role in
regulating Hep3B cell apoptosis.
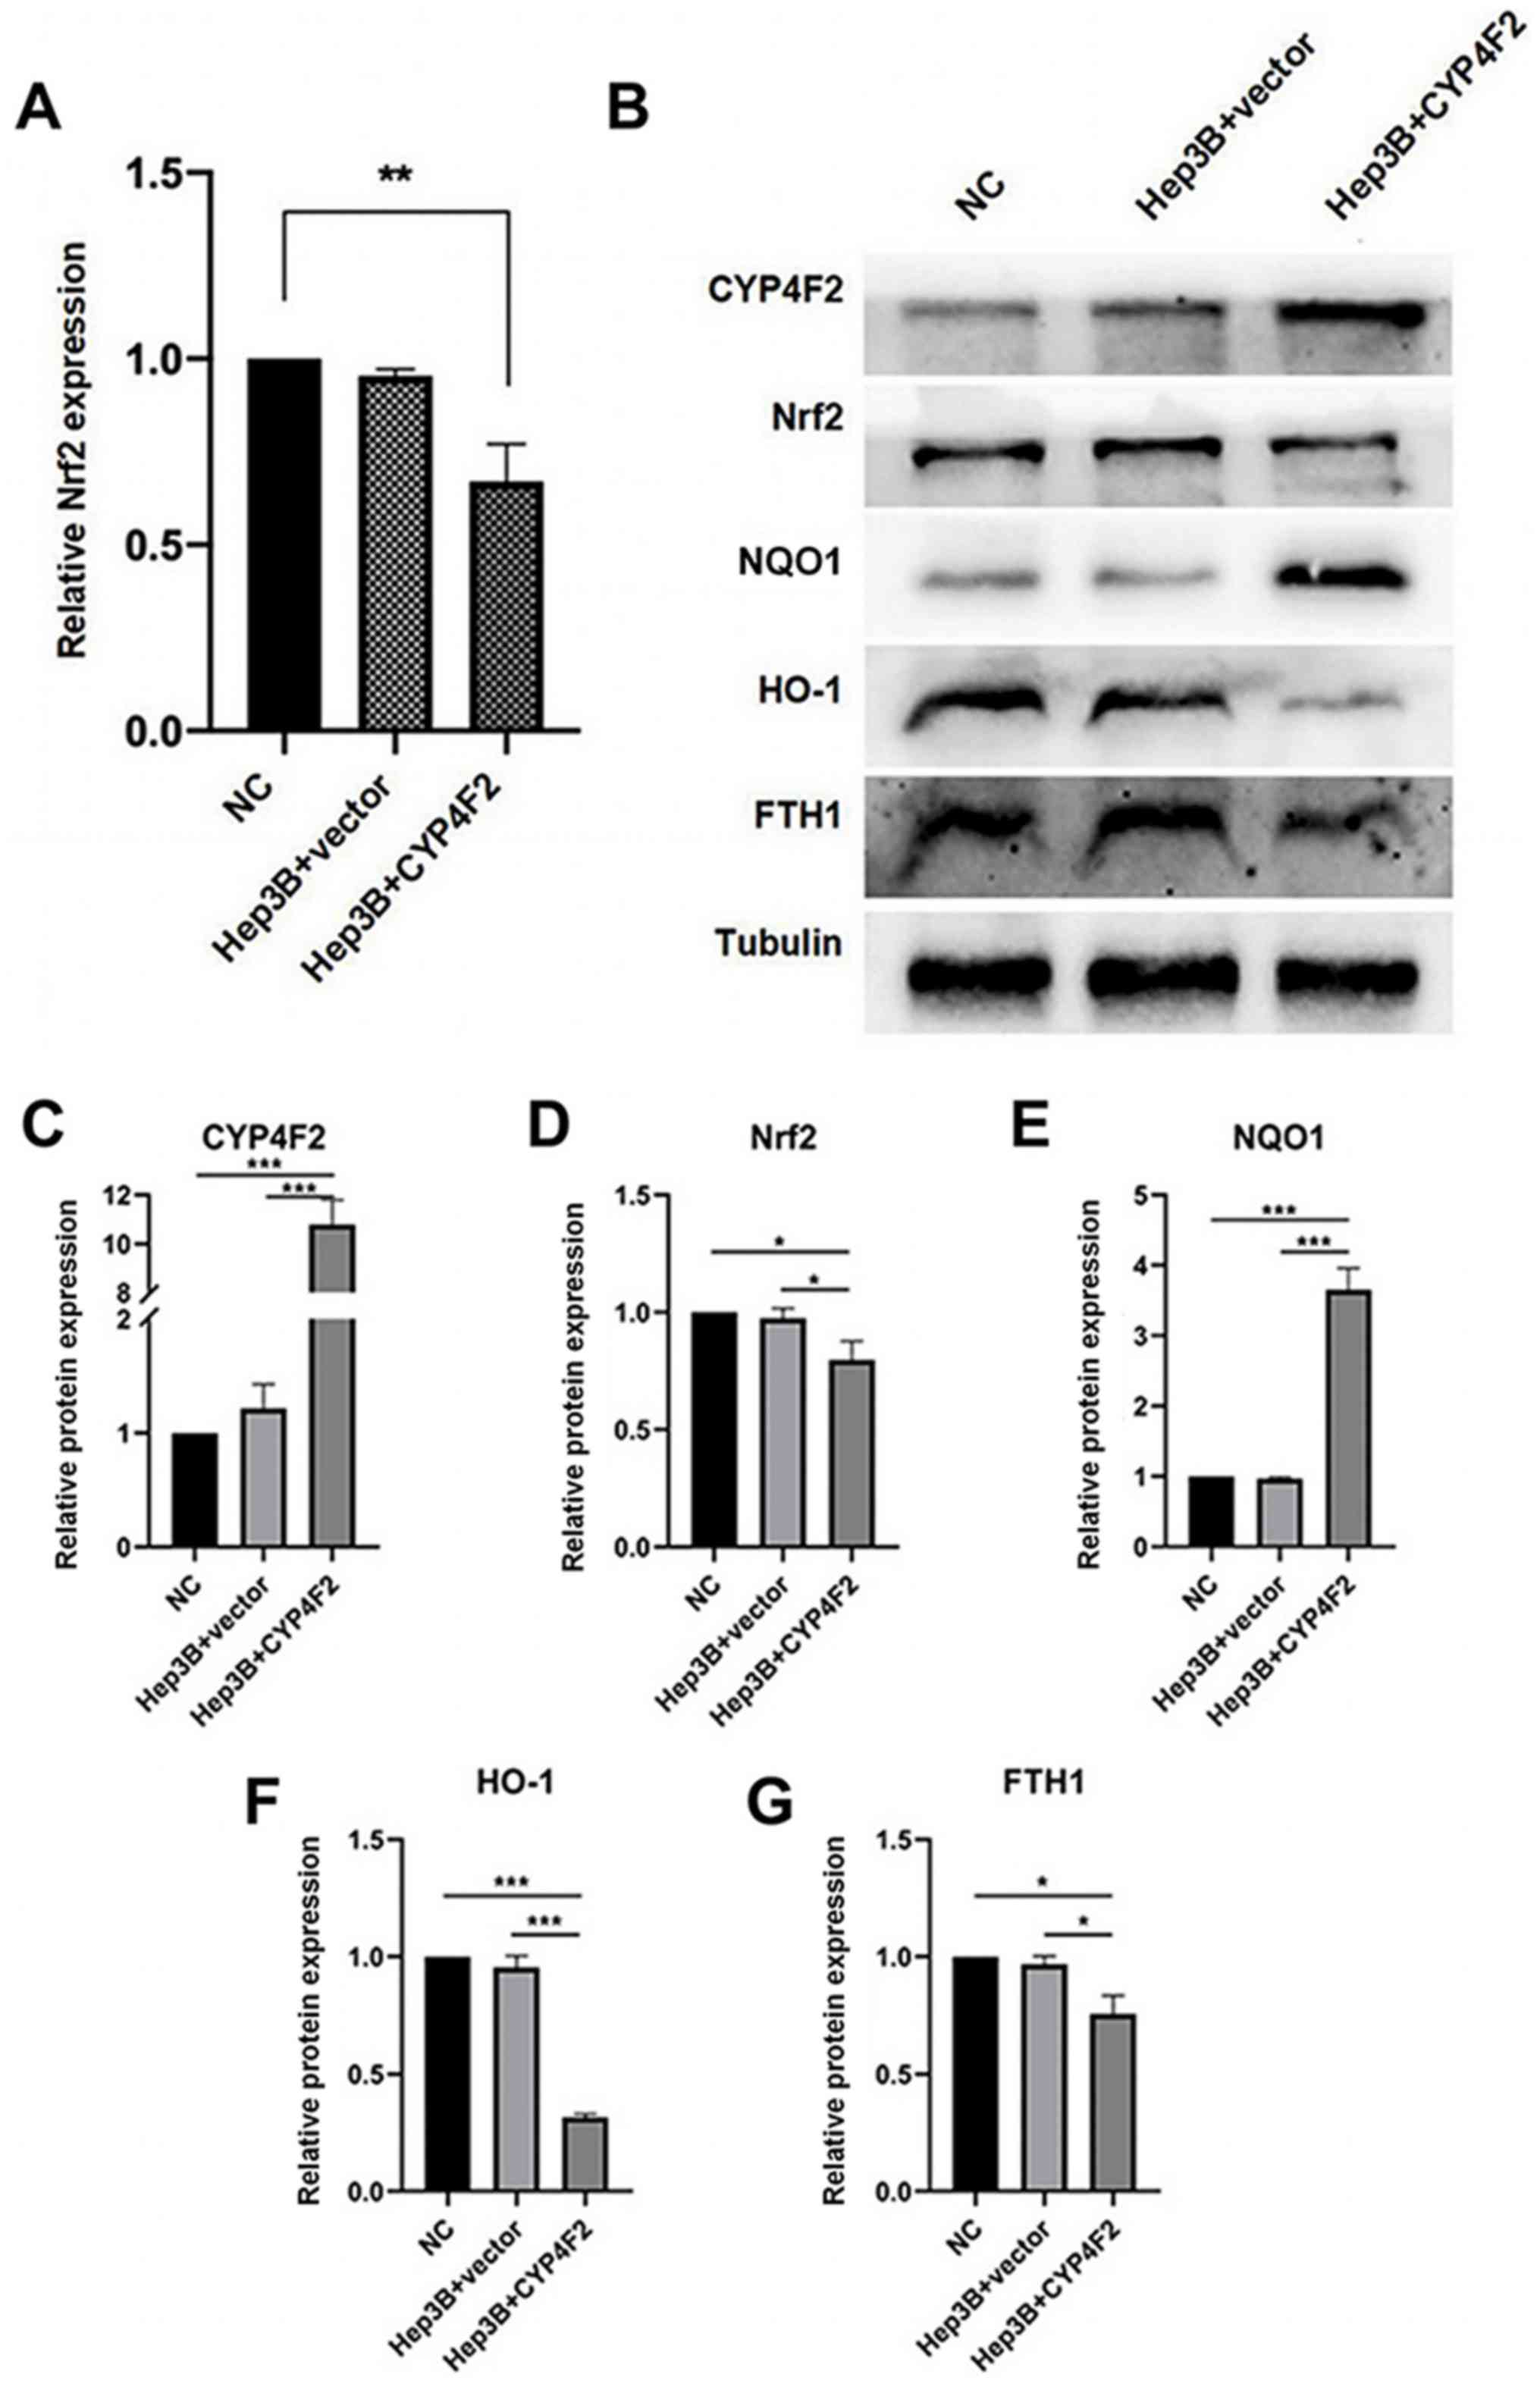
CYP4F2 overexpression inhibits the
Nrf2 signaling pathway in liver cancer cells
The role of CYP4F2 expression in liver cancer cells
was further investigated by analyzing the expression levels of Nrf2
and its downstream genes using western blot analysis (Fig. 6). The Nrf2-mediated antioxidant
signaling pathway serves an essential role in the motility of
cancer cells (29). As shown in
Fig. 6A-G, the protein expression
levels of Nrf2, heme oxygenase-1 (HO-1) and ferritin heavy chain 1
(FTH1) were significantly decreased following CYP4F2
overexpression, while the protein levels of NAD(P)H quinone
dehydrogenase 1 (NQO1) were significantly increased compared with
that in the controls, suggesting a molecular mechanism of CYP4F2
expression on cell proliferation, migration and apoptosis. The
present results demonstrated that CYP4F2 overexpression reversed
the malignant phenotypes of liver cancer cells via the
Nrf2-mediated antioxidant signaling pathway.
Discussion
In the present study, original data were downloaded
from the GSE63863 dataset, and 192 DEGs were identified between 11
HCC and matched non-tumor tissues using bioinformatic tools. The
functional annotation of these DEGs presented enrichment primarily
in chemical homeostasis, metabolic processes and immune responses.
By constructing a PPI network, eight genes were identified in the
top three modules. Among these eight genes, it was observed that
differential expression of 6 genes (SMYD3, ABAT, CYP4F2, GHR,
SLC22A3 and RNF41) was associated with poorer survival of patients
in TCGA HCC cohort. Therefore, the present study identified
potential key DEGs that may have clinical relevance, as prognostic
markers for the survival of patients with HCC.
KEGG and GO pathway enrichment analyses were
performed to further explore the functions of the 192 DEGs. The GO
results indicated that the upregulated DEGs were primarily involved
in the ‘daunorubicin metabolic process’ and ‘doxorubicin metabolic
process’. Recent studies have demonstrated that daunorubicin
interacts with lipid membrane mimetic models of cancer cells in
general (30) and that doxorubicin
efficacy is potentiated by the DNA repair inhibitor, DT01 in
preclinical animal models of HCC (31). The enriched GO terms of the
downregulated DEGs were primarily involved in ‘acute-phase
response’, ‘monooxygenase activity’ and ‘iron ion binding’.
According to a previous study, high levels of circulating
interleukin-6 were associated with the acute-phase response
(32). However, fixed hepatic
protein synthesis in patients with liver cancer has been found to
be decreased (33). Brodie et
al (34) revealed a highly
significant association between liver disease and environmental
factors (such as alcohol, high caffeine intake and smoking) on
hepatic monooxygenase activity. Iron ions may serve a role in the
carcinogenic process of transition metals, such as copper and
nickel (35). Furthermore, the DEGs
identified in the present study were significantly enriched in four
KEGG pathways: ‘Complement and coagulation cascades’, ‘retinol
metabolism’, ‘metabolic pathways’ and ‘Staphylococcus aureus
infection’. The glycolysis and gluconeogenesis pathways are
dysregulated exclusively in HCC, whereas the coagulation and
complement cascades, as well as threonine, serine and glycine
metabolism, are also differentially regulated in cholangiocarcinoma
(36). Notably, both hepatic
stellate cells and hepatocytes are involved in retinoid metabolism
(37). In addition, the severity of
liver failure has been associated with the high risk of
Staphylococcus aureus infection (38).
Potential key genes from the top three PPI modules,
including RNF41, SMYD3, FCGR2C, FCGR2B, ABAT, GHR, SLC22A3 and
CYP4F2, were identified. Among these genes, the differential
expression levels of 6 genes (SMYD3, ABAT, GHR, SLC22A3, RNF41 and
CYP4F2) were associated with poor survival in TCGA HCC cohort.
SMYD3 promotes the development of liver cancer and is a
transcriptional potentiator of multiple cancer-promoting genes,
such as liver and colon cancer (39). ABAT is involved in hormone
receptor-dependent regulation in breast cancer (40). The production of autocrine growth
hormone 1 leads to the hyperproliferation of mammary carcinoma
cells; in addition, transcriptional activation is enhanced through
the GHR (41). SLC22A3 belongs to
the amphiphilic solute facilitator family of integrated
transmembrane proteins and has been found to be involved in the
pharmacokinetics of catecholamine (42); and it was found that loss of SLC22A3
leads to increased proliferation and hepatocarcinogenesis of mice
liver tumors induced by stilbene nitrosamine and phenobarbital
(43).
CYP4F2 plays a critical role in the metabolism of
arachidonic acid, and 20-hydroxyeicosatetraeonic acid, vitamin E
and vitamin K (44). A previous
study (45) implicated CYP4F2
upregulation in the poor prognosis of patients with pancreatic
ductal adenocarcinoma, indicating its possible value as a biomarker
capable of predicting cancer progression, as well as prognosis.
However, there are limited studies on CYP4F2 in association with
HCC. A previous study demonstrated that the mRNA of CPY4F2 was
expressed at low levels in HCC (46)
and that its expression of mRNA was altered in conjunction with the
progression of HCV-associated HCC (47). However, this previous study (47) only analyzed the expression pattern of
CYP4F2 in a single HCV-HCC dataset and only predicted the
diagnostic and prognostic role of CYP4F2 expression in TCGA HCC
data. In addition, the function of CYP4F2 in HCC metastasis has not
been elucidated. In the present study, the impact of low CYP4F2
expression in HCC specimens and cells was analyzed. Furthermore, a
survival analysis on data from 180 patients with HCC obtained from
TCGA database was performed to examine the association between
CYP4F2 expression and prognosis. The present data revealed that low
expression levels of CYP4F2 was associated with a poor prognosis
compared with high expression levels. In addition, CYP4F2
overexpression inhibited the effects of HCC cell proliferation and
migration, and induced apoptosis. Therefore, the present results
suggested that CYP4F2 may be associated with the metastasis of
liver cancer cells and that it may serve a key role in HCC
tumorigenesis.
After determining the mRNA expression of CYP4F2 in
HepG2 cells, we found that CYP4F2 mRNA expression was significantly
upregulated in HepG2 cells compared with THLE-2 cells. It was
reported that HepG2 originated from hepatoblastoma (HB), not HCC
(48), so we hypothesized that some
differences in histological origin might cause HB's CYP4F2
expression to be different from HCC. However, as the purpose of
this study did not include finding the influencing factors that may
cause the difference in CYP4F2 expression between HB and HCC, we
have not conducted relevant explorations. Therefore, HepG2 cells
were not used for subsequent experiments. However, it was still
interesting, we might explore this in the future study.
The Nrf2 signaling pathway serves a critical role in
oxidative stress (49).
Nevertheless, a recent study suggested that activation of the Nrf2
signaling pathway promoted HCC cell survival and development
(50). Furthermore, the abnormal
high expression of the Nrf2 signaling pathway has been detected in
various malignancies, such as liver and breast cancer, and it is
involved in tumor proliferation and migration (51,52). In
the present study, CYP4F2 overexpression notably decreased the
expression levels of the Nrf2 gene, as well as those of its target
genes, including HO-1 and FTH1, and increased the expression levels
of NQO1, suggesting that CYP4F2 may act on the Nrf2 signaling
pathway.
In conclusion, the results of the present study
indicated that CYP4F2 may be an important prognostic biomarker for
predicting tumorigenesis and metastasis, as well as the long-term
survival rates of patients with HCC. In addition, CYP4F2 may
regulate the proliferation and migration of liver cancer cells.
Therefore, CYP4F2 may act as a potential biomarker for HCC with
prognostic value.
Acknowledgements
Not applicable.
Funding
The present study was supported by the China
Postdoctoral Science Found (grant no. 2019M653831XB), the Natural
Science Foundation of Chongqing (grant nos. cstc2019jcyj-msxmX0095,
cstc2019jcyj-msxmX0757 and CSTC2013jcyJA10105) and the National
Natural Science Young Foundation of China (grant nos. 81904218,
81704091 and 30972789).
Availability of data and materials
The datasets used and/or analyzed during the current
study are available from the corresponding author on reasonable
request and are also available in the Gene Expression Omnibus
repository, (https://www.ncbi.nlm.nih.gov/geo).
Authors' contributions
QP and SL conceived and designed the study. SW, QP,
GY and JK performed the majority of the experiments and wrote the
manuscript. All authors read and approved the manuscript and agree
to be accountable for all aspects of the research in ensuring that
the accuracy or integrity of any part of the work is appropriately
investigated and resolved.
Ethics approval and consent to
participate
Not applicable.
Patient consent for publication
Not applicable.
Competing interests
The authors declare that they have no competing
interests.
References
|
1
|
Bray F, Ferlay J, Soerjomataram I, Siegel
RL, Torre LA and Jemal A: Global cancer statistics 2018: GLOBOCAN
estimates of incidence and mortality worldwide for 36 cancers in
185 countries. CA Cancer J Clin. 68:394–424. 2018. View Article : Google Scholar : PubMed/NCBI
|
|
2
|
El-Serag HB: Epidemiology of viral
hepatitis and hepatocellular carcinoma. Gastroenterology.
142:1264–1273.e1. 2012. View Article : Google Scholar : PubMed/NCBI
|
|
3
|
Plummer M, de Martel C, Vignat J, Ferlay
J, Bray F and Franceschi S: Global burden of cancers attributable
to infections in 2012: A synthetic analysis. Lancet Glob Health.
4:e609–616. 2016. View Article : Google Scholar : PubMed/NCBI
|
|
4
|
Thorgeirsson SS and Grisham JW: Molecular
pathogenesis of human hepatocellular carcinoma. Nat Genet.
31:339–346. 2002. View Article : Google Scholar : PubMed/NCBI
|
|
5
|
Iizuka N, Oka M, Yamada-Okabe H, Mori N,
Tamesa T, Okada T, Takemoto N, Hashimoto K, Tangoku A, Hamada K, et
al: Differential gene expression in distinct virologic types of
hepatocellular carcinoma: Association with liver cirrhosis.
Oncogene. 22:3007–3014. 2003. View Article : Google Scholar : PubMed/NCBI
|
|
6
|
Ye QH, Qin LX, Forgues M, He P, Kim JW,
Peng AC, Simon R, Li Y, Robles AI, Chen Y, et al: Predicting
hepatitis B virus-positive metastatic hepatocellular carcinomas
using gene expression profiling and supervised machine learning.
Nat Med. 9:416–423. 2003. View
Article : Google Scholar : PubMed/NCBI
|
|
7
|
Tateishi R and Omata M; Nature Publishing
Group, : Hepatocellular carcinoma in 2011: Genomics in
hepatocellular carcinoma - a big step forward. Nat Rev
Gastroenterol Hepatol. 9:69–70. 2012. View Article : Google Scholar : PubMed/NCBI
|
|
8
|
Shibata T and Aburatani H: Exploration of
liver cancer genomes. Nat Rev Gastroenterol Hepatol. 11:340–349.
2014. View Article : Google Scholar : PubMed/NCBI
|
|
9
|
Nakagawa H and Shibata T: Comprehensive
genome sequencing of the liver cancer genome. Cancer Lett.
340:234–240. 2013. View Article : Google Scholar : PubMed/NCBI
|
|
10
|
Fujimoto A, Totoki Y, Abe T, Boroevich KA,
Hosoda F, Nguyen HH, Aoki M, Hosono N, Kubo M, Miya F, et al:
Whole-genome sequencing of liver cancers identifies etiological
influences on mutation patterns and recurrent mutations in
chromatin regulators. Nat Genet. 44:760–764. 2012. View Article : Google Scholar : PubMed/NCBI
|
|
11
|
Kan Z, Zheng H, Liu X, Li S, Barber TD,
Gong Z, Gao H, Hao K, Willard MD, Xu J, et al: Whole-genome
sequencing identifies recurrent mutations in hepatocellular
carcinoma. Genome Res. 23:1422–1433. 2013. View Article : Google Scholar : PubMed/NCBI
|
|
12
|
Guichard C, Amaddeo G, Imbeaud S, Ladeiro
Y, Pelletier L, Maad IB, Calderaro J, Bioulac-Sage P, Letexier M,
Degos F, et al: Integrated analysis of somatic mutations and focal
copy-number changes identifies key genes and pathways in
hepatocellular carcinoma. Nat Genet. 44:694–698. 2012. View Article : Google Scholar : PubMed/NCBI
|
|
13
|
Huang J, Zhao L, Yang P, Chen Z, Tang NZ,
Ruan X and Chen Y: Genome-Wide Transcriptome Analysis of CD36
Overexpression in HepG2.2.15 Cells to Explore Its Regulatory Role
in Metabolism and the Hepatitis B Virus Life Cycle. PLoS ONE.
11:e01647872016. View Article : Google Scholar : PubMed/NCBI
|
|
14
|
Pan Q, Long X, Song L, Zhao D, Li X, Li D,
Li M, Zhou J, Tang X, Ren H, et al: Transcriptome sequencing
identified hub genes for hepatocellular carcinoma by weighted-gene
co-expression analysis. Oncotarget. 7:38487–38499. 2016. View Article : Google Scholar : PubMed/NCBI
|
|
15
|
Zhang H, Weng X, Ye J, He L, Zhou D and
Liu Y: Promoter hypermethylation of TERT is associated with
hepatocellular carcinoma in the Han Chinese population. Clin Res
Hepatol Gastroenterol. 39:600–609. 2015. View Article : Google Scholar : PubMed/NCBI
|
|
16
|
Trapnell C, Pachter L and Salzberg SL:
TopHat: Discovering splice junctions with RNA-Seq. Bioinformatics.
25:1105–1111. 2009. View Article : Google Scholar : PubMed/NCBI
|
|
17
|
Langmead B, Trapnell C, Pop M and Salzberg
SL: Ultrafast and memory-efficient alignment of short DNA sequences
to the human genome. Genome Biol. 10:R252009. View Article : Google Scholar : PubMed/NCBI
|
|
18
|
Trapnell C, Williams BA, Pertea G,
Mortazavi A, Kwan G, van Baren MJ, Salzberg SL, Wold BJ and Pachter
L: Transcript assembly and quantification by RNA-Seq reveals
unannotated transcripts and isoform switching during cell
differentiation. Nat Biotechnol. 28:511–515. 2010. View Article : Google Scholar : PubMed/NCBI
|
|
19
|
Dennis G Jr, Sherman BT, Hosack DA, Yang
J, Gao W, Lane HC and Lempicki RA: DAVID: Database for Annotation,
Visualization, and Integrated Discovery. Genome Biol. 4:32003.
View Article : Google Scholar
|
|
20
|
Ashburner M, Ball CA, Blake JA, Botstein
D, Butler H, Cherry JM, Davis AP, Dolinski K, Dwight SS, Eppig JT,
et al The Gene Ontology Consortium, : Gene ontology: Tool for the
unification of biology. Nat Genet. 25:25–29. 2000. View Article : Google Scholar : PubMed/NCBI
|
|
21
|
Ogata H, Goto S, Sato K, Fujibuchi W, Bono
H and Kanehisa M: KEGG: Kyoto Encyclopedia of Genes and Genomes.
Nucleic Acids. 27:29–34. 1999. View Article : Google Scholar
|
|
22
|
Nepusz T, Yu H and Paccanaro A: Detecting
overlapping protein complexes in protein-protein interaction
networks. Nat Methods. 9:471–472. 2012. View Article : Google Scholar : PubMed/NCBI
|
|
23
|
Anaya J: OncoLnc: Linking TCGA survival
data to mRNAs, miRNAs, and lncRNAs. PeerJ Computer Science. PeerJ
Inc. 2:e672016.
|
|
24
|
Qiu P and Sheng J: A two-stage procedure
for comparing hazard rate functions. J R Stat Soc B. 70:191–208.
2008.
|
|
25
|
Uhlen M, Zhang C, Lee S, Sjöstedt E,
Fagerberg L, Bidkhori G, Benfeitas R, Arif M, Liu Z, Edfors F, et
al: A pathology atlas of the human cancer transcriptome. Science.
357:eaan25072017. View Article : Google Scholar : PubMed/NCBI
|
|
26
|
Livak KJ and Schmittgen TD: Analysis of
relative gene expression data using real-time quantitative PCR and
the 2(-Delta Delta C(T)) Method. Methods. 25:402–408. 2001.
View Article : Google Scholar : PubMed/NCBI
|
|
27
|
Das J and Yu H: HINT: High-quality protein
interactomes and their applications in understanding human disease.
BMC Syst Biol. 6:922012. View Article : Google Scholar : PubMed/NCBI
|
|
28
|
Johnson AL, Edson KZ, Totah RA and Rettie
AE: Cytochrome P450 ω-Hydroxylases in Inflammation and Cancer. Adv
Pharmacol. 74:223–262. 2015. View Article : Google Scholar : PubMed/NCBI
|
|
29
|
Raghunath A, Sundarraj K, Arfuso F, Sethi
G and Perumal E: Dysregulation of Nrf2 in Hepatocellular Carcinoma:
Role in Cancer Progression and Chemoresistance. Cancers (Basel).
10:4812018. View Article : Google Scholar
|
|
30
|
Alves AC, Ribeiro D, Horta M, Lima JLFC,
Nunes C and Reis S: The daunorubicin interplay with mimetic model
membranes of cancer cells: A biophysical interpretation. Biochim
Biophys Acta Biomembr. 1859:941–948. 2017. View Article : Google Scholar : PubMed/NCBI
|
|
31
|
Herath NI, Devun F, Herbette A, Lienafa
M-C, Chouteau P, Sun J-S, Dutreix M and Denys A: Potentiation of
doxorubicin efficacy in hepatocellular carcinoma by the DNA repair
inhibitor DT01 in preclinical models. Eur Radiol. 27:4435–4444.
2017. View Article : Google Scholar : PubMed/NCBI
|
|
32
|
Fearon KC, McMillan DC, Preston T,
Winstanley FP, Cruickshank AM and Shenkin A: Elevated circulating
interleukin-6 is associated with an acute-phase response but
reduced fixed hepatic protein synthesis in patients with cancer.
Ann Surg. 213:26–31. 1991. View Article : Google Scholar : PubMed/NCBI
|
|
33
|
Perlmutter DH, Dinarello CA, Punsal PI and
Colten HR: Cachectin/tumor necrosis factor regulates hepatic
acute-phase gene expression. J Clin Invest. 78:1349–1354. 1986.
View Article : Google Scholar : PubMed/NCBI
|
|
34
|
Brodie MJ, Boobis AR, Bulpitt CJ and
Davies DS: Influence of liver disease and environmental factors on
hepatic monooxygenase activity in vitro. Eur J Clin
Pharmacol. 20:39–46. 1981. View Article : Google Scholar : PubMed/NCBI
|
|
35
|
Toyokuni S: Iron-induced carcinogenesis:
The role of redox regulation. Free Radic Biol Med. 20:553–566.
1996. View Article : Google Scholar : PubMed/NCBI
|
|
36
|
Likhitrattanapisal S, Tipanee J and
Janvilisri T: Meta-analysis of gene expression profiles identifies
differential biomarkers for hepatocellular carcinoma and
cholangiocarcinoma. Tumour Biol. 37:12755–12766. 2016. View Article : Google Scholar : PubMed/NCBI
|
|
37
|
Shirakami Y, Lee S-A, Clugston RD and
Blaner WS: Hepatic metabolism of retinoids and disease
associations. Biochim Biophys Acta. 1821:124–136. 2012. View Article : Google Scholar : PubMed/NCBI
|
|
38
|
Bert F, Bellier C, Lassel L, Lefranc V,
Durand F, Belghiti J, Mentre F and Fantin B: Risk factors for
Staphylococcus aureus infection in liver transplant
recipients. Liver Transplant. 11:1093–1099. 2005. View Article : Google Scholar
|
|
39
|
Sarris ME, Moulos P, Haroniti A,
Giakountis A and Talianidis I: Smyd3 Is a Transcriptional
Potentiator of Multiple Cancer-Promoting Genes and Required for
Liver and Colon Cancer Development. Cancer Cell. 29:354–366. 2016.
View Article : Google Scholar : PubMed/NCBI
|
|
40
|
Jansen MPHM, Sas L, Sieuwerts AM, Van
Cauwenberghe C, Ramirez-Ardila D, Look M, Ruigrok-Ritstier K,
Finetti P, Bertucci F, Timmermans MM, et al: Decreased expression
of ABAT and STC2 hallmarks ER-positive inflammatory breast cancer
and endocrine therapy resistance in advanced disease. Mol Oncol.
9:1218–1233. 2015. View Article : Google Scholar : PubMed/NCBI
|
|
41
|
Kaulsay KK, Zhu T, Bennett W, Lee KO and
Lobie PE: The effects of autocrine human growth hormone (hGH) on
human mammary carcinoma cell behavior are mediated via the hGH
receptor. Endocrinology. 142:767–777. 2001. View Article : Google Scholar : PubMed/NCBI
|
|
42
|
Gründemann D, Schechinger B, Rappold GA
and Schömig E: Molecular identification of the
corticosterone-sensitive extraneuronal catecholamine transporter.
Nat Neurosci. 1:349–351. 1998. View
Article : Google Scholar : PubMed/NCBI
|
|
43
|
Vollmar J, Lautem A, Closs E, Schuppan D,
Kim YO, Grimm D, Marquardt JU, Fuchs P, Straub BK, Schad A, et al:
Loss of organic cation transporter 3 (Oct3) leads to enhanced
proliferation and hepatocarcinogenesis. Oncotarget.
8:115667–115680. 2017. View Article : Google Scholar : PubMed/NCBI
|
|
44
|
Alvarellos ML, Sangkuhl K, Daneshjou R,
Whirl-Carrillo M, Altman RB and Klein TE: PharmGKB summary: Very
important pharmacogene information for CYP4F2. Pharmacogenet
Genomics. 25:41–47. 2015. View Article : Google Scholar : PubMed/NCBI
|
|
45
|
Gandhi AV, Saxena S, Relles D, Sarosiek K,
Kang CY, Chipitsyna G, Sendecki JA, Yeo CJ and Arafat HA:
Differential expression of cytochrome P450 omega-hydroxylase
isoforms and their association with clinicopathological features in
pancreatic ductal adenocarcinoma. Ann Surg Oncol. 20 (Suppl
3):S636–S643. 2013. View Article : Google Scholar : PubMed/NCBI
|
|
46
|
Eun HS, Cho SY, Lee BS, Seong I-O and Kim
K-H: Profiling cytochrome P450 family 4 gene expression in human
hepatocellular carcinoma. Mol Med Rep. 18:4865–4876.
2018.PubMed/NCBI
|
|
47
|
Tsunedomi R, Iizuka N, Hamamoto Y,
Uchimura S, Miyamoto T, Tamesa T, Okada T, Takemoto N, Takashima M,
Sakamoto K, et al: Patterns of expression of cytochrome P450 genes
in progression of hepatitis C virus-associated hepatocellular
carcinoma. Int J Oncol. 27:661–667. 2005.PubMed/NCBI
|
|
48
|
López-Terrada D, Cheung SW, Finegold MJ
and Knowles BB: Hep G2 is a hepatoblastoma-derived cell line. Hum
Pathol. 40:1512–1515. 2009. View Article : Google Scholar
|
|
49
|
Ma Q: Role of nrf2 in oxidative stress and
toxicity. Annu Rev Pharmacol Toxicol. 53:401–426. 2013. View Article : Google Scholar : PubMed/NCBI
|
|
50
|
Li R, Jia Z and Zhu H: Regulation of Nrf2
Signaling. React Oxyg Species (Apex). NIH Public Access. 8:312–322.
2019.
|
|
51
|
Zhang M, Zhang C, Zhang L, Yang Q, Zhou S,
Wen Q and Wang J: Nrf2 is a potential prognostic marker and
promotes proliferation and invasion in human hepatocellular
carcinoma. BMC Cancer. 15:531–12. 2015. View Article : Google Scholar : PubMed/NCBI
|
|
52
|
Ryoo I-G, Choi B-H, Ku S-K and Kwak M-K:
High CD44 expression mediates p62-associated NFE2L2/NRF2 activation
in breast cancer stem cell-like cells: Implications for cancer stem
cell resistance. Redox Biol. 17:246–258. 2018. View Article : Google Scholar : PubMed/NCBI
|