Introduction
Liquid biopsy is often used as a technique for
detecting biomarkers in body fluids, including blood, urine,
saliva, pleural effusions, ascites and cerebrospinal fluid
(1). Human body fluids contain
biologic materials such as cell-free DNA and RNA, proteins, cells
and vesicles (1). These materials
can be representative of the tissues from which they originated,
and thus liquid biopsy has the potential to be used instead of
tissue-based biopsy in clinical practice and for research purposes.
In addition, liquid biopsy allows clinicians to perform biopsies
repeatedly and non-invasively.
Circulating tumor cells (CTCs) are tumor cells
derived from primary tumors and/or metastatic lesions, and
circulate freely in peripheral blood (2). CTCs have characteristics specific to
their tumor of origin (2) and can
migrate to the circulatory system causing metastasis (3). Recently, many studies have described
the potential applications of CTCs in the diagnosis, evaluation of
treatment response, and targeted therapy of cancer (4–8).
Multiple technologies have been developed to detect
and isolate CTCs, but quality detection of CTCs remains a central
problem in the study of CTCs. Most detection methods are based on
the detection of epithelial cell adhesion molecule (EpCAM),
cytokeratin, and lack of the leukocyte common antigen CD45
(3). Furthermore, CTCs can be sorted
based on physical characteristics such as size, density,
deformability, and electrical charge (1). The CellSearch® system is an
automated EpCAM-based system and is the only technology approved by
the US Food and Drug Administration in a detection of CTCs for the
clinical use (3). Although the
CellSearch® system is considered the standard method for
the detection of CTCs, several issues still exist regarding this
system. Not all CTCs express EpCAM (2), and CTCs are heterogeneous among cancer
type and even within individuals (3). Moreover, CTCs isolated by the
CellSearch® system are fixed and unavailable for
functional analysis (9). Thus, there
is a need to develop more specific and efficient methods to
distinguish viable CTCs from other cells.
The melanoma antigen encoding gene (MAGE)
family is known to encode tumor-specific antigenic peptides
(10) and is dysregulated in many
cancers (11), and the human
telomerase reverse transcriptase (hTERT) gene is also known
to be expressed in most cancer cells (12). In our previous study, we used reverse
transcription-quantitative polymerase chain reaction (RT-qPCR) of
the MAGE A1-6 and the hTERT genes to detect CTCs in
blood, and our results showed good sensitivity and specificity
(13).
It has been suggested that ex vivo culture
and characterization of CTCs may be utilized in the study of cancer
metastasis and patient-derived tumor models (7,9), and in
recent years, several studies have shown the results of CTCs
culture in different culture conditions (7,14–17). Liu
et al (18) showed that small
numbers of cells can be cultured effectively by generating
conditionally reprogrammed cell (CRC) (18). Conditional reprogramming (CR) is a
cell culture technique culturing patient-derived cells with feeder
cells and a Rho kinase (ROCK) inhibitor (18). Recently, Zheng et al (19) investigated CRC culture method that is
efficient for the culture of CTCs in vitro and showed that
the cultured cells preserve their original phenotype. Detection of
CTCs using CRC cultures appears to be a very efficient alternative
method, but a significant amount of research is still required.
In this study, we aimed to verify the efficacy of a
CRC culture method for the detection of CTCs. Further, to enhance
the detection rate of CTCs, we utilized a joint method combining
CRC culture with RT-PCR of the MAGE A1-6 and the
hTERT genes in blood.
Materials and methods
Patients and specimens
A total of 34 patients with breast cancer who had
undergone surgery at Daegu Catholic University Hospital (Daegu,
Korea) were included. To detect CTCs and analyze RNA levels of
target genes, two 6-ml samples of peripheral blood were drawn into
ethylenediaminetetraacetic acid (EDTA) coated tubes from each
patient before surgery. Specimens were stored at 4°C until further
analysis. All data were recorded prospectively, and the
clinicopathologic characteristics of the patients were evaluated
from medical records. Cancer staging was assessed according to the
7th edition of the American Joint Committee on Cancer staging
manual for breast cancer. Written informed consent was obtained
from all patients according to the protocol approved by the
Institutional Review Board of the School of Medicine, Catholic
University of Daegu.
CTCs isolation
To detect CTCs, we collected peripheral blood
mononuclear cells (PBMC) after red blood cells (RBCs) lysis from
the blood. CTCs were isolated by negative immunomagnetic separation
technology (20) using the CD45
antibody capture system as previously described (13). Briefly, the RBCs were lysed with RBC
lysis buffer (Roche Diagnostics GmbH). Following RBC lysis, the
cells were resuspended in 80 µl of CD45 binding buffer and reacted
with 20 µl of microbeads conjugated to monoclonal antihuman CD45
antibodies (cat. no. 130 045 801; Miltenyi Biotec GmbH) for 15 min
at 4°C. The CD45+ cells were captured using a magnetic
separator, and the CD45 cells were eluted and collected.
RNA extraction
Total RNA of PBMCs was extracted from one blood
sample using the RNeasy Mini kit (Qiagen AB), or TRIzol™ reagent
(cat. no. 15596026; Invitrogen (Carlsbad); Thermo Fisher
Scientific, Inc.) and TRIzol Plus kits (Invitrogen; Thermo Fisher
Scientific, Inc.) according to the manufacturer's instruction.
Briefly, the samples were lysed and homogenized in 1 ml of TRIzol™
reagent, and then incubated for 5 min at room temperature.
Chloroform (0.2 ml) was added to the samples in TRIzol™ reagent,
and incubated for 2–3 min at room temperature. After centrifugation
for 5 min at 12,000 × g at 4°C, RNA in the samples was precipitated
by adding isopropanol. The samples were washed with 1 ml of 75%
ethanol and the supernatant was discarded after the centrifugation.
RNA was then dissolved with RNase free water and 0.5% SDS solution.
RNA yield was determined by measuring absorbance at 260 and 280
nm.
Reverse transcription polymerase chain
reaction (RT PCR)
RNA extracted from PBMC was then amplified for the
hTERT and the MAGE A1-6 genes following the method
described in previous studies (13,21).
Briefly, extracted RNA was reverse transcribed using the ImProm-II
Reverse Transcription System (Promega Corporation) according to the
manufacturer's protocol. The hTERT and the MAGE A1-6
genes were amplified using the LightCycler FastStart DNA Master
System (Roche Diagnostics GmbH) according to the manufacturer's
instruction, and detection was performed using the LightCycler 2.0
(Roche Diagnostics GmbH). The GAPDH gene was used as a
housekeeping gene for normalization. Each experiment was
independently repeated at least three times.
CRC culture of CTCs
From the remaining blood sample, we collected CTCs
and cultured them according to the CR protocol (22) for 4 weeks. Before CRC culture of CTCs
in patients' blood samples, a reproducibility experiment of CRC
culture was performed using a cell line. According to the CRC
culture method, CR cell lines are generated from tissue samples
using co-culture with irradiated J2 feeder cells (irradiated Swiss
3T3 J2 mouse fibroblast cells) and Y-27632 (ROCK inhibitor)
(22). Briefly, before co-culture,
Swiss-3T3-J2 mouse fibroblasts were cultured to generate feeder
cells and then isolated CTCs were plated in F medium containing J2
feeder cells and Y-27632 (cat. no. 270–333M025, Enzo Life Sciences,
Lausen, Switzerland). F medium was made by mixing Dulbecco's
modified Eagle's medium (DMEM) (Invitrogen, Gaithersburg, MD), 5%
fetal bovine serum (Gibco; Thermo Fisher Scientific, Inc.),
l-glutamine (Gibco; Thermo Fisher Scientific, Inc.),
penicillin/streptomycin mix (Gibco), F12 nutrient mix (cat. no.
11765-054, Gibco), 25 ng/ml hydrocortisone (Sigma-Aldrich), 0.125
ng/ml epidermal growth factor (EGF) (Invitrogen; Thermo Fisher
Scientific, Inc.), 5 µg/ml insulin (Sigma-Aldrich), 250 ng/ml
amphotericin B (Thermo Fisher Scientific), 10 µg/ml gentamicin
(Gibco; Thermo Fisher Scientific, Inc.) and 0.1 nM cholera toxin
(Sigma-Aldrich). All cells were maintained at 37°C in a cell
culture incubator with 95% humidity and 5% CO2. The
experiment was independently repeated at least three times.
We identified cells grown in the culture plates and
the cells were defined as CTCs grown by CRC culture, because the
lifespan of CTCs is short and most of CTCs cannot survive for a
long time after isolation, and would only be present if they were
able to grow in culture condition. Following culture of CTCs by CRC
culture methods, culture plates were treated with 1ml of TRIzol™
reagent and total RNA was extracted as above. Then, the
hTERT and the MAGE A1-6 genes were amplified and
analyzed using RNA extracted from cultured CTCs.
Statistical analysis
Statistical analysis was performed using SPSS
software (version 15.0; SPSS, Inc.). CTCs were defined as cells
isolated by negative immunomagnetic separation with positive
expression of the MAGE A1-6 or the hTERT gene. The
detection rate was defined as the percentage of samples with
positive CTCs among all samples included in the analysis. The gene
expression rates were defined as the percentage of samples with
positive expression of the MAGE A1-6 or the hTERT
gene among all samples included in the analysis. We collected two
sets of blood to test for CTC detection. For the first set of
blood, we used RT-PCR of the MAGE A1-6 and hTERT
genes and for the second set of blood we performed CRC culture and
analyzed RT-PCR of the MAGE and hTERT genes in the
CRC-cultured CTCs. We defined detection of CTCs as positive
expression of the genes by either RT-PCR only or the CRC culture
method. The Pearson's Chi-square test was used to compare the
detection rate of CTCs using RT-PCR of the MAGE A1-6 and
hTERT genes, and the CRC culture method. The association
between CTC detection methods and clinicopathologic characteristics
was analyzed using Student's t-test for continuous parameters and
the Pearson's Chi-square test for categorical data. Analysis of
variance (ANOVA; parametric test) or non-parametric Kruskal-Wallis
test was performed to compare continuous data of multiple groups.
Multiple comparisons tests were performed when there were
statistically significant differences between groups. A Bonferroni
correction was applied as the post hoc test. All tests were two
tailed. P<0.05 was considered to indicate a statistically
significant difference.
Results
Clinicopathologic characteristics of
the patients
The mean age of the patients was 57.2±12.0 years
(mean ± standard deviation; range, 39–82). Among 34 patients, 30
patients had invasive ductal carcinoma, while the others were one
each of mucinous carcinoma, metaplastic carcinoma, malignant
phyllodes tumor and ductal carcinoma in situ. Most of
patients with breast cancer were in an early stage, while 1 patient
had metastatic breast cancer in the spine. Table I shows patients' clinicopathologic
characteristics.
 | Table I.Patient characteristics. |
Table I.
Patient characteristics.
| Clinicopathologic
variables | Value |
|---|
| Age (years), mean ±
standard deviation (range) | 57.2±12.0
(39–82) |
| Tumor size (cm),
mean ± standard deviation (range) | 1.8±1.3
(0.4-7.5) |
| Histologic grade, n
(%) |
| I | 4
(11.8) |
| II | 12 (35.3) |
|
III | 18 (52.9) |
| Lymph node
metastasis, n (%) |
|
Negative | 22 (64.7) |
|
Positive | 12 (35.3) |
| Stage, n (%) |
| 0 | 1
(2.9) |
| I | 16 (47.1) |
| II | 11 (32.4) |
|
III | 5
(14.7) |
| IV | 1
(2.9) |
| Lymphovascular
invasion, n (%) |
|
Negative | 24 (70.6) |
|
Positive | 10 (29.4) |
| ER, n (%) |
|
Negative | 12 (35.3) |
|
Positive | 22 (64.7) |
| PR, n (%) |
|
Negative | 12 (35.3) |
|
Positive | 22 (64.7) |
| HER2
overexpression, n (%) |
|
Negative | 27 (79.4) |
|
Positive | 7
(20.6) |
| Ki-67, n (%) |
|
<14% | 6
(17.6) |
|
≥14% | 28 (82.4) |
| Molecular subtype,
n (%) |
| Luminal
A | 5
(14.7) |
| Luminal
B | 18 (52.9) |
|
HER2 | 4
(11.8) |
|
Basal-like | 7
(20.6) |
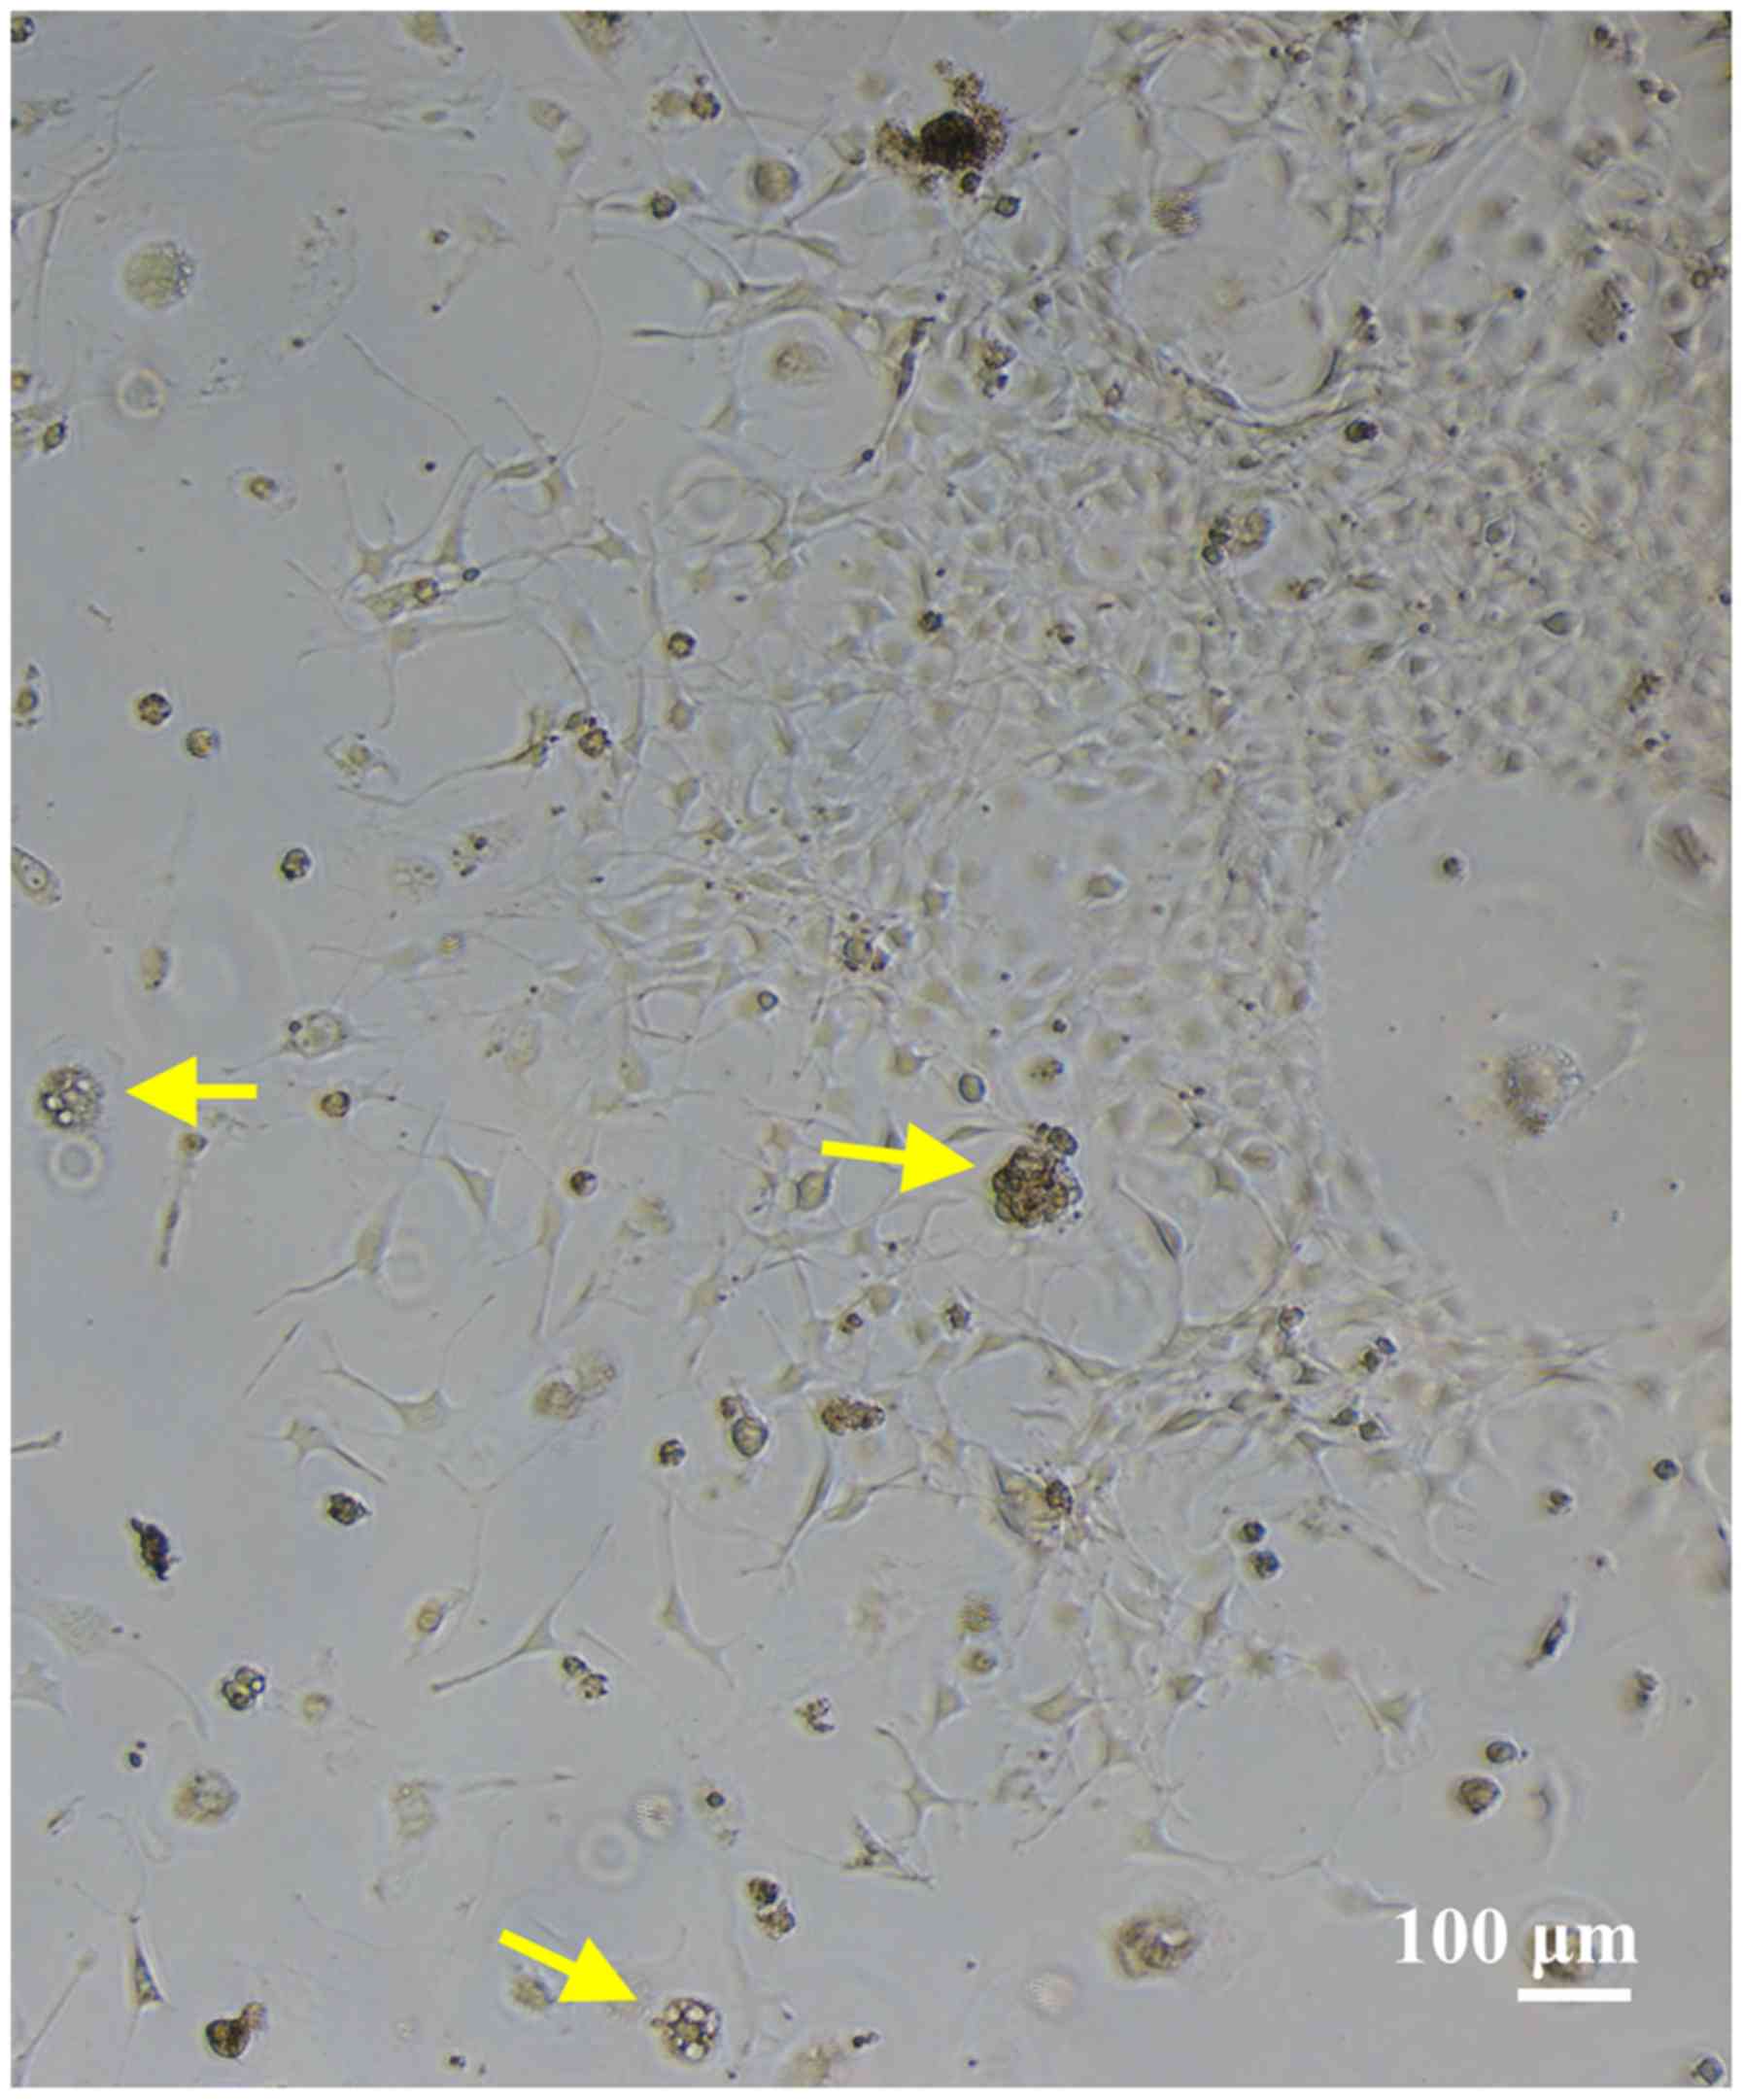
CRC culture of CTCs
CRC culture was carried out on 30 samples except 4
samples lacking sufficient quantity. Following CRC culture, grown
CTCs were observed in 7 out of 30 samples (23.3%). Among the
samples with growth of CTCs after CRC culture, 4 samples showed
positive expression for the hTERT and the MAGE A1-6
genes. The minimum number of cells in the culture plates after CRC
culture was 6 cells. Fig. 1 shows
the representative CTCs cultured using CRC culture method and the
cultured cells were confirmed as cancer cells.
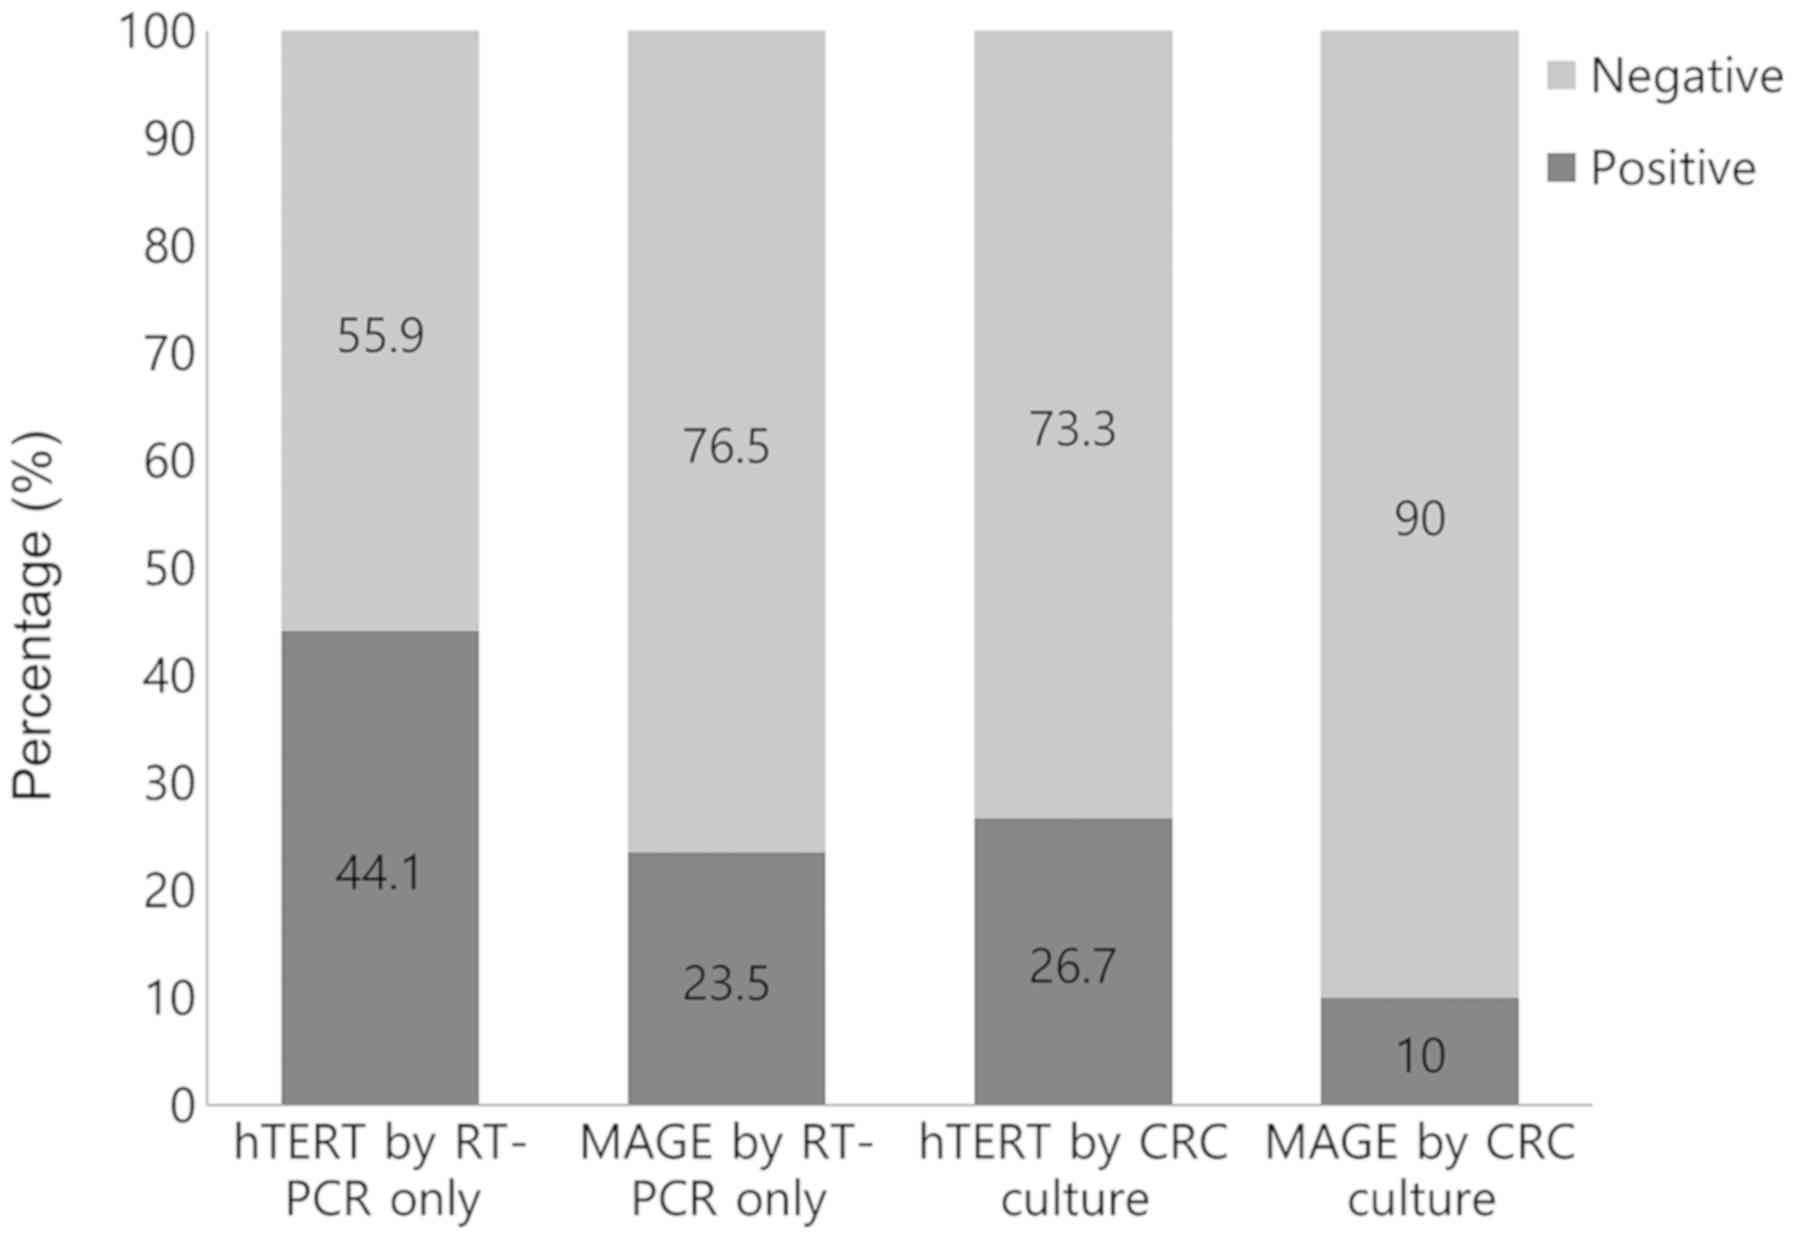
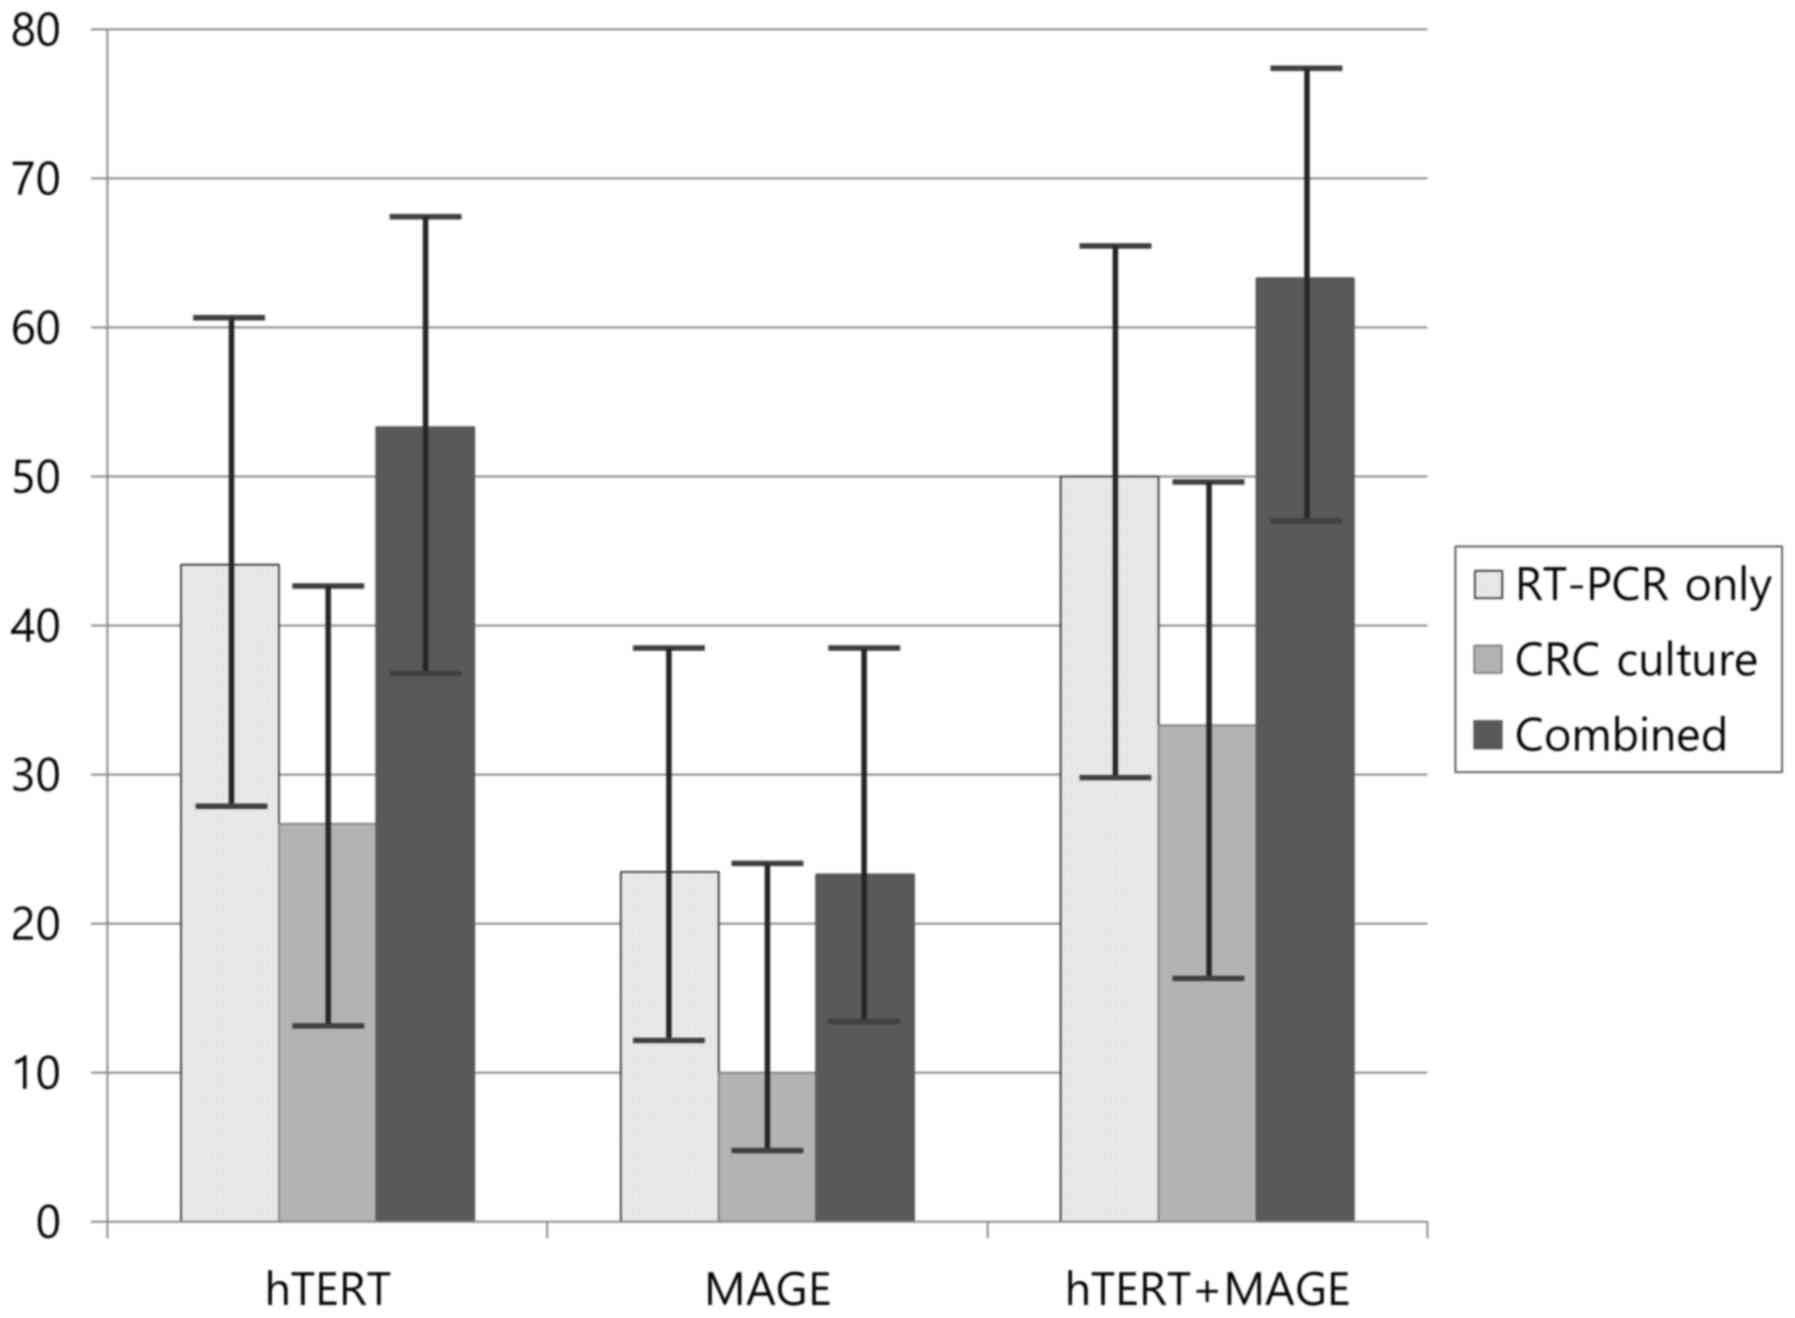
Comparison of CTC detection rates by
methods
The positive expression rates for the hTERT, MAGE
A1-6 genes and combination of hTERT and MAGE A1-6
genes in CTCs assessed by RT-PCR only were 15 out of 34 (44.1%), 8
out of 34 (23.5%) and 17 out of 34 (50%), respectively (Figs. 2 and 3). In contrast, CTC detection rates by
RT-PCR for the hTERT, MAGE A1-6 genes and combination of
hTERT and MAGE A1-6 genes in CTCs grown using CRC
culture were 8 out of 30 (26.7%), 3 out of 30 (10.0%) and 10 out of
30 (33.3%), respectively. The expression of the GAPDH gene
was 100%. When combining the positive expression rates of RT-PCR
only and CRC culture for the hTERT and MAGE A1-6
genes, CTC detection rates increased to 16 out of 30 (53.3%,
P=0.052) and 7 out of 30 (23.3%, P=0.304), respectively. Also, when
combining the positive expression rates of both genes by either
method, CTC detection rate was 19 out of 30 (63.3%), the highest
value observed (P=0.066) (Fig. 3).
Specifically, in 30 specimens subjected to CRC culture, 5 showed
positive expression of the hTERT or MAGE A1-6 gene,
although the expression of both genes in the same patients were
negative by RT-PCR only.
Association of CTC detection rate with
clinicopathologic characteristics by methods
When comparing CTC detection rates between RT-PCR
only and CRC culture according to clinicopathologic characteristics
of the patients, the positive expression of the MAGE A1-6
gene by RT-PCR only was significantly associated with higher breast
cancer stage and molecular subtype of breast cancer (P=0.006 and
P=0.039, respectively) (Table II).
Also, when combining two methods of RT-PCR only and CRC culture,
the positive expression rates of the hTERT and MAGE
A1-6 genes were significantly higher in stage III or IV breast
cancer than in stage I or II breast cancer (P=0.032 and P=0.032,
respectively) (Tables II and
III). There was no association
between the combined positive expression of both genes and
clinicopathologic characteristics (data not shown).
| Table II.Association between gene expression
levels of MAGE A1-6 of circulating tumor cells and
clinicopathological characteristics according to the detection
methods in breast cancer. |
Table II.
Association between gene expression
levels of MAGE A1-6 of circulating tumor cells and
clinicopathological characteristics according to the detection
methods in breast cancer.
|
| RT-PCR
onlya (n=34) | CRC
cultureb (n=30) |
Combinationc (n=33) |
|---|
|
|
|
|
|
|---|
| Clinicopathological
variables | Positive
expression, n (%) | P-value | Positive
expression, n (%) | P-value | Positive
expression, n (%) | P-value |
|---|
| Tumor size, n
(%) |
| ≤2
cm | 4 (17.4) | 0.222 | 1 (4.8) | 0.144 | 5 (22.7) | 0.181 |
| >2
cm | 4 (36.4) |
| 2 (22.2) |
| 5 (45.5) |
|
| Histologic grade, n
(%) |
| I | 2 (50.0) | 0.389 | 0 (0.0) | 0.574 | 2 (50.0) | 0.637 |
| II | 2 (16.7) |
| 2 (16.7) |
| 3 (25.0) |
|
|
III | 4 (22.2) |
| 1 (6.7) |
| 5 (29.4) |
|
| LN metastasis, n
(%) |
|
Negative | 3 (13.6) | 0.066 | 3 (14.3) | 0.232 | 5 (23.8) | 0.283 |
|
Positive | 5 (41.7) |
| 0 (0.0) |
| 5 (41.7) |
|
| Stage, n (%) |
| I,
II | 4 (14.3) | 0.006d | 3 (11.5) | 0.474 | 6 (22.2) | 0.032d |
| III,
IV | 4 (66.7) |
| 0 (0.0) |
| 4 (66.7) |
|
| LVI, n (%) |
|
Negative | 5 (20.8) | 0.666 | 2 (9.5) | 0.894 | 6 (26.1) | 0.444 |
|
Positive | 3 (30.0) |
| 1 (11.1) |
| 4 (40.0) |
|
| ER, n (%) |
|
Negative | 4 (33.3) | 0.320 | 1 (11.1) | 0.894 | 4 (36.4) | 0.592 |
|
Positive | 4 (18.2) |
| 2 (9.5) |
| 6 (27.3) |
|
| PR, n (%) |
|
Negative | 4 (33.3) | 0.320 | 1 (11.1) | 0.894 | 4 (36.4) | 0.592 |
|
Positive | 4 (18.2) |
| 2 (9.5) |
| 6 (27.3) |
|
| HER2
overexpression, n (%) |
|
Negative | 7 (25.9) | 0.518 | 2 (8.3) | 0.543 | 8 (29.6) | 0.858 |
|
Positive | 1 (14.3) |
| 1 (16.7) |
| 2 (33.3) |
|
| Ki-67, n (%) |
|
<14% | 3 (50.0) | 0.092 | 0 (0.0) | 0.414 | 3 (50.0) | 0.246 |
|
≥14% | 5 (17.9) |
| 3 (12.0) |
| 7 (25.9) |
|
| Molecular subtype,
n (%) |
| Luminal
A | 3 (60.0) | 0.039d | 0 (0.0) | 0.715 | 3 (60.0) | 0.240 |
| Luminal
B | 1 (5.6) |
| 2 (11.1) |
| 3 (16.7) |
|
|
HER2 | 1 (25.0) |
| 0 (0.0) |
| 1 (33.3) |
|
|
Basal-like | 3 (42.9) |
| 1 (20.0) |
| 3 (42.9) |
|
| Table III.Association between the gene
expression levels of hTERT of circulating tumor cells and
clinicopathologic characteristics according to the detection
methods in breast cancer. |
Table III.
Association between the gene
expression levels of hTERT of circulating tumor cells and
clinicopathologic characteristics according to the detection
methods in breast cancer.
|
| RT-PCR
onlya (n=34) | CRC
cultureb (n=30) |
Combinationc (n=32) |
|---|
|
|
|
|
|
|---|
| Clinicopathological
variables | Positive
expression, n (%) | P-value | Positive
expression, n (%) | P-value | Positive
expression, n (%) | P-value |
|---|
| Tumor size, n
(%) |
| ≤2
cm | 11 (47.8) | 0.529 | 6 (28.6) | 0.719 | 13 (59.1) | 0.631 |
| >2
cm | 4
(36.4) |
| 2 (22.2) |
| 5
(50.0) |
|
| Histologic grade, n
(%) |
| I | 3 (75.0) | 0.411 | 2 (66.7) | 0.216 | 4
(100.0) | 0.169 |
| II | 5 (41.7) |
| 2 (16.7) |
| 6
(50.0) |
|
|
III | 7 (38.9) |
| 4 (26.7) |
| 8
(50.0) |
|
| LN metastasis, n
(%) |
|
Negative | 8 (36.4) | 0.218 | 6 (28.6) | 0.719 | 10 (47.6) | 0.174 |
|
Positive | 7 (58.3) |
| 2 (22.2) |
| 8
(72.7) |
|
| Stage, n (%) |
| I,
II | 11 (39.3) | 0.220 | 6 (23.1) | 0.284 | 13 (48.1) | 0.032d |
| III,
IV | 4
(66.7) |
| 2 (50.0) |
| 5
(100.0) |
|
| LVI, n (%) |
|
Negative | 11 (45.8) | 0.755 | 6 (28.6) | 0.719 | 13 (59.1) | 0.712 |
|
Positive | 4
(40.0) |
| 2 (22.2) |
| 5
(50.0) |
|
| ER, n (%) |
|
Negative | 4
(33.3) | 0.350 | 3 (33.3) | 0.666 | 5
(50.0) | 0.631 |
|
Positive | 11 (50.0) |
| 5 (23.8) |
| 13 (59.1) |
|
| PR, n (%) |
|
Negative | 5 (41.7) | 0.832 | 3 (33.3) | 0.666 | 6
(33.3) | 0.773 |
|
Positive | 10 (45.5) |
| 5 (23.8) |
| 12 (54.5) |
|
| HER2
overexpression, n (%) |
|
Negative | 12 (44.4) | 0.940 | 7 (29.2) | 0.536 | 15 (57.7) | 0.732 |
|
Positive | 3
(42.9) |
| 1 (16.7) |
| 3
(50.0) |
|
| Ki-67, n (%) |
|
<14% | 4
(66.7) | 0.220 | 0 (0.0) | 0.287 | 4
(66.7) | 0.568 |
|
≥14% | 11 (39.3) |
| 8 (32.0) |
| 14 (53.8) |
|
| Molecular subtype,
n (%) |
| Luminal
A | 3
(60.0) | 0.775 | 0 (0.0) | 0.575 | 3
(60.0) | 0.817 |
| Luminal
B | 8
(53.3) |
| 5 (27.8) |
| 10 (55.6) |
|
|
HER2 | 1
(25.0) |
| 1 (33.3) |
| 1
(33.3) |
|
|
Basal-like | 3
(42.9) |
| 2 (40.0) |
| 4
(66.7) |
|
Discussion
Recent advances in research on CTCs have led to the
development of multiple technologies to detect and isolate CTCs. In
particular, ex vivo culture of CTCs using CRC culture
methods is thought to be useful for the detection of CTCs and use
in CTC-based studies. However, there are few studies on CRC culture
in CTC detection. In this study, we aimed to verify the efficacy of
CRC culture in CTC detection and as a result, we showed the growth
of CTCs after cell culture using CRC culture in breast cancer for
the first time. Also, consistent with the results of previous
studies (18,19), we found that cultured CTCs preserved
the characteristics of the primary cancer cells. Furthermore, our
study showed that the detection rate of CTCs was enhanced using a
combination of CRC culture methods and RT-PCR of hTERT and
MAGE A1-6 genes in the blood.
CRCs have the capacity to grow indefinitely without
genetic manipulation (18,22) and CRC culture methods have been
proven to easily establish patient-derived CRC cultures from both
normal and cancer tissue (22). In
this regard, enhancing the growth of CTCs using CRC culture is
helpful in improving the release of viable CTCs and effective in
increasing the efficiency of CTC-based studies. In a previous study
(19), the authors used a spiking
model from metastatic lung cancer patient and established a CTC
line using CRC culture (19). On the
other hand, we used CTCs isolated from breast cancer patients, not
a spiking model, and ex vivo culture of CTCs was possible in
breast cancer using CRC culture. Our results suggest that CTC lines
can be established by the CRC culture methods using CTCs derived
from breast cancer patients, and used for translational research
and clinical applications.
Since the first human cancer cell line was
established from cervical carcinoma, various cancer cell lines have
been generated (14). However, ex
vivo culture of CTCs has been challenging because of the
limited number of viable CTCs. With recent advances of cell culture
techniques that optimize culture conditions (14,18),
several studies have shown the results of ex vivo culture of
CTCs in various culture conditions (7,15,17).
Zhang et al (15) showed the
results of CTC culture from lung cancer using a three-dimensional
(3D) co-culture environment using a mix of collagen, matrigel and
cancer associated fibroblasts derived from a primary pancreatic
tumor as culture medium. Cayrefourcq et al (17) established of colon cancer CTC line
using stem cell culture medium mixed with DMEM, insulin, EGF,
fibroblast growth factor, fetal calf serum and other substances at
first, before switching to another culture medium later. In breast
cancer, Yu et al (7) reported
that long-term oligoclonal CTC cultures were established from CTCs
isolated from metastatic breast cancer patients. They cultured CTCs
in serum-free media supplemented with EGF and basic fibroblast
growth factor under hypoxic conditions (4% O2).
Interestingly, the authors tried to test several culture conditions
including CRC culture methods, but the results were unsuccessful.
On the other hand, unlike previous results (7), our study showed the growth of CTCs
using CRC culture in breast cancer. Although the previous study
(7) did not explain why the CRC
culture methods were unsuccessful in CTC culture, there are several
reasons that may explain these conflicting results. First, the
technique for isolating CTCs was different from ours and previous
studies which used microfluidic technology. Second, we isolated
CTCs from patients with primary cancer before surgery, while in the
previous study CTCs were isolated from metastatic breast cancer
patients who were either off therapy or progressing on treatment.
Third, we cultured CTCs using CRC culture method for 4 weeks. In
CRC culture methods, epithelial cell colonies are readily visible
after 2 days, and cultures usually reach confluence in 5 days
(22). For CRC culture of CTCs,
culture of CTCs should be started within few hours and once
epithelial cell colonies are formed, cultured cells can
continuously grow to yield more cells. In previous study, the
results showed that ‘Fast-growing’ tissues such as prostate, lung,
cervix, skin and salivary gland tissues can yield up to 2 million
cells after 6–7 days (22). Tissues
with an intermediate growth rate including breast and kidney
tissues yield 1–2 million cells after 2 weeks. ‘Slow-growing’
tissues such as colon, pancreas, ovary and thyroid tissues yield up
to 10,000 cells after 4 weeks. Our CTCs were derived from breast
tissue and it was suitable to culture CTCs for at least 2 weeks, so
we cultured for 4 weeks to enhance more cell growth. Further
clarification requires future studies comparing the various culture
conditions.
In addition to the detection of CTCs using CRC
culture, we combined RT-PCR of the hTERT and MAGE
A1-6 genes to enhance CTC detection rates in breast cancer. The
hTERT and MAGE A1-6 genes are known to be specific
for cancer. If the positive expression rate of the direct RT-PCR
for hTERT and MAGE A1-6 gene is sufficient for the
detection of CTCs, CRC culture, which takes 4 weeks, is
unnecessary. In previous studies using RT-PCR of the hTERT
and MAGE A1-6 genes (13,23),
both genes were specifically expressed in CTCs of breast cancer
patients. The positive expression levels reported for the
hTERT and MAGE A1-6 genes in breast cancer varied
from 19.6 to 63.6 and from 13.0 to 63.6%, respectively (13,23–26).
Both methods of RT-PCR of hTERT and MAGE A1-6 genes
and CRC culture have advantages and disadvantages (Table IV). We hypothesized that if CTC
detection using CRC culture is possible, a combination of CRC
culture and RT-PCR only for the hTERT and MAGE A1-6
genes in the blood would enhance the detection rate of CTCs. In our
results, the detection rate of CTCs using RT-PCR was lower after
CRC culture than without which may be due to possible alteration of
these genes in cultured CTCs. However, when combining the two
methods, CTC detection rates were increased to 53.3 and 23.3% for
hTERT and MAGE A1-6 gene, respectively, compared to
26.7 and 10.0% using CRC culture. To the best of our knowledge,
this is the first study to show results for the combination of CRC
culture and RT-PCR for the hTERT and MAGE A1-6 genes
to detect CTCs in breast cancer. Our results suggest that the
combination of methods used in this study may be beneficial if the
positive expression rate of these genes is not sufficient for the
detection of CTCs in breast cancer.
| Table IV.Comparison between RT-PCR of
hTERT and MAGE A1-6 gene and CRC culture: pros and
cons. |
Table IV.
Comparison between RT-PCR of
hTERT and MAGE A1-6 gene and CRC culture: pros and
cons.
| Pros/cons | RT-PCR of
hTERT and MAGE A1-6 gene | CRC culture |
|---|
| Pros | Specific for
cancer | Capacity to grow
indefinitely without gene manipulation |
|
| Relatively short
test periods | Easy to establish
from patient-derived tissue Cultured cells preserve their original
phenotype, potential to distinguish the type of primary cancer
Enhancing the growth of viable cells |
| Cons | False-positive
hTERT expression in | Long test
periods |
|
| activated
lymphocytes | Requires specific
medium and conditions for CRC |
|
| Difficulty in
identifying the type of | culture |
|
| primary cancer | Lack of information
on sensitivity and specificity of |
|
| Wide range of test
sensitivity | CRC culture |
Traditional CTC isolation technologies are based on
the removal of normal blood components by chemical lysis of RBCs
followed by depletion of CD45 positive leukocytes (9). For CTC capture after this step, a
number of technologies have been developed. In our study, we used
negative immunomagnetic separation technology using the CD45
antibody capture system (20).
Unlike the CellSearch® system which uses positive
immunomagnetic enrichment technology, negative enrichment
technologies do not bias the sample according to selection markers
(27). Furthermore, while positive
immunomagnetic technologies have difficulty in downstream
processing due to immobilization of captured CTCs on the surface of
the device, negative enrichment can easily retrieve CTCs for
further analysis (27). Because the
recovery rate and viability of isolated CTCs is important in ex
vivo culture of CTCs, we preferred negative immunomagnetic
separation technology for CRC culture of CTCs. It can also be used
in drug susceptibility testing using CTCs.
Although CRC culture of CTCs in breast cancer was
shown in this study, the growth rates of CTCs using CRC culture
were lower than expected. This may be due to a low number of
isolated CTCs, because most of the patients in this study were in
an early stage of breast cancer. The detection rate of CTCs in
breast cancer is known to be higher in metastatic disease than in
early breast cancer (28), and the
presence of CTCs has been reported to be associated with disease
progression. Our results confirmed these findings, as CTC detection
rates were significantly associated with breast cancer stage.
Therefore, in early breast cancer, especially stage I, the number
of isolated CTCs may be small. In addition, the cell culture
conditions can affect the growth of CTCs using CRC culture. In a
study to determine optimal growth conditions for CTCs, four
different culture environments were tested, and the results showed
that a 3D co-culture environment using a mix of collagen, matrigel
and cancer associated fibroblasts exhibited the highest level of
cell expansion, compared to two-dimensional (2D) or mono culture
environments (15). In our study, we
used plates containing medium for CRC culture, which is a 2D
co-culture environment. Even if CRC culture enables CTCs to grow
indefinitely, this 2D environment may have limited the growth of
CTCs. To enhance the growth of CTCs in breast cancer, we are
planning to test a 3D co-culture environment using matrigel and CRC
culture.
Our study has several limitations. First, healthy
donor blood was not included so we could not analyze the
specificity of the method. We designed this study based on the
results of previous studies showing that the MAGE A1-6 and
hTERT genes are specifically expressed in cancer cells
(29–34). To show more reliable results, a
negative control is required. Second, we did not enumerate CTCs
after isolation to determine the number of CTCs isolated. Instead
of enumeration, we detected CTCs using RT-PCR of the MAGE
A1-6 and hTERT genes and it was difficult to determine
the average number of isolated CTCs and the percentage of viable
isolated CTCs using this method. Therefore, it remains uncertain
how many CTCs were culturable after isolation. Further study is
required to confirm the proportion of viable CTCs that are
considered culturable after isolation. Third, we could not prove
that the colonies originated from CTCs. Because we didn't enumerate
CTCs after isolation and detected CTCs only using RT-PCR of the
MAGE A1-6 and hTERT genes, it was difficult to
investigate CTCs microscopically. Instead, we tried to compare the
CTC colonies to the microscopic findings of cancer cells in breast
cancer tissue. There were some similarities between the CTC
colonies and cancer cells in breast cancer tissue, but the findings
were not identical. Previous studies described that there is broad
morphological and immunophenotypical variation within CTCs derived
from the same tumor of origin and detecting CTCs microscopically is
still challenged (35–37). Further investigation is required to
prove that the colonies were derived from CTCs. Fourth, we did not
evaluate the EpCAM as a positive control for detection of CTCs.
Although the detection rate of EpCAM may not be sufficient for
detection of CTCs, an old positive control is needed to reliably
compare the results. Finally, the blood volume collected in this
study was lower than that used in other studies. To increase the
sensitivity of our assay methods, it may be necessary to collect
more blood. Also, the total number of samples was small, and
further studies with a larger sample size and appropriate control
group are needed to show more reliable results.
In conclusion, our study shows a potential of CRC
culture in the detection of CTCs in breast cancer. We also showed
that a combination of CRC culture and RT-PCR for the hTERT
and MAGE A1-6 genes is useful in enhancing the detection
rate of CTCs in the blood. If we can increase the efficiency of CRC
culture to expand CTCs by improving culture conditions, CRC culture
could be used for CTC detection in a clinical setting, and CTC
lines could be established from breast cancer patients using CRC
culture method. To properly apply CRC culture to the utilization of
CTCs in breast cancer in clinical applications, further studies
with larger numbers of samples and multiple culture conditions are
needed.
Acknowledgements
The authors would like to thank Mrs. Jong-Suk Jin
(Department of Laboratory Medicine, Catholic University of Daegu
School of Medicine) for technical support in experiments and
collecting data. This abstract was presented at the 69th Annual
Congress of the Korean Surgical Society from November 2 to 4, 2017
in Seoul, Republic of Korea, and was published as Abstract no.
OP19-6.
Funding
This research was supported by the Basic Science
Research Program through the National Research Foundation (NRF) of
Korea funded by the Ministry of Education, Science and Technology
(grant no. NRF-2013R1A1A2007189).
Availability of data and materials
The datasets used and/or analyzed during the current
study are available from the corresponding author on reasonable
request.
Authors' contributions
CHJ, YJJ and SHP developed the study concept. CHJ
and YJJ were responsible for the methodology. Formal Analysis,
Chang-Ho Jeon performed formal analysis. CHJ and YJJ performed the
investigation. SHP and YJJ provided resources. YJJ, SHP and CHJ
curated the data. YJJ wrote the original draft. YJJ and CHJ
reviewed and edited the manuscript. CHJ was involved in project
administration. All authors read and approved the final
manuscript.
Ethics approval and consent to
participate
Ethical approval for the study was obtained from the
Institutional Review Board of Daegu Catholic University Hospital.
Written informed consent was obtained from all patients according
to the protocol.
Patient consent for publication
Written informed consent was obtained from all
patients according to the protocol.
Competing interests
The authors declare that they have no competing
interests.
References
|
1
|
Siravegna G, Marsoni S, Siena S and
Bardelli A: Integrating liquid biopsies into the management of
cancer. Nat Rev Clin Oncol. 14:531–548. 2017. View Article : Google Scholar : PubMed/NCBI
|
|
2
|
Gabriel MT, Calleja LR, Chalopin A, Ory B
and Heymann D: Circulating Tumor Cells: A Review of Non-EpCAM-Based
Approaches for Cell Enrichment and Isolation. Clin Chem.
62:571–581. 2016. View Article : Google Scholar : PubMed/NCBI
|
|
3
|
van de Stolpe A, Pantel K, Sleijfer S,
Terstappen LW and den Toonder JM: Circulating tumor cell isolation
and diagnostics: Toward routine clinical use. Cancer Res.
71:5955–5960. 2011. View Article : Google Scholar : PubMed/NCBI
|
|
4
|
Paterlini-Brechot P and Benali NL:
Circulating tumor cells (CTC) detection: Clinical impact and future
directions. Cancer Lett. 253:180–204. 2007. View Article : Google Scholar : PubMed/NCBI
|
|
5
|
Ameri K, Luong R, Zhang H, Powell AA,
Montgomery KD, Espinosa I, Bouley DM, Harris AL and Jeffrey SS:
Circulating tumour cells demonstrate an altered response to hypoxia
and an aggressive phenotype. Br J Cancer. 102:561–569. 2010.
View Article : Google Scholar : PubMed/NCBI
|
|
6
|
Krebs MG, Metcalf RL, Carter L, Brady G,
Blackhall FH and Dive C: Molecular analysis of circulating tumour
cells-biology and biomarkers. Nat Rev Clin Oncol. 11:129–144. 2014.
View Article : Google Scholar : PubMed/NCBI
|
|
7
|
Yu M, Bardia A, Aceto N, Bersani F, Madden
MW, Donaldson MC, Desai R, Zhu H, Comaills V, Zheng Z, et al:
Cancer therapy. Ex vivo culture of circulating breast tumor cells
for individualized testing of drug susceptibility. Science.
345:216–220. 2014. View Article : Google Scholar : PubMed/NCBI
|
|
8
|
Khoo BL, Grenci G, Jing T, Lim YB, Lee SC,
Thiery JP, Han J and Lim CT: Liquid biopsy and therapeutic
response: Circulating tumor cell cultures for evaluation of
anticancer treatment. Sci Adv. 2:e16002742016. View Article : Google Scholar : PubMed/NCBI
|
|
9
|
Maheswaran S and Haber DA: Ex vivo culture
of CTCs: An emerging resource to guide cancer therapy. Cancer Res.
75:2411–2415. 2015. View Article : Google Scholar : PubMed/NCBI
|
|
10
|
Sang M, Wang L, Ding C, Zhou X, Wang B,
Wang L, Lian Y and Shan B: Melanoma-associated antigen genes - an
update. Cancer Lett. 302:85–90. 2011. View Article : Google Scholar : PubMed/NCBI
|
|
11
|
Li X, Hughes SC and Wevrick R: Evaluation
of melanoma antigen (MAGE) gene expression in human cancers using
The Cancer Genome Atlas. Cancer Genet. 208:25–34. 2015. View Article : Google Scholar : PubMed/NCBI
|
|
12
|
Ducrest AL, Szutorisz H, Lingner J and
Nabholz M: Regulation of the human telomerase reverse transcriptase
gene. Oncogene. 21:541–552. 2002. View Article : Google Scholar : PubMed/NCBI
|
|
13
|
Kim DD, Yang CS, Chae HD, Kwak SG and Jeon
CH: Melanoma antigen-encoding gene family member A1-6 and hTERT in
the detection of circulating tumor cells following CD45−
depletion and RNA extraction. Oncol Lett. 14:837–843. 2017.
View Article : Google Scholar : PubMed/NCBI
|
|
14
|
Sachs N and Clevers H: Organoid cultures
for the analysis of cancer phenotypes. Curr Opin Genet Dev.
24:68–73. 2014. View Article : Google Scholar : PubMed/NCBI
|
|
15
|
Zhang Z, Shiratsuchi H, Lin J, Chen G,
Reddy RM, Azizi E, Fouladdel S, Chang AC, Lin L, Jiang H, et al:
Expansion of CTCs from early stage lung cancer patients using a
microfluidic co-culture model. Oncotarget. 5:12383–12397. 2014.
View Article : Google Scholar : PubMed/NCBI
|
|
16
|
Gao D, Vela I, Sboner A, Iaquinta PJ,
Karthaus WR, Gopalan A, Dowling C, Wanjala JN, Undvall EA, Arora
VK, et al: Organoid cultures derived from patients with advanced
prostate cancer. Cell. 159:176–187. 2014. View Article : Google Scholar : PubMed/NCBI
|
|
17
|
Cayrefourcq L, Mazard T, Joosse S,
Solassol J, Ramos J, Assenat E, Schumacher U, Costes V, Maudelonde
T, Pantel K, et al: Establishment and characterization of a cell
line from human circulating colon cancer cells. Cancer Res.
75:892–901. 2015. View Article : Google Scholar : PubMed/NCBI
|
|
18
|
Liu X, Ory V, Chapman S, Yuan H, Albanese
C, Kallakury B, Timofeeva OA, Nealon C, Dakic A, Simic V, et al:
ROCK inhibitor and feeder cells induce the conditional
reprogramming of epithelial cells. Am J Pathol. 180:599–607. 2012.
View Article : Google Scholar : PubMed/NCBI
|
|
19
|
Zheng A, Parasido E, Rawal S, Williams A,
Schlegel R, Liu S, Albanese C, Cote RJ, Agarwal A and Datar RH:
Thermoresponsive release of viable microfiltrated Circulating Tumor
Cells (CTCs) for precision medicine applications. Lab Chip.
15:4277–4282. 2015. View Article : Google Scholar : PubMed/NCBI
|
|
20
|
Wu Y, Deighan CJ, Miller BL,
Balasubramanian P, Lustberg MB, Zborowski M and Chalmers JJ:
Isolation and analysis of rare cells in the blood of cancer
patients using a negative depletion methodology. Methods.
64:169–182. 2013. View Article : Google Scholar : PubMed/NCBI
|
|
21
|
Livak KJ and Schmittgen TD: Analysis of
relative gene expression data using real-time quantitative PCR and
the 2(−Δ Δ C(T)) Method. Methods. 25:402–408. 2001. View Article : Google Scholar : PubMed/NCBI
|
|
22
|
Liu X, Krawczyk E, Suprynowicz FA,
Palechor-Ceron N, Yuan H, Dakic A, Simic V, Zheng YL, Sripadhan P,
Chen C, et al: Conditional reprogramming and long-term expansion of
normal and tumor cells from human biospecimens. Nat Protoc.
12:439–451. 2017. View Article : Google Scholar : PubMed/NCBI
|
|
23
|
Strati A, Markou A, Parisi C, Politaki E,
Mavroudis D, Georgoulias V and Lianidou E: Gene expression profile
of circulating tumor cells in breast cancer by RT-qPCR. BMC Cancer.
11:4222011. View Article : Google Scholar : PubMed/NCBI
|
|
24
|
Wang HY, Ahn S, Kim S, Park S, Jung D,
Park S, Han H, Sohn J, Kim S and Lee H: Detection of circulating
tumor cell-specific markers in breast cancer patients using the
quantitative RT-PCR assay. Int J Clin Oncol. 20:878–890. 2015.
View Article : Google Scholar : PubMed/NCBI
|
|
25
|
Shen C, Hu L, Xia L and Li Y: The
detection of circulating tumor cells of breast cancer patients by
using multimarker (Survivin, hTERT and hMAM) quantitative real-time
PCR. Clin Biochem. 42:194–200. 2009. View Article : Google Scholar : PubMed/NCBI
|
|
26
|
Kwon S, Kang SH, Ro J, Jeon CH, Park JW
and Lee ES: The melanoma antigen gene as a surveillance marker for
the detection of circulating tumor cells in patients with breast
carcinoma. Cancer. 104:251–256. 2005. View Article : Google Scholar : PubMed/NCBI
|
|
27
|
Ferreira MM, Ramani VC and Jeffrey SS:
Circulating tumor cell technologies. Mol Oncol. 10:374–394. 2016.
View Article : Google Scholar : PubMed/NCBI
|
|
28
|
Rack B, Schindlbeck C, Jückstock J,
Andergassen U, Hepp P, Zwingers T, Friedl TW, Lorenz R, Tesch H,
Fasching PA, et al SUCCESS Study Group, : Circulating tumor cells
predict survival in early average-to-high risk breast cancer
patients. J Natl Cancer Inst. 106:1062014. View Article : Google Scholar
|
|
29
|
Fujie T, Mori M, Ueo H, Sugimachi K and
Akiyoshi T: Expression of MAGE and BAGE genes in Japanese breast
cancers. Ann Oncol. 8:369–372. 1997. View Article : Google Scholar : PubMed/NCBI
|
|
30
|
Jungbluth AA, Busam KJ, Kolb D, Iversen K,
Coplan K, Chen YT, Spagnoli GC and Old LJ: Expression of
MAGE-antigens in normal tissues and cancer. Int J Cancer.
85:460–465. 2000. View Article : Google Scholar : PubMed/NCBI
|
|
31
|
Weon JL and Potts PR: The MAGE protein
family and cancer. Curr Opin Cell Biol. 37:1–8. 2015. View Article : Google Scholar : PubMed/NCBI
|
|
32
|
Kirkpatrick KL, Ogunkolade W, Elkak AE,
Bustin S, Jenkins P, Ghilchick M, Newbold RF and Mokbel K: hTERT
expression in human breast cancer and non-cancerous breast tissue:
Correlation with tumour stage and c-Myc expression. Breast Cancer
Res Treat. 77:277–284. 2003. View Article : Google Scholar : PubMed/NCBI
|
|
33
|
Zhang Y, Toh L, Lau P and Wang X: Human
telomerase reverse transcriptase (hTERT) is a novel target of the
Wnt/β-catenin pathway in human cancer. J Biol Chem.
287:32494–32511. 2012. View Article : Google Scholar : PubMed/NCBI
|
|
34
|
Hannen R and Bartsch JW: Essential roles
of telomerase reverse transcriptase hTERT in cancer stemness and
metastasis. FEBS Lett. 592:2023–2031. 2018. View Article : Google Scholar : PubMed/NCBI
|
|
35
|
Hong B and Zu Y: Detecting circulating
tumor cells: Current challenges and new trends. Theranostics.
3:377–394. 2013. View Article : Google Scholar : PubMed/NCBI
|
|
36
|
Wicha MS and Hayes DF: Circulating tumor
cells: Not all detected cells are bad and not all bad cells are
detected. J Clin Oncol. 29:1508–1511. 2011. View Article : Google Scholar : PubMed/NCBI
|
|
37
|
Allard WJ, Matera J, Miller MC, Repollet
M, Connelly MC, Rao C, Tibbe AG, Uhr JW and Terstappen LW: Tumor
cells circulate in the peripheral blood of all major carcinomas but
not in healthy subjects or patients with nonmalignant diseases.
Clin Cancer Res. 10:6897–6904. 2004. View Article : Google Scholar : PubMed/NCBI
|