Introduction
The epithelial-to-mesenchymal transition (EMT) is a
phenomenon during which cancer epithelial cells undergo changes in
plasticity and lose cell-cell adhesion with consequent remodeling
of the extracellular matrix and acquisition of mesenchymal
characteristics (1,2). The EMT phenomenon is associated with
carcinogenesis, metastasis and chemoresistance (3).
EMT is regulated by a complex signaling network that
involves transcription factors such as zinc-finger enhancer binding
protein (ZEB1/2), twist family basic helix-loop-helix transcription
factor 1/2 (TWIST1/2) and transforming growth factor beta (TGF-β)
family members (4). TWIST1
transcription factor decreases the expression levels of epithelial
genes, such as E-cadherin, and increases the expression levels of
mesenchymal genes, such as fibronectin; ZEB1 is another
transcriptional factor that regulates E-cadherin expression, while
TGFB1 changes the plasticity of epithelial cells and promotes the
remodeling of extracellular matrix composition (4).
A large number of long non-coding RNAs (lncRNAs)
have been described as EMT modulation markers, becoming a promising
target in the development of new therapies for cancer, especially
due to their tissue-specific expression (5,6). One
such lncRNA is HOX transcript antisense RNA (HOTAIR), which
comprises ~2.2 kb and contains six exons transcribed from the HOXC
locus and is located on chromosome 12q.13.13 (5). High expression levels of HOTAIR
are associated with a poor prognosis in various types of cancer,
such as colorectal, ovary and breast cancer (3–7).
Everolimus belongs to a class of drugs known as
selective inhibitors of mTOR, with a specific target in the mTORC1
signal transduction complex, and has demonstrated antitumor
activity in breast cancer preclinical models and in clinical trials
(8–12). However, it has been described in the
literature that at a concentration of 100 nM, everolimus induces
the EMT phenomenon (11,12).
The present study aimed to investigate the role of
100 nM everolimus in EMT through morphological characterization of
cell lines derived from human breast (BT-549), colorectal
(RKO-AS45-1) and ovary (TOV-21G) cancer and by the evaluation of
the mRNA expression of EMT regulators ZEB1, TWIST1 and
TGFB1, and lncRNA HOTAIR. In addition, an in
vitro model of transepithelial/transendothelial electrical
resistance (TEER) monitoring was used as means of assessing the
integrity of cellular junctions.
Materials and methods
Cell culture
Cell lines BT-549 (breast ductal carcinoma;
HTB-122™), TOV-21G (ovarian adenocarcinoma; CRL-11730™), RKO-AS45-1
(colorectal carcinoma; CRL-2579™) and WI-26 VA4 (lung fibroblast
used as a control; CCL-95.1™) were purchased from the American Type
Culture Collection. The BT-549 cell line was cultured in RPMI-1640
medium (Sigma-Aldrich; Merck KGaA) supplemented with 10% fetal
bovine serum (FBS; Gibco; Thermo Fisher Scientific, Inc.)
inactivated at 56°C for 30 min, 1% 0.2 M L-glutamine and 10 mg/ml
bovine insulin (Sigma-Aldrich; Merck KGaA). The TOV-21G cell line
was grown in high-glucose Dulbecco's modified Eagle's medium
(Sigma-Aldrich; Merck KGaA) supplemented with 15% FBS and 1% 0.2 M
L-glutamine, and the RKO-AS45-1 and WI-26 VA4 cell lines were
cultured in RPMI-1640 medium supplemented with 10% FBS and 1% 0.2 M
L-glutamine. Cells were incubated at 37°C in a humidified
atmosphere enriched with 5% CO2. The experiments were
carried out obeying a certain passage number (between passages 4
and 6).
Everolimus solubilization
Everolimus (molecular weight, 958.224 g/mol) was
suspended in dimethyl sulfoxide (DMSO) to achieve a concentration
of 1 mM; for all assays, the final concentration of 100 nM diluted
in culture medium was used.
Extraction of total RNA and reverse
transcription
Total RNA was extracted from tumor cells in culture
before and after treatment with everolimus at 100 nM for 24 h and
from the normal cell line WI-26 VA4 without treatment using the
TRIzol® reagent (Invitrogen; Thermo Fisher Scientific,
Inc.) according to the manufacturer's instructions. The
quantification of the total RNA extracted from cells was performed
using a Nanovue™ Plus Spectrophotometer. The integrity of the
extracted total RNA was evaluated by 1% agarose gel
electrophoresis. A total of 2 µg total RNA was treated with the
RNAse-Free DNase set (Qiagen), and complementary DNA (cDNA)
synthesis was performed using the M-MLV Reverse
Transcriptase® kit (Sigma-Aldrich; Merck KGaA), Oligo dT
(Eurofins Scientific) and dNTPs (Promega Corporation) according to
the manufacturer's instructions.
Quantitative PCR (qPCR)
Transcript analysis of ZEB1, TWIST1 and
TGFB1 was performed by qPCR using PowerUp™ SYBR®
Green Master Mix (Thermo Fisher Scientific, Inc.) according to the
manufacturer's instructions. The primers used are shown in Table I. The TATA-binding protein
(TBP) gene was used as the endogenous housekeeping gene. The
reactions were subjected to specific amplification cycles (40
cycles of denaturation at 95°C for 15 sec and annealing/elongation
at 60°C for 1 min) and the dissociation curve according to the
manufacturer's instructions. The expression of lncRNA HOTAIR
was evaluated using TaqMan® Non-Coding RNA assay
(Applied Biosystems; Thermo Fisher Scientific, Inc.).
TaqMan® Universal Master mix (Thermo Fisher Scientific,
Inc.) was used according to the manufacturer's instructions, and
TBP and 18S genes were used as endogenous controls,
with the results normalized to the average of the endogenous
controls. This assay was performed once in duplicate. Total RNA and
cDNA-free samples were used as controls in each assay. Cycling and
data collection were performed on a StepOne™ Real-Time PCR System
(Applied Biosystems; Thermo Fisher Scientific, Inc.). Gene
expression was quantified using the relative 2−ΔΔCq
quantification method (13). In
order to determine the relative changes in the mRNA expression
levels of TGFB1, TWIST1 and ZEB1 in the cells treated
with everolimus compared with untreated samples, ΔCt values from
three normalization controls were used: i) Untreated samples of
each cell line; ii) untreated BT-549 samples; and iii) untreated
WI-26 VA4 samples.
 | Table I.Details of primers used for
quantitative PCR. |
Table I.
Details of primers used for
quantitative PCR.
| Gene | Sequence
(5′→3′) | Concentration,
nM |
|---|
| ZEB1 | F:
TTACACCTTTGCATACAGAACCC | 300 |
|
| R:
TTTACGATTACACCCAGACTGC | 300 |
| TWIST1 | F:
GTCCGCAGTCTTACGAGGAG | 300 |
|
| R:
GCTTGAGGGTCTGAATCTTGCT | 150 |
| TGFB1 | F:
AACTGCTTCCTGTATGGGGTC | 300 |
|
| R:
AAGGCGTCGTCAATGGACTC | 200 |
| TBP | F:
CGGCTACCACATCCAAGGAA | 250 |
|
| R:
GCTGGAATTACCGCGGCT | 250 |
Fluorescence microscopy
The cell lines (BT-549, 5×10⁴ cells/well;
TOV-21G and RKO-AS45-1, 2.5×10⁴ cells/well) were seeded
on Lab-Tek slides (Thermo Fisher Scientific, Inc.) and incubated
overnight at 37°C in 5% CO2. After treatment with 100 nM
everolimus for 24 h, BT-549, TOV-21G and RKO-AS45-1 were fixed with
4% formaldehyde for 1 h, permeabilized with 0.1% Triton X-100 for
10 min and labeled with DAPI, Phalloidin and
LysoTracker® Red DND-99 probes (Invitrogen; Thermo
Fisher Scientific, Inc.) according to the manufacturer's
instructions, all at room temperature. The labelling was assessed
using an Axiovert 200M fluorescence microscope (Carl Zeiss AG) with
AxioVision Rel. 4.8.2 software (Carl Zeiss AG). The fluorophores
were read according to each emission spectrum (DAPI, 461 nm;
Phalloidin, 518 nm; and LysoTracker, 590 nm). To evaluate whether
everolimus affected the cytoskeleton of the cells, the nuclei of 25
cells labeled with DAPI and Phalloidin were measured (in the same
slide). Using ImageJ version 1.50i software (National Institutes of
Health), a region of interest was drawn manually around each
LysoTracker-labeled cell, and the corrected total cell fluorescence
(CTCF) was calculated by subtracting the fluorescence intensity of
the selected cell area multiplied by the mean bottom well
fluorescence (background).
Immunofluorescence
The cell lines (BT-549, 5×10⁴ cells/well;
TOV-21G and RKO-AS45-1, 2.5×10⁴ cells/well) were seeded
on Lab-Tek slides (Thermo Fisher Scientific, Inc.) and incubated
overnight at 37°C in 5% CO2. Following 24-h treatment
with 100 nM everolimus, the cells were fixed with 4% formaldehyde
solution for 1 h, permeabilized with 0.1% Triton X-100 for 10 min
and labeled for 45 min with anti-E-cadherin (1:50; cat. no. 610182;
BD Biosciences), anti-P-cadherin (1:50; cat. no. 610228; BD
Biosciences) and anti-fibronectin antibodies (1:50; cat. no.
A21316; Invitrogen; Thermo Fisher Scientific, Inc.) according to
the manufacturers' instructions, all at room temperature. After
incubation, the wells were washed with 1X PBS three times, and the
wells incubated with the primary antibodies against E/P-cadherin
were incubated with a FITC-conjugated anti-mouse IgG secondary
antibody (1:128; cat. no. F5262; Sigma-Aldrich; Merck KGaA),
whereas the wells incubated with anti-fibronectin were incubated
with an Alexa 594-conjugated anti-chicken IgG secondary antibody
(1:500; cat. no. A32759; Invitrogen; Thermo Fisher Scientific,
Inc.) for 2 h, all at room temperature. After incubation, the wells
were washed three times with 1X PBS, and the nuclei were labeled
with DAPI. The markers were analyzed under the Axiovert 200M
fluorescence microscope using AxioVision Rel. 4.8.2 software. The
25-cell CTCF in the same slide was also calculated using ImageJ
software as aforementioned. The fluorescence intensity of the
nuclei was subtracted from the integrated density obtained within
the outline of each cell.
MTT assay
Cell viability in the presence of 100 nM everolimus
was determined using the
3-(4,5-dimethylthiazol-2-yl)-2,5-diphenyltetrazolium bromide method
(MTT) as previously described by Mitchell et al (14). Untreated cells and those treated with
hydrogen peroxide were used as negative and positive controls,
respectively. The absorbance measurement was performed using a
spectrophotometer (SpectraMax® M5e; Molecular Devices,
LLC) at 550 nm. The viability of the treated cells was calculated
by dividing the absorbance value of the treated cells by the mean
of the untreated control multiplied by 100.
Clonogenic assay
The clonogenic assay was performed as previously
described by Franken et al (15). RKO-AS45-1 (500 cells) and TOV-21G
(1,500 cells) cell lines were treated with 100 nM everolimus and
seeded in 60-mm culture dishes in triplicate. The cells were
incubated at 37°C for 7 days. Colonies with ≥50 cells were counted.
The plating efficiency (PE) was determined by dividing the mean
number of colonies of the controls by the number of plated cells.
The surviving fraction (SF) was calculated by dividing the mean of
colonies formed after treatment by the number of plated cells and
multiplying the result by the PE. The result was multiplied by
100%. The colonies were analyzed with DAPI and Phalloidin probes as
aforementioned.
Transepithelial electrical resistance
measurement
RKO-AS45-1 cells were treated in individual wells
with either: i) 1 µg their own total RNA; ii) 700 ng/ml TGF-α; or
iii) 100 nM everolimus, and seeded in RPMI-1640 medium supplemented
with 10% FBS, 100 U penicillin and 100 µg streptomycin in a
Transwell® system (Corning, Inc.) with a 3-µm
polystyrene membrane and a growth area of 1.12 cm2. Cell
resistance was measured using the Millicell® ERS 2
apparatus (EMD Millipore) at 0, 3, 24 and 48 h. To obtain the
correct resistance in Ohms, the resistance value of the wells with
medium was subtracted from the resistance value of the wells with
cells, and the correct resistance value was obtained by multiplying
this with the membrane area. This experiment was carried out in
biological triplicates.
Protein-protein interaction (PPI)
network and molecular classification of the cell lines
The STRING database (version 10.5) was used to
evaluate PPIs (16). Classification
of the mutations in EMT genes evaluated in the present study was
performed using the somatic mutation database COSMIC v85
(https://cancer.sanger.ac.uk/cosmic).
The molecular classification of RKO, the parental cell line of
RKO-AS45-1, was used due to the absence of the data for RKO-AS45-1
cells in the database.
Statistical analysis
Statistical analyses were performed with SPSS 20
software (IBM Corp.). Differences in gene expression and cell
resistance between groups were analyzed using one-way ANOVA with
the least significant difference post hoc test. The results of the
microscopy assays were analyzed using the non-parametric Mann
Whitney test. The results of the cell viability and clonogenic
assays were evaluated using the Kruskal Wallis test followed by the
least significant difference test. P<0.05 was considered to
indicate a statistically significant difference.
Results
Everolimus alters the transcription of
the EMT regulators
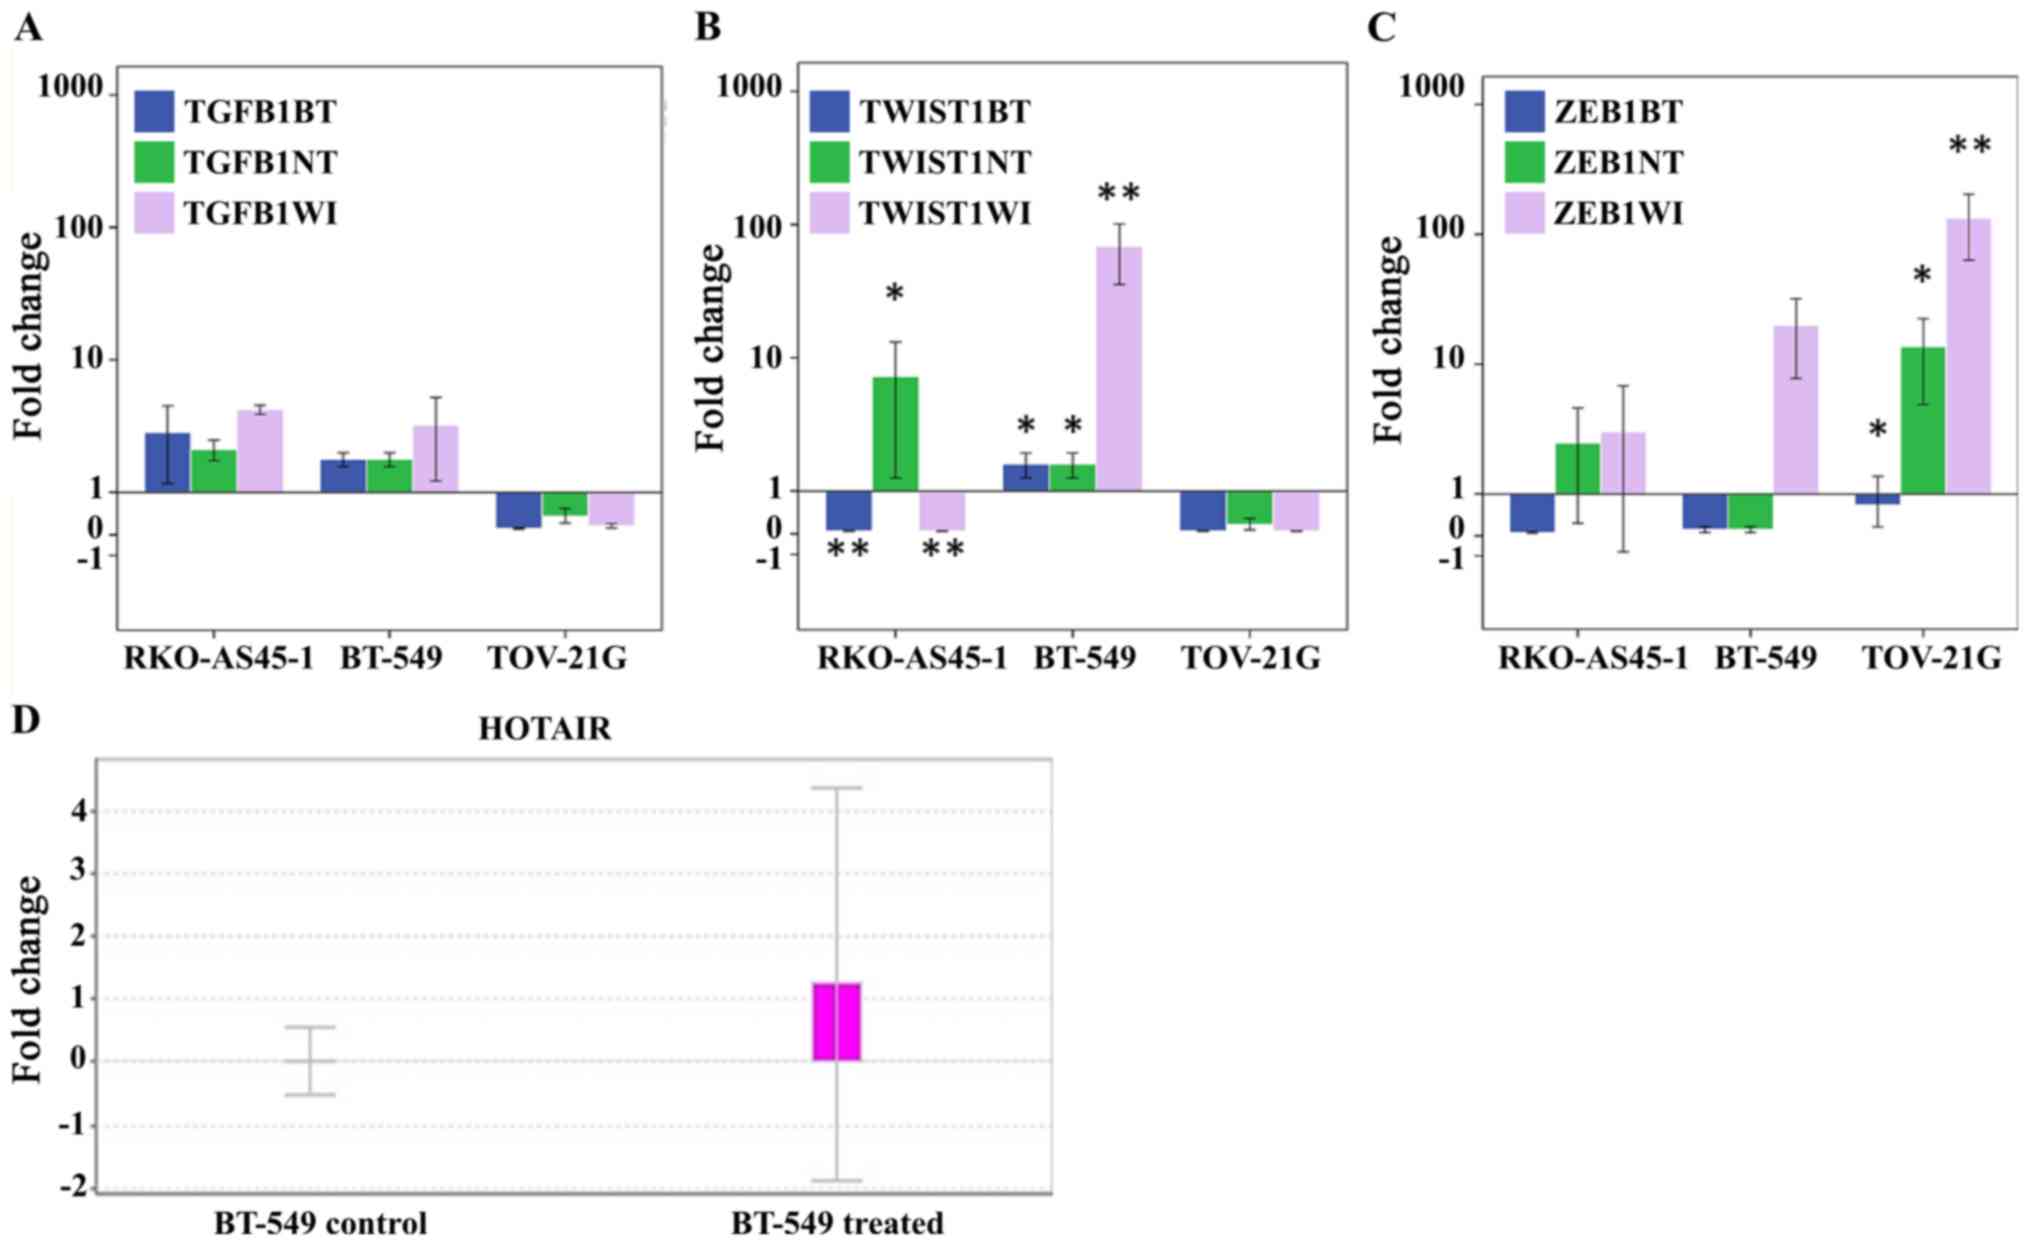
The results of the qPCR analysis demonstrated that
TGFB1 appeared to be upregulated in the RKO-AS45-1 and
BT-549 cell lines treated with everolimus independently compared
with all three types of normalization control, whereas in the
TOV-21G cell line, TGFB1 appeared to be downregulated
(Fig. 1A). However, these results
were not statistically significant. Significant differences between
TWIST1 RQs normalized to the three controls were observed in
the RKO-AS45-1 and BT-549 cell lines following everolimus treatment
(Fig. 1B). TWIST1 was
downregulated in RKO-AS45-1 compared with untreated BT-549 and
WI-26 VA4 cells, but upregulated compared with untreated RKO-AS45-1
cells. In BT-549 cells, TWIST1 was upregulated compared with
all three normalization controls. In TOV-21G cells, TWIST1
appeared to be downregulated compared with the control, and no
statistical differences were observed between the analyzed groups.
The analysis of ZEB1 RQ (Fig.
1C) demonstrated that the expression of its mRNA appeared to be
downregulated in the three cell lines compared with that in
untreated BT-549 cells, but upregulated in RKO-AS45-1 and TOV-21G
cell lines compared with the respective untreated cell lines and
WI-26 VA4. However, only the differences observed in the expression
of ZEB1 in TOV-21G were statistically significant.
lncRNA HOTAIR is upregulated in BT-549
cells after treatment with everolimus
Only the BT-549 triple negative breast cancer cell
line demonstrated amplified lncRNA HOTAIR following
treatment with everolimus (Fig.
1D).
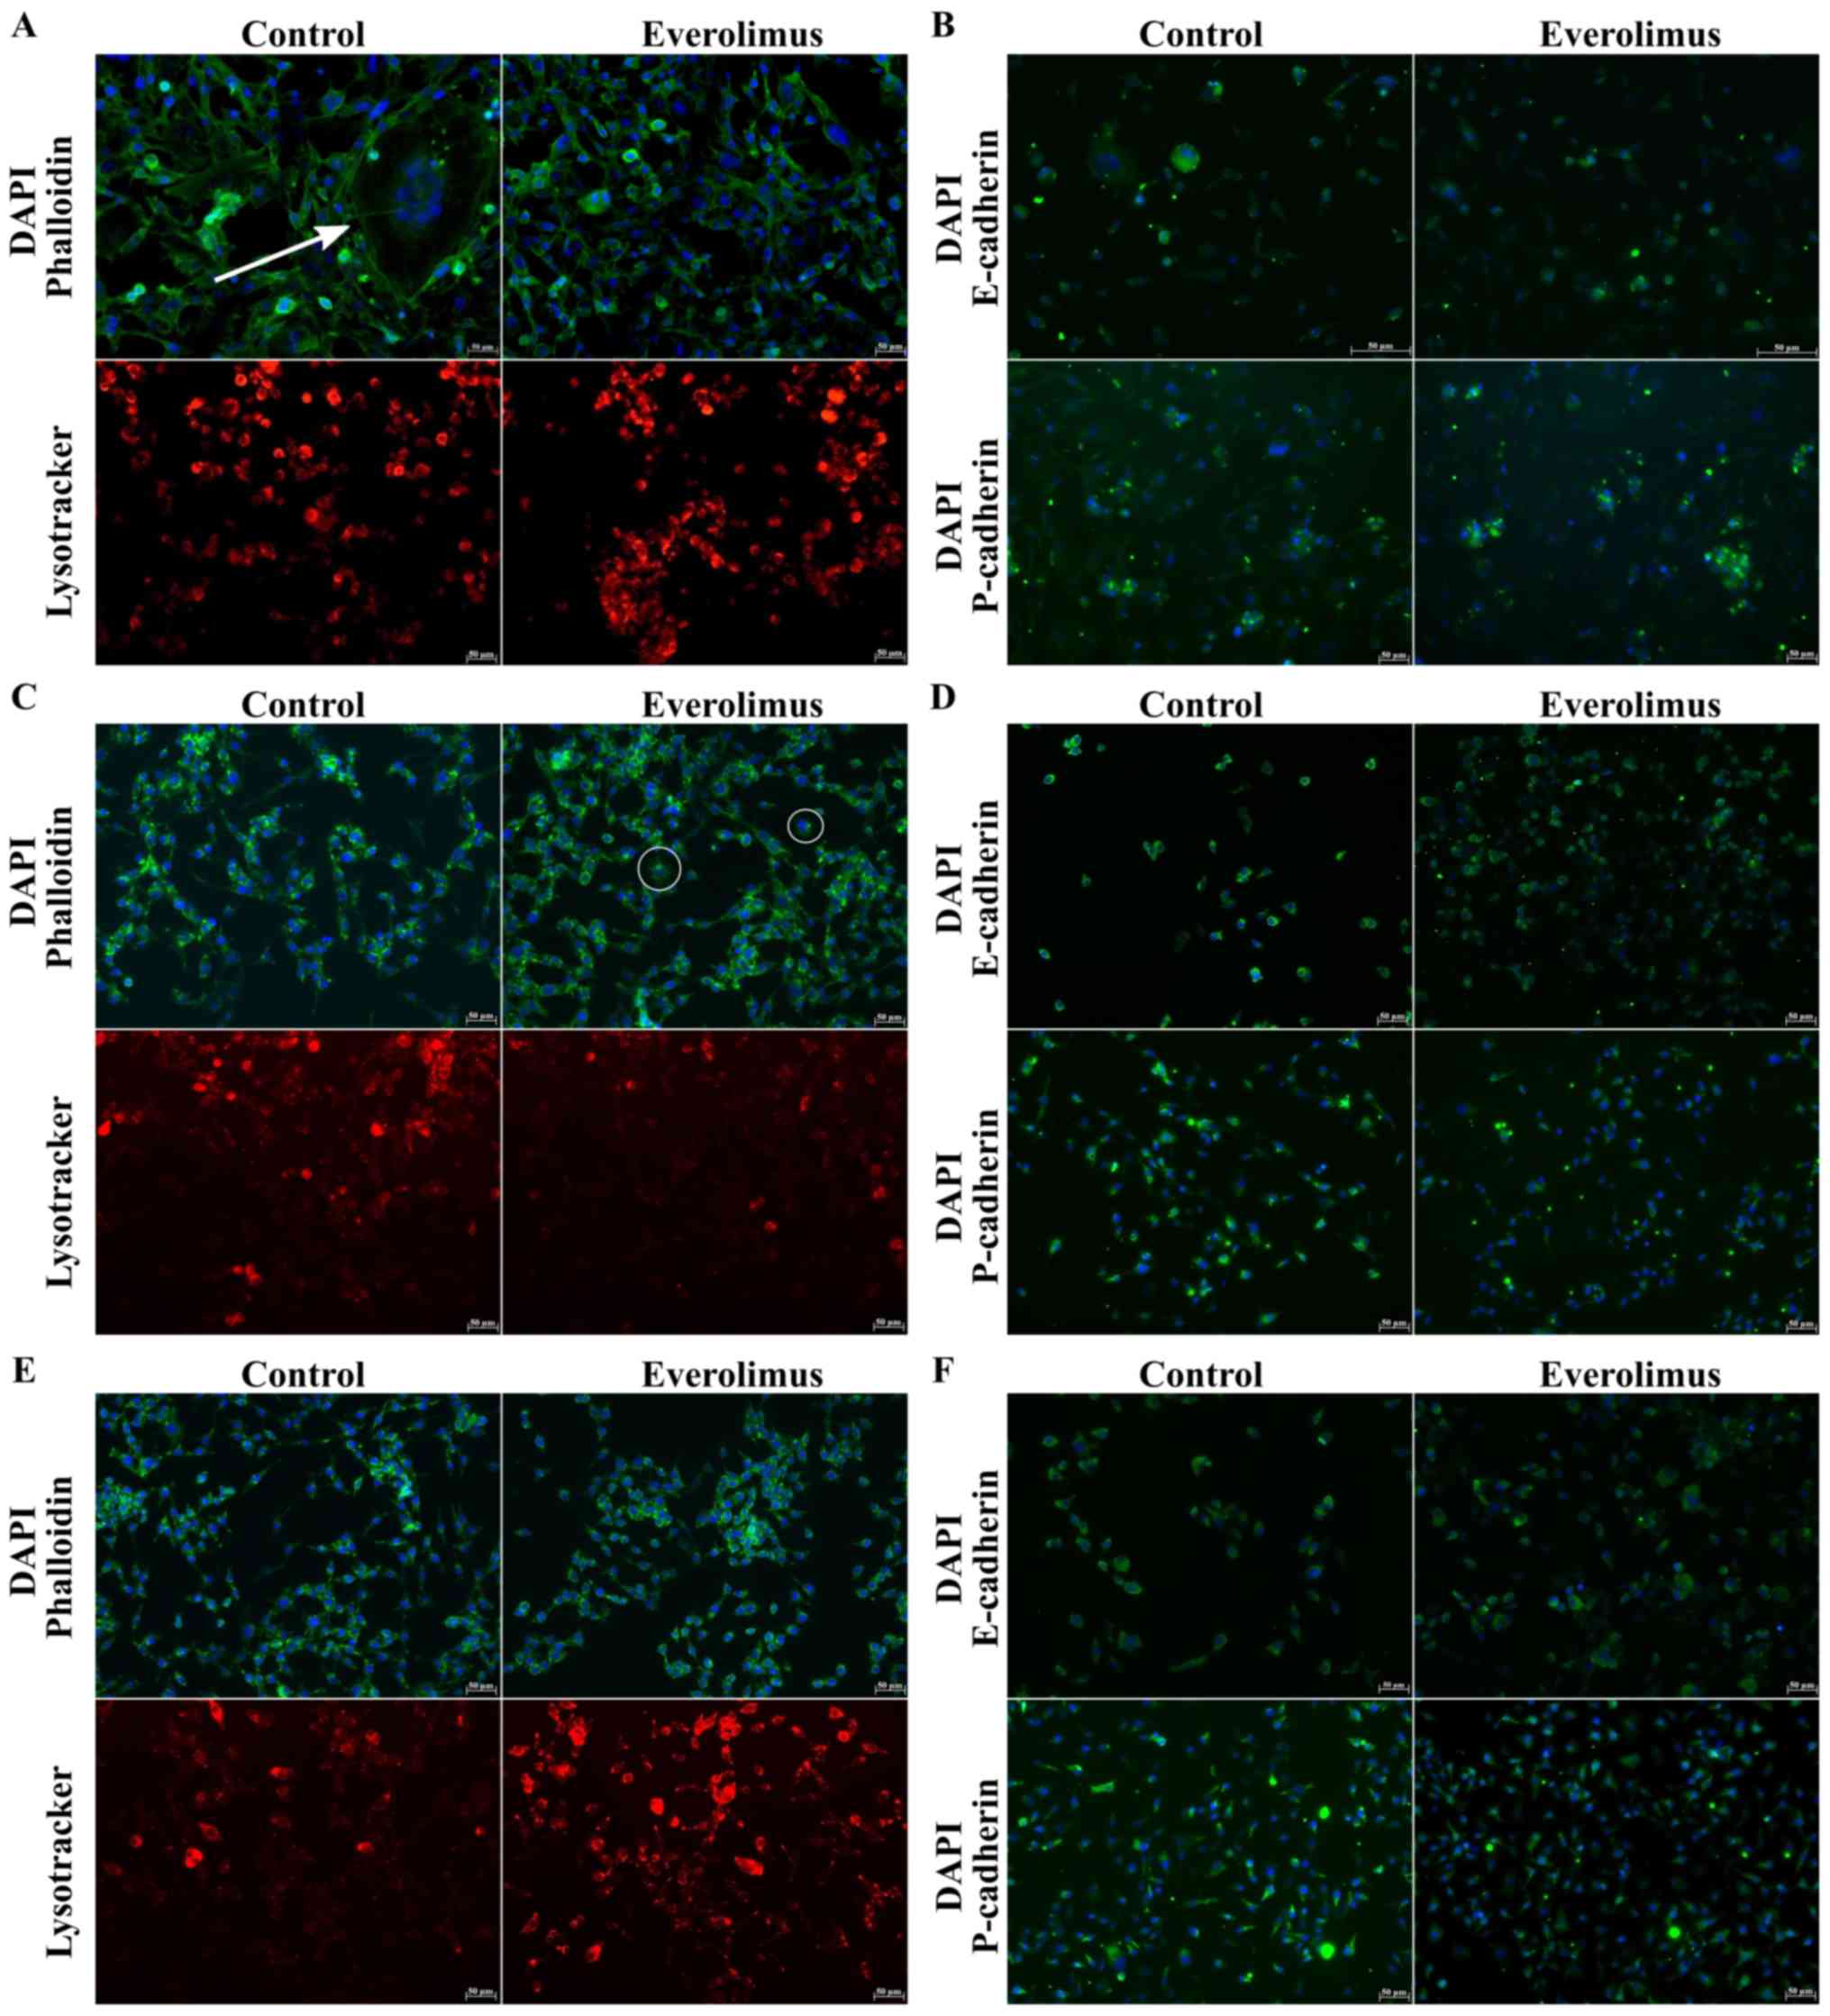
Everolimus induces morphological
changes in cell lines
In untreated BT-549 cells, extensive cytoplasmic
projections were observed before exposure to everolimus (white
arrow; Fig. 2A). Analyses of
RKO-AS45-1 (Fig. 2C) and TOV-21G
(Fig. 2E) nuclei did not reveal any
significant changes in cell size. However, after treatment with
everolimus, the RKO-AS45-1 cells exhibited cytoplasmic extensions
(white circle) similar to those of untreated BT-549 cells. BT-549
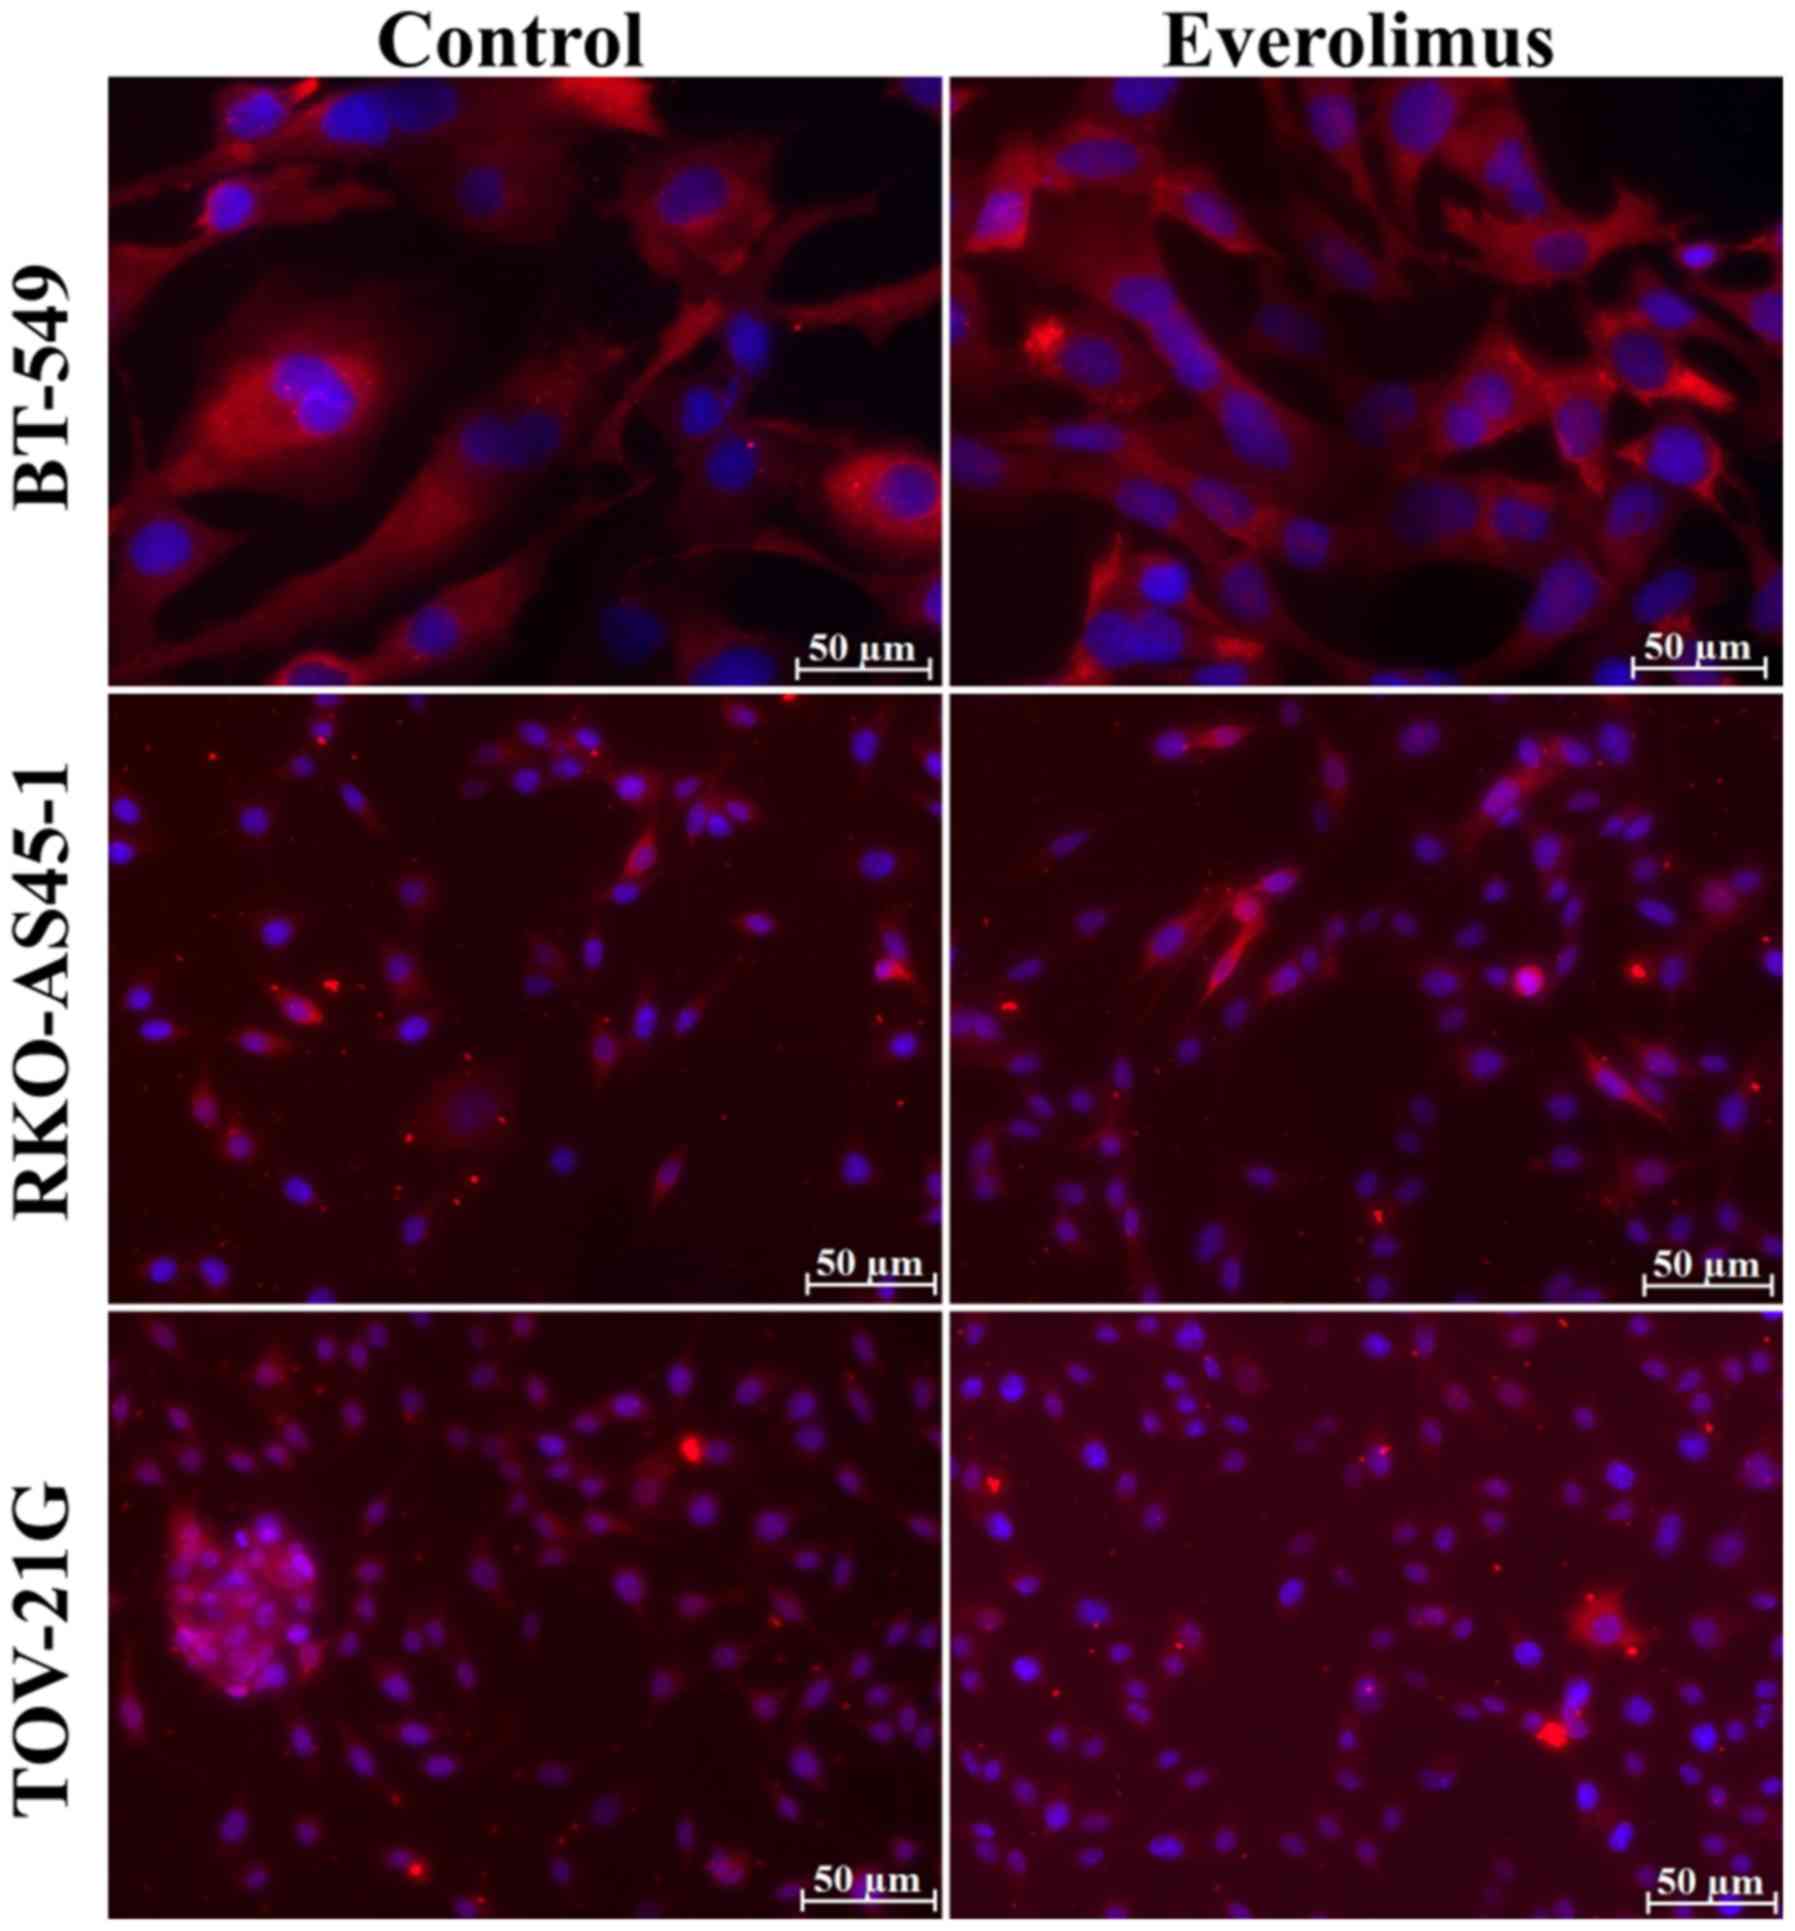
cells were negative for the epithelial markers E/P-cadherin
(Fig. 2B), but positive for the
mesenchymal marker fibronectin (Fig.
3). RKO-AS45-1 and TOV-21G cells were positive for E/P-cadherin
(Fig. 2D and F, respectively), but
most of the RKO-AS45-1 and TOV-21G cells were negative for
fibronectin (Fig. 3).
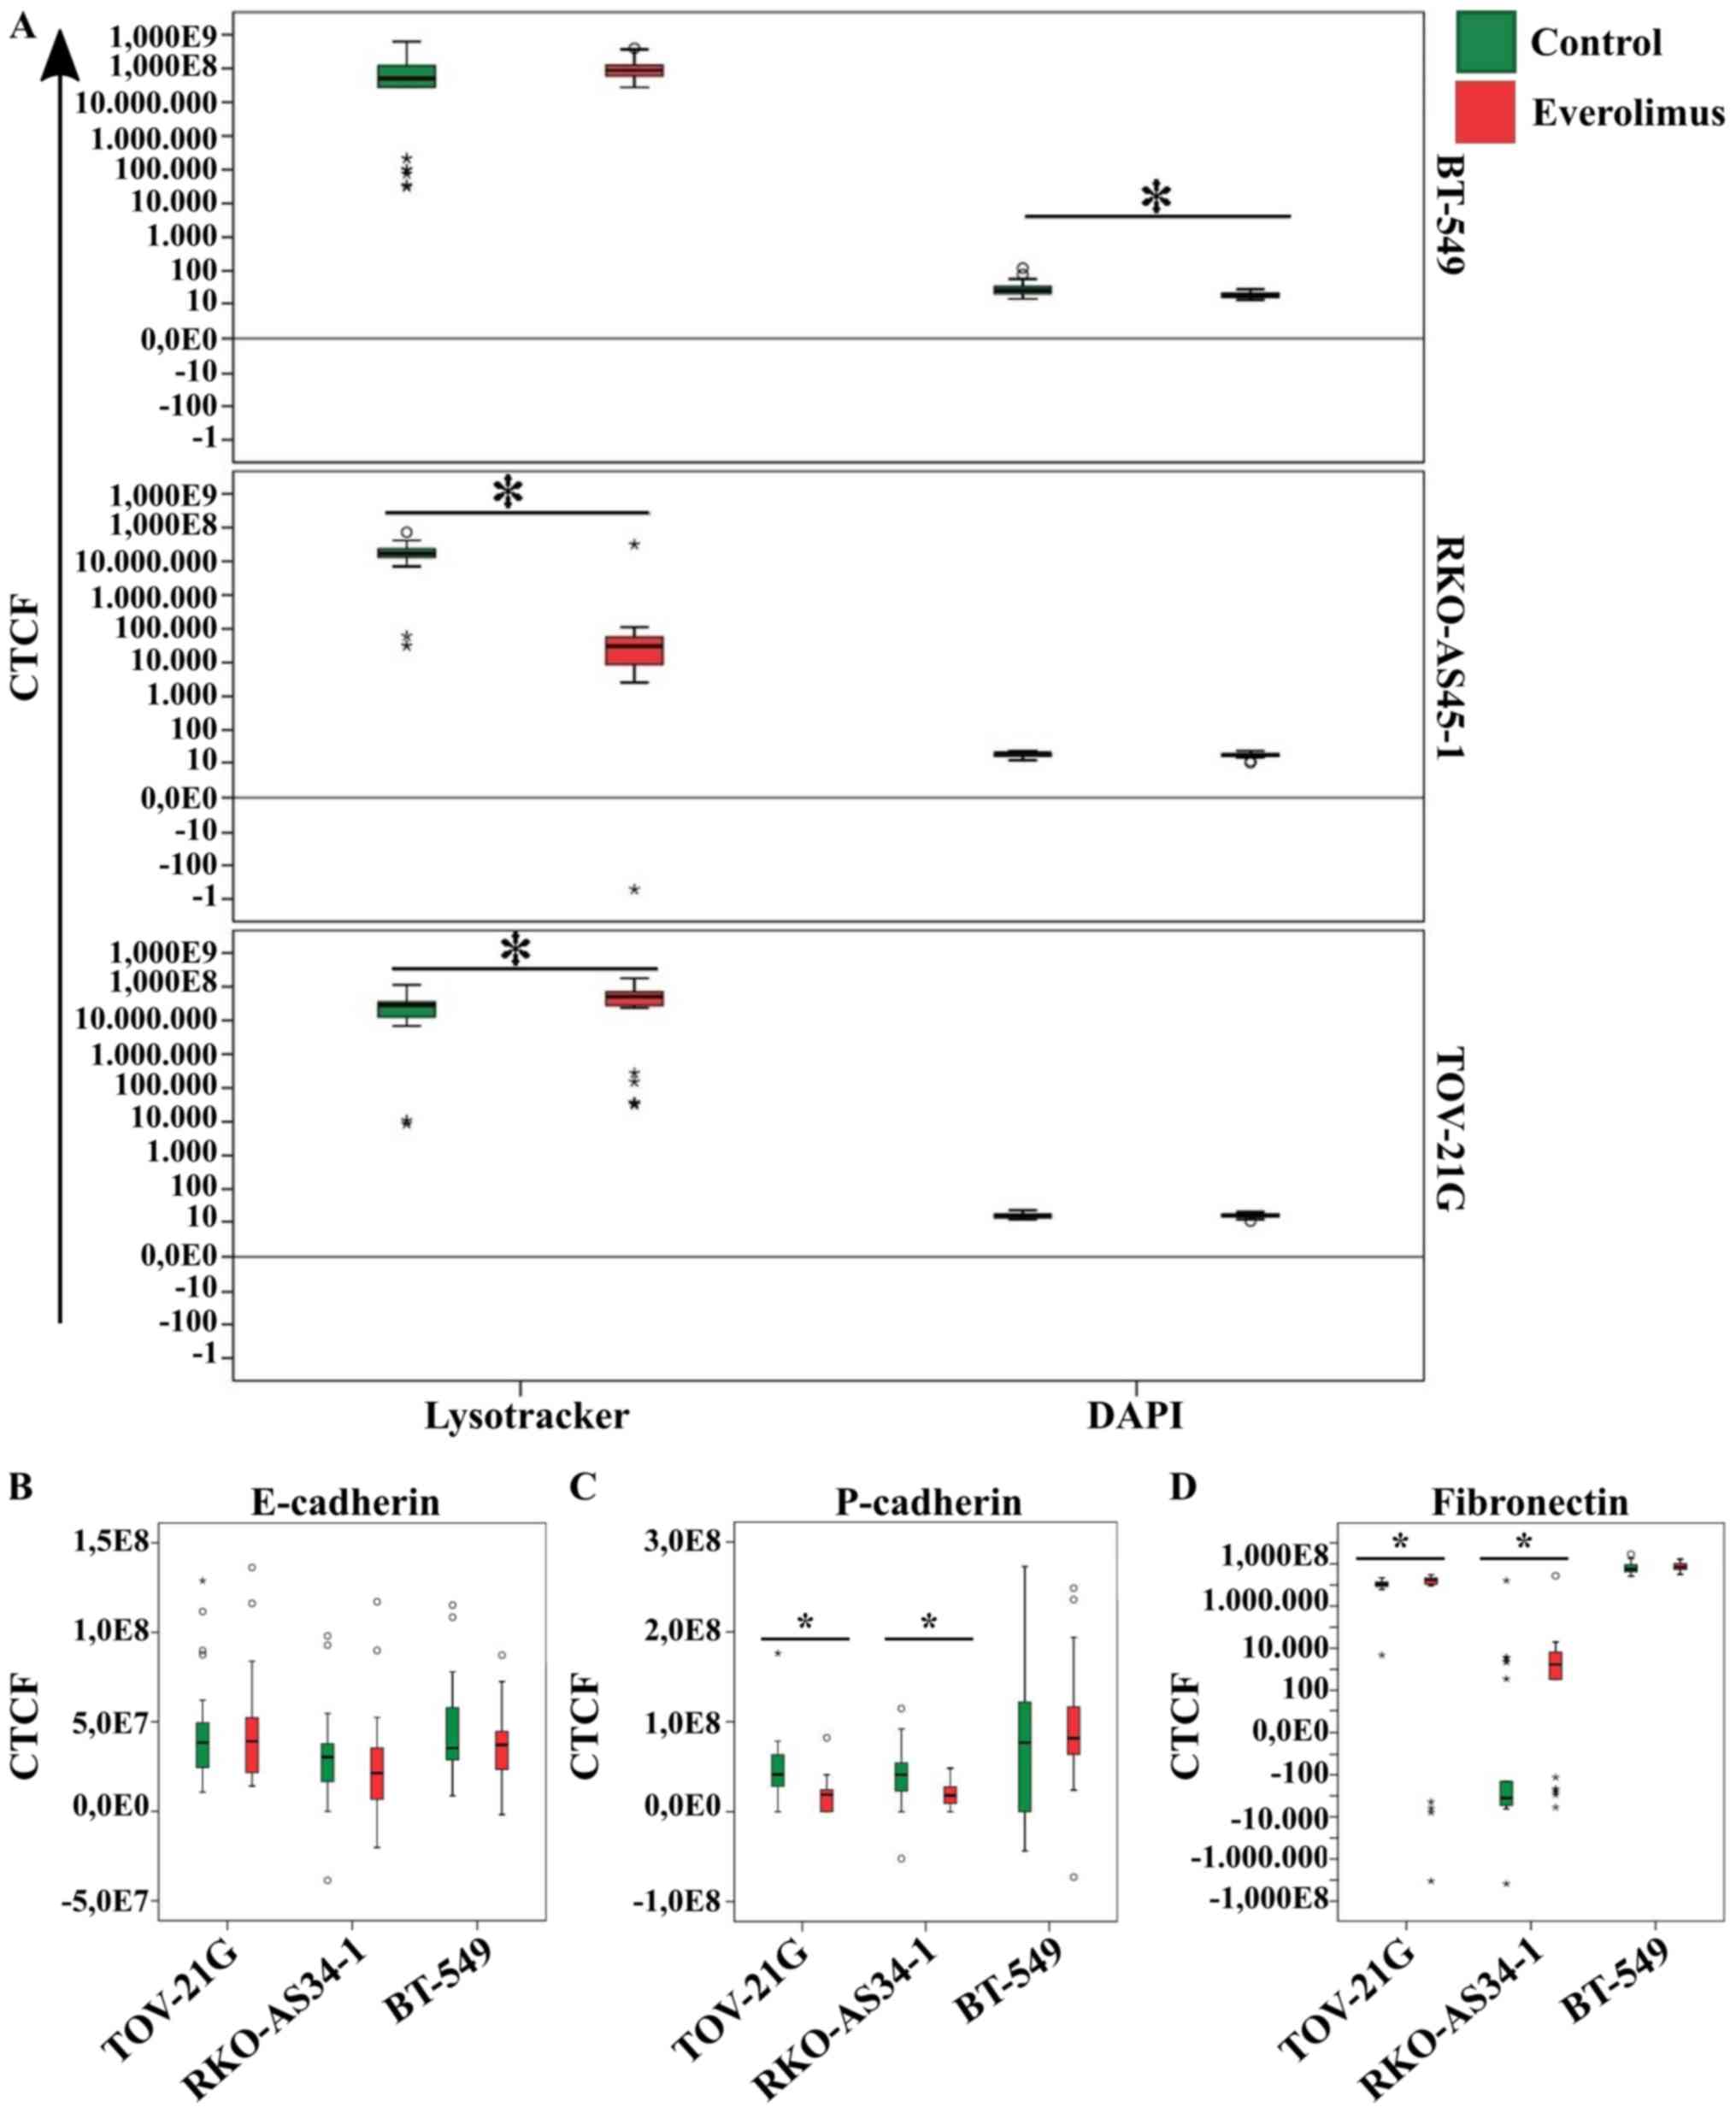
Following treatment with everolimus, a loss of
BT-549 cell cytoskeleton integrity was observed, as demonstrated by
the CTCF analysis of cell nuclei measured (Fig. 4A). No statistical differences in
lysosome labeling were observed between the untreated and
everolimus-treated groups of BT-549 cells. Analysis of the
lysosomal profile revealed a significant decrease in the CTCF of
RKO-AS45-1 cells and a significant increase in the CTCF of TOV-21G
cells treated with everolimus compared with untreated cells
(Fig. 4A). After treatment with
everolimus, no significant changes were observed for E/P-cadherin
or fibronectin CTCF in the BT-549 cell line (Fig. 4B-D). Treatment with everolimus also
did not affect the expression of E-cadherin in RKO-AS45-1 and
TOV-21G cells. However, a decrease in P-cadherin expression and an
increase in fibronectin expression were observed in the RKO-AS45-1
and TOV-21G cell lines treated with everolimus compared with the
untreated control cells (Fig.
4B-D).
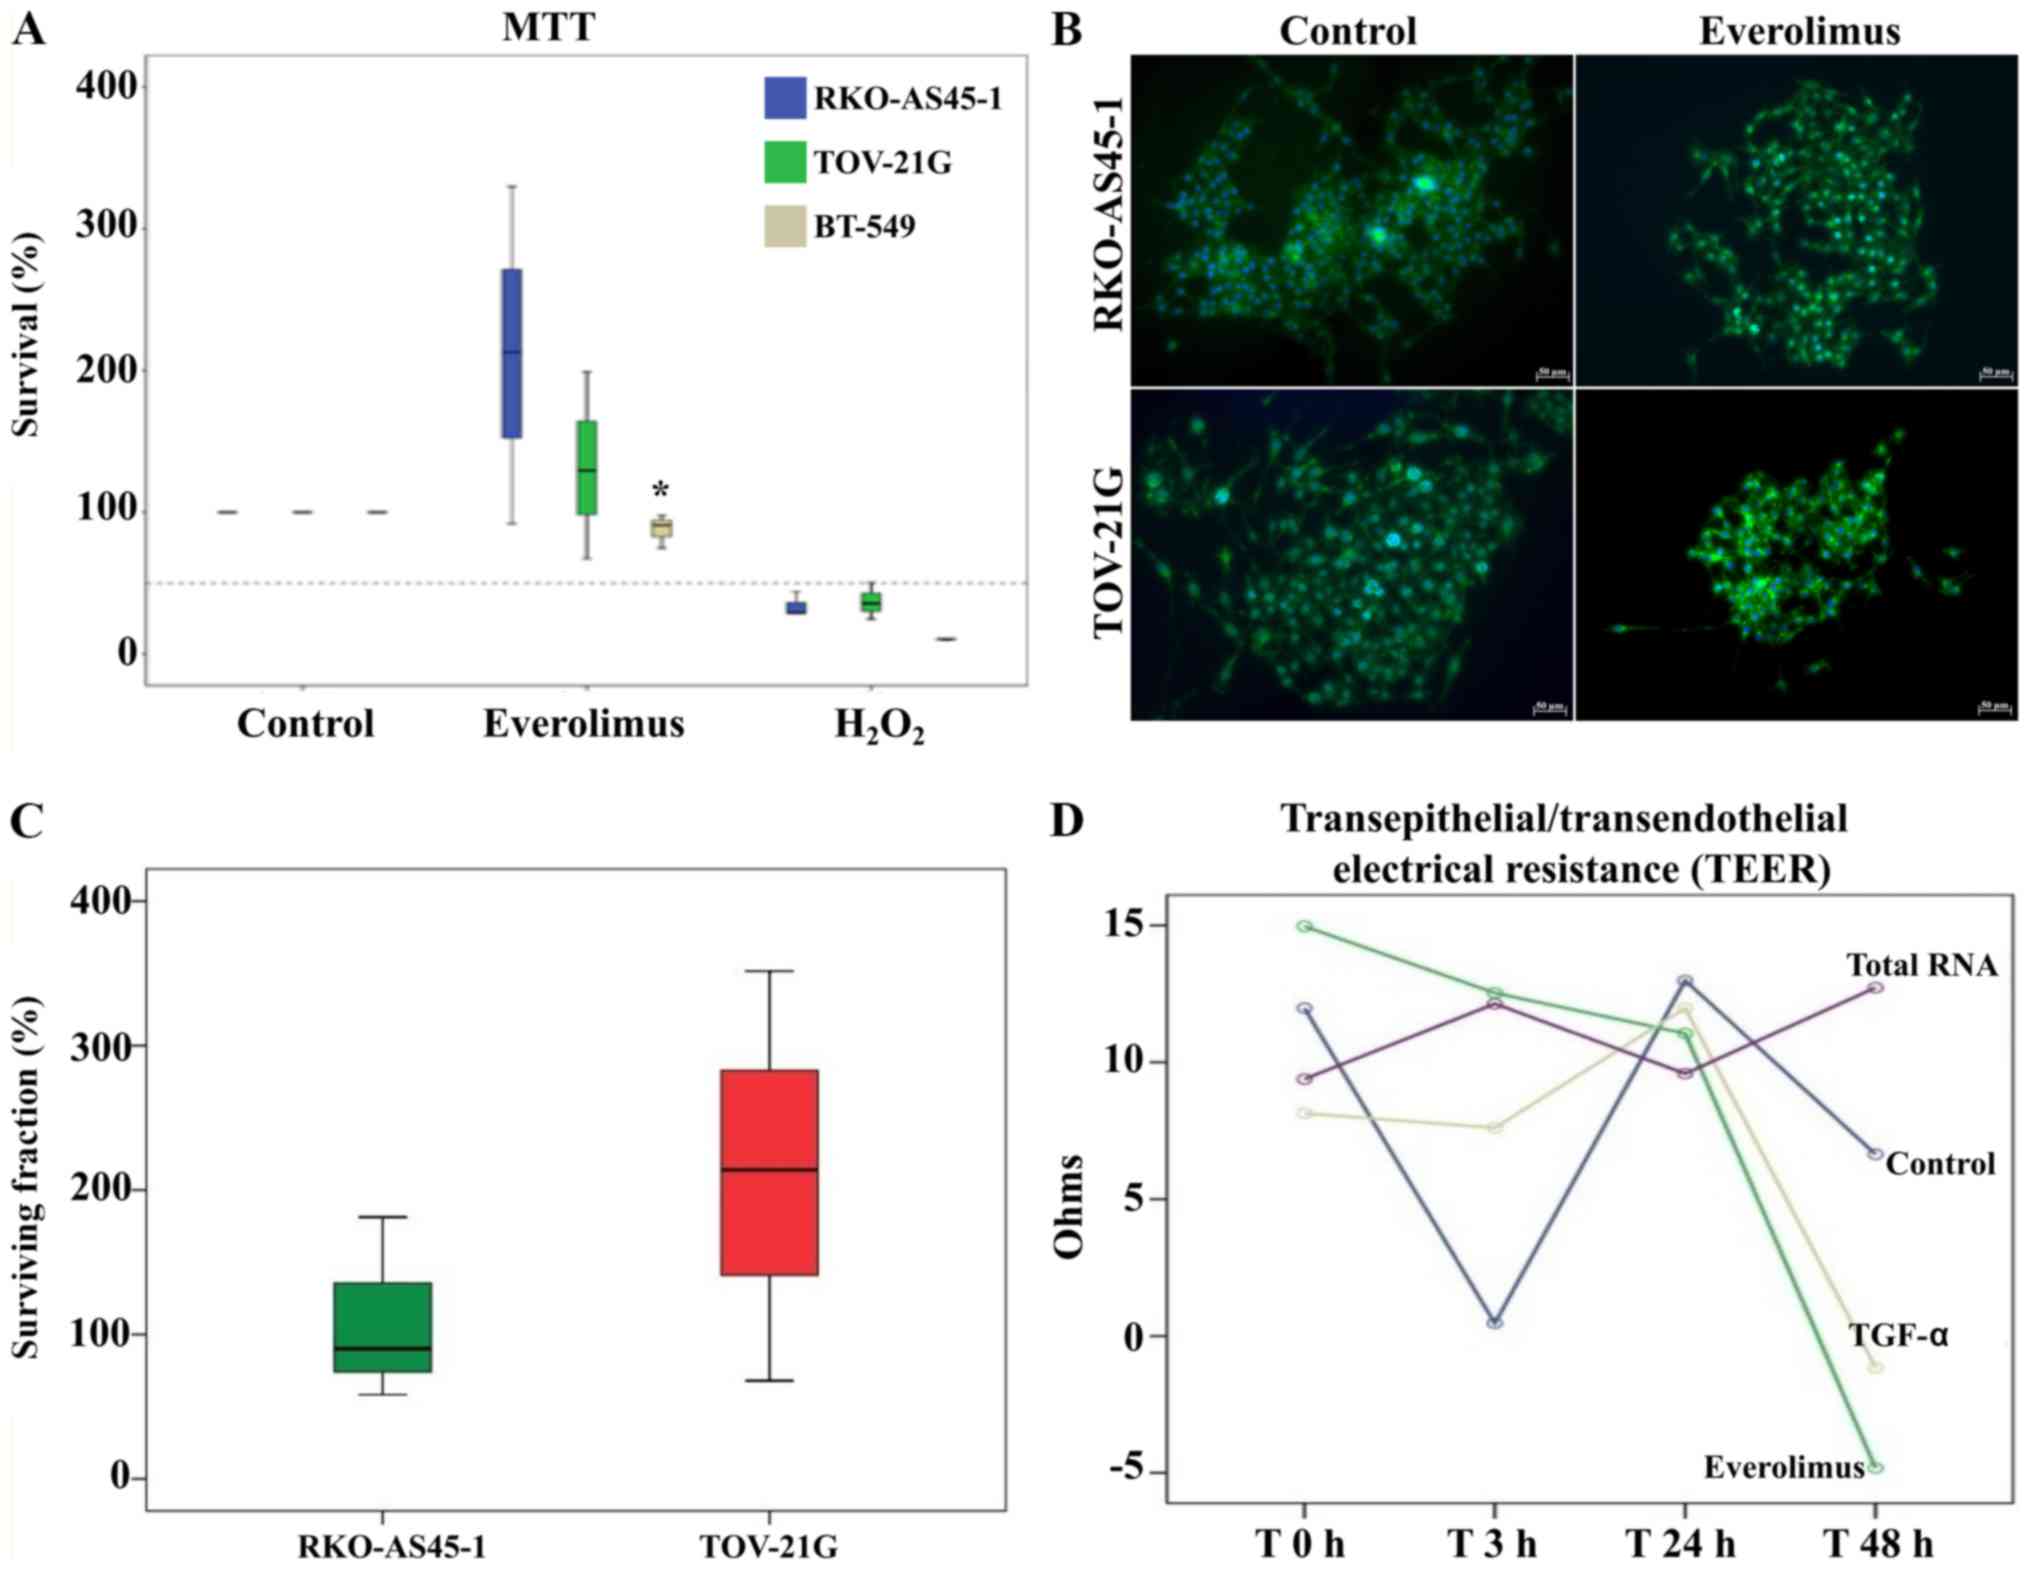
Everolimus decreases proliferation in
BT-549 cells
The MTT assay was performed to evaluate the survival
of BT-549, RKO-AS45-1 and TOV-21G cells following treatment with
everolimus to determine whether the 100 nM concentration of the
drug may lead to an increase in cell proliferation (Fig. 5A). The viability of RKO-AS45-1 and
TOV-21G cells treated with everolimus was higher compared with that
of the positive and negative controls; however, the differences
between the everolimus-treated and untreated groups were not
significant. By contrast, the viability of BT-549 cells after
treatment with everolimus was significantly lower compared with
that of the untreated controls.
Everolimus induces clonogenic
survival
RKO-AS45-1 cells treated with 100 nM everolimus were
observed to form colonies that were farther distanced from each
other compared with those formed by untreated cells (Fig. 5B). A high SF was observed, especially
for TOV-21G cells, but the difference between the treated and
untreated cells was not statistically significant (Fig. 5C).
Everolimus induces changes in
TEER
According to the aforementioned results, RKO-AS45-1
cells exhibit more EMT characteristics after treatment with 100 nM
everolimus. Therefore, this cell line was selected for the TEER
assay. The TEER of the RKO-AS45-1 monolayer started to decrease at
48 h post-treatment with TGF-α and everolimus, indicating changes
in the integrity of the cell monolayer. However, no significant
differences were observed among the treatments (Fig. 5D).
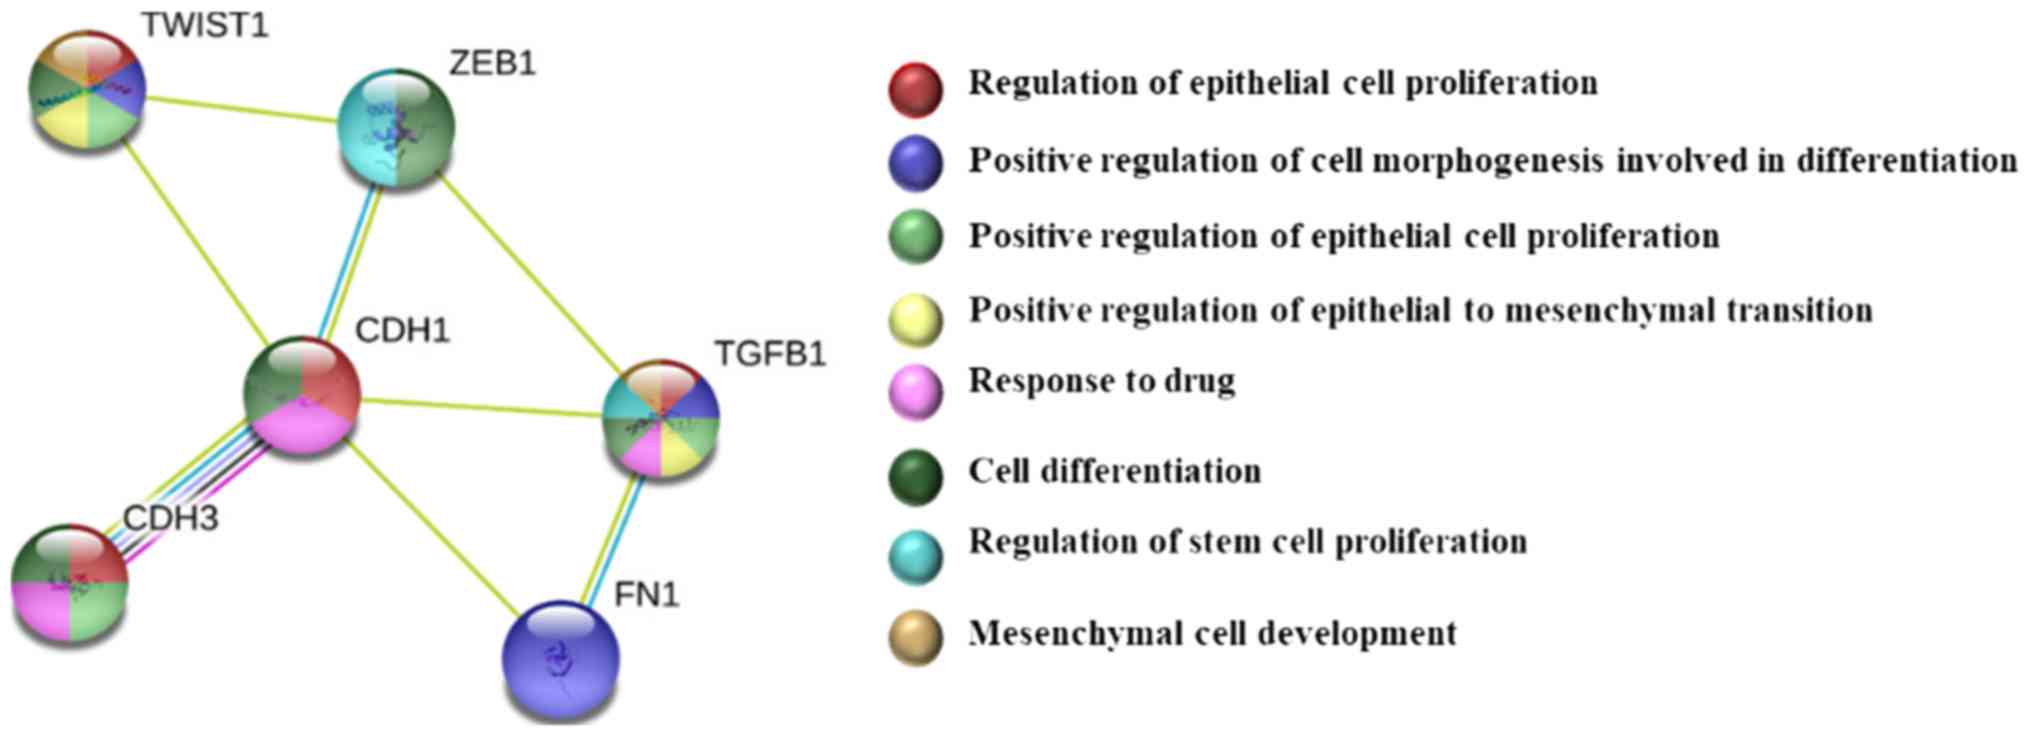
PPIs and classification of EMT target
mutations
The analysis in the STRING database was performed to
explore the PPIs of the EMT targets evaluated in the present study
(Fig. 6). No mutations were
identified in the EMT genes in BT-549 and TOV-21G cells (Table II). For the RKO cell line, missense
mutations were identified in the TGFB1 and P-cadherin genes,
and nonsense mutations were identified in ZEB1.
| Table II.Classification of mutations in EMT
targets in cell lines used in the present study according to the
COSMIC database. |
Table II.
Classification of mutations in EMT
targets in cell lines used in the present study according to the
COSMIC database.
| Cell line | Mutation | Type |
|---|
| BT-549 | Not found |
|
| RKO | ZEB1
(ENSG00000148516) | Substitution
nonsense |
|
| TGFB1
(ENST00000221930) | Substitution
missense |
|
| CDH3
(ENSG00000062038) | Substitution
missense |
| TOV-21G | Not found |
|
Discussion
EMT is a highly orchestrated event involving a
series of changes that lead to the loss of epithelial cell
characteristics, such as a decrease in adhesion molecules and
apical-basal polarity, and to the acquisition of a mesenchymal
phenotype and the capacity of invasion and migration through the
remodeling of the extracellular matrix, with the release of
metalloproteases and expression of fibronectin, laminin and
collagen; therefore, the EMT phenomenon is closely associated with
carcinogenesis, metastasis and chemoresistance (17).
In TGFB1, TWIST1 and ZEB1 relative
gene expression assays in the present study, untreated BT-549 and
WI-26 VA4 samples were used as normalization controls. The BT-549
cell line exhibits mesenchymal characteristics, and are cells that
have undergone EMT (18). WI-26 VA4
cells are fibroblasts; therefore, they have a true mesenchymal
phenotype (19).
TWIST transcription factors serve an important role
in the EMT phenomenon, especially in cancer cells; TWIST decreases
the expression of epithelial genes, such as E-cadherin, and
promotes the expression of mesenchymal genes, such as fibronectin
(20). In addition to TWIST1, ZEB1
is another transcriptional factor that regulates E-cadherin
expression by binding to regions known as enhancers, thus
decreasing the transcription efficiency of this gene (20). In addition, the TGFB1 protein is
involved in EMT, as it changes the plasticity of epithelial cells
and promotes the remodeling of the extracellular matrix
composition, thus stimulating the expression of proteins such as
collagen and fibronectin, as well as being involved in the
differentiation and maintenance of cancer stem cells (CSCs)
(21,22).
Previous studies have demonstrated that TGFB1
is capable of inducing EMT in colorectal and breast cancer cell
lines (4,23–25). In
the present study, the upregulation of TGFB1 mRNA expression
was observed in RKO-AS45-1 and BT-549 cells after treatment with
everolimus compared with all three normalization controls, although
these results were not statistically significant. Wang et al
(26) have demonstrated that
overexpression of TWIST1 induces the EMT phenomenon in
breast cancer cells. In addition, TWIST1 has been described as a
potential biomarker of poor prognosis, chemoresistance, metastasis
and disease recurrence in colorectal cancer (26–28).
Thus, the results of the present study indicating the upregulation
of TWIST1 in breast and colorectal cancer cells following
everolimus treatment compared with that in untreated cells
reinforces the hypothesis that everolimus acts as an inducer of the
EMT. The upregulation of ZEB1 expression in RKO-AS45-1 and
TOV-21G cells after treatment compared with that in untreated cells
observed in the present study was also in agreement with the
hypothesis that everolimus triggers the in vitro EMT
phenomenon. The downregulation of TGFB1 and TWIST1 in
TOV-21G cells compared with all three normalization controls may
indicate that the EMT phenomenon in these cells was dependent on
other pathways different from those triggered by these targets.
Gupta et al (29) have demonstrated that lncRNA
HOTAIR is associated with metastasis in breast cancer.
HOTAIR interacts with the polycomb repressive complex 2 and
causes repression of epithelial markers such as E-cadherin via
H3K27 trimethylation, thereby promoting EMT and inducing cancer
stem cell features (29).
In the BT-549 cell line, which is representative of
a basal-like subtype of triple-negative breast tumors characterized
by lack of treatment and aggressiveness (18,30,31),
high expression levels of HOTAIR may be considered a poor
prognostic feature (29). According
to Padua et al (32), cells
that express high levels of HOTAIR also exhibit high
expression levels of EMT-inducing genes, such as ZEB1,
TWIST1 and TGFB1.
The occurrence of filopodia (projections of the
cytoplasm described in the literature as structures rich in actin
filaments that contribute to cell movement) in cancer increases the
invasive and migratory abilities of cells, and is also associated
with the EMT phenomenon (33). In
the present study, RKO-AS45-1 cells exhibited filopodia after
everolimus treatment at 100 nM, and together with the upregulated
EMT gene expression, it was hypothesized that these cells may have
undergone EMT after treatment. However, only TWIST1
expression exhibited significant differences.
No significant differences in lysosomes were
observed in BT-549 cells; however, analysis of the lysosomal
profile revealed a significant decrease in the CTCF of RKO-AS45-1
cells and a significant increase in the CTCF of TOV-21G cells
treated with everolimus compared with untreated cells. Changes in
CTCF in lysosome labeling can be explained by the presence of the
mTORC1 complex, which is a target of everolimus, on the surface of
lysosomes (34). When mTORC1 is
inactive, transcriptional factors translocated to the nucleus of
the cells promote the expression of genes that increase lysosome
catabolism, allowing the fusion with autophagosomes (34).
During the EMT, epithelial cells decrease the
expression of epithelial markers such as E- and P-cadherin, and
start to express mesenchymal markers such as N-cadherin,
fibronectin and vimentin (17).
These changes cause morphological cellular alterations, and the
cells acquire fusiform aspects characteristic of mesenchymal cells
(17). According to Ribeiro and
Paredes (17), the loss of
P-cadherin is a particularly common event in triple-negative breast
cancer cells with a CD24low and CD44high
profile. The results of the present study confirmed that BT-549
cells exhibited a mesenchymal phenotype and metastatic
characteristics, as previously described in the literature,
regarding the negative E/P cadherin and positive fibronectin
profile (35,36). However, in the present study,
following treatment with everolimus, BT-549 cells remained negative
for the epithelial marker E/P-cadherin, but positive for the
mesenchymal marker fibronectin.
Chen et al (37) have demonstrated that the inhibition
of the mTORC1 complex may induce hyperactivation of the mTORC2
complex, which induces the phosphorylation and activation of the
AKT protein and cell proliferation. Considering that the mTORC1
protein complex is a target of everolimus (34), the results observed in the MTT assay
for RKO-AS45-1 and TOV-21G in the present study may be explained by
the high everolimus concentration, which may have induced
hyperactivation of mTORC2, causing AKT phosphorylation and
increased cell proliferation. The low survival rate of BT-549 cells
may be associated with the upregulation of TGFB1 after
treatment with everolimus as previously reported by Zarzynska
(38). In breast cancer, TGFB1
inhibits cell cycle progression and promotes apoptosis, which
together contribute to the tumor suppressive effect during
carcinogenesis (38).
The clonogenic assay is considered a gold standard
test to evaluate the reproductive death of cells exposed to a
certain treatment by their ability to form colonies (14). In cancer cells, the clonogenic
ability is associated with chemotherapy sensitivity (14,39). In
the present study, following treatment with everolimus, the
RKO-AS45-1 colonies were distanced from each other; this may have
occurred due to everolimus causing alterations in the cell-cell
interactions, which may be associated with the decrease in
P-cadherin and increase in fibronectin expression.
Reya et al (40) have suggested that within the tumor
microenvironment, there is a small cell subset with a high
proliferative potency, clonogenic capacity and metastatic potential
termed CSCs. These authors also suggested that chemo- or
radioresistance may have enriched subpopulations of CSCs as a
result of the EMT phenomenon. Thus, the high rates of surviving
fraction observed in the clonogenic assay in the present study may
be associated with the changes acquired during the EMT event and
possibly with the presence of CSCs. Therefore, the results of the
present study confirmed the association between everolimus and EMT
in a manner that suggests that this drug is an EMT inducer.
The clonogenic assay was not performed using BT-549
cells in the present study as this cell line did not form colonies
during the experimental protocol. This result may be explained by
the absence of adhesion glycoprotein E/P-cadherin expression, which
prevented the cell-cell interaction necessary for colony
formation.
The TEER measurement of a cell monolayer is a
sensitive and reliable method to confirm the integrity and
permeability of cells (41). TEER is
considered an indicator of cellular junction integrity, since low
values of TEER indicate an increase in the electric current passage
between cell membranes, and thus an alteration in the cell
monolayer (41). In addition, TEER
is a non-invasive method that can be applied to monitor living
cells during various stages of growth and differentiation. In the
present study, RKO-AS45-1 cells were treated with the total RNA
isolated from this cell line since certain non-coding RNAs modulate
cellular plasticity, interfering in different signaling pathways
and leading the cells to acquire a mesenchymal phenotype, a
condition related to EMT (42).
Members of the TGF family serve an important role in the signaling
pathways involved in cell growth, proliferation and
differentiation, and ability to change the expression of cellular
junction proteins, leading to the loss of cell polarity and
inducing the EMT phenomenon, which has been previously described
(43,44). Tomei et al (11) have demonstrated that 100 nM
everolimus regulates the expression of proteins associated with
cell-cell interaction, such as E-cadherin and tight junction
protein 1, contributing to the decrease in cell polarity and the
interaction between cancer cells, which increases the possibility
of metastasis.
In conclusion, the present study investigated the
in vitro effects of everolimus on the EMT properties in
three epithelial cancer cell lines. The BT-549 cell line has been
previously described to exhibit EMT characteristics (18), whereas to the best of our knowledge,
there are no reports regarding the RKO-AS45-1 and TOV-21G cell
lines. The present study supported the idea that everolimus may
trigger EMT in tumor cells that do not exhibit this characteristic;
in addition, the results of the present study open the door to the
use of a non-invasive model for evaluating and monitoring
epithelial resistance in cancer cells. Therefore, further studies
using human clinical samples will be conducted by our group to
confirm these findings.
Acknowledgements
Not applicable.
Funding
No funding was received.
Availability of data and materials
The datasets used and/or analyzed during the current
study are available from the corresponding author on reasonable
request.
Authors' contributions
BOPG is responsible for the conceptualization, data
collection and analysis, literature review, writing the original
draft and revising the manuscript. WPDA, LDCB and SLF were
responsible for the data collection and interpretation. LMS is the
research advisor responsible for the conceptualization, data
analysis, supervision and manuscript revision. All authors read and
approved the final version of the manuscript.
Ethics approval and consent to
participate
Not applicable.
Patient consent for publication
Not applicable.
Competing interests
The authors declare that they have no competing
interests.
Glossary
Abbreviations
Abbreviations:
|
CTCF
|
corrected total cell fluorescence
|
|
EMT
|
epithelial-to-mesenchymal
transition
|
|
lncRNA
|
long non-coding RNA
|
|
HOTAIR
|
HOX transcript antisense RNA
|
|
RQ
|
relative quantification
|
|
TEER
|
transendothelial/transepithelial
electrical resistance
|
|
TGFB1
|
transforming growth factor β1
|
|
TWIST1
|
twist family basic helix-loop-helix
transcription factor 1
|
|
ZEB1
|
zinc finger E-box-binding homeobox
1
|
References
|
1
|
Tye CE, Gordon JA, Martin-Buley LA, Stein
JL, Lian JB and Stein GS: Could lncRNAs be the missing links in
control of mesenchymal stem cell differentiation? J Cell Physiol.
230:526–534. 2015. View Article : Google Scholar : PubMed/NCBI
|
|
2
|
Vella LJ: The emerging role of exosomes in
epithelial-mesenchymal-transition in cancer. Fron Oncol.
4:3612014.
|
|
3
|
Xu Q, Deng F, Qin Y, Zhao Z, Wu Z, Xing Z,
Ji A and Wang QJ: Long non-coding RNA regulation of
epithelial-mesenchymal transition in cancer metastasis. Cell Death
Dis. 7:e22542016. View Article : Google Scholar : PubMed/NCBI
|
|
4
|
Tan EJ, Olsson AK and Moustakas A:
Reprogramming during epithelial to mesenchymal transition under the
control of TGFβ. Cell Adh Migr. 9:233–246. 2015. View Article : Google Scholar : PubMed/NCBI
|
|
5
|
Hajjari M and Salavaty A: HOTAIR: An
oncogenic long non-coding RNA in different cancers. Cancer Biol
Med. 12:1–9. 2015.PubMed/NCBI
|
|
6
|
Gutschner T and Diederichs S: The
hallmarks of cancer: A long non-coding RNA point of view. RNA Biol.
9:703–719. 2012. View Article : Google Scholar : PubMed/NCBI
|
|
7
|
Zhang J, Zhang P, Wang L, Piao HL and Ma
L: Long non-coding RNA HOTAIR in carcinogenesis and metastasis.
Acta Biochim Biophys Sin. 46:1–5. 2013. View Article : Google Scholar : PubMed/NCBI
|
|
8
|
Hurvitz SA, Dalenc F, Campone M, O'Regan
RM, Tjan-Heijnen VC, Gligorov J, Llombart A, Jhangiani H,
Mirshahidi HR, Tan-Chiu E and Miao S: A phase 2 study of everolimus
combined with trastuzumab and paclitaxel in patients with
HER2-overexpressing advanced breast cancer that progressed during
prior trastuzumab and taxane therapy. Breast Cancer Res Treat.
141:437–446. 2013. View Article : Google Scholar : PubMed/NCBI
|
|
9
|
Baselga J, Semiglazov V, van Dam P,
Manikhas A, Bellet M, Mayordomo J, Campone M, Kubista E, Greil R,
Bianchi GS, et al: Phase II randomized study of neoadjuvant
everolimus plus letrozole compared with placebo plus letrozole in
patients with estrogen receptor-positive breast cancer. J Clin
Oncol. 27:2630–2637. 2009. View Article : Google Scholar : PubMed/NCBI
|
|
10
|
Ellard SL, Clemons M, Gelmon KA, Norris B,
Kennecke H, Chia S, Pritchard K, Eisen A, Vandenberg T, Taylor M,
et al: Randomized phase II study comparing two schedules of
everolimus in patients with recurrent/metastatic breast cancer:
NCIC Clinical Trials Group IND. 163. J Clin Oncol. 27:4536–4541.
2009. View Article : Google Scholar : PubMed/NCBI
|
|
11
|
Tomei P, Masola V, Granata S, Bellin G,
Carratù P, Ficial M, Ventura VA, Onisto M, Resta O, Gambaro G, et
al: Everolimus-induced epithelial to mesenchymal transition (EMT)
in bronchial/pulmonary cells: When the dosage does matter in
transplantation. J Nephrol. 29:881–891. 2016. View Article : Google Scholar : PubMed/NCBI
|
|
12
|
Masola V, Carraro A, Zaza G, Bellin G,
Montin U, Violi P, Lupo A and Tedeschi U: Epithelial to mesenchymal
transition in the liver field: The double face of Everolimus in
vitro. BMC Gastroenterol. 15:1182015. View Article : Google Scholar : PubMed/NCBI
|
|
13
|
Livak KJ and Schmittgen TD: Analysis of
relative gene expression data using real-time quantitative PCR and
the 2(-Delta Delta C(T)) method. Methods. 25:402–408. 2001.
View Article : Google Scholar : PubMed/NCBI
|
|
14
|
Mitchell PS, Parkin RK, Kroh EM, Fritz BR,
Wyman SK, Pogosova-Agadjanyan EL, Peterson A, Noteboom J, O'Briant
KC, Allen A, et al: Circulating microRNAs as stable blood-based
markers for cancer detection. Proc Natl Acad Sci USA.
105:10513–10518. 2008. View Article : Google Scholar : PubMed/NCBI
|
|
15
|
Franken NA, Rodermond HM, Stap J, Haveman
J and Van Bree C: Clonogenic assay of cells in vitro. Nat Protoc.
1:2315–2319. 2006. View Article : Google Scholar : PubMed/NCBI
|
|
16
|
Szklarczyk D, Franceschini A, Wyder S,
Forslund K, Heller D, Huerta-Cepas J, Simonovic M, Roth A, Santos
A, Tsafou KP, et al: STRING v10: Protein-protein interaction
networks, integrated over the tree of life. Nucleic Acids Res.
43((Database Issue)): D447–D452. 2015. View Article : Google Scholar : PubMed/NCBI
|
|
17
|
Ribeiro AS and Paredes J: P-cadherin
linking breast cancer stem cells and invasion: A promising marker
to identify an ‘intermediate/metastable’ EMT state. Front Oncol.
4:3712014.PubMed/NCBI
|
|
18
|
Tryndyak VP, Beland FA and Pogribny IP:
E-cadherin transcriptional down-regulation by epigenetic and
microRNA-200 family alterations is related to mesenchymal and
drug-resistant phenotypes in human breast cancer cells. Int J
Cancer. 126:2575–2583. 2010.PubMed/NCBI
|
|
19
|
Pittenger MF, Mackay AM, Beck SC, Jaiswal
RK, Douglas R, Mosca JD, Moorman MA, Simonetti DW, Craig S and
Marshak DR: Multilineage potential of adult human mesenchymal stem
cells. Science. 284:143–147. 1999. View Article : Google Scholar : PubMed/NCBI
|
|
20
|
Zhang GJ, Zhou T, Tian HP, Liu ZL and Xia
SS: High expression of ZEB1 correlates with liver metastasis and
poor prognosis in colorectal cancer. Oncol Lett. 5:564–568. 2013.
View Article : Google Scholar : PubMed/NCBI
|
|
21
|
Lamouille S, Xu J and Derynck R: Molecular
mechanisms of epithelial-mesenchymal transition. Nat Rev Mol Cell
Biol. 15:178–196. 2014. View Article : Google Scholar : PubMed/NCBI
|
|
22
|
Wang MK, Sun HQ, Xiang YC, Jiang F, Su YP
and Zou ZM: Different roles of TGF-β in the multi-lineage
differentiation of stem cells. World J Stem Cells. 4:28–34. 2012.
View Article : Google Scholar : PubMed/NCBI
|
|
23
|
Mao L, Li Y, Zhao J, Li Q, Yang B, Wang Y,
Zhu Z, Sun H and Zhai Z: Transforming growth factor-β1 contributes
to oxaliplatin resistance in colorectal cancer via epithelial to
mesenchymal transition. Oncol Lett. 14:647–654. 2017. View Article : Google Scholar : PubMed/NCBI
|
|
24
|
Vu T and Datta PK: Regulation of EMT in
colorectal cancer: A culprit in metastasis. Cancers. 9:1712017.
View Article : Google Scholar
|
|
25
|
Xu Q, Wang L, Li H, Han Q, Li J, Qu X,
Huang S and Zhao RC: Mesenchymal stem cells play a potential role
in regulating the establishment and maintenance of
epithelial-mesenchymal transition in MCF7 human breast cancer cells
by paracrine and induced autocrine TGF-β. Int J Oncol. 41:959–968.
2012. View Article : Google Scholar : PubMed/NCBI
|
|
26
|
Wang Y, Liu J, Ying X, Lin PC and Zhou BP:
Twist-mediated epithelial-mesenchymal transition promotes breast
tumor cell invasion via inhibition of hippo pathway. Sci Rep.
6:246062016. View Article : Google Scholar : PubMed/NCBI
|
|
27
|
Yusup A, Huji B, Fang C, Wang F, Dadihan
T, Wang HJ and Upur H: Expression of trefoil factors and TWIST1 in
colorectal cancer and their correlation with metastatic potential
and prognosis. World J Gastroenterol. 23:110–120. 2017. View Article : Google Scholar : PubMed/NCBI
|
|
28
|
Kim YH, Kim G, Kwon CI, Kim JW, Park PW
and Hahm KB: TWIST1 and SNAI1 as markers of poor prognosis in human
colorectal cancer are associated with the expression of ALDH1 and
TGF-β1. Oncol Rep. 31:1380–1388. 2014. View Article : Google Scholar : PubMed/NCBI
|
|
29
|
Gupta RA, Shah N, Wang KC, Kim J, Horlings
HM, Wong DJ, Tsai MC, Hung T, Argani P, Rinn JL, et al: Long
noncoding RNA HOTAIR reprograms chromatin state to promote cancer
metastasis. Nature. 464:1071–1076. 2010. View Article : Google Scholar : PubMed/NCBI
|
|
30
|
Breastcancer.org, . Triple-Negative Breast
Cancer. http://www.breastcancer.org/symptoms/diagnosis/trip_negOctober.
2017
|
|
31
|
Chacón RD and Costanzo MV: Triple-negative
breast cancer. Breast Cancer Res. 12 (Suppl 2):S32010. View Article : Google Scholar
|
|
32
|
Pádua Alves C, Fonseca AS, Muys BR, de
Barros E, Lima Bueno R, Bürger MC, de Souza JE, Valente V, Zago MA
and Silva WA Jr: Brief report: The lincRNA HOTAIR is required for
epithelial-to-mesenchymal transition and stemness maintenance of
cancer cell lines. Stem Cells. 31:2827–2832. 2013. View Article : Google Scholar : PubMed/NCBI
|
|
33
|
Amiri A, Noei F, Jeganathan S, Kulkarni G,
Pinke DE and Lee JM: eEF1A2 activates Akt and stimulates
Akt-dependent actin remodeling, invasion and migration. Oncogene.
26:3027–3040. 2007. View Article : Google Scholar : PubMed/NCBI
|
|
34
|
Puertollano R: mTOR and lysosome
regulation. F1000Prime Rep. 6:522014. View
Article : Google Scholar : PubMed/NCBI
|
|
35
|
Liang YJ, Wang QY, Zhou CX, Yin QQ, He M,
Yu XT, Cao DX, Chen GQ, He JR and Zhao Q: MiR-124 targets Slug to
regulate epithelial-mesenchymal transition and metastasis of breast
cancer. Carcinogenesis. 34:713–722. 2012. View Article : Google Scholar : PubMed/NCBI
|
|
36
|
Nieman MT, Prudoff RS, Johnson KR and
Wheelock MJ: N-cadherin promotes motility in human breast cancer
cells regardless of their E-cadherin expression. J Cell Biol.
147:631–144. 1999. View Article : Google Scholar : PubMed/NCBI
|
|
37
|
Chen BW, Chen W, Liang H, Liu H, Liang C,
Zhi X, Hu LQ, Yu XZ, Wei T, Ma T, et al: Inhibition of mTORC2
induces cell-cycle arrest and enhances the cytotoxicity of
doxorubicin by suppressing MDR1 expression in HCC cells. Molr
Cancer Ther. 14:1805–1815. 2015. View Article : Google Scholar
|
|
38
|
Zarzynska JM: Two faces of TGF-beta1 in
breast cancer. Mediators Inflamm. 2014:1417472014. View Article : Google Scholar : PubMed/NCBI
|
|
39
|
Browman G, Goldberg J, Gottlieb AJ,
Preisler HD, Azarnia N, Priore RL, Brennan JK, Vogler WR, Winton
EF, Miller KB, et al: The clonogenic assay as a reproducible in
vitro system to study predictive parameters of treatment outcome in
acute nonlymphoblastic leukemia. Am J Hematol. 15:227–235. 1983.
View Article : Google Scholar : PubMed/NCBI
|
|
40
|
Reya T, Morrison SJ, Clarke MF and
Weissman IL: Stem cells, cancer, and cancer stem cells. Nature.
414:105–111. 2001. View Article : Google Scholar : PubMed/NCBI
|
|
41
|
Srinivasan B, Kolli AR, Esch MB, Abaci HE,
Shuler ML and Hickman JJ: TEER measurement techniques for in vitro
barrier model systems. J Lab Autom. 20:107–126. 2015. View Article : Google Scholar : PubMed/NCBI
|
|
42
|
Lin CW, Lin PY and Yang PC: Noncoding RNAs
in tumor epithelial-to-mesenchymal transition. Stem Cells Int.
2016:27327052016. View Article : Google Scholar : PubMed/NCBI
|
|
43
|
Kotiyal S and Bhattacharya S: Breast
cancer stem cells, EMT and therapeutic targets. Biochem Biophys Res
Commun. 453:112–116. 2014. View Article : Google Scholar : PubMed/NCBI
|
|
44
|
Kidd M, Schimmack S, Lawrence B, Alaimo D
and Modlin IM: EGFR/TGFα and TGFβ/CTGF signaling in neuroendocrine
neoplasia: Theoretical therapeutic targets. Neuroendocrinology.
97:35–44. 2013. View Article : Google Scholar : PubMed/NCBI
|