Introduction
Hepatocellular carcinoma (HCC) is the sixth most
common tumor among all malignant tumors worldwide, but its
mortality rate was the second highest among all malignant tumors in
2015 (1). More than half of all HCC
cases and HCC-associated deaths occur in China (2). Patients with HCC often have viral
cirrhosis background, and their liver function and liver reserve
are abnormal and damaged (3). In
China, only 30–40% of patients with HCC have the opportunity to
undergo radical tumor resection (4).
Therefore, it is of great clinical importance to identify specific
early diagnostic indicators for HCC to improve the therapeutic
efficacy in HCC, as well as the overall prognosis and quality of
life of patients with HCC.
Glypican-1 (GPC1) is a member of the
phosphatidylinositol family (GPC1-6) and is a heparan sulfate
glycoprotein that is anchored to the outer cell membrane by binding
to the C-terminus of glycosylphosphatidyl alcohol (5). Melo et al (6) studied GPC1 expression in the peripheral
blood of 190 patients with pancreatic ductal adenocarcinoma and 100
healthy volunteers; it was revealed that GPC1 was highly expressed
in patients with cancer compared with healthy volunteers, and the
larger the diameter and volume of the tumor, the higher the
positive rate of GPC1 detected. The specificity and sensitivity of
GPC1 in the diagnosis of early pancreatic cancer reached 100%,
suggesting that it is an ideal early marker of pancreatic cancer
(6). Another study demonstrated that
75% (24/32) of patients with pancreatic cancer exhibited positive
GPC1 expression in the peripheral blood, suggesting that GPC1 is
upregulated in patients with pancreatic cancer, as well as in other
types of tumor (6–8). Furthermore, GPC1 circulating exosomes
(crExos) can be used for the early diagnosis and treatment of
pancreatic cancer, and GPC1 crExos in pancreatic precancerous
lesions was significantly increased compared with normal pancreatic
tissues (9). However, the expression
pattern of GPC-1 in patients with HCC remains unclear. Therefore,
the association between GPC-1 expression and malignant development
of HCC remains to be further studied.
In the present study, GPC1 expression was
investigated in HCC tissues and cell lines and was detected in the
peripheral circulation of patients with HCC. In addition, the
association between GPC1 expression in HCC and the survival rate
and clinical prognosis in patients with HCC was analyzed.
Materials and methods
Patients and tissue samples
HCC tissues, paired adjacent tissues (distance from
tumor tissue is >5 cm) and peripheral blood samples were
collected from 175 patients with HCC who underwent surgical
resection at The Second Affiliated Hospital of Chongqing Medical
University (Chongqing, China) between October 2011 and May 2013
(mean age, 64 years; age range, 32–81 years; 94 males and 81
females) (Table I). In addition, 27
hepatic hemangioma (HH) and 27 healthy control (HC) samples (the HC
tissues were not from the same patients) were collected at The
Second Affiliated Hospital of Chongqing Medical University
(Chongqing, China). The corresponding clinicopathological data were
obtained from The Second Affiliated Hospital of Chongqing Medical
University (Chongqing, China). Patients with HCC were followed up
to 5 years post-surgery to evaluate their survival rate. Patients
were followed up by phone every 3 months and the total duration of
follow up was 97 months. The present study was approved by the
Ethics Committee of The Second Affiliated Hospital of Chongqing
Medical University and was conducted in accordance with the
Declaration of Helsinki.
 | Table I.Association between GPC1 expression
and clinicopathological features of patients with hepatocellular
carcinoma (n=175). |
Table I.
Association between GPC1 expression
and clinicopathological features of patients with hepatocellular
carcinoma (n=175).
|
|
| GPC1 expression |
|
|---|
|
|
|
|
|
|---|
| Variables | N | Low (n=51) | High (n=124) | P-value |
|---|
| Age, years |
|
|
| 0.765 |
|
<50 | 82 | 23 | 59 |
|
| ≥50 | 93 | 28 | 65 |
|
| Sex |
|
|
| 0.895 |
| Male | 94 | 27 | 67 |
|
|
Female | 81 | 24 | 57 |
|
| Tumor size, cm |
|
|
| 0.011 |
| ≤5 | 87 | 33 | 54 |
|
|
>5 | 88 | 18 | 70 |
|
| AFP, ng/ml |
|
|
| 0.456 |
| ≤20 | 68 | 22 | 46 |
|
|
>20 | 107 | 29 | 78 |
|
| Liver
cirrhosis |
|
|
| 0.849 |
|
Present | 101 | 30 | 71 |
|
|
Absent | 74 | 21 | 53 |
|
| HBsAg |
|
|
| 0.883 |
|
Positive | 98 | 29 | 69 |
|
|
Negative | 77 | 22 | 55 |
|
| TNM stage |
|
|
| 0.033 |
|
I/II | 81 | 30 | 51 |
|
|
III/IV | 94 | 21 | 73 |
|
| Vascular
invasion |
|
|
| 0.520 |
|
Positive | 106 | 29 | 77 |
|
|
Negative | 69 | 22 | 47 |
|
| Multiplicity |
|
|
| 0.960 |
|
Single | 99 | 29 | 70 |
|
|
Multiple (≥2) | 76 | 22 | 54 |
|
| Intrahepatic
metastasis |
|
|
| 0.532 |
|
Positive | 100 | 31 | 69 |
|
|
Negative | 75 | 20 | 55 |
|
Cell lines
The human HCC Hep3B, MHCC-97H, MHCC-97L and Huh-7
cell lines, and the normal liver THLE-2 cell line were obtained
from The Cell Bank of Type Culture Collection of the Chinese
Academy of Sciences. HCC cell lines were cultured in high-glucose
DMEM with 10% FBS, and the normal liver THLE-2 cell line was
cultured in Bronchial Epithelial Cell Growth Medium (BEGM) with 10%
FBS (all Gibco; Thermo Fisher Scientific, Inc.) and 100 U/ml
penicillin and streptomycin All cells were cultured in a humidified
incubator at 37°C with 5% CO2.
Enzyme-linked immunosorbent assay
(ELISA)
Blood samples (5 ml blood was collected) were
centrifuged. The whole blood was kept for 30 min and centrifuged at
2,000 × g for 20 min at room temperature, and serum and plasma
components were stored as aliquots at −80°C until further use. An
ELISA kit (cat. no. ELH-GPC1; RayBiotech, Inc.) was used to measure
the levels of serum GPC1. According to the manufacturer's protocol,
a monoclonal antibody specific for GPC1 was coated onto the wells
of the microtiter strips. Subsequently, diluted samples, including
standards of known GPC1 content, control specimens and unknowns,
were pipetted into these wells, followed by the addition of a
second biotinylated monoclonal antibody. Next,
streptavidin-peroxidase was added to complete the four-member
sandwich. After incubation at room temperature for 30 min and
washing steps, the 3,3′,5,5′-tetramethylbenzidine substrate
solution was added, which reacted with the enzyme antibody-target
complex to produce measurable signals. The optical density values
were measured at 450 nm using a microplate reader (Bio-Rad
Laboratories, Inc.).
RNA extraction and reverse
transcription-quantitative (RT-q)PCR
Total RNA from HCC tissues, adjacent tissues, cell
lines and HH tissues was extracted using TRIzol® reagent
(Takara Bio, Inc.). PrimeScript RT reagent (Takara Bio, Inc.) was
used for RT to cDNA, and RT-qPCR was performed using SYBR Premix Ex
Taq II (Takara Bio, Inc.) using a LightCycler system (Roche
Diagnostics). The temperature protocol for RT was as follows: 30°C
for 10 min, followed by 47°C for 40 min and 75°C for 30 min. The
primer sequences of GPC1 were as follows: Forward,
5′-CGGCCCCGCCATGGAGCTCC-3′ and reverse, 5′-GGCAGTTACCGCCACCGGGG-3′.
GAPDH forward, 5′-GCACCGTCAAGGCTGAGAAC-3′ and reverse,
5′-TGGTGAAGACGCCAGTGGA-3′. The following thermocycling conditions
were used for qPCR: Initial denaturation at 92°C for 10 min,
followed by 40 cycles of 95°C for 15 sec and 65°C for 30 sec, and a
final extension step at 72°C for 30 sec. GAPDH was used as an
internal reference, and the mRNA expression levels of GPC1 were
analyzed using the 2−ΔΔCq method (10).
Western blotting
Total protein from HCC cell lines, a normal liver
cell line (1×10⁶) and tissues (Hep3B, MHCC-97H,
MHCC-97L, Huh-7, THLE-2 cell lines, HCC and paired adjacent
tissues) was extracted using RIPA lysis buffer. Protein was
quantified using the Bradford protein assay (Bio-Rad Laboratories,
Inc.) with a Nanodrop spectrophotometer and an equal amount (35 µg)
was added to each well of 10% gels and resolved by SDS-PAGE. The
samples were transferred to polyvinylidene difluoride membranes.
The membranes were blocked with 5% skimmed milk powder at room
temperature for 1 h. Next, the membranes were probed at 4°C
overnight, using the following primary antibodies: GPC1 (1:1,500;
cat. no. ab199343; Abcam) and β-actin (1:5,000; cat. no. ab8227;
Abcam). Subsequently, the membranes were incubated with a
horseradish peroxidase-conjugated secondary antibody (1:5,000; cat.
no. ab6721; Abcam) at room temperature for 1 h. Protein bands were
visualized using an enhanced chemiluminescence solution (EMD
Millipore) and a ChemiDoc Imaging system (Bio-Rad Laboratories,
Inc.). Protein expression was semi-quantified using the Quantity
One v4.6.6 software (Bio-Rad Laboratories, Inc.). β-actin was used
as an internal reference.
Immunohistochemical staining
The collected 175 HCC tissues were made into tissue
microarrays. The tissue was fixed in 4% paraformaldehyde at room
temperature for 24 h and embedded in paraffin. Sections were
deparaffinized in xylene I for 15 min and xylene II for 15 min at
37°C, and rehydrated in a graded ethanol series (100, 95, 80 and
75% ethanol for 5 min each). Subsequently, the sections were
incubated with 3% H2O2 for 30 min at 37°C and
for 15 min at 37°C with 5% goat serum (Origene Technologies, Inc.)
to block non-specific binding, followed by incubation with a rabbit
monoclonal anti-GPC1 antibody (1:1,000; cat. no. ab55971; Abcam) at
4°C overnight. Next, the sections were incubated with an
anti-rabbit secondary biotin labelled IgG antibody (1:100; cat. no.
SAP-9100; Origene Technologies, Inc.) at 37°C for 30 min. After
washing with PBS, the visualization signal was detected using
3,3′-diaminobenzidine (Boster Biological Technology) and
counterstaining was performed using hematoxylin at room temperature
for 5 sec.
GPC1 immunostaining was scored and examined by two
double-blinded pathologists. All tissues observed using a light
microscope at a magnification of ×200 were manually scored based on
the percentage of positive cells and the intensity to determine the
final staining scores. The scoring parameters included staining
intensity (according to the color development degree of the
positive markers; Light yellow, indicating weak positive; brown
yellow, medium positive; and brown black, strong positive) (range,
0–3: 0, no staining; 1, weak; 2, moderate; and 3, strong) and the
percentage of positive cells (range, 0–4: 0, <5; 1, 6–25; 2,
26–50; 3, 51–75; and 4, 76–100%). Slides with a total score <4
were defined as low GPC1 expression, while slides with a score ≥4
were defined as high GPC1 expression.
Statistical analysis
The data were analyzed using SPSS v22.0 (IBM Corp.)
and GraphPad Prism v6.0 (GraphPad Software, Inc.). GPC1 expression
was presented as the mean ± SD. All experiments were repeated 3
times. Statistical differences among multiple groups were analyzed
using one-way ANOVA followed by Tukey's post hoc test. The
significance of GPC1 was examined using paired or unpaired
Student's t-test. The association between clinicopathological
parameters and GPC1 expression was analyzed using χ2
test. Kaplan-Meier, log-rank tests and Cox regression for
univariate and multivariate analysis were used to analyze the
prognostic significance of GPC1 expression. RFS was recorded as the
time from liver tumor resection removal to liver tumor recurrence.
DSS was recorded as the time from cancer diagnosis to death from
cancer or to the follow-up deadline. P<0.05 was considered to
indicate a statistically significant difference.
Results
GPC1 expression in HCC tissues and
cells
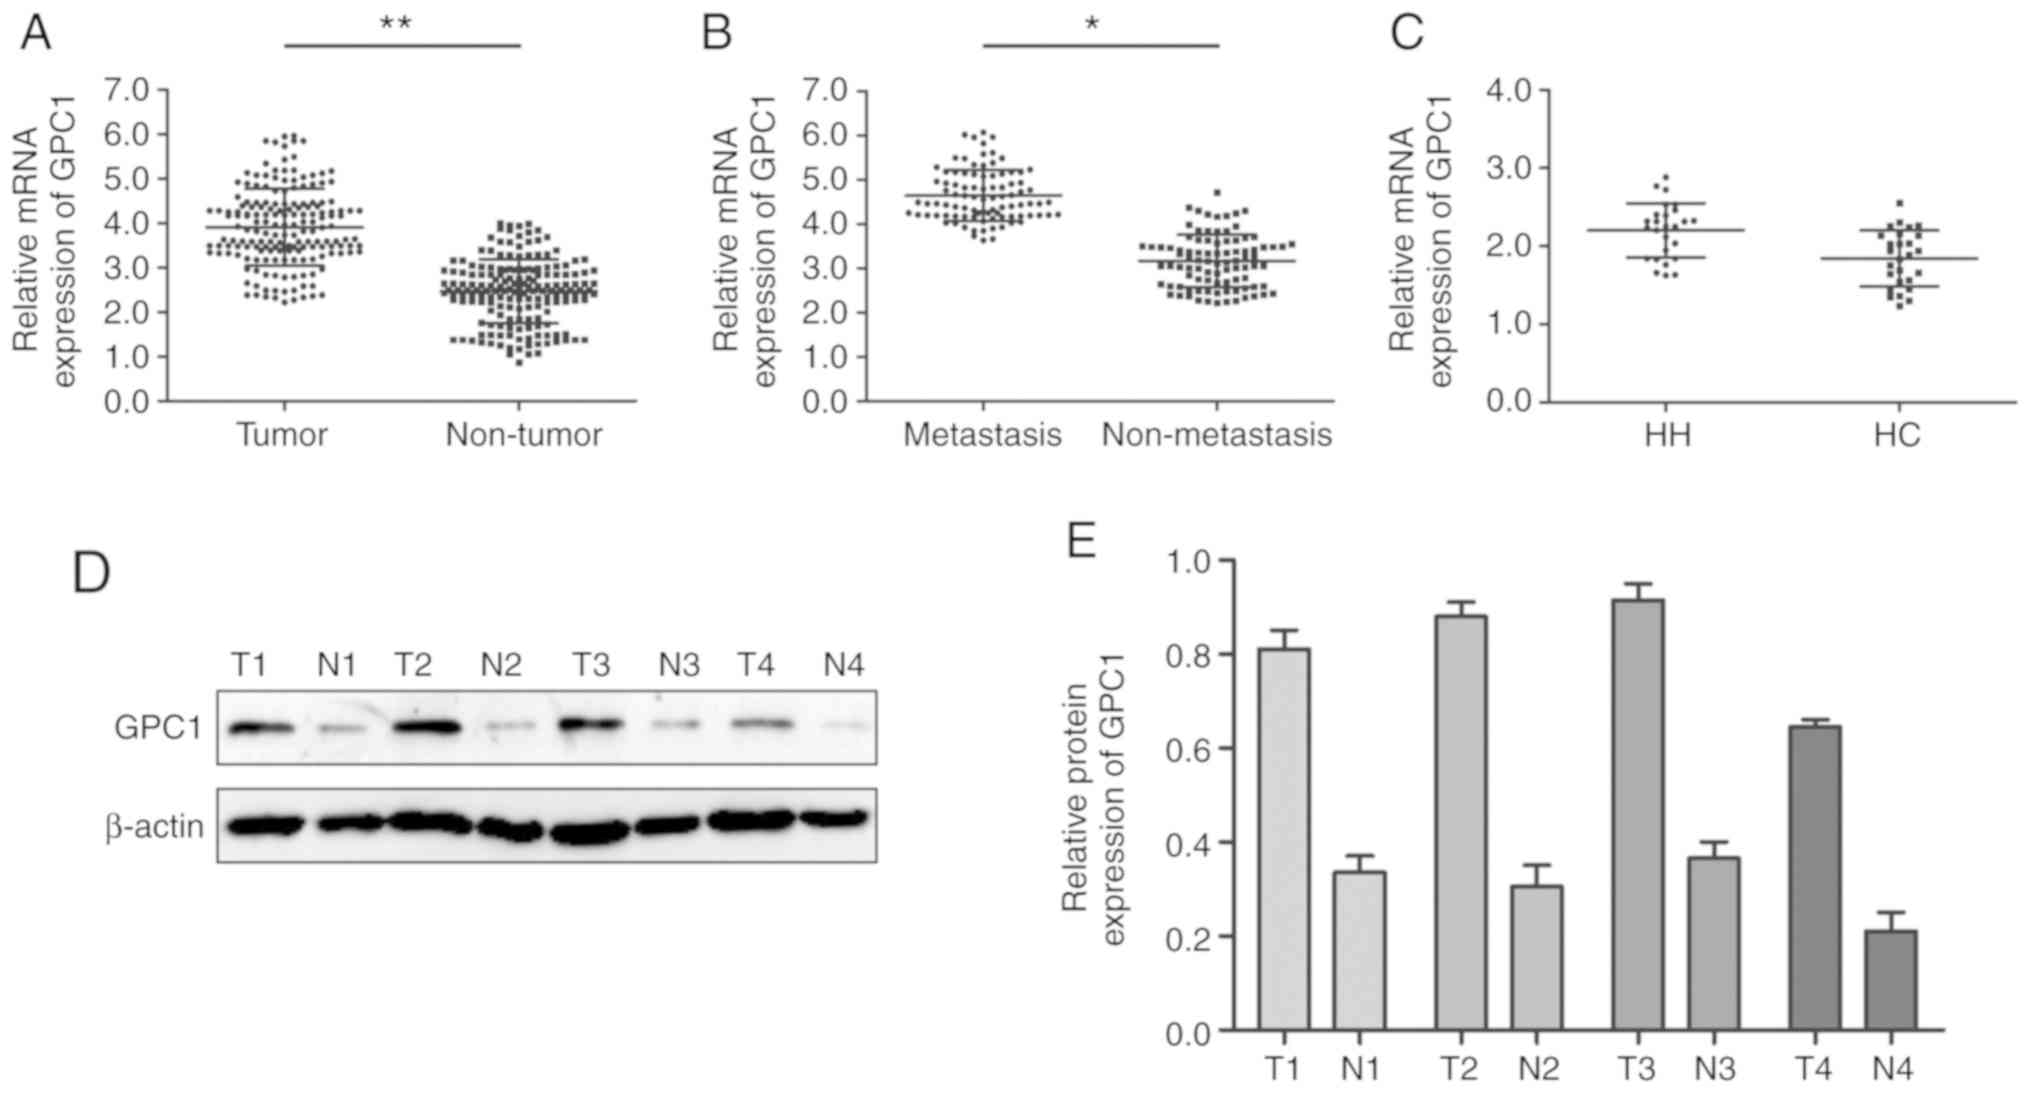
GPC1 expression in HCC tissues and cell lines was
analyzed via RT-qPCR. The results revealed that GPC1 expression was
significantly higher in HCC tissues compared with that in paired
normal adjacent tissues (P<0.01; Fig.
1A). Furthermore, GPC1 expression was significantly increased
in aggressive HCC tissues (tumors with distant metastasis) compared
with that in non-aggressive HCC tissues (tumors with no distant
metastasis) (P<0.05; Fig. 1B).
However, there was no significant difference in the expression
levels of GPC1 between HH and HC tissues (P>0.05; Fig. 1C). Western blotting results revealed
that GPC1 protein expression was higher in HCC tissues compared
with that in their paired normal adjacent tissues (Fig. 1D and E).
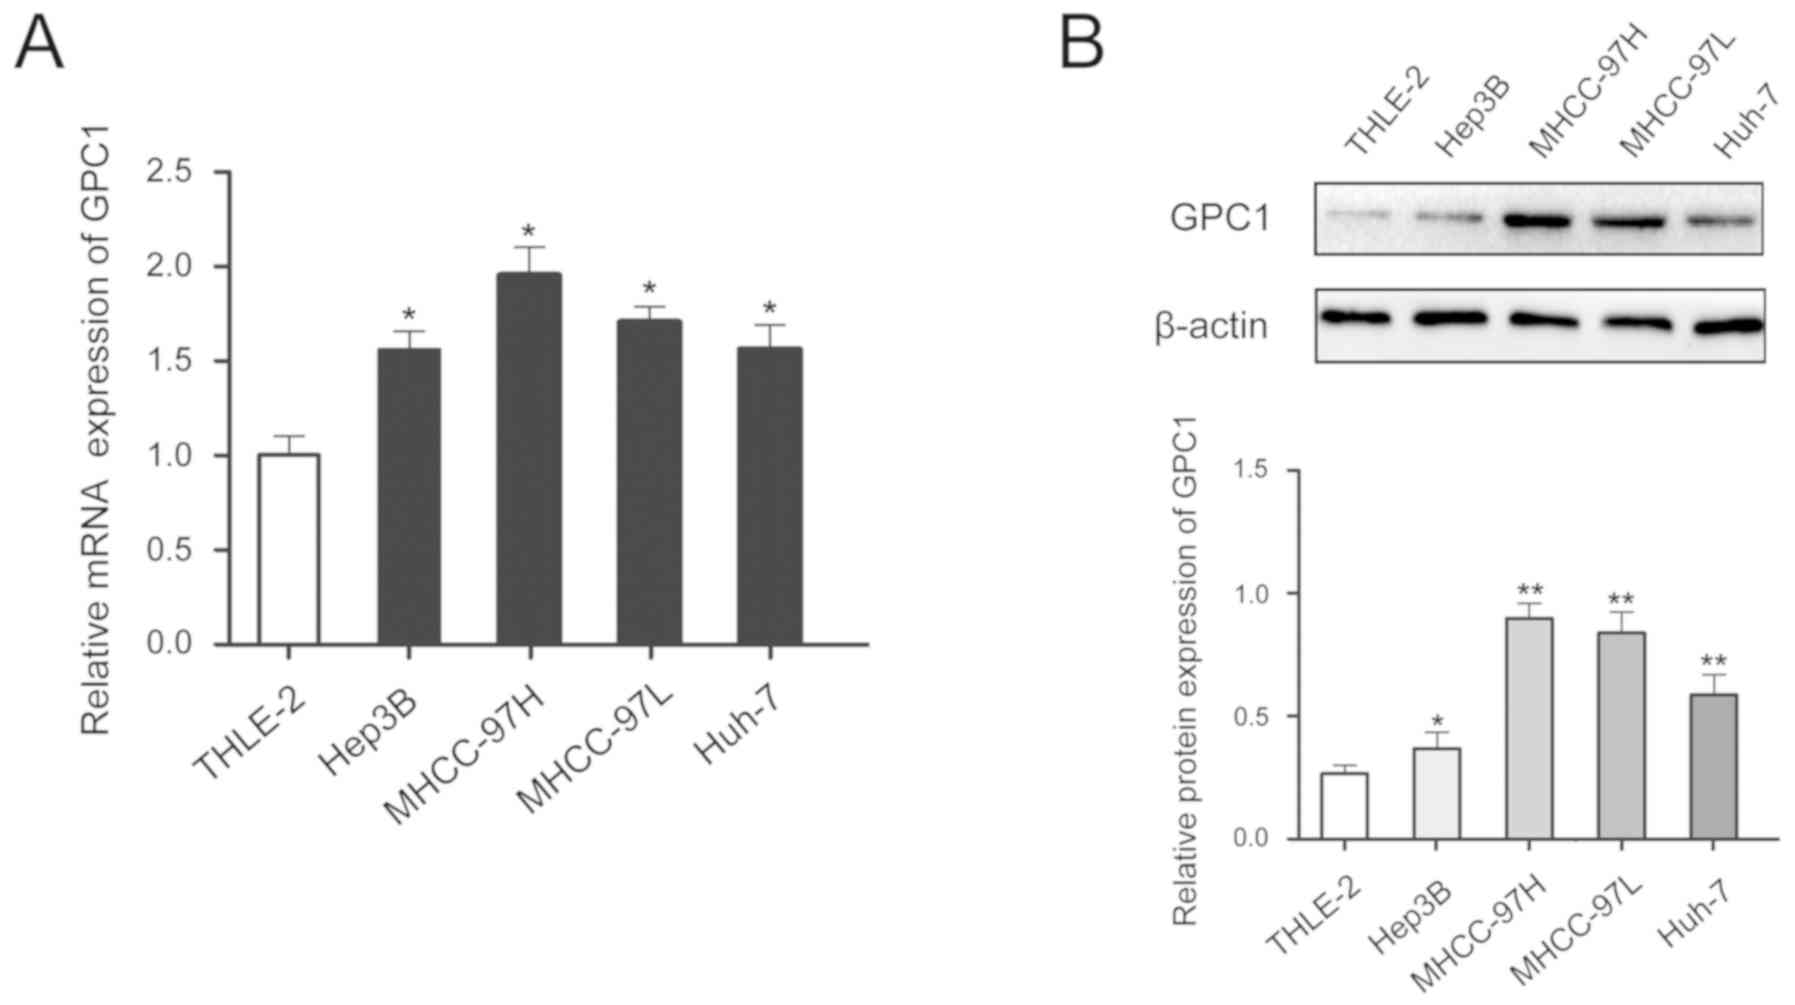
In addition, GPC1 expression was higher in HCC cell
lines compared with that in the normal liver cell line and GPC1
expression was higher in cells with high malignancy (MHCC-97H cells
had high metastatic ability compared with the other cell lines
tested) (Fig. 2A and B).
Serum levels of GPC1 in patients with
HCC and HH, and in HCs
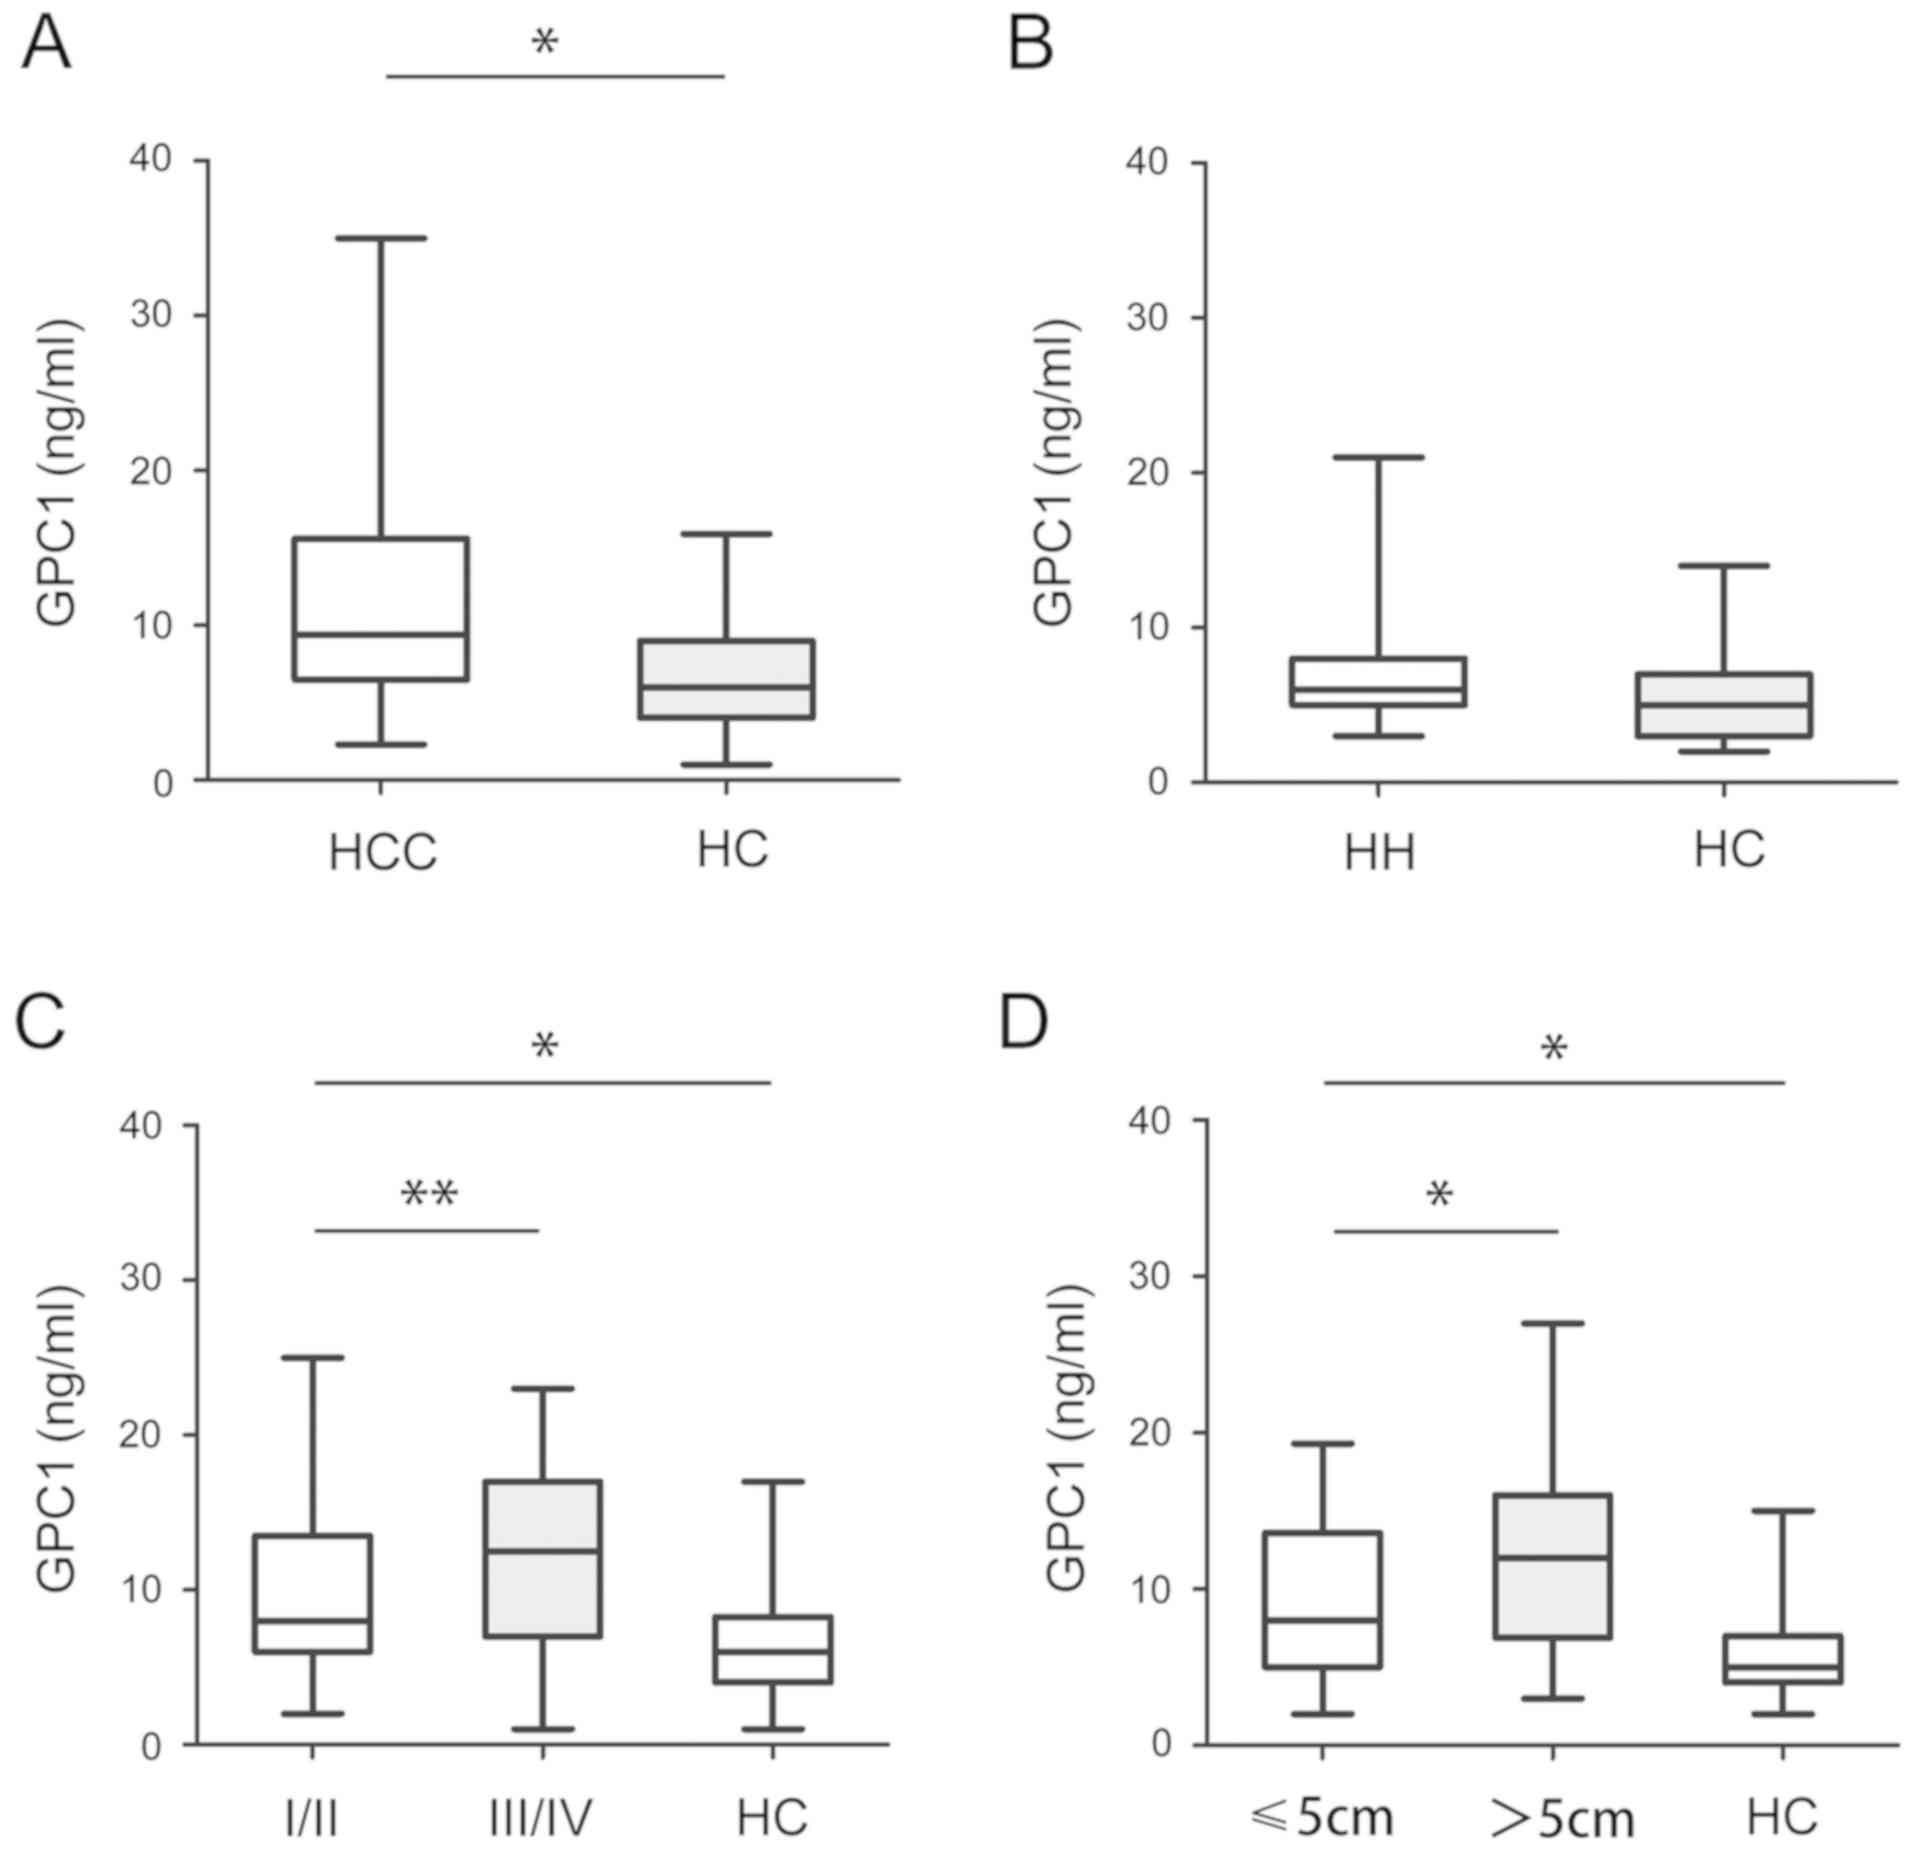
Subsequently, the serum levels of GPC1 were analyzed
in HCC, HH and HC samples. As shown in Fig. 3A, the serum levels of GPC1 in HCC
samples were significantly higher than in HC samples (P<0.05).
However, there was no significant difference in the serum levels of
GPC1 between HH and HC samples (P>0.05; Fig. 3B). Furthermore, higher serum levels
of GPC1 were detected in stage III/IV HCC samples than in stage
I/II HCC samples (P<0.05; Fig.
3C). The serum levels of GPC1 were higher in tumors >5 cm in
size than in tumors <5 cm in size. There was no significant
difference between stage III/IV or >5 cm in HC samples
(P<0.05; Fig. 3D).
Associations between GPC1 expression
and clinicopathological features in patients with HCC
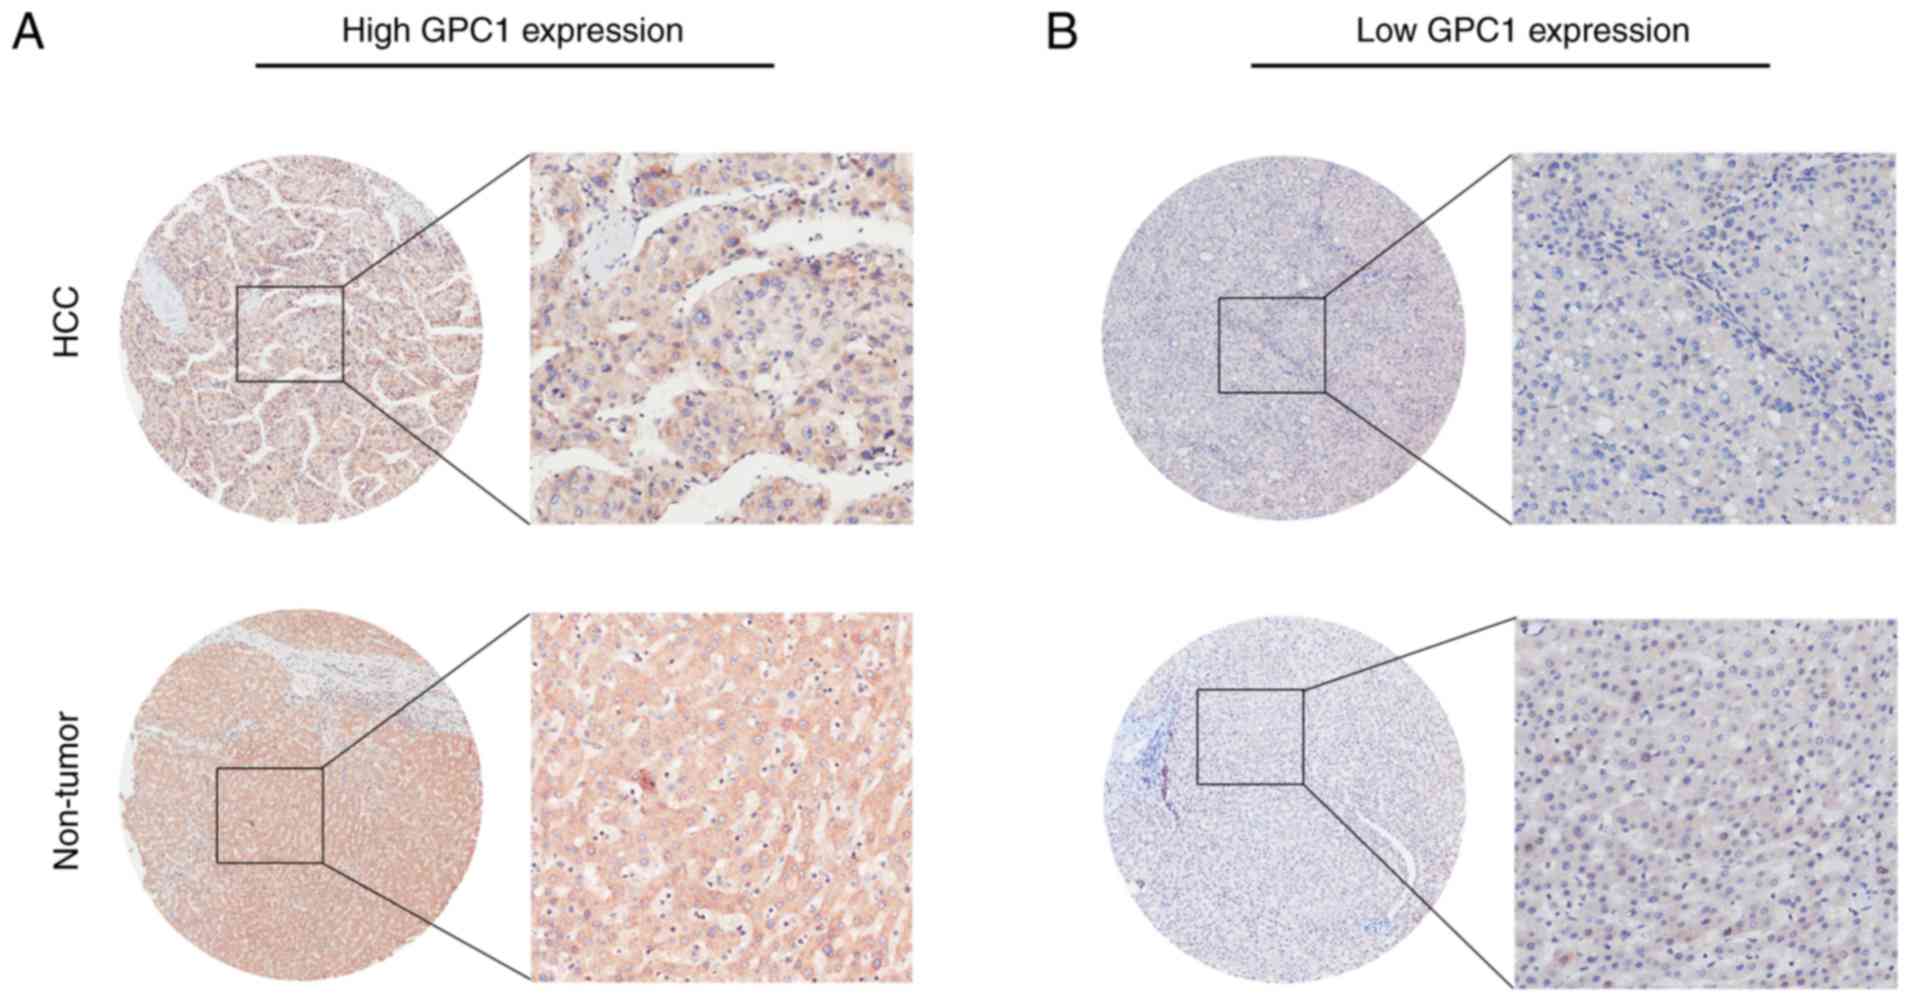
The present results revealed that GPC1 expression
was high in 124/175 HCC samples (70.9%) and low in 51/175 HCC
samples (29.1%) (Table I), and GPC1
was mainly expressed in the cytoplasm and cell membrane (Fig. 4A and B). As shown in Table I, GPC1 expression was positively
associated with tumor size (P=0.011) and Tumor-Node-Metastasis
(TNM) stage (P=0.033). However, there were no significant
differences between GPC1 expression and age, sex, α-fetoprotein
levels, liver cirrhosis, hepatitis B virus surface antigen,
vascular invasion, multiplicity and intrahepatic metastasis (all
P>0.05; Table I).
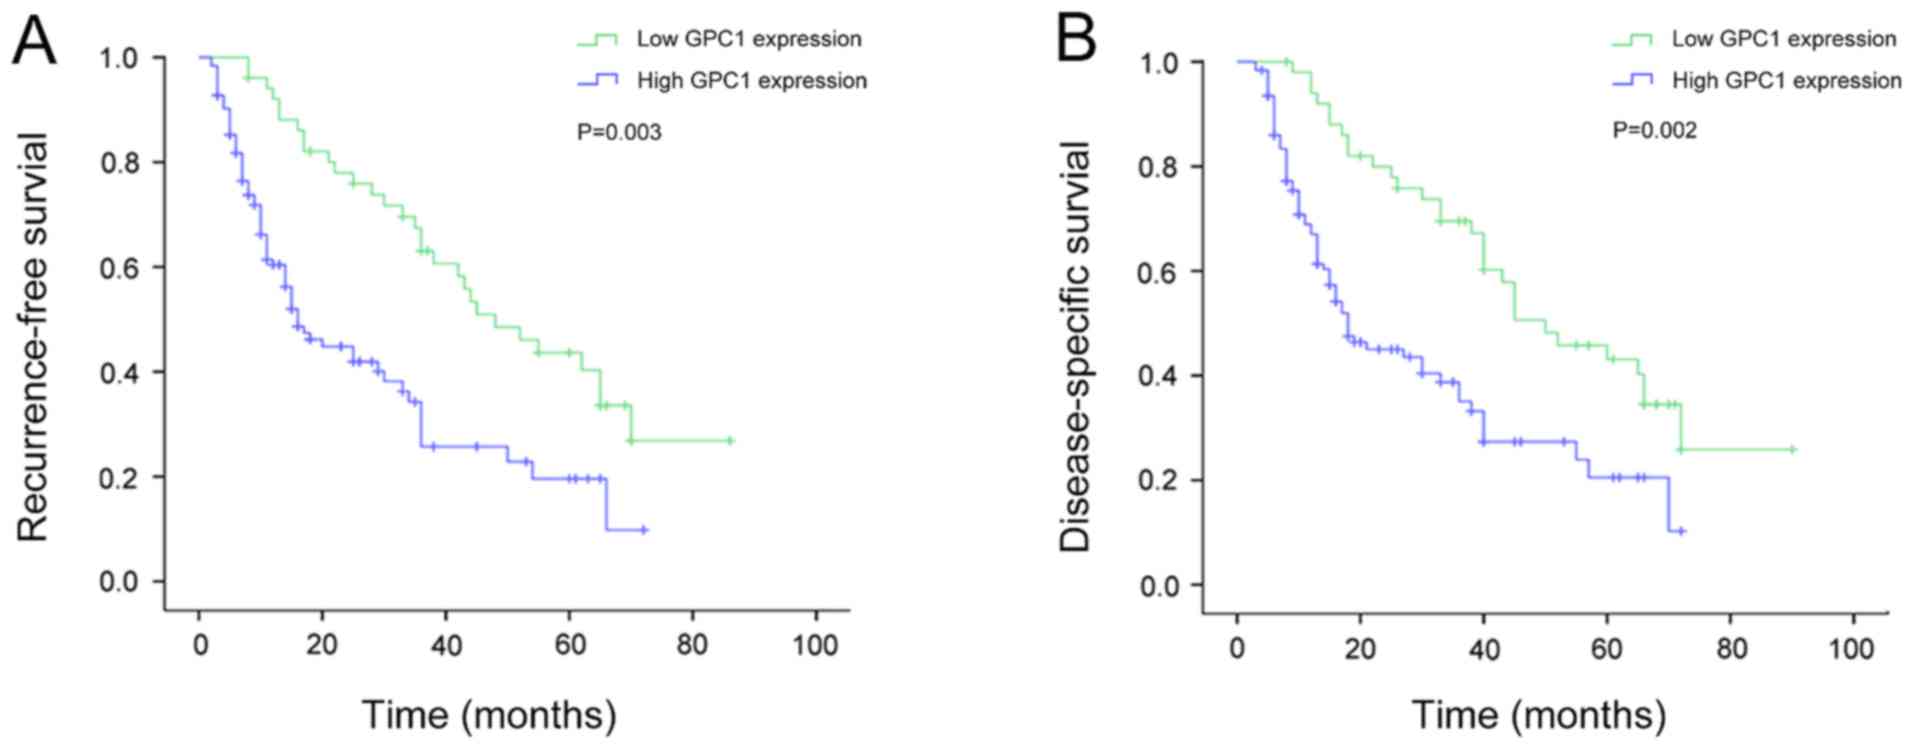
Association between GPC1 expression
and recurrence-free survival (RFS) in patients with HCC
Kaplan-Meier survival analysis revealed that the RFS
time was significantly shorter in patients with HCC with high GPC1
expression compared with that in patients with low GPC1 expression
in HCC (P=0.003; Fig. 5A). In
addition, the univariate analysis revealed that tumor size [hazard
ratio (HR)=1.561; P=0.041], TNM stage (HR=1.609; P=0.019) and GPC1
expression (HR=1.579; P=0.009) were significantly associated with
RFS in patients with HCC (Table
II). The multivariate analysis revealed that tumor size
(HR=1.773; P=0.047), TNM stage (HR=1.473; P=0.025) and GPC1
expression (HR=1.311; P=0.007) were independent prognostic factors
for RFS in patients with HCC (Table
II).
| Table II.Univariate and multivariate analysis
of different prognostic variables influencing recurrence-free
survival in patients with hepatocellular carcinoma (n=175). |
Table II.
Univariate and multivariate analysis
of different prognostic variables influencing recurrence-free
survival in patients with hepatocellular carcinoma (n=175).
|
|
| Univariate
analysis | Multivariate
analysis |
|---|
|
|
|
|
|
|---|
| Variables | N | HR (95% CI) | P-value | HR (95% CI) | P-value |
|---|
| Sex |
| 0.967
(0.337–1.285) | 0.604 |
|
|
|
Male | 94 |
|
|
|
|
|
Female | 81 |
|
|
|
|
| Age, years |
| 0.618
(0.590–1.844) | 0.594 |
|
|
|
<50 | 82 |
|
|
|
|
|
≥50 | 93 |
|
|
|
|
| Tumor size, cm |
| 1.561
(0.864–2.349) | 0.041 | 1.773
(0.617–1.968) | 0.047 |
| ≤5 | 87 |
|
|
|
|
|
>5 | 88 |
|
|
|
|
| AFP, ng/ml |
| 1.135
(0.884–1.973) | 0483 |
|
|
|
≤20 | 68 |
|
|
|
|
|
>20 | 107 |
|
|
|
|
| HBsAg |
| 1.373
(1.075–3.600) | 0.894 |
|
|
|
Positive | 98 |
|
|
|
|
|
Negative | 77 |
|
|
|
|
| TNM stage |
| 1.609
(1.224–3.884) | 0.019 | 1.473
(0.674–3.048) | 0.025 |
|
I/II | 81 |
|
|
|
|
|
III/IV | 94 |
|
|
|
|
| Liver
cirrhosis |
| 0.564
(1.647–3.557) | 0.550 |
|
|
|
Present | 101 |
|
|
|
|
|
Absent | 74 |
|
|
|
|
| Vascular
invasion |
| 0.667
(1.478–3.647) | 0.664 |
|
|
|
Positive | 106 |
|
|
|
|
|
Negative | 69 |
|
|
|
|
| Multiplicity |
| 1.542
(0.739–1.647) | 0.940 |
|
|
|
Single | 99 |
|
|
|
|
|
Multiple (≥2) | 76 |
|
|
|
|
| Intrahepatic
metastasis |
| 1.672
(0.590–3.027) | 0.393 |
|
|
|
Positive | 100 |
|
|
|
|
|
Negative | 75 |
|
|
|
|
| GPC1
expression |
| 1.579
(0.831–2.947) | 0.009 | 1.311
(0.773–2.647) | 0.007 |
|
High | 124 |
|
|
|
|
|
Low | 51 |
|
|
|
|
Association between GPC1 expression
and disease-specific survival (DSS) in patients with HCC
Kaplan-Meier survival analysis revealed that the DSS
time was significantly shorter in patients with HCC with high GPC1
expression compared with that in patients with low GPC1 expression
(P=0.002; Fig. 5B). In addition, the
univariate analysis revealed that tumor size (HR=1.204; P=0.039),
TNM stage (HR=1.342; P=0.022) and GPC1 expression (HR=1.770;
P=0.017) were significantly associated with DSS in patients with
HCC (Table III). Similarly, the
multivariate analysis revealed that tumor size (HR=1.119; P=0.031),
TNM stage (HR=1.554; P=0.028) and GPC1 expression (HR=1.883;
P=0.014) were independent prognostic factors for DSS in patients
with HCC (Table III).
| Table III.Univariate and multivariate analysis
of different prognostic variables influencing disease-specific
survival in patients with hepatocellular carcinoma (n=175). |
Table III.
Univariate and multivariate analysis
of different prognostic variables influencing disease-specific
survival in patients with hepatocellular carcinoma (n=175).
|
|
| Univariate
analysis | Multivariate
analysis |
|---|
|
|
|
|
|
|---|
| Variables | N | HR (95% CI) | P-value | HR (95% CI) | P-value |
|---|
| Sex |
| 0.704
(0.507–1.132) | 0.589 |
|
|
|
Male | 94 |
|
|
|
|
|
Female | 81 |
|
|
|
|
| Age, years |
| 0.804
(0.660–1.484) | 0.377 |
|
|
|
<50 | 82 |
|
|
|
|
|
≥50 | 93 |
|
|
|
|
| Tumor size, cm |
| 1.204
(0.531–1.678) | 0.039 | 1.119
(0.698–1.840) | 0.031 |
| ≤5 | 87 |
|
|
|
|
|
>5 | 88 |
|
|
|
|
| AFP, ng/ml |
| 0.947
(1.337–2.607) | 0483 |
|
|
|
≤20 | 68 |
|
|
|
|
|
>20 | 107 |
|
|
|
|
| HBsAg |
| 1.078
(0.576–1.628) | 0.631 |
|
|
|
Positive | 98 |
|
|
|
|
|
Negative | 77 |
|
|
|
|
| TNM stage |
| 1.342
(0.931–2.741) | 0.022 | 1.554
(0.846–2.478) | 0.028 |
|
I/II | 81 |
|
|
|
|
|
III/IV | 94 |
|
|
|
|
| Liver
cirrhosis |
| 1.360
(0.874–2.337) | 0.981 |
|
|
|
Present | 101 |
|
|
|
|
|
Absent | 74 |
|
|
|
|
| Vascular
invasion |
| 1.686
(1.207–2.947) | 0.573 |
|
|
|
Positive | 106 |
|
|
|
|
|
Negative | 69 |
|
|
|
|
| Multiplicity |
| 0.884
(0.514–1.972) | 0.830 |
|
|
|
Single | 99 |
|
|
|
|
|
Multiple (≥2) | 76 |
|
|
|
|
| Intrahepatic
metastasis |
| 1.047
(1.369–3.840) | 0.796 |
|
|
|
Positive | 100 |
|
|
|
|
|
Negative | 75 |
|
|
|
|
| GPC1
expression |
| 1.770
(1.604–3.943) | 0.017 | 1.883
(1.530–3.647) | 0.014 |
|
High | 124 |
|
|
|
|
|
Low | 51 |
|
|
|
|
Discussion
In 2015, HCC was one of the most common malignant
tumors globally (1). Poor prognosis
is an important biological characteristic of HCC (11). Notably, recurrence and metastasis of
HCC remain the main causes of failure of HCC treatment, which
imposes a heavy burden on families and society (3). Recent studies revealed that the cause
of a poor prognosis in patients with HCC is a complex process,
involving numerous regulatory factors, including genetic mutations,
cell surface signaling molecules and adhesion changes caused by
epigenetic changes in tumor cells and normal liver cells, abnormal
cell metabolism and changes in tumor cells and their surrounding
microenvironment (12,13). Although existing treatments can
improve the quality of life and survival time of patients with HCC,
the overall survival rate of patients remains unsatisfactory
(14). In the present study, the
association between GPC1 expression and HCC was analyzed, and
preliminarily explored the relationship between GPC1 and poor
prognosis of patients with HCC. The current study provided
objective scientific evidence and novel molecular targets for the
diagnosis and treatment of HCC.
A study has demonstrated that GPC1 can act as a
negative regulator of the sonic hedgehog signaling pathway during
biliary development, and that low GPC1 expression leads to biliary
developmental damage and biliary atresia (15). GPC1 inhibits metaphase and centrosome
production and it mediates the activation of nitric oxide synthase
to protect endothelial function (16–18).
Since GPC1 serves an important role in the heparin-binding growth
factors, Wnt and sonic hedgehog signaling pathways, it is widely
involved in precancerous lesions of various types of pancreatic
ductal adenocarcinoma (PDAC) and HCC (19–21). A
large number of studies have demonstrated that GPC1 enhances the
mitogenic responses of pancreatic ductal adenocarcinoma cells to
fibroblast growth factor-2, heparin-binding epidermal growth factor
and hepatocyte growth factor as a growth factor co-receptor, and
serves a crucial role in the malignant progression of oesophageal
squamous cell carcinoma and PDAC (22–24).
Abnormal GPC1 upregulation was observed in glioma, prostate cancer
and esophageal squamous cell carcinoma (5–7).
Furthermore, GPC1 is considered as an important prognostic
biomarker for PDAC (9). High GPC1
expression is associated with poorer differentiation and larger
tumor diameters in PDAC, indicating that the abnormally high GPC1
expression may serve important roles in tumorigenesis (25).
It has been reported that GPC1 crExos in the
circulatory system may serve as reliable targets for the early
diagnosis of PDAC, and may be used to predict the progression and
prognosis in patients with PDAC (26). Levels of GPC1 crExos in patients with
histologically proven precursor pancreatic cancer and PDAC are
significantly higher compared with those in patients with benign
pancreatic disease and in healthy controls (26). Notably, even for early PDAC, GPC1
crExos exhibited almost 100% sensitivity and specificity,
indicating its outstanding potential for the early detection of
PDAC (27,28).
The present findings in HCC are similar to those
previously observed in PDAC. Tissue and blood samples were
collected from patients with HCC, and the expression levels of GPC1
were analyzed by western blotting, RT-qPCR, immunohistochemistry
and ELISA. The current results revealed that GPC1 expression was
significantly higher in HCC compared with matched adjacent tissues.
Via analyzing the clinical features of patients with HCC with
different expression levels of GPC1, it was demonstrated that GPC1
expression was associated with tumor size and TNM stage.
Furthermore, patients with HCC with high GPC1 expression exhibited
a poorer prognosis compared with patients with low GPC1 expression.
GPC1 expression, TNM stage and tumor size appeared to be
independent risk factors for RFS and DSS in patients with HCC. The
present results demonstrated that GPC1 may be a potentially
valuable biomarker to predict recurrence and survival in patients
with HCC. In addition, tumors of patients with HCC with high GPC1
expression may exhibit more malignant biological characteristics.
In conclusion, the current results supported GPC1 as a molecular
target for predicting, diagnosing and treating HCC. High GPC1
expression was closely associated with a poor prognosis in patients
with HCC. Therefore, GPC1 may be used as an independent prognostic
factor and a promising therapeutic target for HCC.
Acknowledgements
Not applicable.
Funding
The present study was supported by the Medical
Science and Technology Program of Henan Province (grant no.
SBGJ2018071) and Medical Research Projects of Chongqing Health and
Family Planning Commission (grant no. 2017ZBXM070).
Availability of data and materials
All data generated or analyzed during this study are
included in this published article.
Author's contributions
GC and SW designed the study, conducted the
experiments and wrote the manuscript. LZ and HW provided the
research materials and analyzed the data. All authors read and
approved the final manuscript, and agree to be accountable for all
aspects of the research.
Ethics approval and consent to
participate
All protocols involving the use of humans were
approved by the Ethics Review Committee of The Second Affiliated
Hospital of Chongqing Medical University (approval no. 201105017).
Written informed consent was provided by all patients for the use
of their tissues in the present study.
Patient consent for publication
Not applicable.
Competing interests
The authors declare that they have no competing
interests.
References
|
1
|
Grandhi MS, Kim AK, Ronnekleiv-Kelly SM,
Kamel IR, Ghasebeh MA and Pawlik TM: Hepatocellular carcinoma: From
diagnosis to treatment. Surg Oncol. 25:74–85. 2016. View Article : Google Scholar : PubMed/NCBI
|
|
2
|
Chen W, Zheng R, Baade PD, Zhang S, Zeng
H, Bray F, Jemal A, Yu XQ and He J: Cancer statistics in China,
2015. CA Cancer J Clin. 66:115–132. 2016. View Article : Google Scholar : PubMed/NCBI
|
|
3
|
Wu H, Zhang W, Wu Z, Liu Y, Shi Y, Gong J,
Shen W and Liu C: miR-29c-3p regulates DNMT3B and LATS1 methylation
to inhibit tumor progression in hepatocellular carcinoma. Cell
Death Dis. 10:482019. View Article : Google Scholar : PubMed/NCBI
|
|
4
|
Ramalho M, Matos AP, AlObaidy M, Velloni
F, Altun E and Semelka RC: Magnetic resonance imaging of the
cirrhotic liver: Diagnosis of hepatocellular carcinoma and
evaluation of response to treatment-Part 1. Radiol Bras. 50:38–47.
2017. View Article : Google Scholar : PubMed/NCBI
|
|
5
|
Hara H, Takahashi T, Serada S, Fujimoto M,
Ohkawara T, Nakatsuka R, Harada E, Nishigaki T, Takahashi Y, Nojima
S, et al: Overexpression of glypican-1 implicates poor prognosis
and their chemoresistance in oesophageal squamous cell carcinoma.
Br J Cancer. 115:66–75. 2016. View Article : Google Scholar : PubMed/NCBI
|
|
6
|
Melo SA, Luecke LB, Kahlert C, Fernandez
AF, Gammon ST, Kaye J, LeBleu VS, Mittendorf EA, Weitz J, Rahbari
N, et al: Glypican-1 identifies cancer exosomes and detects early
pancreatic cancer. Nature. 523:177–182. 2015. View Article : Google Scholar : PubMed/NCBI
|
|
7
|
Truong Q, Justiniano IO, Nocon AL, Soon
JT, Wissmueller S, Campbell DH and Walsh BJ: Glypican-1 as a
biomarker for prostate cancer: Isolation and characterization. J
Cancer. 7:1002–1009. 2016. View Article : Google Scholar : PubMed/NCBI
|
|
8
|
Herreros-Villanueva M and Bujanda L:
Glypican-1 in exosomes as biomarker for early detection of
pancreatic cancer. Ann Transl Med. 4:642016.PubMed/NCBI
|
|
9
|
Zhou CY, Dong YP, Sun X, Sui X, Zhu H,
Zhao YQ, Zhang YY, Mason C, Zhu Q and Han SX: High levels of serum
glypican-1 indicate poor prognosis in pancreatic ductal
adenocarcinoma. Cancer Med. 7:5525–5533. 2018. View Article : Google Scholar : PubMed/NCBI
|
|
10
|
Livak KJ and Schmittgen TD: Analysis of
relative gene expression data using real-time quantitative PCR and
the 2(-Delta Delta C(T)) method. Methods. 25:402–408. 2001.
View Article : Google Scholar : PubMed/NCBI
|
|
11
|
Siegel RL, Miller KD and Jemal A: Cancer
statistics, 2017. CA Cancer J Clin. 67:7–30. 2017. View Article : Google Scholar : PubMed/NCBI
|
|
12
|
Moon S, Yeon Park S and Woo Park H:
Regulation of the Hippo pathway in cancer biology. Cell Mol Life
Sci. 75:2303–2319. 2018. View Article : Google Scholar : PubMed/NCBI
|
|
13
|
Zahn LM: Effects of the tumor
microenvironment. Science. 355:1386–1388. 2017. View Article : Google Scholar
|
|
14
|
Willatt J, Ruma JA, Azar SF, Dasika NL and
Syed F: Imaging of hepatocellular carcinoma and image guided
therapies-how we do it. Cancer Imaging. 17:92017. View Article : Google Scholar : PubMed/NCBI
|
|
15
|
Cui S, Leyva-Vega M, Tsai EA, EauClaire
SF, Glessner JT, Hakonarson H, Devoto M, Haber BA, Spinner NB and
Matthews RP: Evidence from human and zebrafish that GPC1 is a
biliary atresia susceptibility gene. Gastroenterology.
144:1107–1115.e3. 2013. View Article : Google Scholar : PubMed/NCBI
|
|
16
|
Qiao D, Yang X, Meyer K and Friedl A:
Glypican-1 regulates anaphase promoting complex/cyclosome
substrates and cell cycle progression in endothelial cells. Mol
Biol Cell. 19:2789–2801. 2008. View Article : Google Scholar : PubMed/NCBI
|
|
17
|
Zeng Y and Liu J: Role of glypican-1 in
endothelial NOS activation under various steady shear stress
magnitudes. Exp Cell Res. 348:184–189. 2016. View Article : Google Scholar : PubMed/NCBI
|
|
18
|
Ebong EE, Lopez-Quintero SV, Rizzo V,
Spray DC and Tarbell JM: Shear-induced endothelial NOS activation
and remodeling via heparan sulfate, glypican-1, and syndecan-1.
Integr Biol (Camb). 6:338–347. 2014. View Article : Google Scholar : PubMed/NCBI
|
|
19
|
Kayed H, Kleeff J, Keleg S, Jiang X,
Penzel R, Giese T, Zentgraf H, Büchler MW, Korc M and Friess H:
Correlation of glypican-1 expression with TGF-beta, BMP, and
activin receptors in pancreatic ductal adenocarcinoma. Int J Oncol.
29:1139–1148. 2006.PubMed/NCBI
|
|
20
|
Lund ME, Campbell DH and Walsh BJ: The
role of glypican-1 in the tumour microenvironment. Adv Exp Med
Biol. 1245:163–176. 2020. View Article : Google Scholar : PubMed/NCBI
|
|
21
|
Wilson NH and Stoeckli ET: Sonic hedgehog
regulates its own receptor on postcrossing commissural axons in a
glypican1-dependent manner. Neuron. 79:478–491. 2013. View Article : Google Scholar : PubMed/NCBI
|
|
22
|
Kleeff J, Ishiwata T, Kumbasar A, Friess
H, Büchler MW, Lander AD and Korc M: The cell-surface heparan
sulfate proteoglycan glypican-1 regulates growth factor action in
pancreatic carcinoma cells and is overexpressed in human pancreatic
cancer. J Clin Invest. 102:1662–1673. 1998. View Article : Google Scholar : PubMed/NCBI
|
|
23
|
Kleeff J, Wildi S, Kumbasar A, Friess H,
Lander AD and Korc M: Stable transfection of a glypican-1 antisense
construct decreases tumorigenicity in PANC-1 pancreatic carcinoma
cells. Pancreas. 19:281–288. 1999. View Article : Google Scholar : PubMed/NCBI
|
|
24
|
Ding K, Lopez-Burks M, Sánchez-Duran JA,
Korc M and Lander AD: Growth factor-induced shedding of syndecan-1
confers glypican-1 dependence on mitogenic responses of cancer
cells. J Cell Biol. 171:729–738. 2005. View Article : Google Scholar : PubMed/NCBI
|
|
25
|
Lu H, Niu F, Liu F, Gao J, Sun Y and Zhao
X: Elevated glypican-1 expression is associated with an unfavorable
prognosis in pancreatic ductal adenocarcinoma. Cancer Med.
6:1181–1191. 2017. View Article : Google Scholar : PubMed/NCBI
|
|
26
|
Weber C: Biomarkers: The challenge to find
biomarkers for the early detection of pancreatic cancer. Nat Rev
Gastroenterol Hepatol. 12:4272015. View Article : Google Scholar : PubMed/NCBI
|
|
27
|
Duan L, Hu XQ, Feng DY, Lei SY and Hu GH:
GPC-1 may serve as a predictor of perineural invasion and a
prognosticator of survival in pancreatic cancer. Asian J Surg.
36:7–12. 2013. View Article : Google Scholar : PubMed/NCBI
|
|
28
|
Witkiewicz AK, McMillan EA, Balaji U, Baek
G, Lin WC, Mansour J, Mollaee M, Wagner KU, Koduru P, Yopp A, et
al: Whole-exome sequencing of pancreatic cancer defines genetic
diversity and therapeutic targets. Nat Commun. 6:67442015.
View Article : Google Scholar : PubMed/NCBI
|
|
29
|
Edge SB, Byrd DR, Compton CC, Fritz AG,
Greene FL and Trotti A: AJCC Cancer Staging Manual. 7th. Springer;
New York, NY: 2010
|