Introduction
Ovarian carcinoma (OV) is one of the most lethal
gynecological malignancies worldwide, and it has recently been
reported that there are ~239,000 newly diagnosed cases of OV
globally each year, of which 152,000 result in fatalities (1). Since OV is often asymptomatic until
advanced stages, patients are frequently only diagnosed late during
the course of the disease, making it more difficult to treat
(2). The current widely accepted
standard treatment for OV involves maximal cytoreductive surgical
debulking, comprehensive staging once diagnosed during surgery
according to current International Federation of Obstetrics and
Gynecology (FIGO) recommendations, and six postoperative courses of
platinum-based chemotherapy (3),
although detailed treatment plans are tailored to individual
conditions. In 2018, according to American data, the overall 5-year
survival rate of OV was 47%, but for the majority of women who are
diagnosed with advanced-stage disease the survival rate drops to
29% (4). In fact, >80% of these
patients initially respond well to therapy, but most of them
eventually relapse and ultimately develop chemotherapy-resistant
disease (5). Currently, the widely
accepted factors able to predict the prognosis of patients with OV
include post-operative residual tumor, histological type, FIGO
stage, patient age and the presence of ascites (6). Many researchers have been trying to
identify biomarkers relating to the prognosis of patients with OV
and so far many biomarkers have been identified for the early
diagnosis and prediction of progression and prognosis of OV
(7–9), however none have been suitable for
clinical application.
The tumor microenvironment (TME) has been shown to
have a critical influence on the initiation and spread of tumors by
affecting gene expression in tumor tissues (10–12). The
TME is the cellular milieu in which tumor is located and is
composed of a complex network that includes immune cells,
mesenchymal cells, endothelial cells, inflammatory mediators,
extracellular matrix molecules, and other components (13). Immune cells and stromal cells are the
two major non-tumor components of the TME and have been proposed to
be valuable for the diagnostic and prognostic assessment of tumors
(13). Tumor patients with different
degree of infiltration of immune cells and stromal cells had
different prognosis. The degree of infiltration of immune cells and
stromal cells was inversely proportional to tumor purity. Patients
with different tumor purity would therefore have different
prognosis (13). In 2013, Yoshihara
et al (14) published an
algorithm called the Estimation of STromal and Immune cells in
MAlignant Tumor tissues using Expression data (ESTIMATE). This
method uses gene expression signatures to infer the fraction of
stromal and immune cells in tumor tissues and tumor purity using
gene expression data. Combined with the large amount of available
tumor data, it is very effective for drawing association between
tumor tissue components and the prognosis of patients. Jia et
al (15) reported a list of
glioblastoma microenvironment-related genes using this method, and
demonstrated that these genes could predict poor outcome in
glioblastoma. However, to date, there have been no reports using
ESTIMATE scores to study OV.
As the prognosis for patients with OV is worse than
any other gynecologic cancer, in the present study, ESTIMATE was
utilized to pull out useful information about OV from The Cancer
Genome Atlas (TCGA) database in order to identify genes that are
not only significant prognostic predictors, but also immune-therapy
target markers for OV, creating a diagnostic nomogram for patients
with OV.
Materials and methods
Source data of OV from TCGA
The data used in the present study were obtained
from the TCGA database (https://tcga-data.nci.nih.gov/tcga/), including gene
expression data and clinical data, such as sex, age, histological
type, survival and outcome of patients with OV. The inclusion
criteria comprised: i) Patients with complete gene expression data
that could be used to calculate immune scores with ESTIMATE; ii)
patients with complete clinical data; and iii) patients with
complete prognosis data. In order to identify genes that were both
potential prognostic predictors and immune-therapy target markers,
the immune score was calculated by the ESTIMATE as the grouping
indicator. The ESTIMATE algorithm applies single-sample gene set
enrichment analysis to gene expression data and outputs the
estimated levels of infiltrating stromal and immune cells and the
estimated tumor purity. This step was performed with the R software
(version 3.4.3).
Identification and analysis of
differentially expressed genes (DEGs)
After extracting the immune score data (estimated
levels of immune cells) obtained by ESTIMATE, the median was
calculated to group the data into the low-score group (below the
median) and high-score group (above the median).
Log2|FC|>1 and adjusted P<0.05 were set as the
cutoffs to screen for DEGs. A volcano plot was created to visualize
the differences in gene expression levels between the two groups.
This step was performed with the R software (version 3.4.3).
Functional enrichment analysis of
genes of prognostic value
Gene Ontology (GO) enrichment and Kyoto Encyclopedia
of Genes and Genomes (KEGG) pathway analyses were used to explore
the potential biological processes, cellular components, and
molecular functions of DEGs. Significantly relevant signal pathways
were determined with Database for Annotation, Visualization and
Integrated Discovery (16,17) (https://david.ncifcrf.gov/; version 6.8).
Overall survival curve
Kaplan-Meier (KM) plots were generated to illustrate
the relationship between the expression levels of survival-related
DEGs and the overall survival of patients with OV. The survival of
patients with OV for each gene was compared and tested with the
log-rank test. For PNPLA5, a weighted test, Tarone-Ware, was used
for analysis. These steps were performed with the R software
(version 3.4.3).
Identification and validation of
survival-related DEGs
DEGs with P<0.05 were considered statistically
significant and were included in subsequent analyses. Firstly, the
expression levels of the identified DEGs were analyzed with a
univariate Cox's proportional hazards regression model. Secondly, a
multivariate Cox's proportional hazards regression model was
performed to analyze the expression levels of these genes combined
with age, tumor site, clinical stage and histologic grade. Then,
the results of multivariate Cox's proportional hazards regression
model were represented by forest plots. Finally, a lasso-penalized
Cox's regression analysis was conducted to further narrow the range
of DEGs with the greatest predictive performance using 10-fold
cross validation based on the glmnet package from the R
software. The expression levels of genes selected by lasso were
then validated with the TCGA OV datasets, and genes whose
expression levels were higher in OV tissues than normal tissues
were used to generate the nomogram.
Establishment of the prognostic
predictive nomogram
Two identified genes, and related clinical
parameters were used in the establishment of a predictive nomogram
through a step-by-step Cox's regression model to evaluate 3- and
5-year overall survival of patients with OV from the TCGA database.
The risk score of every patient was calculated within CDC20B,
PNPLA5 and age using the Survival program in the R
software package, The risk score was calculated according to the
following formula: Survival risk score=∑i=1NCoefi*Exi. The Coefi is the
coefficient and Exi is the gene expression of two genes, and age.
Patients were divided into six groups according to their age as
follows: Group 1, ≤39 years; group 2, 40–49 years; group 3, 50–59
years; group 4, 60–69 years; group 5, 70–79 years; and group 6, ≥80
years. For each patient, the corresponding Coefi was multiplied by
the corresponding age group number, to which were added the levels
of CDC20B and the level of PNPLA5, in order to obtain
the final risk score. These scores were used to build a nomogram
predictive model using CDC20B, PNPLA5 and age. Finally, ROC
curve analysis and calibration curves were performed to evaluate
the effectiveness of the generated nomogram model.
External validation of the prognostic
predictive nomogram
The GSE32062 dataset (18) was downloaded from Gene Expression
Omnibus (GEO; http://www.ncbi.nlm.nih.gov/geo/query/acc.cgi?acc=GSE32062)
in PubMed to validate the nomogram. As aforementioned, ROC and
calibration curve analysis were performed to show the effectiveness
of the nomogram applied in the GSE32062 external dataset. In
addition, KM curves with these data were used to compare the
prognosis between high-risk and low-risk groups according to the
risk score.
Statistical analysis
Statistical analysis was carried out in the R
software (version 3.4.3). Continuous variables were analyzed using
Student's t-test for two independent samples. The Pearson
correlation coefficient assessed the correlation between immune
score and tumor purity. Univariate and multivariate Cox's
regression analyses were also performed in R. In addition, the
hazard ratio and 95% confidence interval was calculated to identify
genes associated with overall survival. P<0.05 was considered to
indicate a statistically significant difference.
Results
Obtaining the OV data from the TCGA
dataset and calculating the immune score
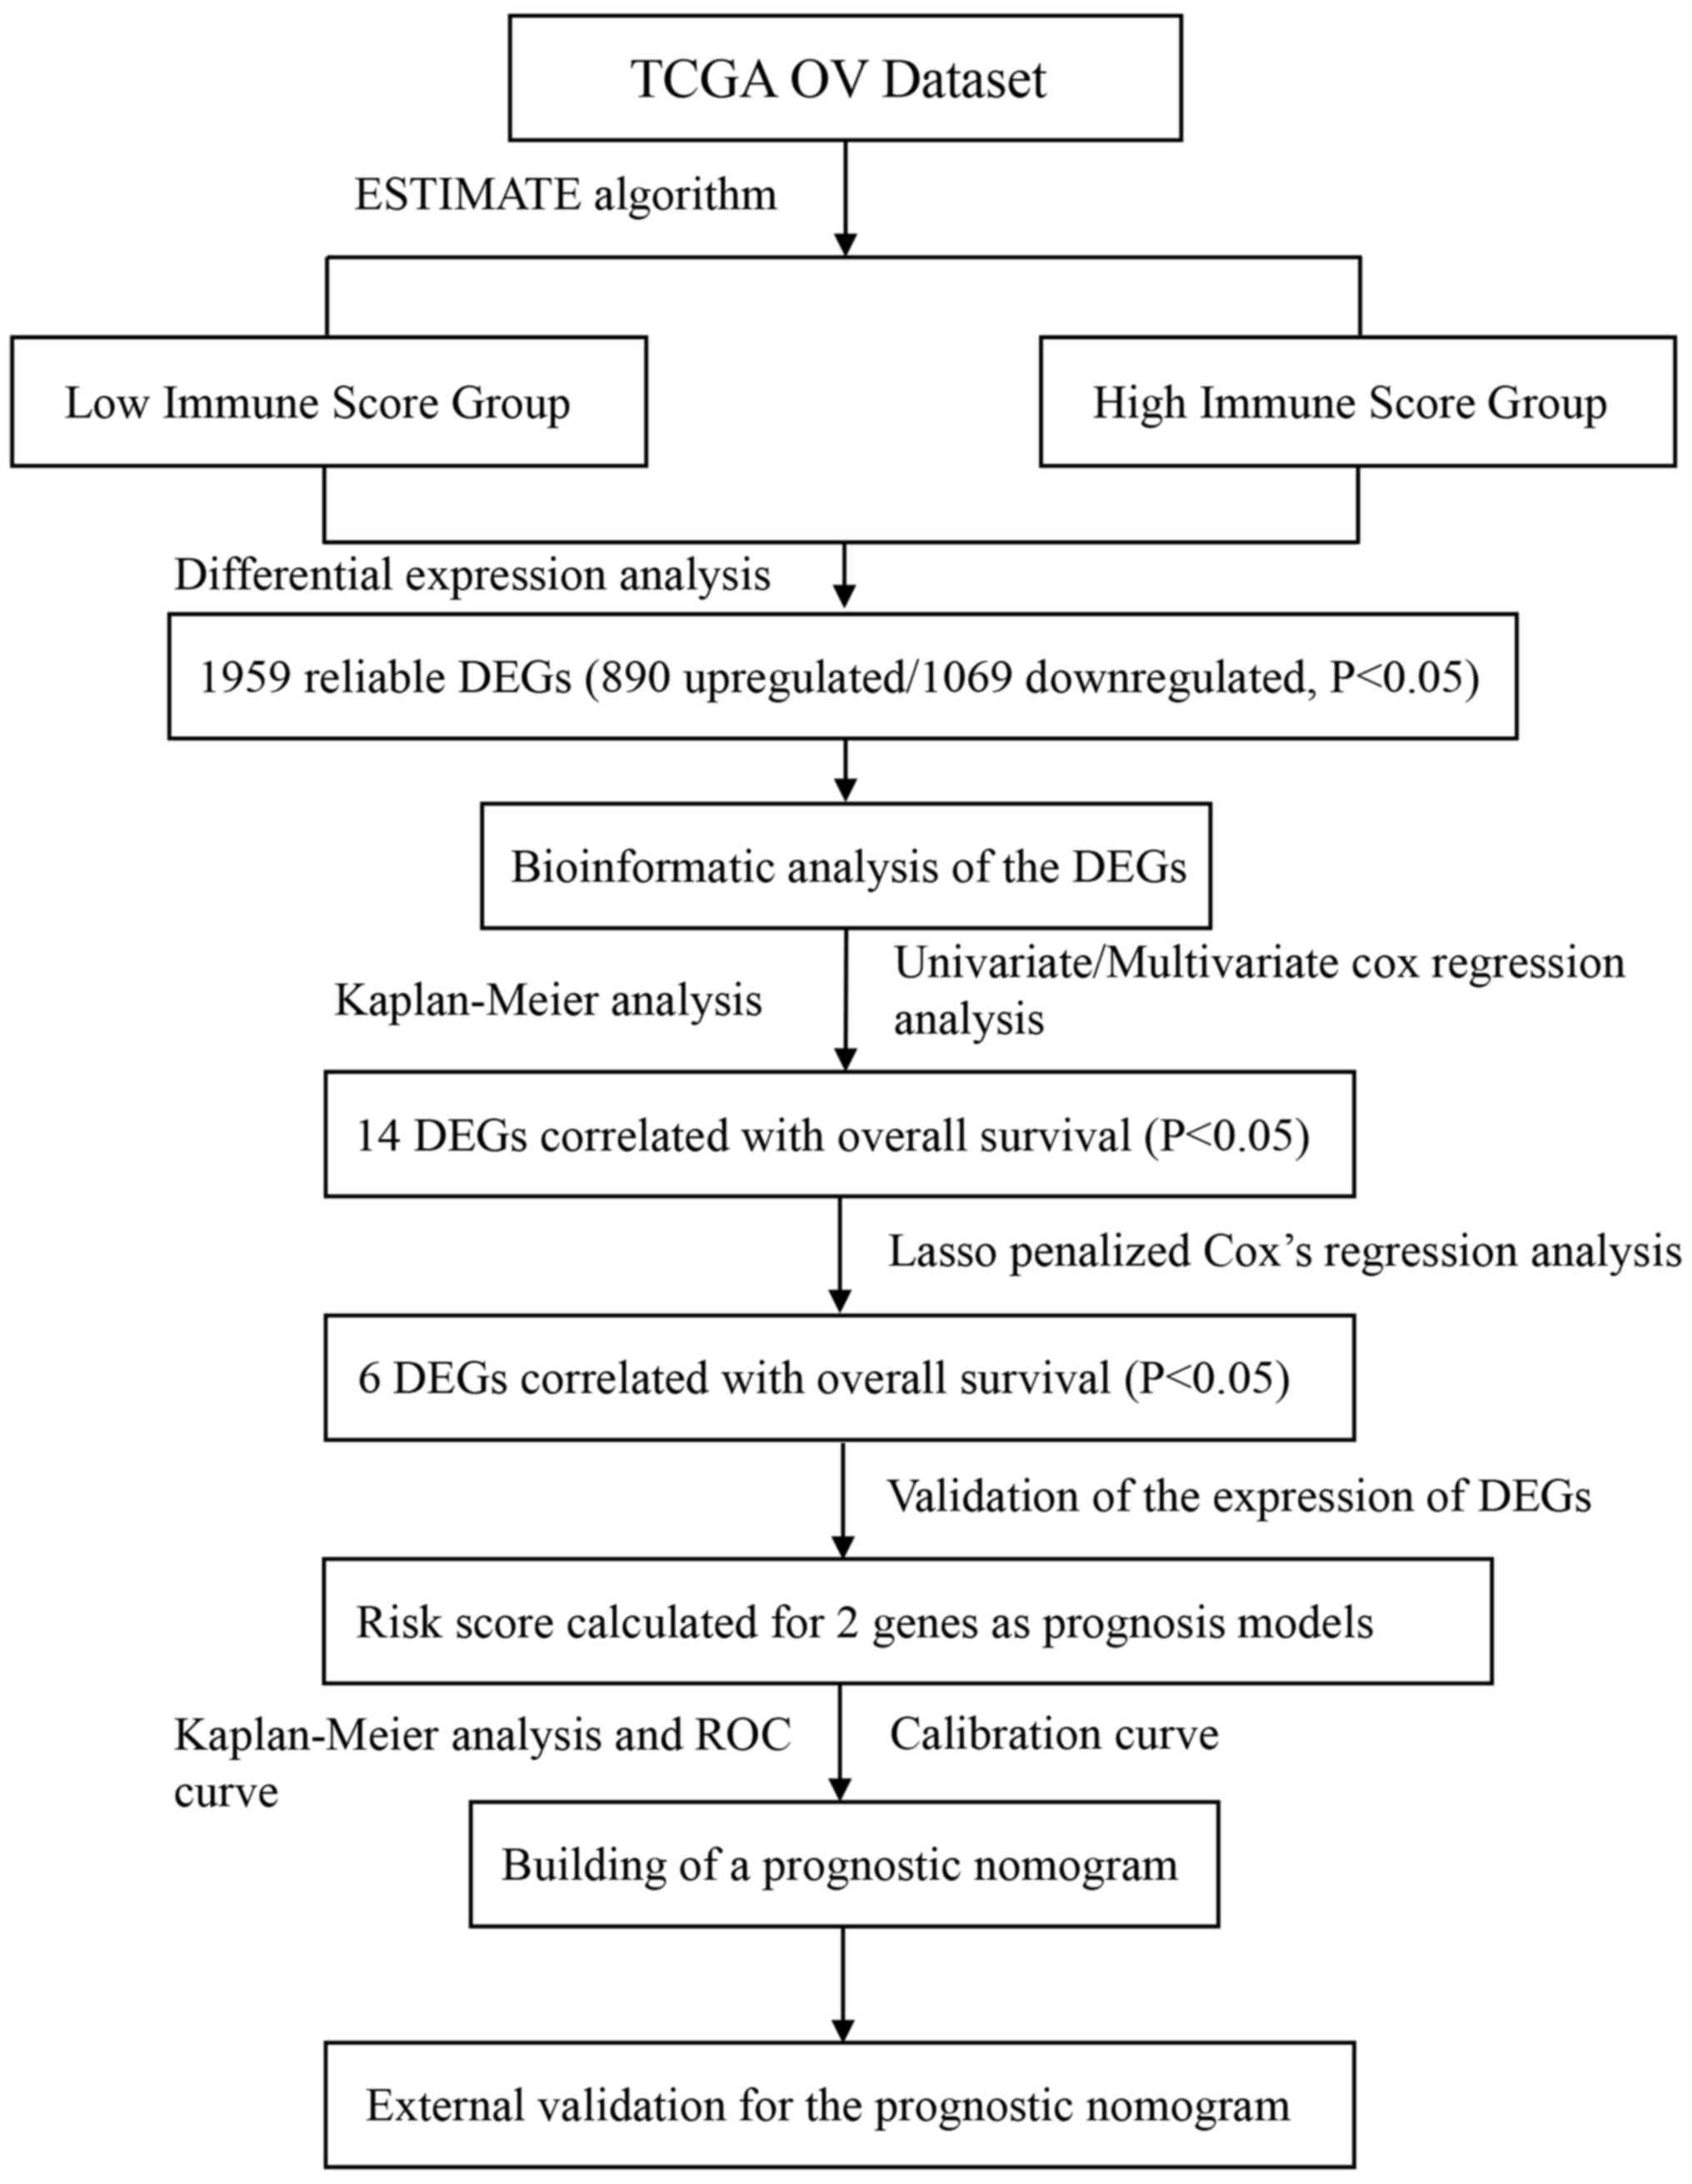
The flowchart of the analysis procedure is shown in
Fig. 1. The profiles were downloaded
from the TCGA database, including gene expression and clinical
information, of 379 patients with OV before 2017. Only cases with
data for both complete gene expression and clinical information
were included in the analysis, and the ESTIMATE algorithm produced
immune scores for these cases ranging from −1756.05 to 6120.57
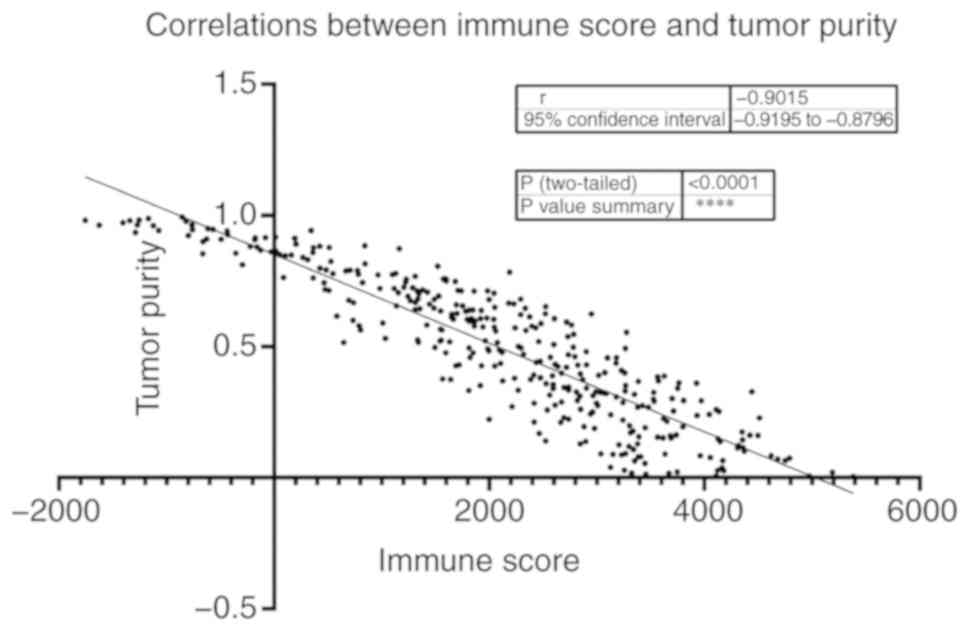
(Table SI). Results from the
ESTIMATE algorithm found that in the OV data, the immune score was
significantly negatively associated with tumor purity (Fig. 2), which is in line with a previous
study that reported that the immune score is negatively associated
with tumor purity (14). In order to
explore the potential association between overall survival and the
immune score, the 379 patients with OV were divided into high
immune score and low immune score groups that had immune scores
above and below the median score, respectively.
Identification of DEGs and
bioinformatics analysis
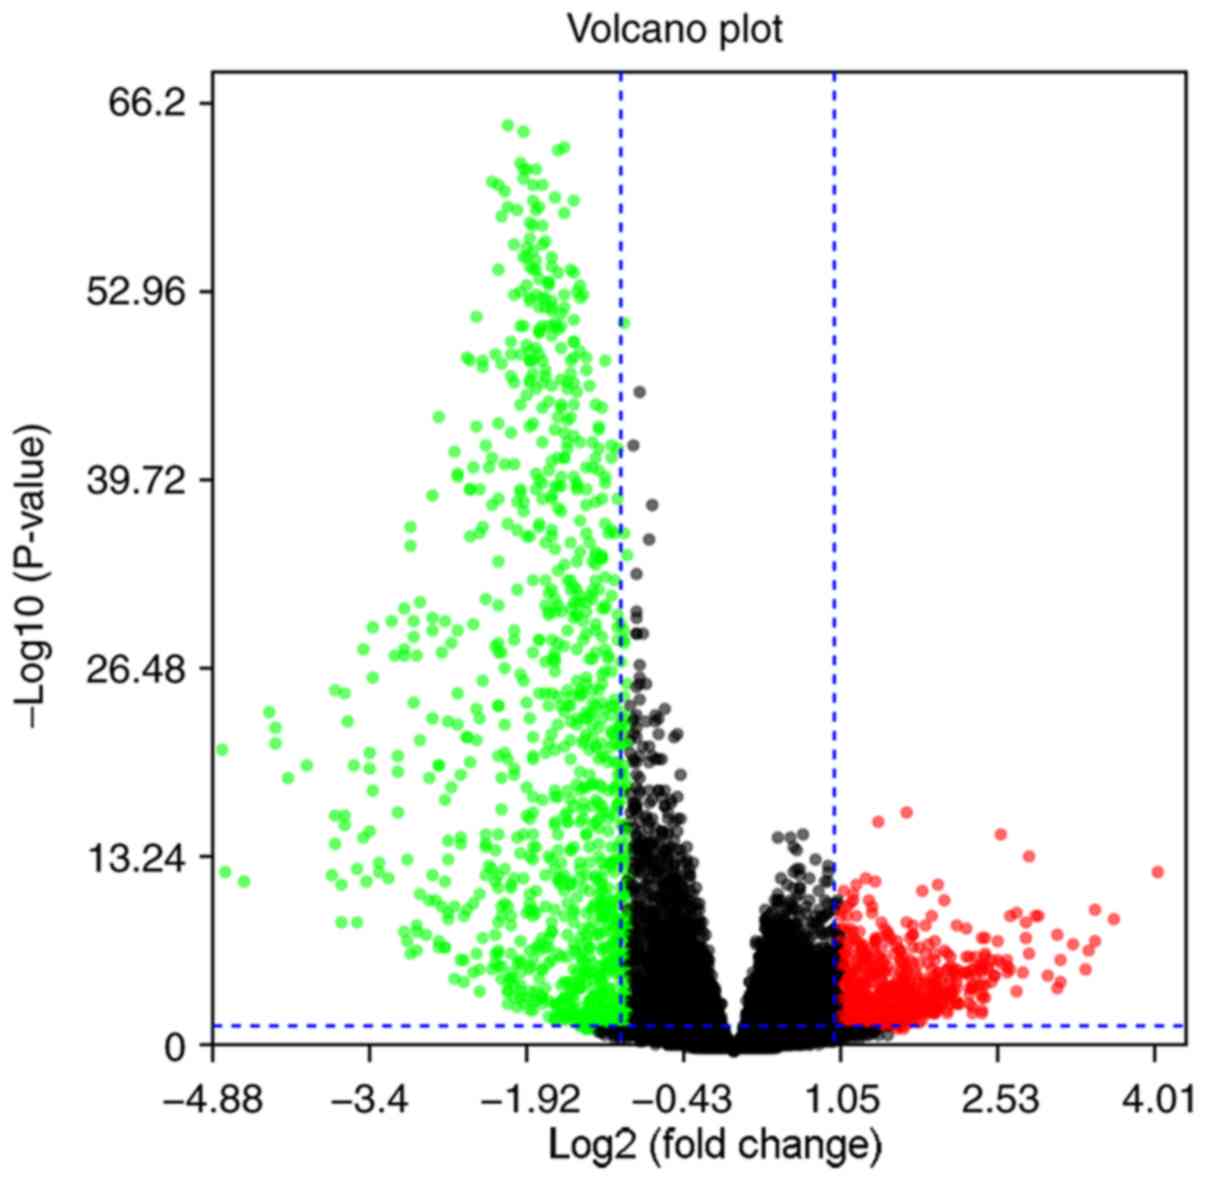
When comparing genes from the low immune score group
to genes from the high immune score group, 890 genes were
identified as upregulated, whereas 1069 genes were downregulated,
as shown in the volcano plot (Log2|FC|>1; P<0.05;
Fig. 3).
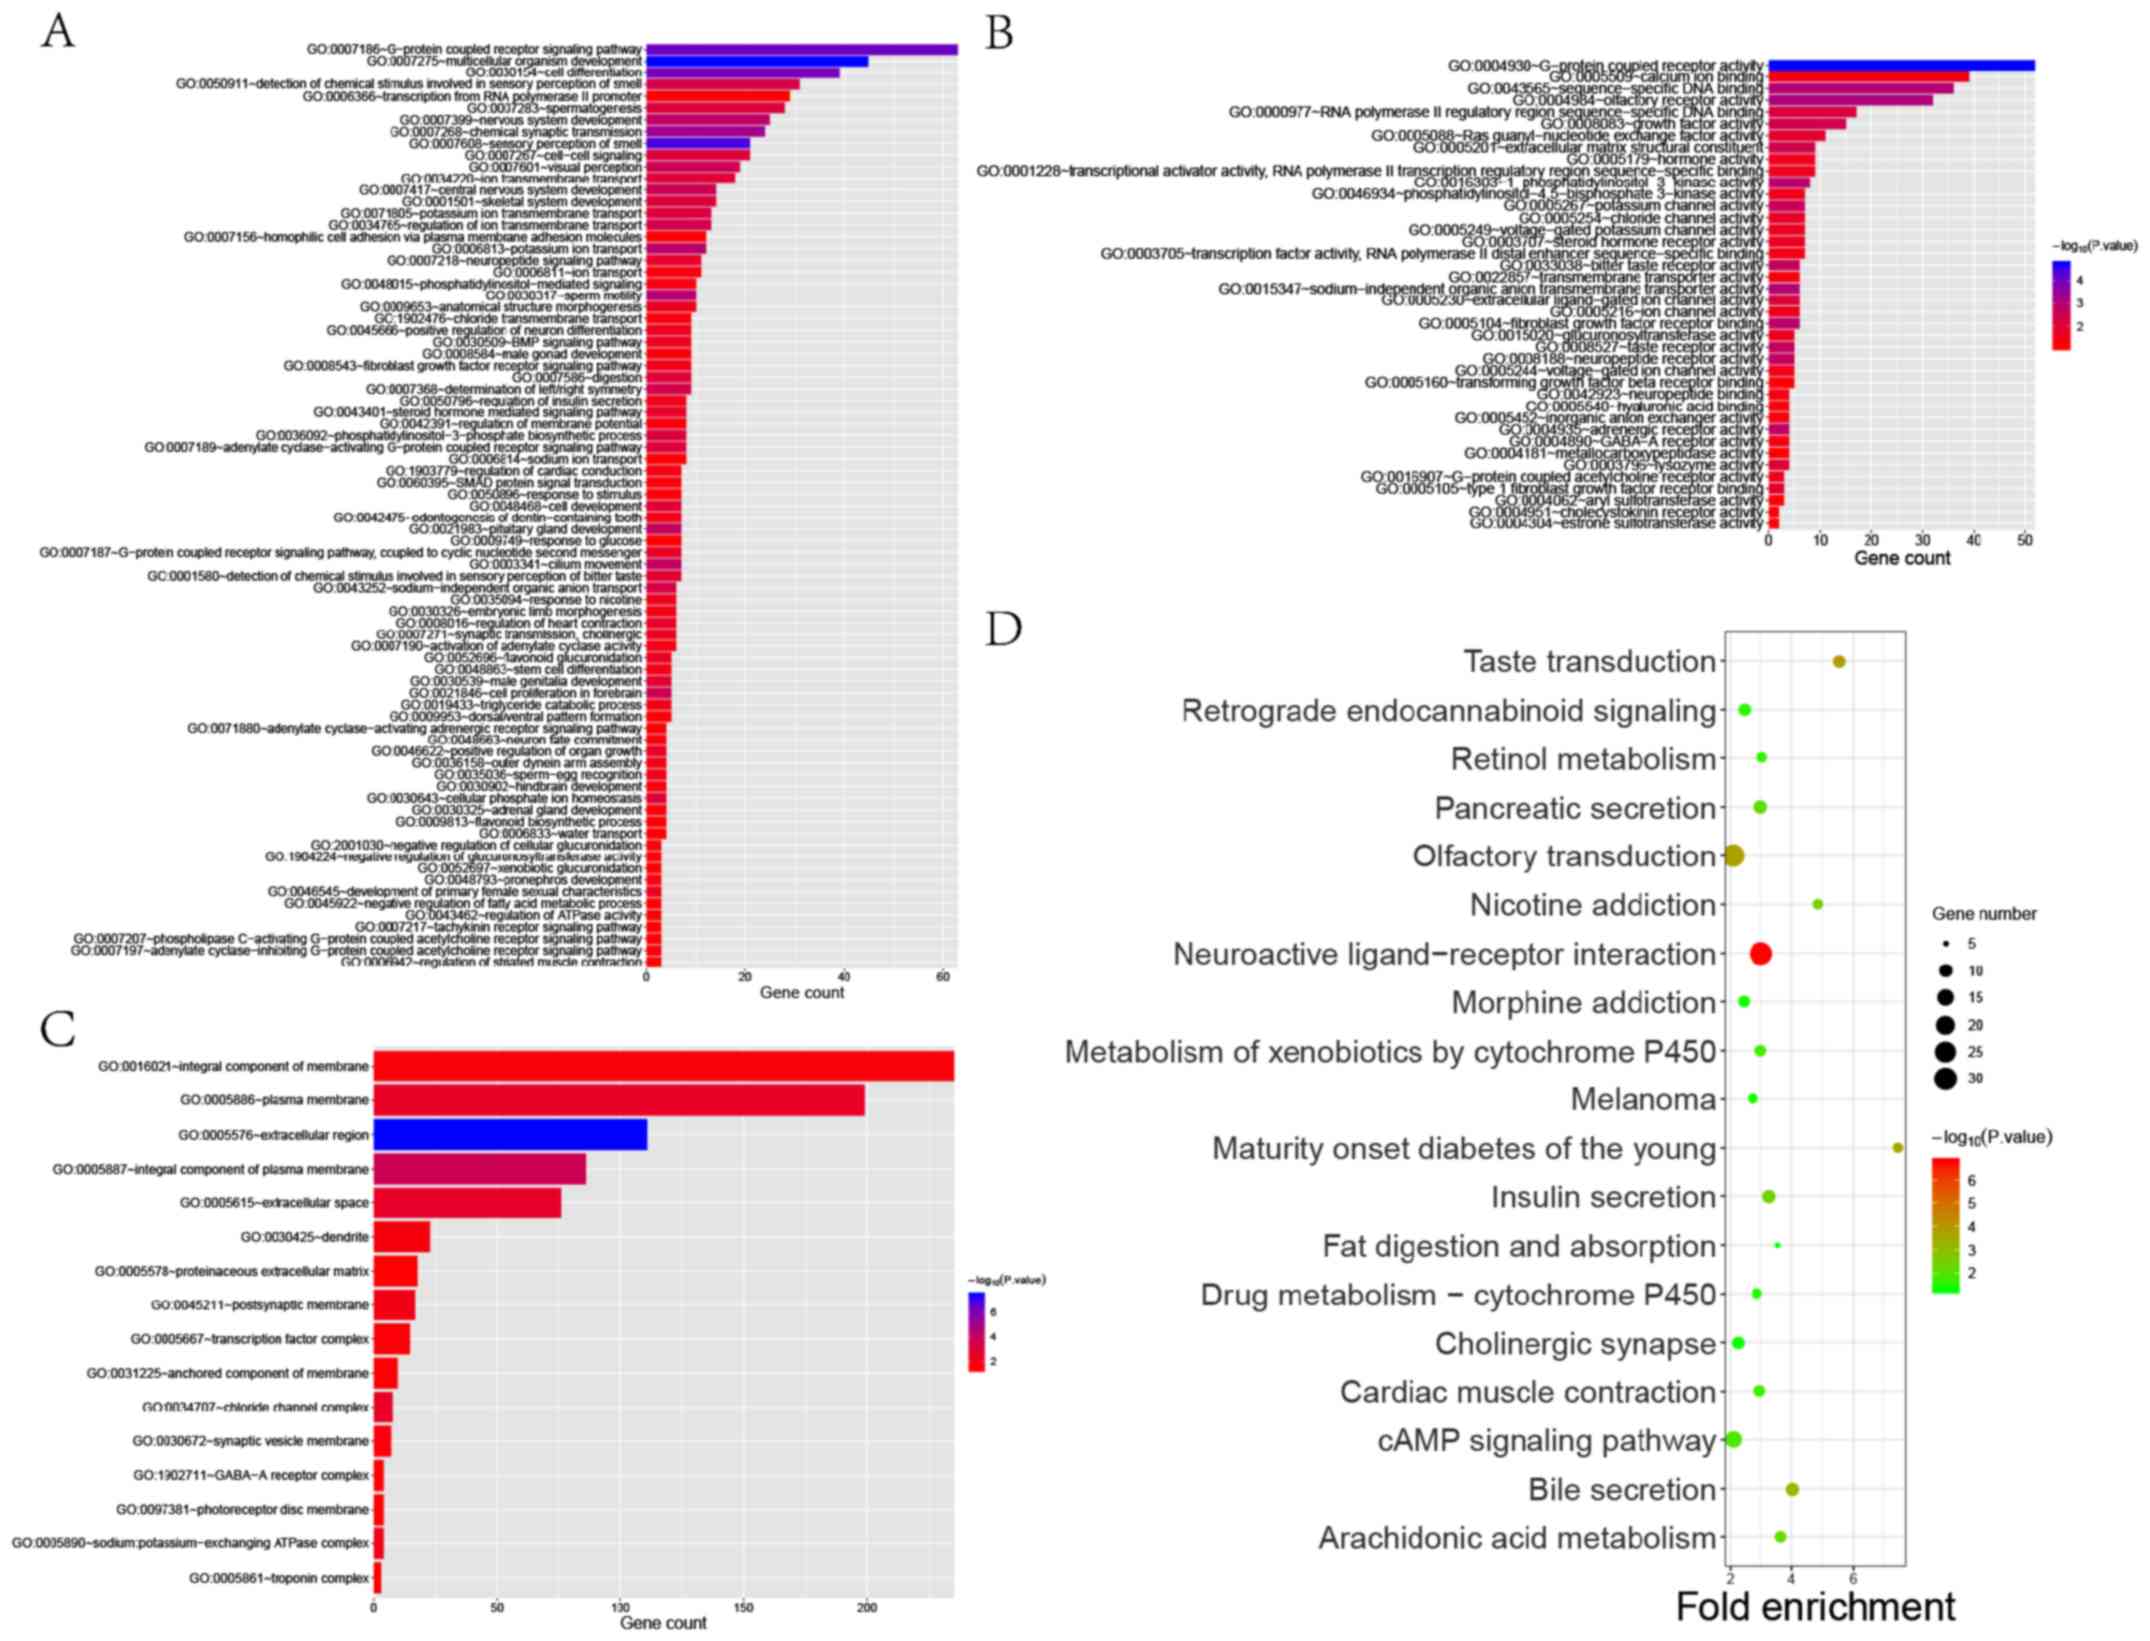
GO and KEGG pathway enrichment analyses were used to
identify the functions of the identified DEGs. GO analysis showed
that DEGs were significantly enriched in biological processes
related to cell proliferation and differentiation, G-protein
coupled receptor (GPCR) signaling pathways and neurogenesis
(Fig. 4A-C). These findings were
consistent with previous research on the role of endocrine GPCRs in
OV (19), showing that GPCRs are
involved in many aspects of tumorigenesis, including the promotion
of aberrant growth, increased cell viability, angiogenesis and
metastasis (20,21). In addition, results from Fig. 4C demonstrated that DEGs were enriched
in integral component of membrane, plasma membrane and postsynaptic
membrane, which were regarded as important in biological
information transmission. In addition, KEGG analysis showed that
the identified DEGs were significantly enriched in biological
processes related to the interactions between neuroactive ligands
and receptors (Fig. 4D). We
performed KM survival analysis on all up-regulated and
down-regulated genes, and obtained the overall survival of 38 genes
that were statistically different (Table SII).
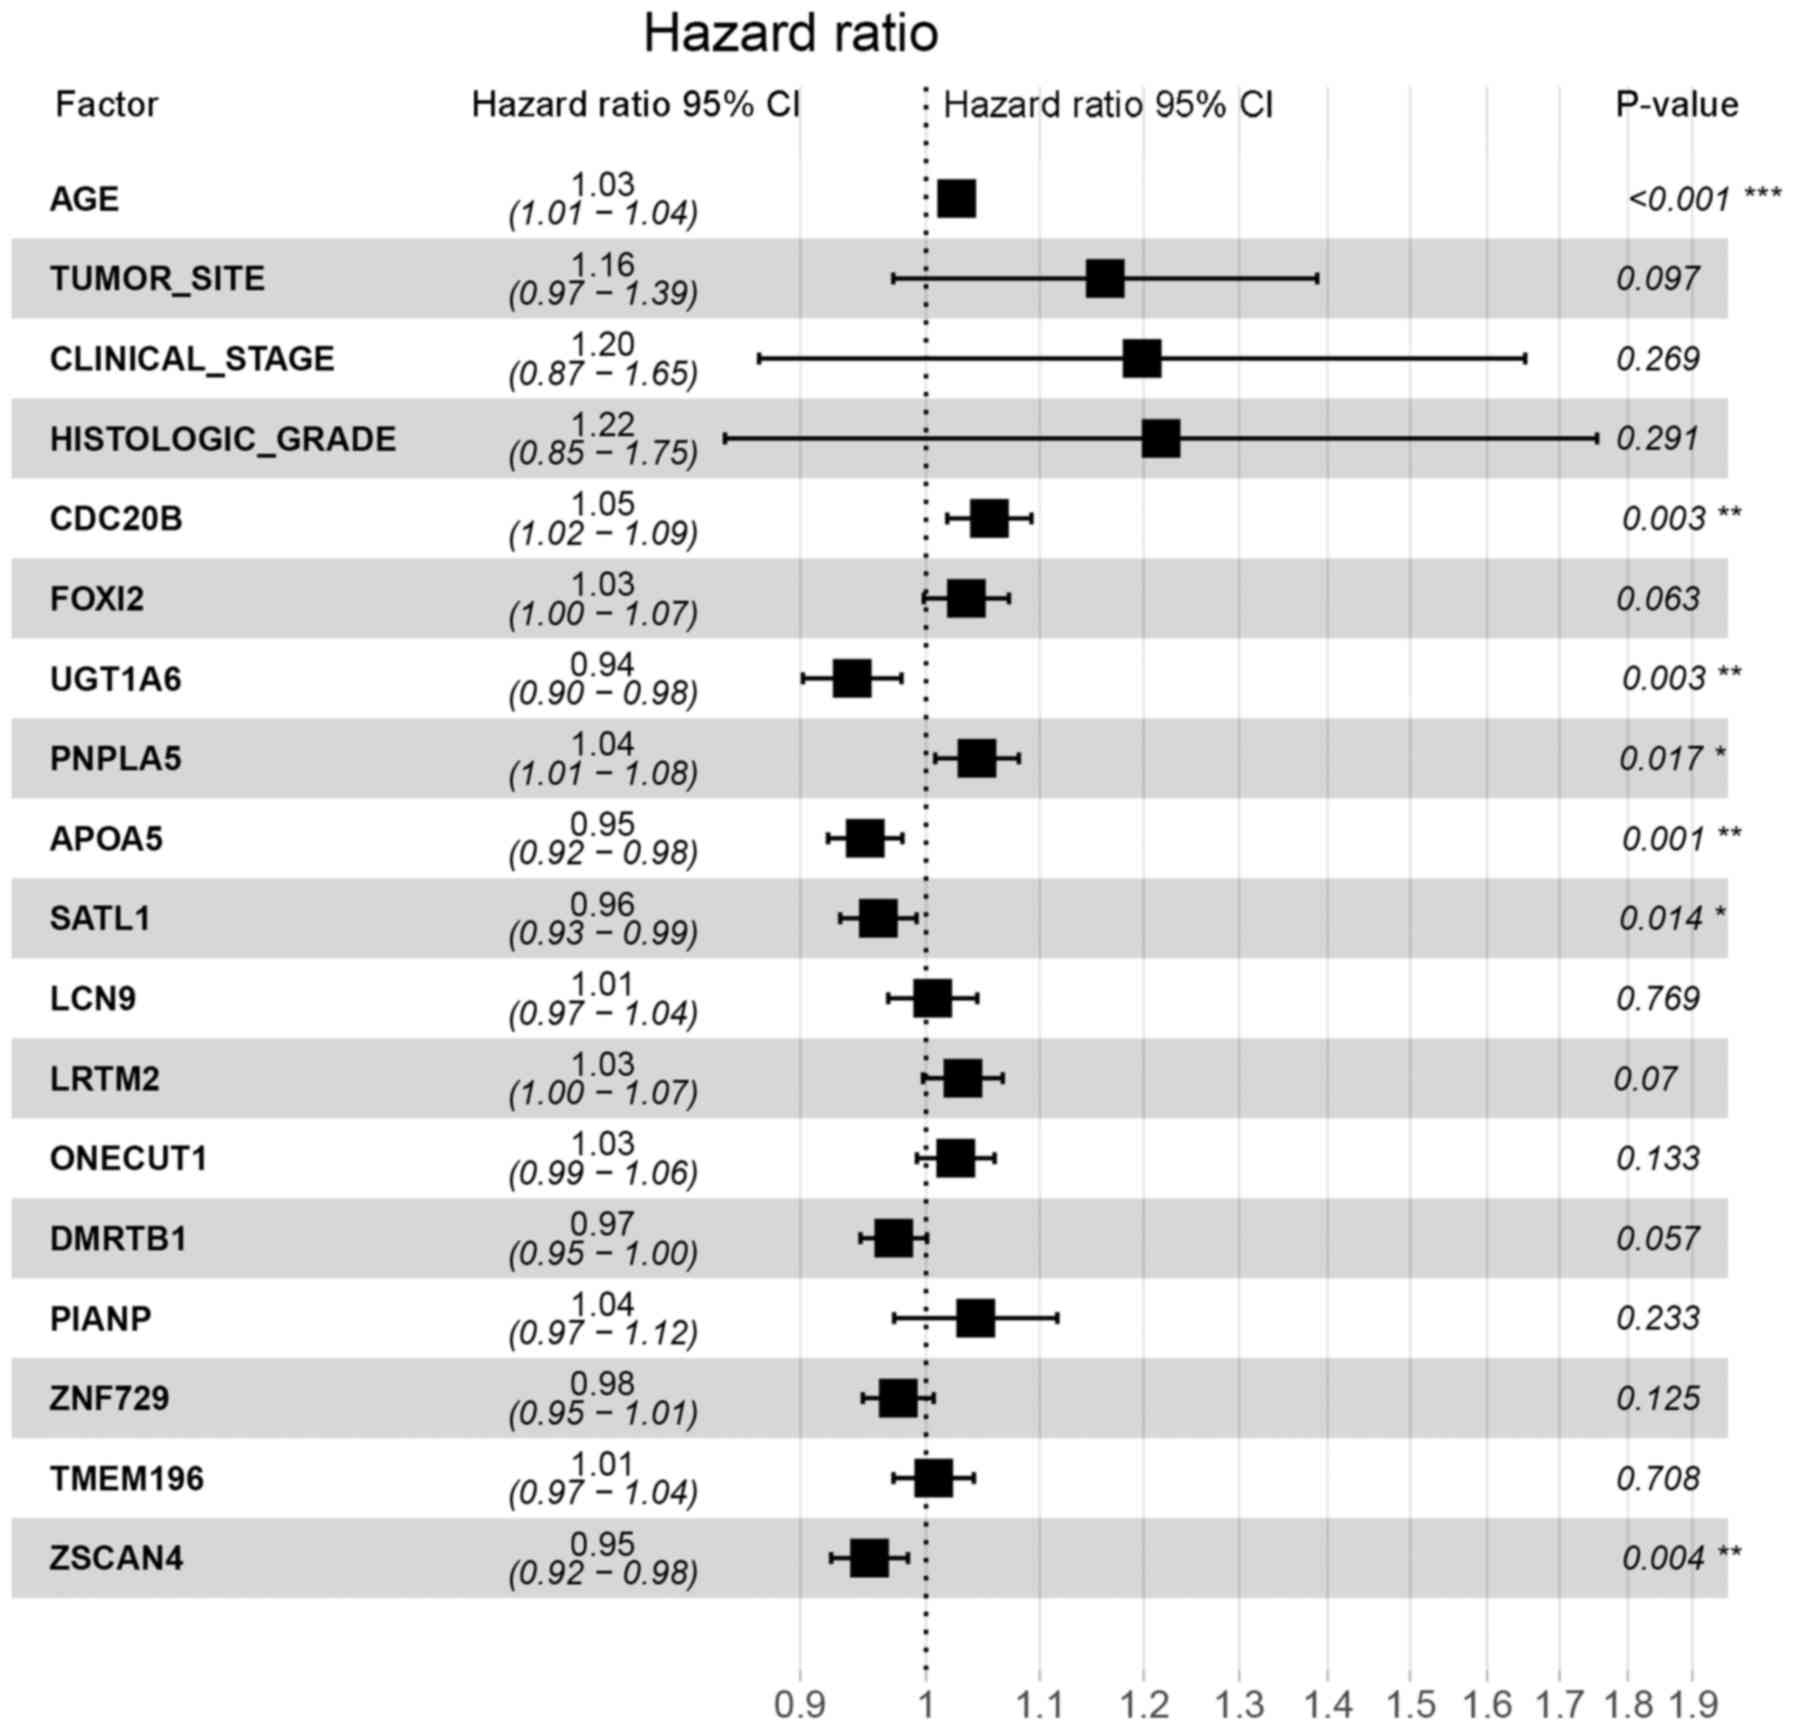
Evaluation of prognostic factors in
OV
Prognostic factors associated with overall survival
of OV were identified by univariate Cox's regression analyses. The
results demonstrated that age and 14 DEGs were significantly
associated with the overall survival (Table SIII). From these identified 14 DEGS,
multivariate Cox's regression analysis showed that six genes and
clinical features, including age, were significantly associated
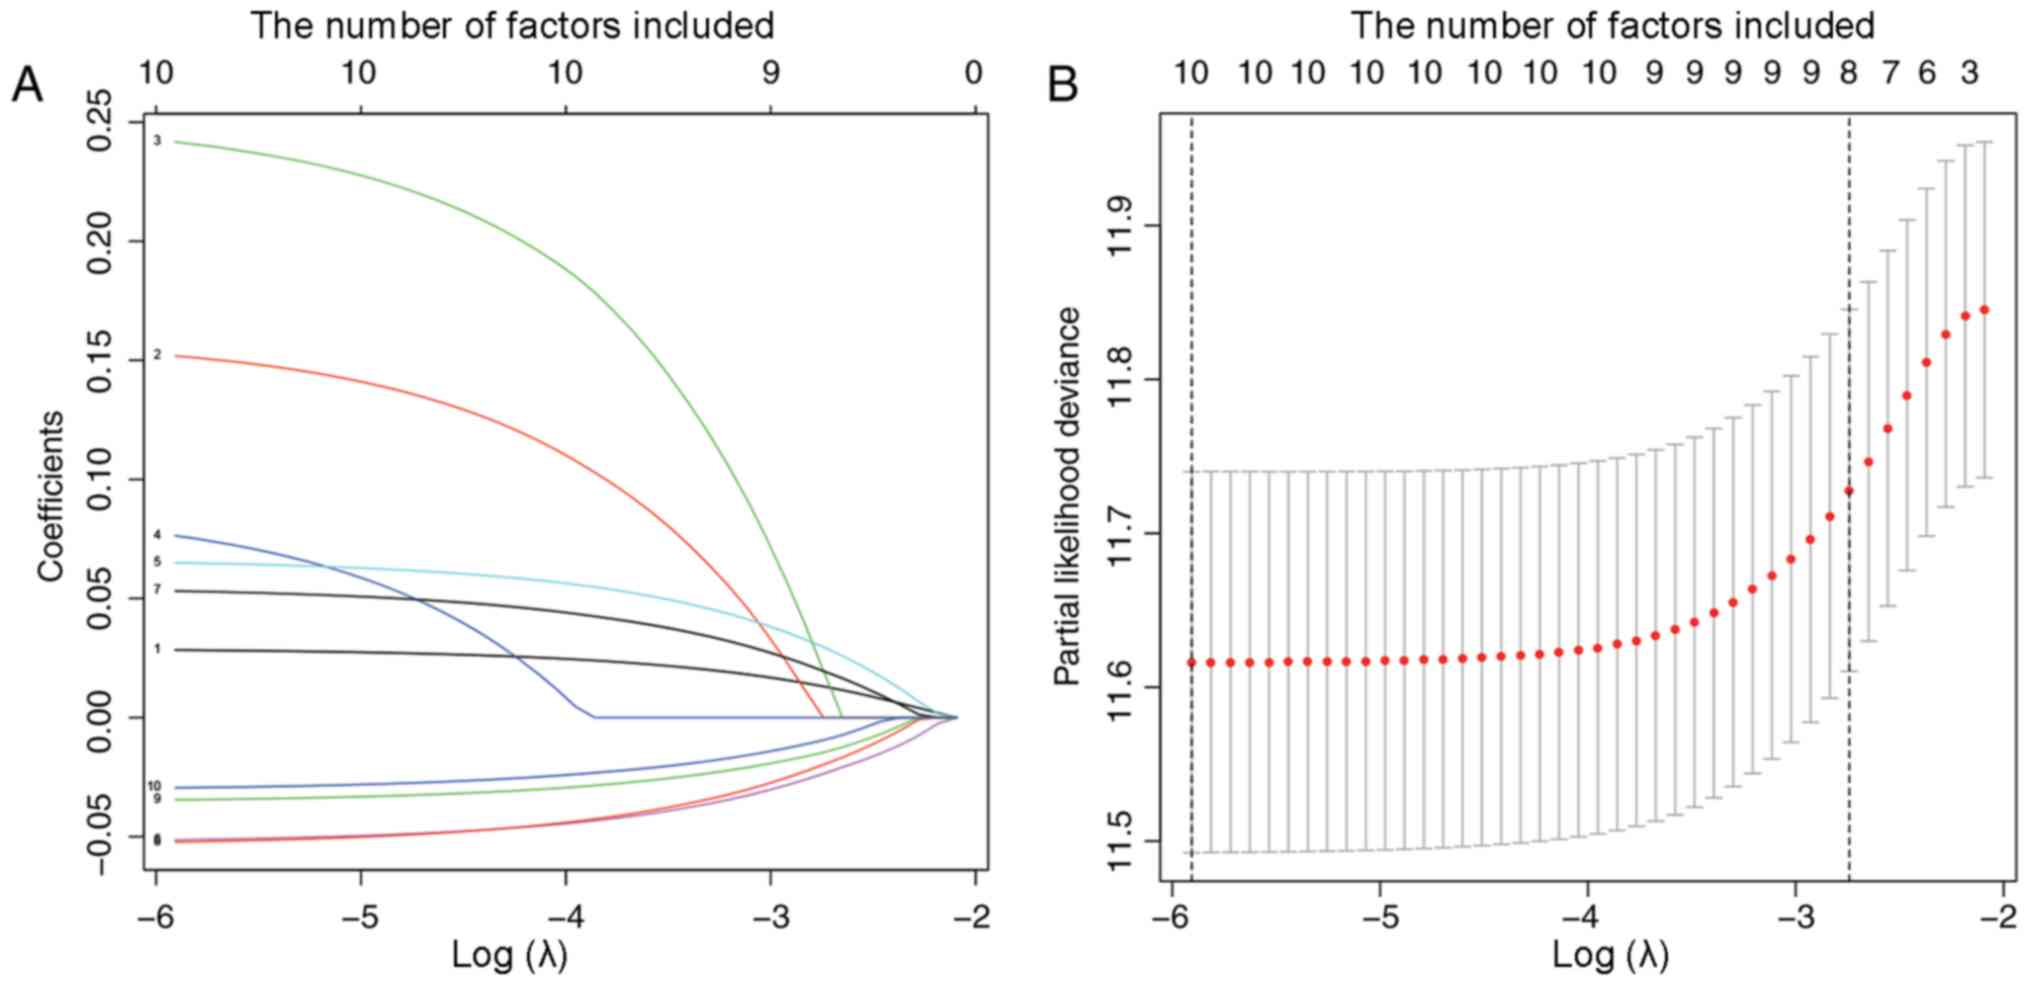
with OV prognosis (Fig. 5). In order
to identify the DEGs that could better reflect the association with
OV prognosis, lasso-penalized Cox's regression was performed.
Results showed that these six genes, CDC20B, UDP
glucuronosyltransferase family 1 member A6 (UGT1A6),
PNPLA5, apolipoprotein A5 (APOA5),
spermidine/spermine N1-acetyl transferase like 1 (SATL1),
and zinc finger and SCAN domain containing 4 (ZSCAN4), age
and clinical stage were significantly related with the prognosis of
OV (Fig. 6 and Table SIV). When these results were
combined with the multivariate Cox's regression analysis results,
clinical stage was excluded, as it did not show a statistically
significant difference in the multivariate Cox's regression
analysis.
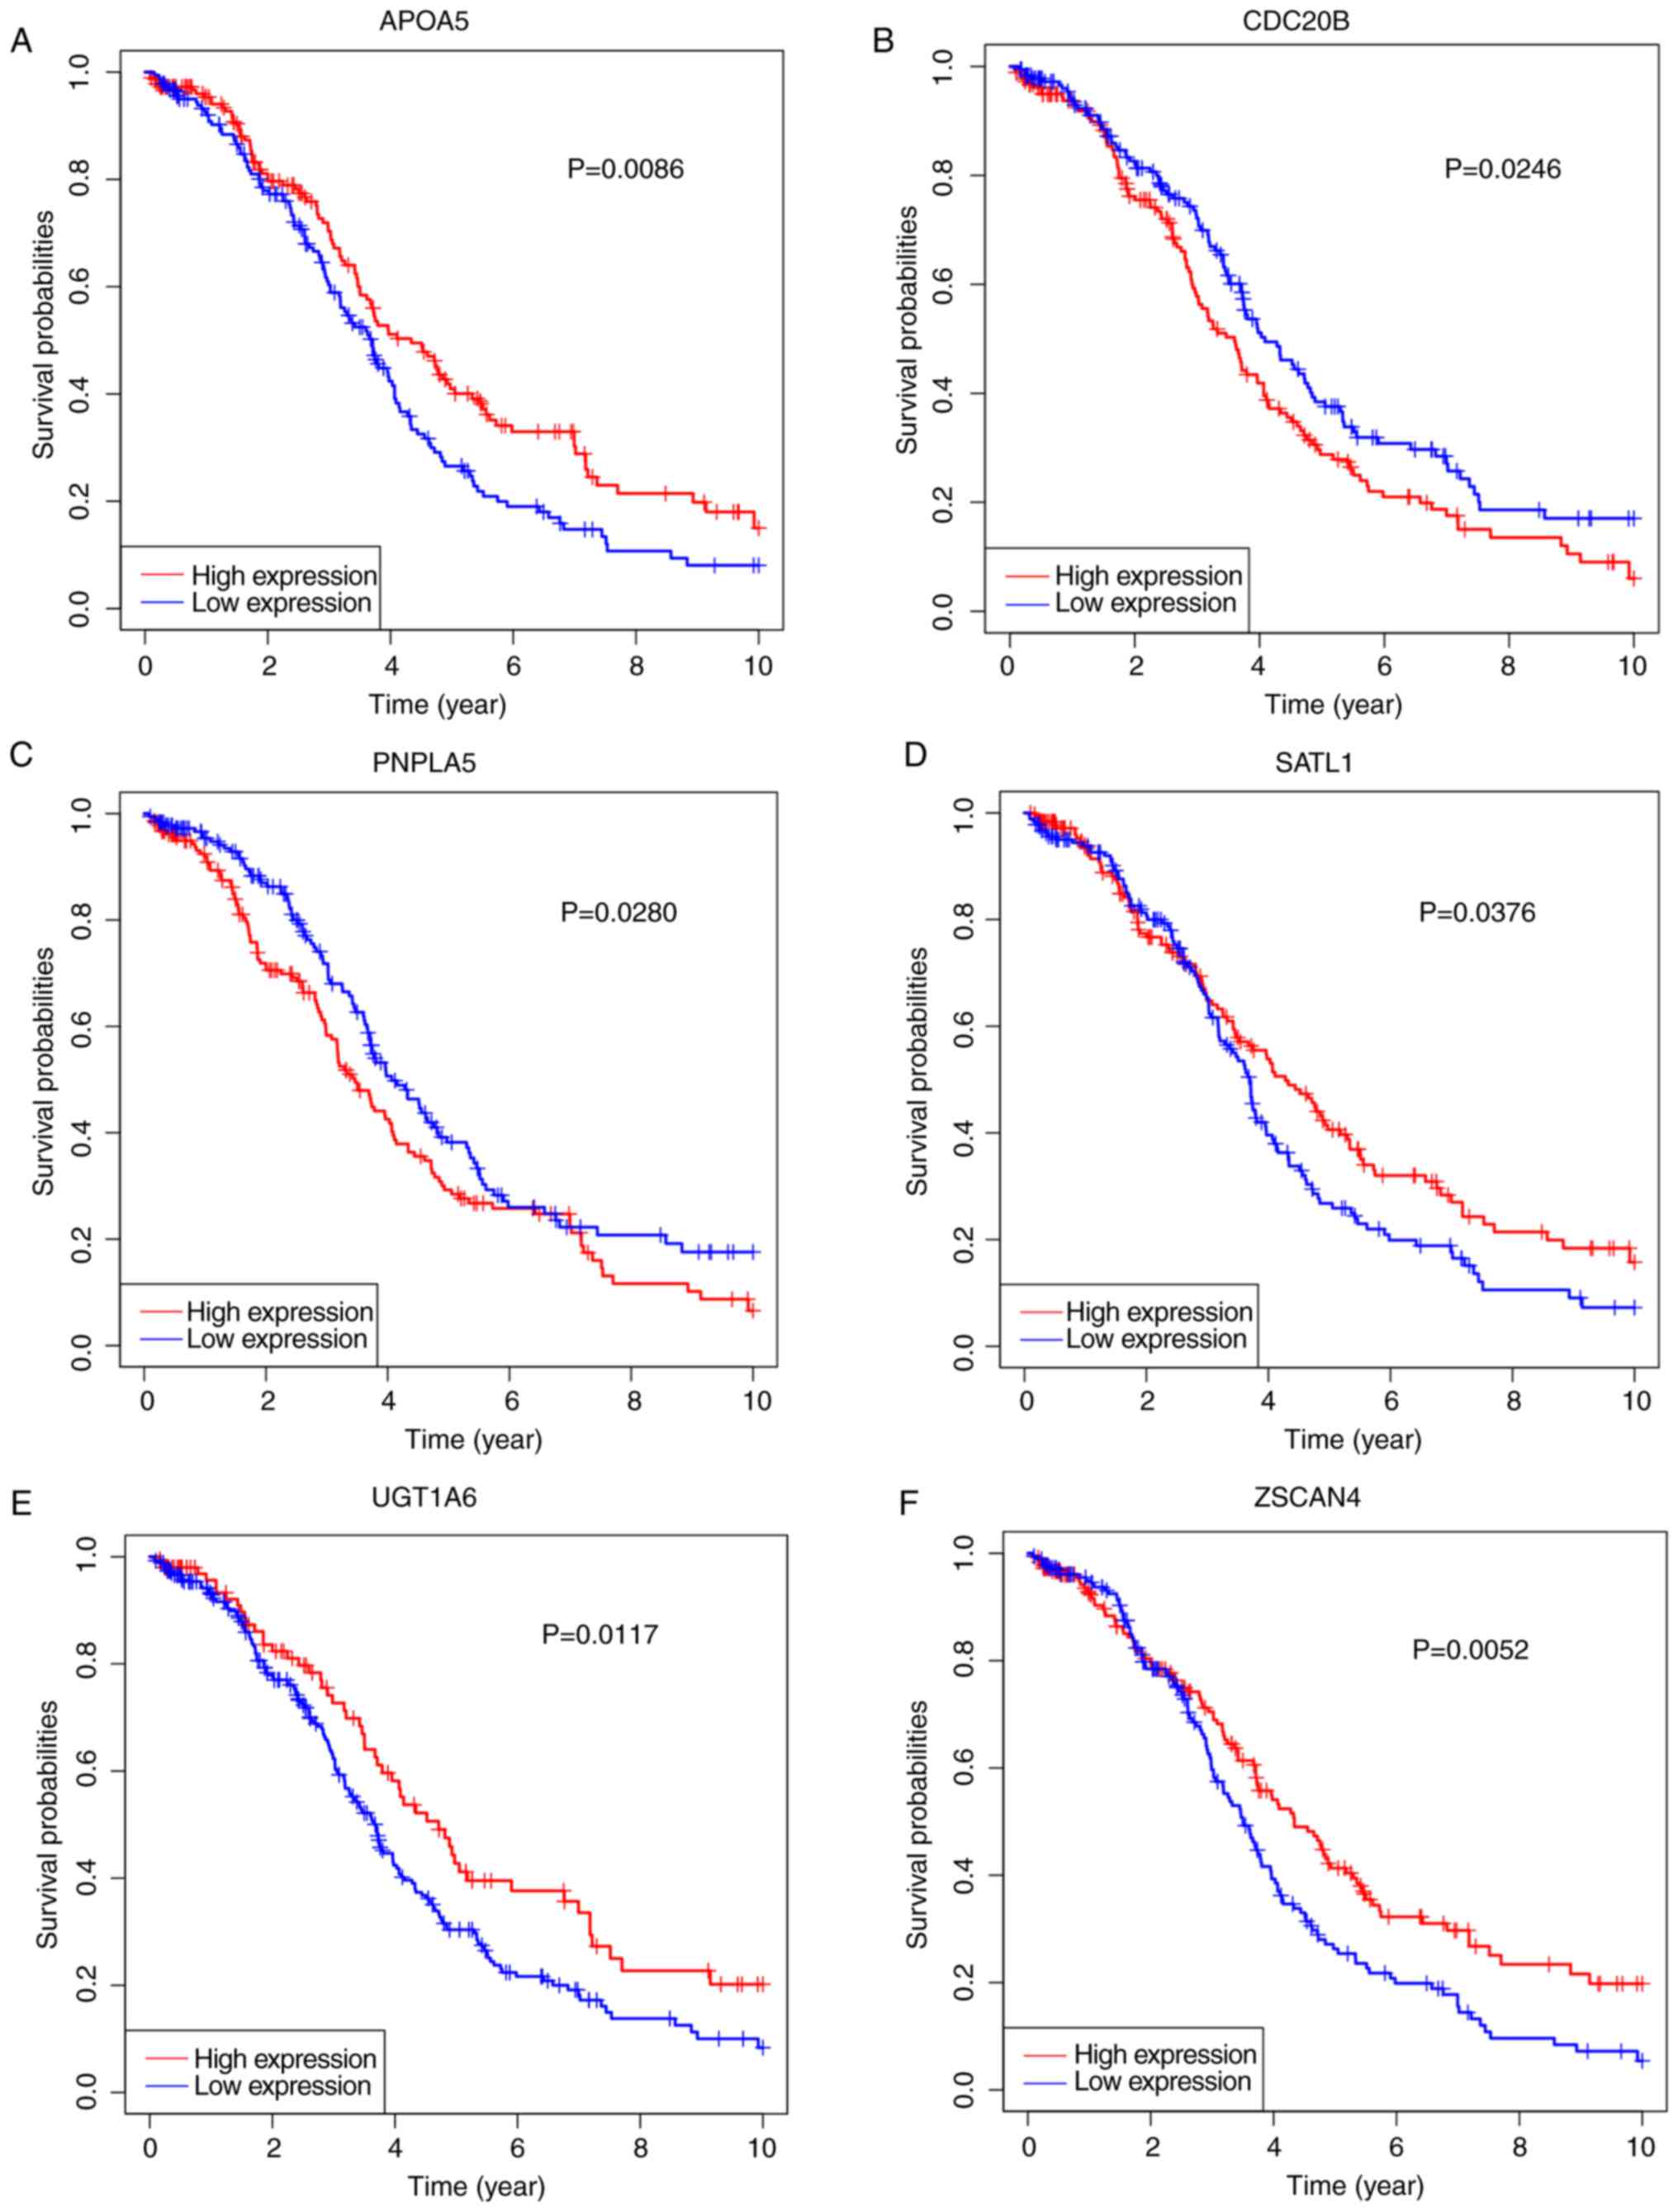
In order to explore the potential prognostic
signature genes, KM survival curves of the genes identified in the
lasso-penalized Cox's regression were calculated (Fig. 7). High expression of CDC20B and
PNPLA5 was associated with a low survival rate, whereas high
expression of the other four genes showed an opposite effect. These
results suggest that CDC20B and PNPLA5 might be
oncogenes, whereas the remaining genes may be tumor suppressor
genes. After validation of the expression levels of the six genes,
only the expression levels of CDC20B and PNPLA5 were
in line with higher in OV tissues (Fig.
8), and only CDC20B, PNPLA5 and age were included in the
subsequent analysis.
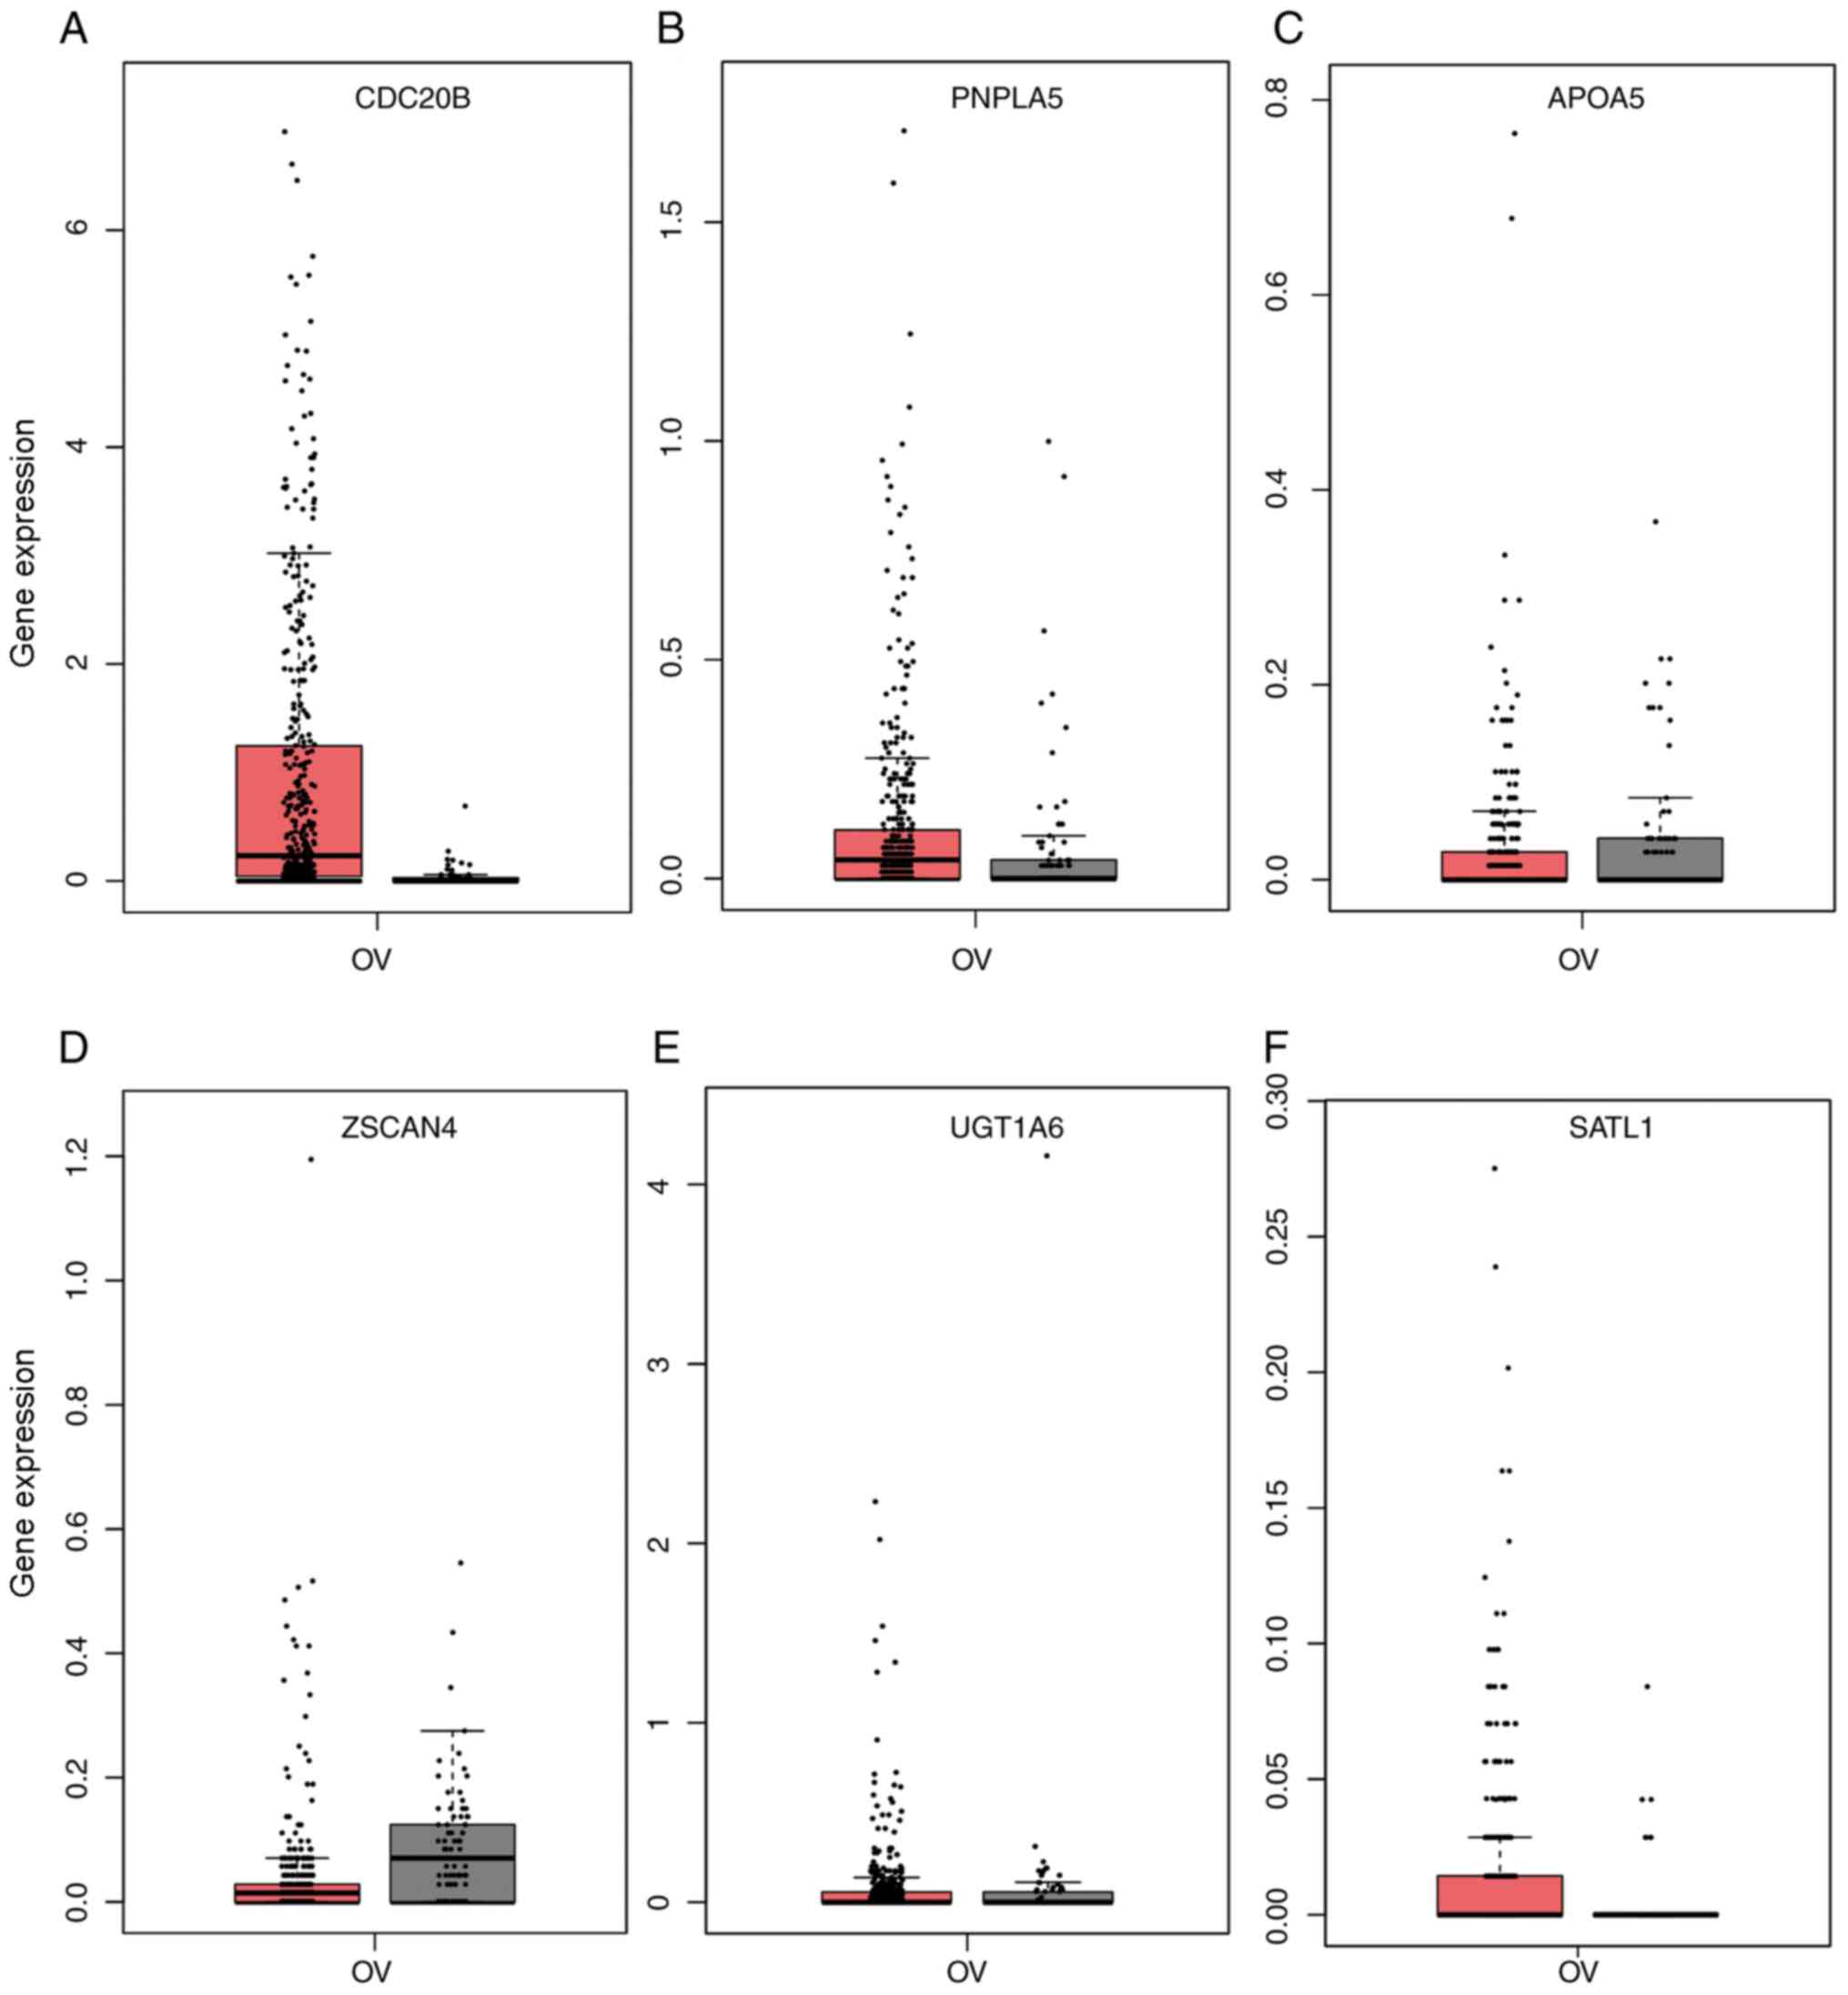 | Figure 8.Expression of the (A) CDC20B,
(B) PNPLA5, (C) APOA5, (D) ZSCAN4, (E)
UGT1A6, and (F) SATL1 genes in the TCGA OV database.
Red represents ovarian tumor tissue (n=426) and grey represents
normal ovary tissue (n=88). TCGA, The Cancer Genome Atlas; APOA5,
apolipoprotein A5; CDC20B, cell division cycle 20B; OV, ovarian
carcinoma; PNPLA5, patatin like phospholipase domain containing 5;
SATL1, spermidine/spermine N1-acetyl transferase like 1; UGT1A6,
UDP glucuronosyltransferase family 1 member A6; ZSCAN4, zinc finger
and SCAN domain containing 4. Red, Number (T)=426; Gray,
Number(N)=88. |
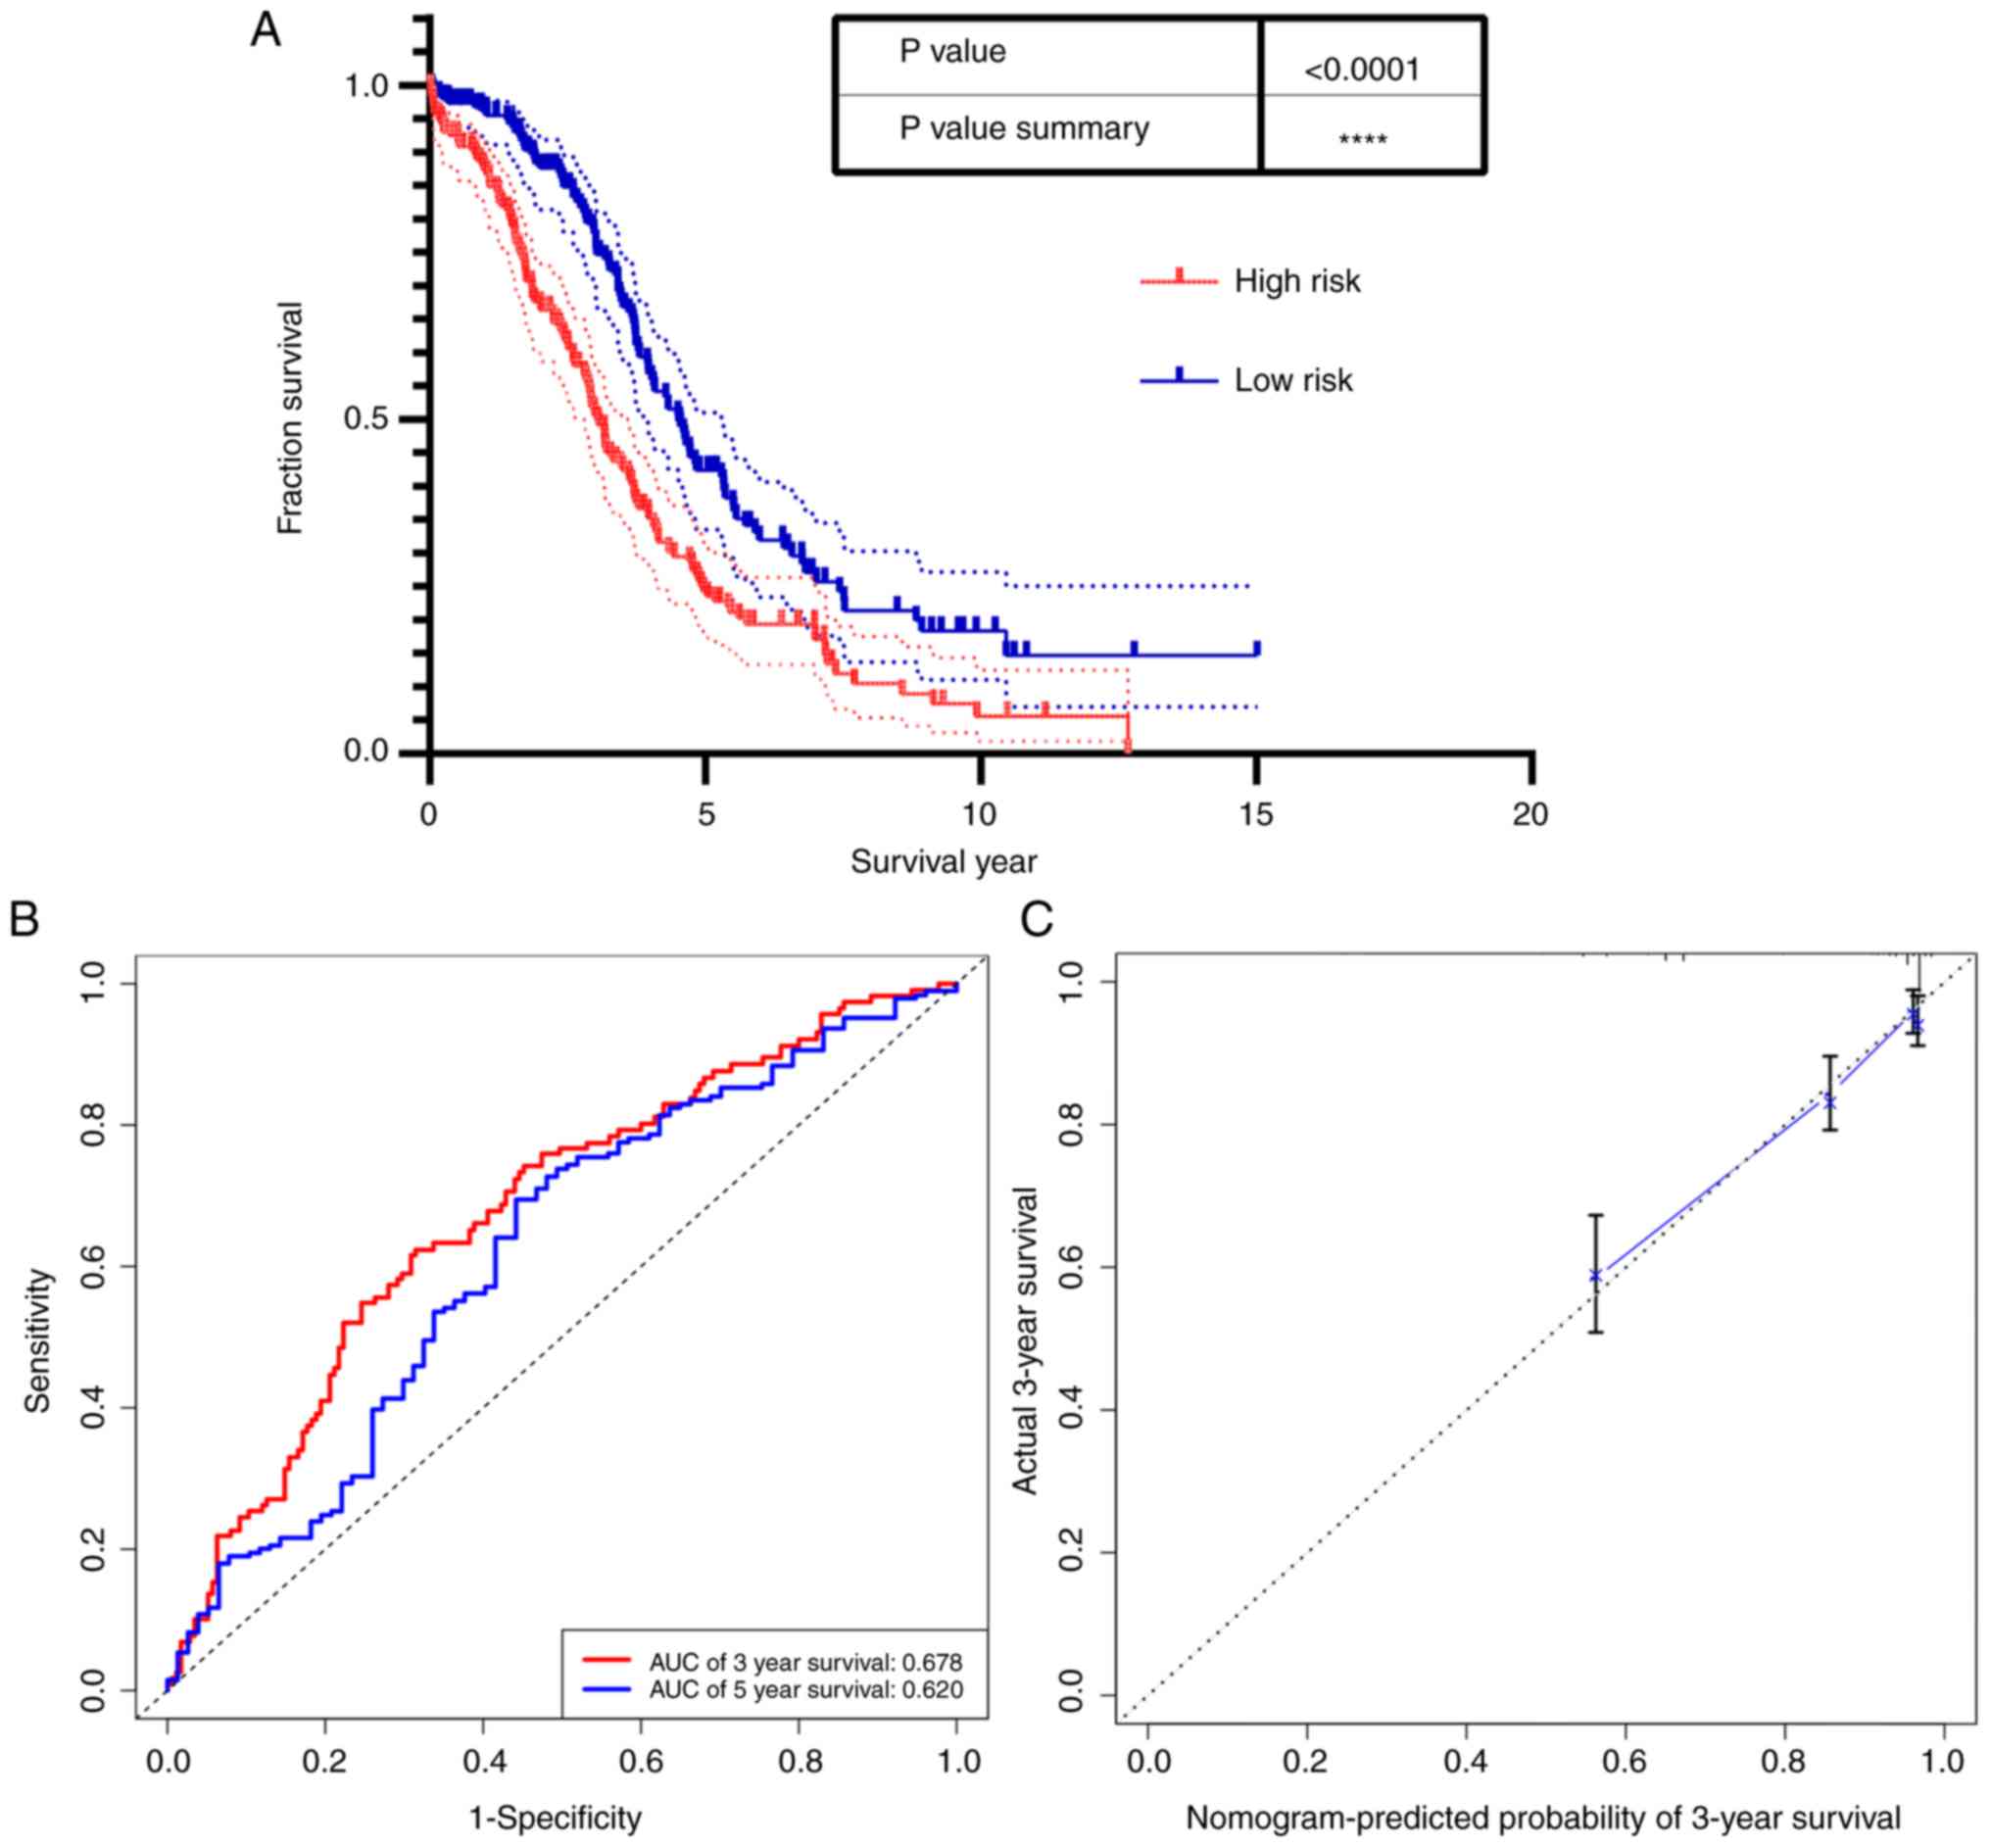
Prognosis analysis with CDC20B and
PNPLA5
Risk score was calculated based on CDC20B,
PNPLA5 and age, and results showed that patients with high risk
score had a worse long-term survival rate (Fig. 9A). Time-dependent ROC and calibration
curves were created to determine the prognostic values of the
predictive model based on the two genes combined with age (Fig. 9B and C). The areas under the curve
(AUCs) for 3- and 5-year overall survival predictions for the risk
scores were 0.678, and 0.620, respectively.
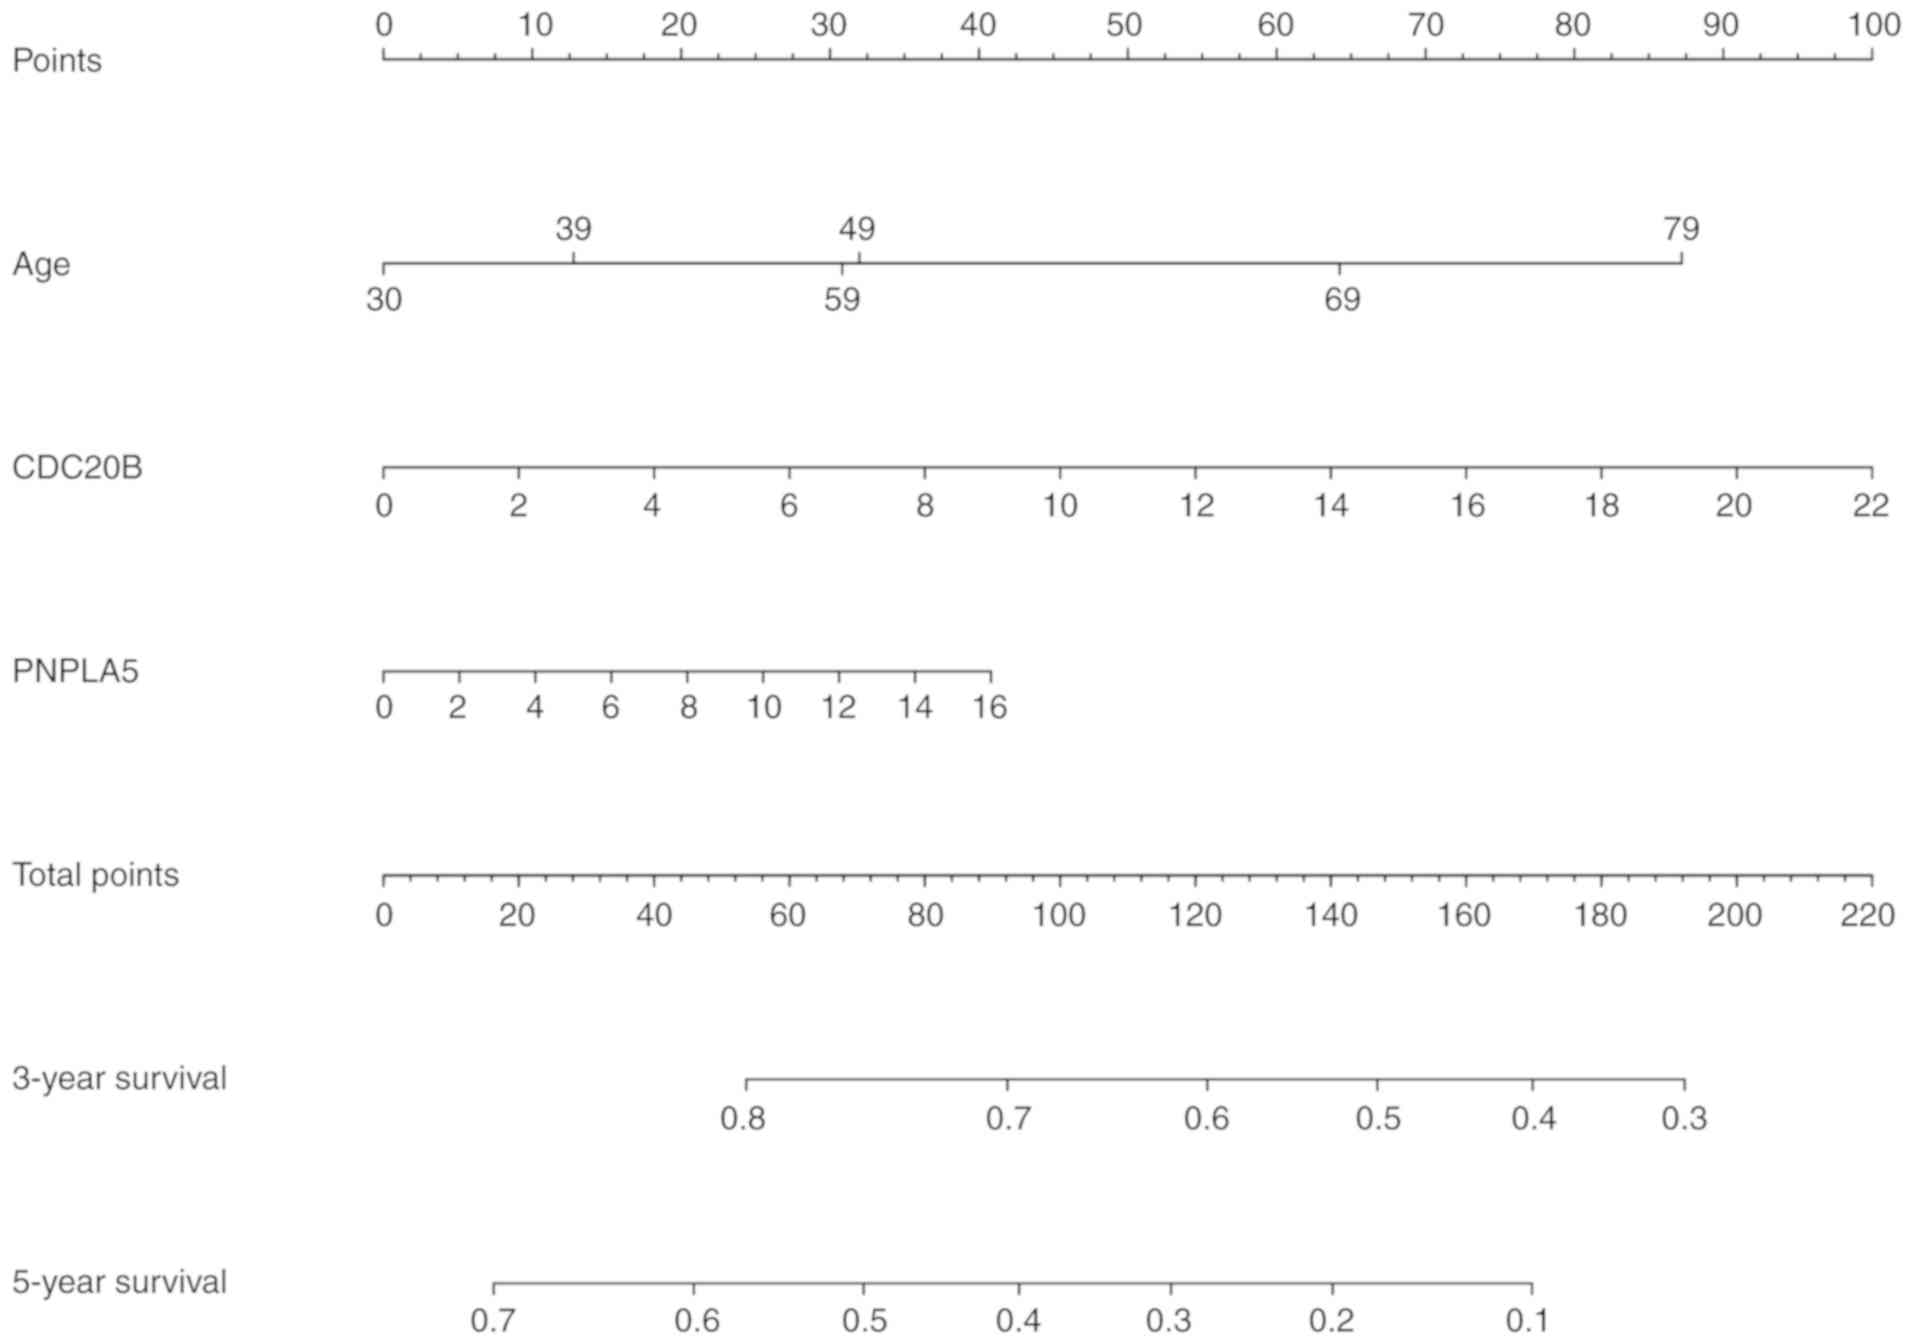
Building a predictive nomogram
model
All of the parameters, including CDC20B,
PNPLA5, age and the AUCs of the risk scores from the prognosis
analysis were used to build a prognostic predictive nomogram
evaluating 3- and 5-year overall survival, based on the stepwise
Cox's regression model (Fig. 10).
We displayed the two genes into different points according to their
own expression levels, and each point corresponds to a score.
Subsequently, we performed the same way to deal with the age. Three
scores were obtained and were added to get the total score. The
total score was used to determine the 3- and 5-year overall
survival rates.
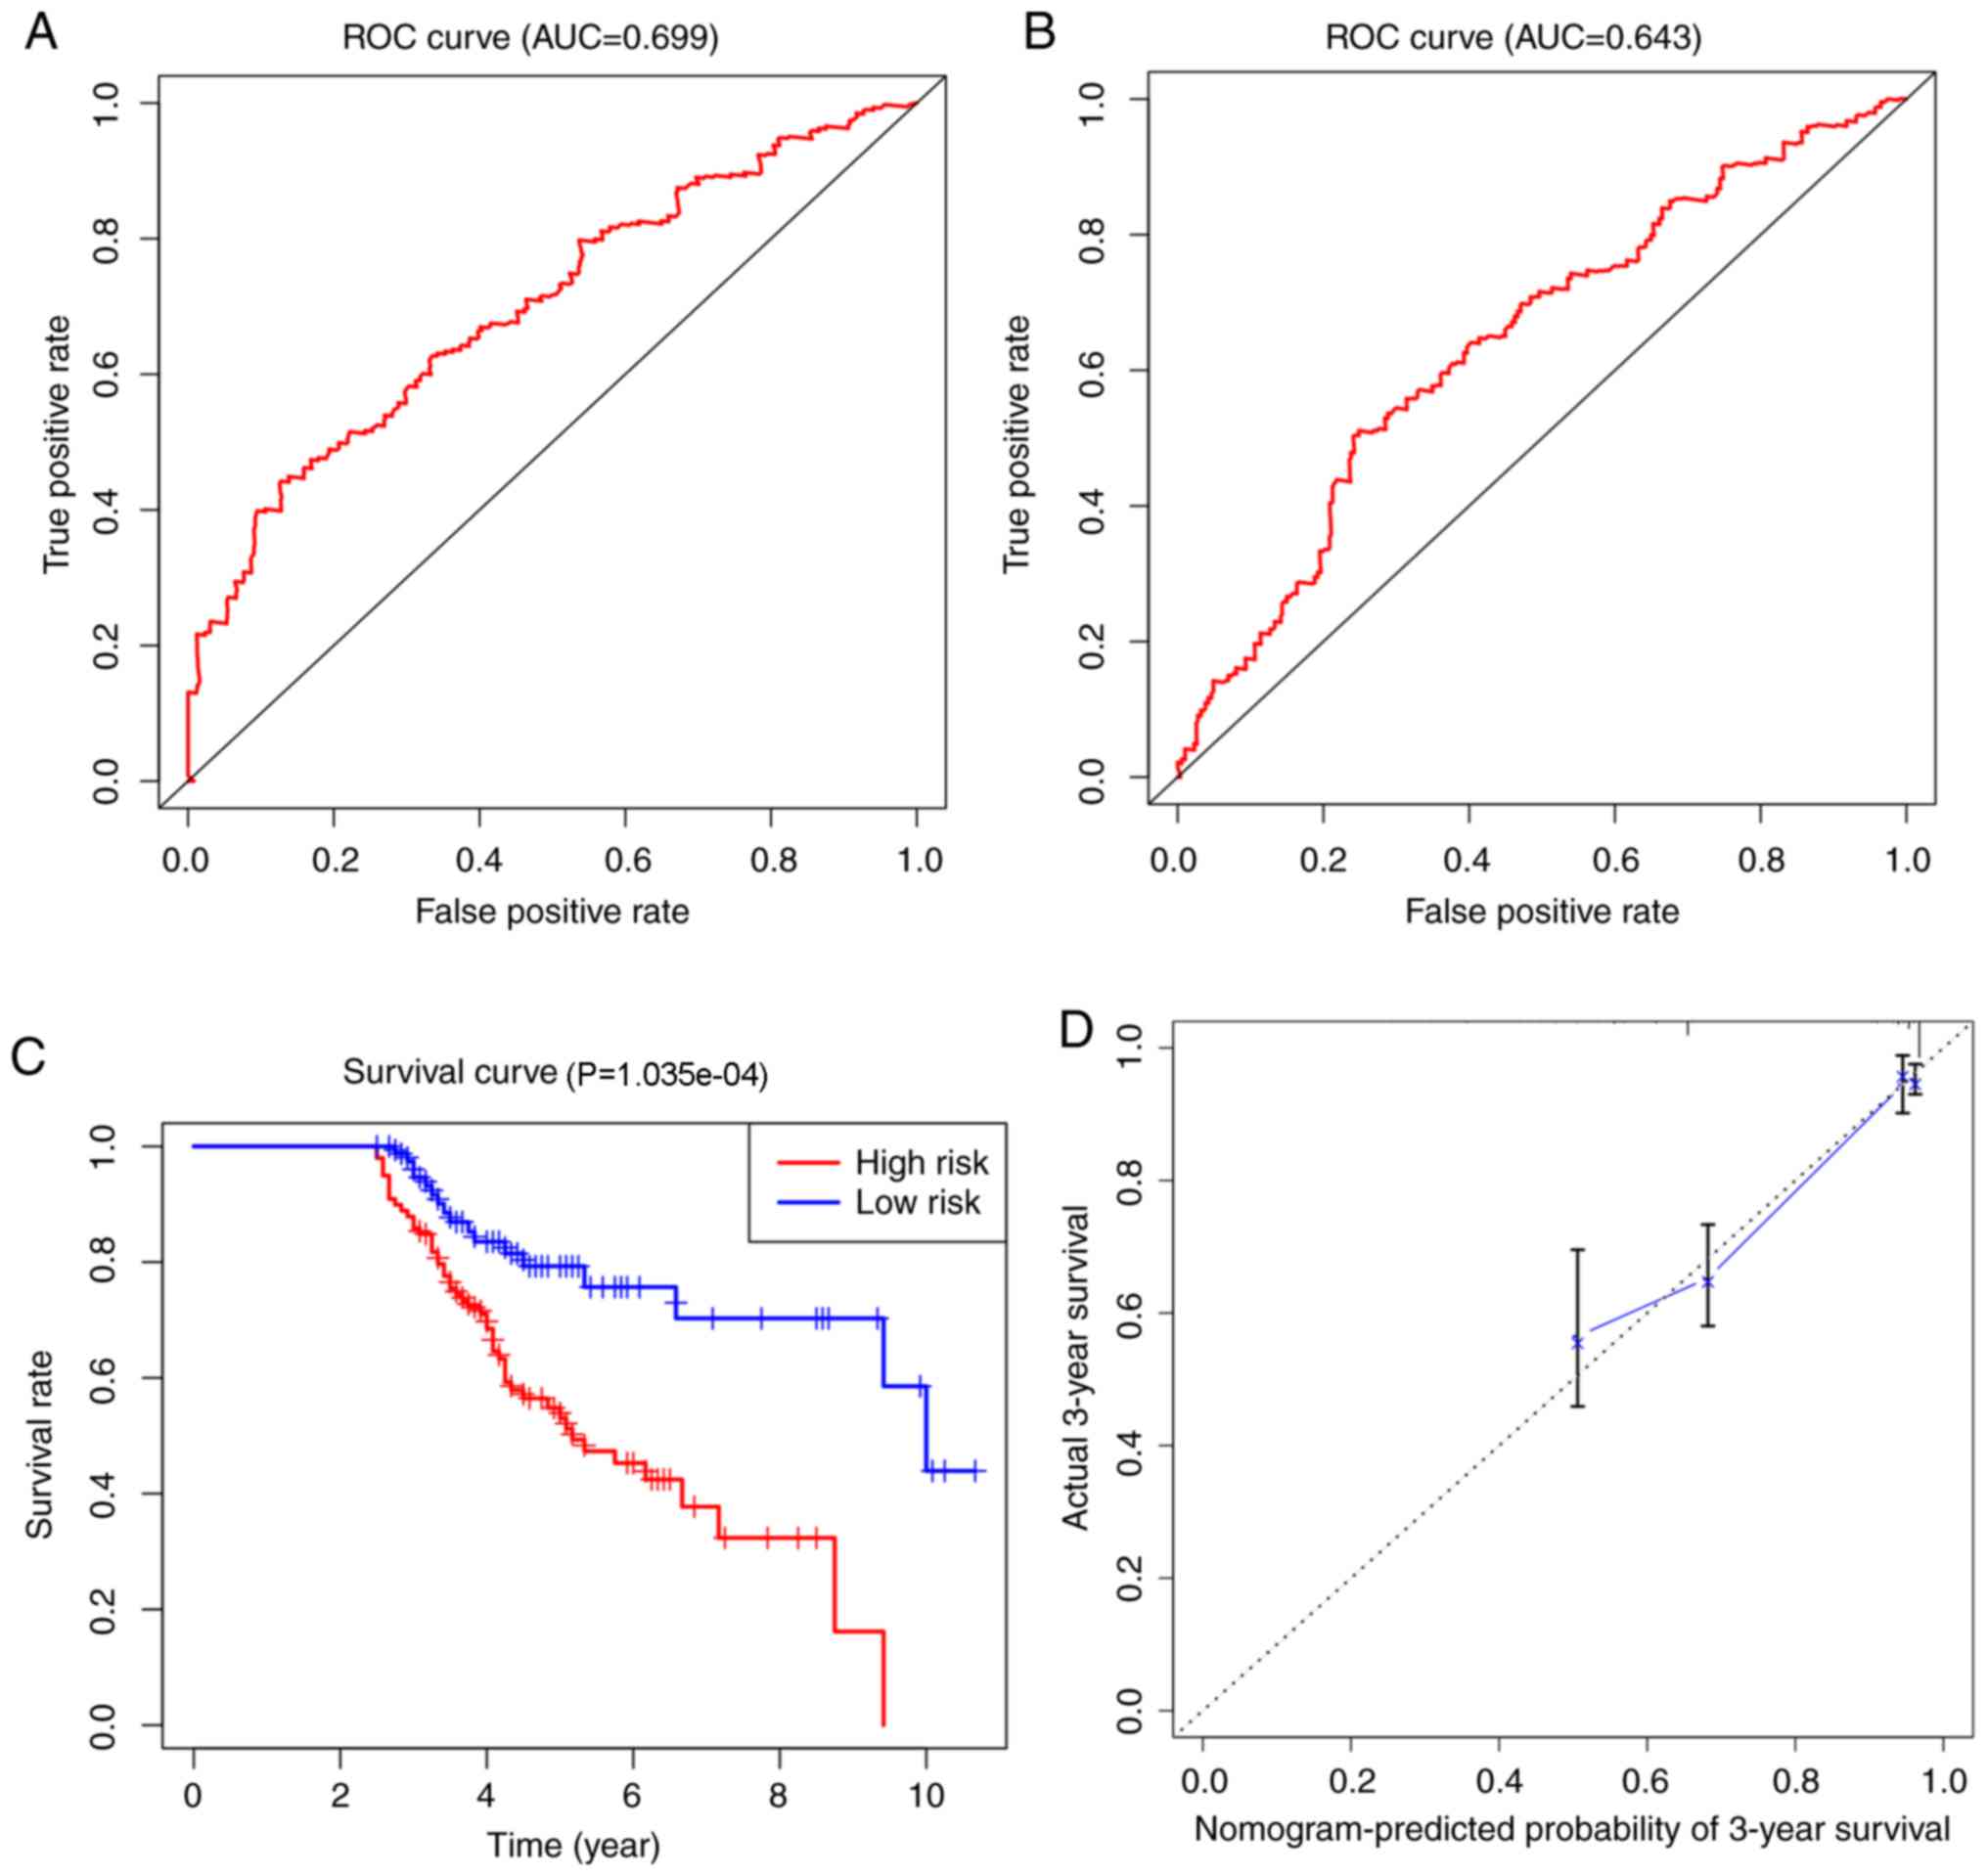
External validation of the predictive
nomogram model
To validate the generated prognostic nomogram, the
GSE32062 dataset downloaded from GEO was utilized as an external
sample. The AUCs of the 3- and 5-year overall survival predictions
for the nomogram using the GSE32062 dataset were 0.699 and 0.643,
respectively (Fig. 11A and B). A
survival curve was also calculated with these data (Fig. 11C), which showed that a high-risk
score was associated with worse long-term prognosis, whereas a low
risk score was associated with better long-term prognosis. The
calibration curve further showed that the originated nomogram was a
very effective predictive model (Fig.
11D).
Discussion
OV is a gynecologic tumor with high mortality rates,
and as aforementioned, the prognosis for OV remains poor, with only
a 47% overall 5-year survival rate (4). In general, the prognosis of patients
with OV is closely associated with the stage at diagnosis. The
5-year survival rate is >70% for stage I and II, but decreases
to 40 and 20% for stage III and IV, respectively (22). FIGO staging is currently the most
valid tool for the prognostic prediction of OV (23), and all of the guidelines for OV
diagnosis and treatment still rely on the postoperative pathology
analysis for accurate staging (24).
Therefore, researchers are looking for molecular biomarkers of OV
to identify OV in earlier stages and thus begin treatment promptly.
Some biomarkers might also work as prognostic predictors allowing
clinicians to use them to give better treatment suggestions to
patients and provide more individualized treatment plans, including
more precise surgery, chemotherapy, radiotherapy, targeted
molecular therapy and immunotherapy (25).
These molecular biomarkers can not only be used as a
beneficial supplement to FIGO staging but can also be used to
predict the progression of OV and can serve as new therapeutic
targets. Molecular prognostic markers might also have potential
value in the early detection of OV (25). Prognostic evaluation models based on
molecular biomarkers could guide individualized treatment and
improve the therapeutic effectiveness of different treatments, and
this was the impetus during the current bioinformatics analysis
involving scrutinizing and integrating a large amount of genetic
and clinical data on OV from the TCGA database.
In the present study, the stromal score, immune
infiltration score and tumor purity scores of the TCGA OV dataset
were calculated using the ESTIMATE algorithm. Immune cells have
been shown to be significantly reduced in high purity tumor sample
tissues (14). This negative
association between immune score and tumor purity was also
validated in the present study, and analysis of the TCGA OV data
showed that low tumor purity, a high immune score, is associated
with better survival.
A total of 379 DEGs were identified in relation to
the immune score of the TCGA OV datasets, and functional enrichment
analysis showed that these DEGs were associated with the
occurrence, proliferation and metastasis of OV. From the GO
cellular components result, the most common function of these DEGs
is as components of membrane, such as plasma membrane and
postsynaptic membrane. As biological activities and information
transferring rely on changes on the cell or organelle membranes
(26), these results indicate that
these genes might be associated with intercellular information
trafficking or to various biological activities. Exosomes, which
are important for information transfer inter or inner cell,
contribute to tumor progression and metastasis by mediating
epithelial-to-mesenchymal transition, migration, invasion,
angiogenesis and immune modulation as well as metabolic, epigenetic
and stromal reprogramming into a cancer-associated phenotype
(27). Exosomes are also associated
with the development of OV (28). In
addition, from both the GO biological processes and GO molecular
functions results, the DEGs identified here are involved in
biological processes related to cell proliferation and
differentiation, GPCR signaling pathways and neurogenesis. These
findings are consistent with previous research about the role of
endocrine GPCRs in OV (29–31). GPCRs have been shown to be involved
in many aspects of tumorigenesis in OV, including the promotion of
aberrant growth, increased cell viability, angiogenesis and
metastasis (32). In OV development
the role of GPCRs is primarily through the regulation of metastasis
and proliferation (21). According
to the KEGG analysis result, the most significant biological
processes for the identified DEGs is neuroactive ligand-receptor
interactions. A previous study has shown that significant changes
in the expression levels of estrogen and progesterone receptors
might play one of the most important roles during the development
of OV (33).
By carrying out both univariate/multivariate Cox's
regression analysis and lasso-penalized Cox's regression, six genes
were identified to be related to the prognosis of patients with OV,
namely APOA5, CDC20B, PNPLA5, SATL1, UGT1A6 and
ZSCAN4. The expression levels of these six genes in OV
tissue were compared with normal ovarian tissue using the TCGA OV
dataset, which showed that the expression of CDC20B and
PNPLA5 in OV tissues was significantly greater than that of
normal tissues. Moreover, KM curves, risk score and calibration
curves showed the significant predictive ability of these two
genes. Thus, a two-gene prognostic marker (CDC20B and
PNPLA5) was established to predict the overall survival rate
of OV, and this was verified using the external GSE32062
dataset.
These two gene biomarkers were used to calculate the
survival probability of individual patients with OV and the risk
factors were validated in the whole patient set that could be
useful for predicting the prognosis of patients with OV. The
validation results showed that the low-risk group had a better
survival rate. The AUCs of the ROC curves of the whole OV cohort
were 0.678 and 0.620 for 3- and 5-year overall survival,
respectively. Taken together, these results showed that these two
genes had a strong ability to predict the prognosis of ovarian
cancer.
The survival analysis of CDC20B and
PNPLA5 were performed individually, and the results of these
analysis suggested that high levels of expression of both genes on
their own were significantly associated with poor prognosis in
patients with OV. The effects of CDC20B and PNPLA5
expression in the prognosis of ovarian cancer has not yet been
described in the literature. CDC20B belong to the cell
division cycle 20 (CDC20) family of regulatory proteins that
interact with several other proteins at multiple points in the cell
cycle and CDC20B is required for nuclear movement prior to
anaphase and for chromosome separation (34). It has been reported that aberrant
expression of CDC20 is associated with malignant progression
and poor prognosis in various types of cancer and it has been shown
that CDC20 knockdown inhibits the migration of the
chemoresistant PANC-1 pancreatic cancer cells and the metastatic
MDA-MB-231 breast cancer cell line (35). Thus, it was suggested that the
development of specific CDC20 inhibitors might be a novel
strategy for the treatment of cancer with elevated expression of
CDC20 (35).
PNPLA5 is a member of the patatin-like
phospholipase family, and the protein it encodes has been shown to
inhibit transacylation (36). In
addition, PNPLA5 has been related to the initiation of autophagy
(37). Autophagy is a cellular
clearance system that removes unnecessary or dysfunctional
components (38), and this process
requires neutral lipids that are stored in lipidic droplets
(37). During autophagy, neutral
lipid storage is mobilized to support the formation of autophagy
membranes (37). Autophagy is
related to malignant transformation, and it affects tumor
progression and therapeutic responses in malignant cells (39). Targeting autophagy has been seen as a
promising anti-tumor therapy (39,40). The
results of the present study confirm that the expression of
PNPLA5, which is required for autophagy, is related to the
prognosis of ovarian cancer, suggesting that PNPLA5 might be
both, a predictive biomarker and a reliable target for ovarian
cancer treatment.
Taken together, the current results suggest that
CDC20B and PNPLA have considerable potential for
predicting the prognosis of patients with OV. Therefore, collected
data was utilized to construct a nomogram predictive model. Several
nomograms have been constructed for predicting outcomes in patients
with OV, which possess superior predictive ability comparing with
the widely utilized FIGO staging system. In 2012, Barlin et
al (41) identified a number of
parameters, including age, stage, debulking, ASA and HBOC, for
predicting disease-specific survival after surgery based on the
outcomes of 478 patients with OV. In 2013, Lee et al
(42) evaluated other parameters,
including largest residual tumor size, number of organ sites of
metastasis, status, CA125 and haemoglobin, for predicting long-term
survival in patients who were initially responsive to a
platinum-based regimen but subsequently suffered recurrence. A more
recent study analyzed prognosis based on the log of the odds
between the number of metastatic lymph nodes and the number of
non-metastatic lymph nodes in OV (43,44).
Compared to these previous nomograms, the present proposed model
used simpler factors to predict the 3- and 5-year survival rate of
individual patients since the expression level of these two genes
could be checked just by blood tests, making this a more suitable
model for clinical applications. In addition, the CDC20B and
PNPLA5 genes used to establish the nomogram were identified
based on immune scores, suggesting that these two genes might be
potential biomarkers for targeted immunotherapy against OV.
Improving the accuracy of survival estimates is
extremely important for clinical decisions regarding the treatment
and follow-up of OV. The generated nomogram model presented two
advantages: i) As the 3- and 5-year survival rate of individual
patients with OV could be calculated through the nomogram,
gynecologists might be able to devise more reasonable follow-up
schedules for different patients; and ii) the nomogram is based on
the immune score, thus the two genes used might not only be
biomarkers for predicting prognosis, but might also be potential
immunotherapy targets.
Although the nomogram had potentially strong
prediction capabilities, there were still a number of limitations
to the present study. Firstly, the study was based on retrospective
data and thus, there was inevitably some inherent bias relative to
the selection of patients. Secondly, well-known prognostic factors
such as chemotherapy data and tumor markers, such as cancer antigen
125 and human epididymis protein 4, were not included in the
nomogram, since the data for these paraments were incomplete. In
summary, the present study demonstrated that CDC20B and
PNPLA5 are independently associated with the prognosis of
patients with OV. In addition, a nomogram model based on the
expression levels of CDC20B and PNPLA5 to predict 3-
and 5-year survival among patients with OV was established and
validated, which can further contribute to individualized clinical
decisions regarding the treatment of OV.
In conclusion, the present study combined TCGA data
with the ESTIMATE algorithm to study the correlation between genes
and the prognosis of patients with OV. By step-by-step statistical
verification, two genes were identified to be associated with the
prognosis of OV. In addition, these two genes were used in
combination with the age of the patients to establish a prediction
model to better evaluate the prognosis of patients with OV.
However, the present study has clear limitations, such as the lack
of prognostic factors and tumor markers, future research should
focus on the design of trials able to further explore the
prognostic value of CDC20B, PNPLA5 and age in combination
with other prognostic factors and tumor markers.
Supplementary Material
Supporting Data
Acknowledgements
Not applicable.
Funding
No funding was received.
Availability of data and materials
The datasets used and/or analyzed during the current
study are available from the corresponding author on reasonable
request.
Authors' contributions
HL, JW, XW and HM made substantial contributions to
conception and design of this study. JW curated the data. HL and XW
performed the formal analyses. QW and SH carried out the
investigation. ZM and LL developed the methodology. XL, YH, SL and
HP performed the software analyses. HL drafted the manuscript. HL,
JW and HM revised it critically for important intellectual content.
HM gave final approval of the version to be published. All authors
read and approved the final manuscript.
Ethics approval and consent to
participate
Not applicable.
Patient consent for publication
Not applicable.
Competing interests
The authors declare that they have no competing
interests.
References
|
1
|
Morice P, Leary A and Gouy S: Mucinous
ovarian carcinoma. Reply. N Engl J Med. 381:e32019. View Article : Google Scholar : PubMed/NCBI
|
|
2
|
Torre LA, Trabert B, DeSantis CE, Miller
KD, Samimi G, Runowicz CD, Gaudet MM, Jemal A and Siegel RL:
Ovarian cancer statistics, 2018. CA Cancer J Clin. 68:284–296.
2018. View Article : Google Scholar : PubMed/NCBI
|
|
3
|
Cortez AJ, Tudrej P, Kujawa KA and
Lisowska KM: Advances in ovarian cancer therapy. Cancer Chemother
Pharmacol. 81:17–38. 2018. View Article : Google Scholar : PubMed/NCBI
|
|
4
|
Cancer Facts Figures 2018, . American
Cancer Society; Atlanta, GA: 2018
|
|
5
|
Mallen AR, Townsend MK and Tworoger SS:
Risk factors for ovarian carcinoma. Hematol Oncol Clin North Am.
32:891–902. 2018. View Article : Google Scholar : PubMed/NCBI
|
|
6
|
Wei W, Li N, Sun Y, Li B, Xu L and Wu L:
Clinical outcome and prognostic factors of patients with
early-stage epithelial ovarian cancer. Oncotarget. 8:23862–23870.
2017. View Article : Google Scholar : PubMed/NCBI
|
|
7
|
Gulec UK, Gumurdulu D, Guzel AB, Paydas S,
Seydaoglu G, Acikalin A, Khatib G, Zeren H, Vardar MA and Altintas
A: Prognostic importance of survivin, Ki-67, and topoisomerase IIα
in ovarian carcinoma. Arch Gynecol Obstet. 289:393–398. 2014.
View Article : Google Scholar : PubMed/NCBI
|
|
8
|
Szajnik M, Czystowska-Kuźmicz M, Elishaev
E and Whiteside TL: Biological markers of prognosis, response to
therapy and outcome in ovarian carcinoma. Expert Rev Mol Diagn.
16:811–826. 2016. View Article : Google Scholar : PubMed/NCBI
|
|
9
|
Wade K, Brady MF, Thai T, Wang Y, Zheng B,
Salani R, Tewari KS, Gray HJ, Bakkum-Gamez JN, Burger RA, et al:
Measurements of adiposity as prognostic biomarkers for survival
with anti-angiogenic treatment in epithelial ovarian cancer: An NRG
oncology/gynecologic oncology group ancillary data analysis of GOG
218. Gynecol Oncol. 155:69–74. 2019. View Article : Google Scholar : PubMed/NCBI
|
|
10
|
Chen Z, Meng Z, Jia L and Cui R: The tumor
microenvironment and cancer. Biomed Res Int. 2014:5739472014.
View Article : Google Scholar : PubMed/NCBI
|
|
11
|
Feig C, Gopinathan A, Neesse A, Chan DS,
Cook N and Tuveson DA: The pancreas cancer microenvironment. Clin
Cancer Res. 18:4266–4276. 2012. View Article : Google Scholar : PubMed/NCBI
|
|
12
|
Casey SC, Amedei A, Aquilano K, Azmi AS,
Benencia F, Bhakta D, Bilsland AE, Boosani CS, Chen S, Ciriolo MR,
et al: Cancer prevention and therapy through the modulation of the
tumor microenvironment. Semin Cancer Biol. 35 (Suppl):S199–S223.
2015. View Article : Google Scholar : PubMed/NCBI
|
|
13
|
Pearce O, Delaine-Smith RM, Maniati E,
Nichols S, Wang J, Böhm S, Rajeeve V, Ullah D, Chakravarty P, Jones
RR, et al: Deconstruction of a metastatic tumor microenvironment
reveals a common matrix response in human cancers. Cancer Discov.
8:304–319. 2018. View Article : Google Scholar : PubMed/NCBI
|
|
14
|
Yoshihara K, Shahmoradgoli M, Martínez E,
Vegesna R, Kim H, Torres-Garcia W, Treviño V, Shen H, Laird PW,
Levine DA, et al: Inferring tumour purity and stromal and immune
cell admixture from expression data. Nat Commun. 4:26122013.
View Article : Google Scholar : PubMed/NCBI
|
|
15
|
Jia D, Li S, Li D, Xue H, Yang D and Liu
Y: Mining TCGA database for genes of prognostic value in
glioblastoma microenvironment. Aging (Albany NY). 10:592–605. 2018.
View Article : Google Scholar : PubMed/NCBI
|
|
16
|
Huang DW, Sherman BT and Lempicki RA:
Systematic and integrative analysis of large gene lists using DAVID
bioinformatics resources. Nat Protoc. 4:44–57. 2009. View Article : Google Scholar : PubMed/NCBI
|
|
17
|
Huang DW, Sherman BT and Lempicki RA:
Bioinformatics enrichment tools: Paths toward the comprehensive
functional analysis of large gene lists. Nucleic Acids Res.
37:1–13. 2009. View Article : Google Scholar : PubMed/NCBI
|
|
18
|
Yoshihara K, Tsunoda T, Shigemizu D,
Fujiwara H, Hatae M, Fujiwara H, Masuzaki H, Katabuchi H, Kawakami
Y, Okamoto A, et al: High-risk ovarian cancer based on 126-gene
expression signature is uniquely characterized by downregulation of
antigen presentation pathway. Clin Cancer Res. 18:1374–1385. 2012.
View Article : Google Scholar : PubMed/NCBI
|
|
19
|
Heublein S, Mayr D, Friese K,
Jarrin-Franco MC, Lenhard M, Mayerhofer A and Jeschke U: The
G-protein-coupled estrogen receptor (GPER/GPR30) in ovarian
granulosa cell tumors. Int J Mol Sci. 15:15161–15172. 2014.
View Article : Google Scholar : PubMed/NCBI
|
|
20
|
Dorsam RT and Gutkind JS:
G-protein-coupled receptors and cancer. Nat Rev Cancer. 7:79–94.
2007. View Article : Google Scholar : PubMed/NCBI
|
|
21
|
Zhang Q, Madden NE, Wong A, Chow B and Lee
L: The role of endocrine G protein-coupled receptors in ovarian
cancer progression. Front Endocrinol (Lausanne). 8:662017.
View Article : Google Scholar : PubMed/NCBI
|
|
22
|
Zeppernick F and Meinhold-Heerlein I: The
new FIGO staging system for ovarian, fallopian tube, and primary
peritoneal cancer. Arch Gynecol Obstet. 290:839–842. 2014.
View Article : Google Scholar : PubMed/NCBI
|
|
23
|
Rosendahl M, Hogdall CK and Mosgaard BJ:
Restaging and survival analysis of 4036 ovarian cancer patients
according to the 2013 FIGO classification for ovarian, fallopian
tube, and primary peritoneal cancer. Int J Gynecol Cancer.
26:680–687. 2016. View Article : Google Scholar : PubMed/NCBI
|
|
24
|
Jelovac D and Armstrong DK: Recent
progress in the diagnosis and treatment of ovarian cancer. CA
Cancer J Clin. 61:183–203. 2011. View Article : Google Scholar : PubMed/NCBI
|
|
25
|
Au KK, Josahkian JA, Francis JA, Squire JA
and Koti M: Current state of biomarkers in ovarian cancer
prognosis. Future Oncol. 11:3187–3195. 2015. View Article : Google Scholar : PubMed/NCBI
|
|
26
|
Carlton JG, Jones H and Eggert US:
Membrane and organelle dynamics during cell division. Nat Rev Mol
Cell Biol. 21:151–166. 2020. View Article : Google Scholar : PubMed/NCBI
|
|
27
|
Nakamura K, Sawada K, Kobayashi M,
Miyamoto M, Shimizu A, Yamamoto M, Kinose Y and Kimura T: Role of
the exosome in ovarian cancer progression and its potential as a
therapeutic target. Cancers (Basel). 11:11472019. View Article : Google Scholar
|
|
28
|
Cheng L, Wu S, Zhang K, Qing YA and Xu T:
A comprehensive overview of exosomes in ovarian cancer: Emerging
biomarkers and therapeutic strategies. J Ovarian Res. 10:732017.
View Article : Google Scholar : PubMed/NCBI
|
|
29
|
Predescu DV, Crețoiu SM, Crețoiu D,
Pavelescu LA, Suciu N, Radu BM and Voinea SC: G protein-coupled
receptors (GPCRs)-mediated calcium signaling in ovarian cancer:
Focus on GPCRs activated by neurotransmitters and inflammation-
associated molecules. Int J Mol Sci. 20:55682019. View Article : Google Scholar
|
|
30
|
Albrecht H and Kübler E: Systematic
meta-analysis identifies co-expressed kinases and GPCRs in ovarian
cancer tissues revealing a potential for targeted kinase inhibitor
delivery. Pharmaceutics. 11:4542019. View Article : Google Scholar
|
|
31
|
Nayak AP and Penn RB: The proton-sensing
receptor ovarian cancer G-protein coupled receptor 1 (OGR1) in
airway physiology and disease. Curr Opin Pharmacol. 51:1–10. 2020.
View Article : Google Scholar : PubMed/NCBI
|
|
32
|
Nayak AP, Pera T, Deshpande DA, Michael
JV, Liberato JR, Pan S, Tompkins E, Morelli HP, Yi R, Wang N and
Penn RB: Regulation of ovarian cancer G protein-coupled receptor-1
expression and signaling. Am J Physiol Lung Cell Mol Physiol.
316:L894–L902. 2019. View Article : Google Scholar : PubMed/NCBI
|
|
33
|
Escobar J, Klimowicz AC, Dean M, Chu P,
Nation JG, Nelson GS, Ghatage P, Kalloger SE and Köbel M:
Quantification of ER/PR expression in ovarian low-grade serous
carcinoma. Gynecol Oncol. 128:371–376. 2013. View Article : Google Scholar : PubMed/NCBI
|
|
34
|
Revinski DR, Zaragosi LE, Boutin C,
Ruiz-Garcia S, Deprez M, Thomé V, Rosnet O, Gay AS, Mercey O,
Paquet A, et al: CDC20B is required for deuterosome-mediated
centriole production in multiciliated cells. Nat Commun.
9:46682018. View Article : Google Scholar : PubMed/NCBI
|
|
35
|
Cheng S, Castillo V and Sliva D: CDC20
associated with cancer metastasis and novel mushroomderived CDC20
inhibitors with antimetastatic activity. Int J Oncol. 54:2250–2256.
2019.PubMed/NCBI
|
|
36
|
Kienesberger PC, Oberer M, Lass A and
Zechner R: Mammalian patatin domain containing proteins: A family
with diverse lipolytic activities involved in multiple biological
functions. J Lipid Res. 50 (Suppl):S63–S68. 2009. View Article : Google Scholar : PubMed/NCBI
|
|
37
|
Dupont N, Chauhan S, Arko-Mensah J,
Castillo EF, Masedunskas A, Weigert R, Robenek H, Proikas-Cezanne T
and Deretic V: Neutral lipid stores and lipase PNPLA5 contribute to
autophagosome biogenesis. Curr Biol. 24:609–620. 2014. View Article : Google Scholar : PubMed/NCBI
|
|
38
|
Galluzzi L, Baehrecke EH, Ballabio A, Boya
P, Pedro JMB, Cecconi F, Choi AM, Chu CT, Codogno P, Colombo MI, et
al: Molecular definitions of autophagy and related processes. EMBO
J. 36:1811–1836. 2017. View Article : Google Scholar : PubMed/NCBI
|
|
39
|
Liao CC, Ho MY, Liang SM and Liang CM:
Autophagic degradation of SQSTM1 inhibits ovarian cancer motility
by decreasing DICER1 and AGO2 to induce MIRLET7A-3P. Autophagy.
14:2065–2082. 2018. View Article : Google Scholar : PubMed/NCBI
|
|
40
|
Rybstein MD, Bravo-San PJ, Kroemer G and
Galluzzi L: The autophagic network and cancer. Nat Cell Biol.
20:243–251. 2018. View Article : Google Scholar : PubMed/NCBI
|
|
41
|
Barlin JN, Yu C, Hill EK, Zivanovic O,
Kolev V, Levine DA, Sonoda Y, Abu-Rustum NR, Huh J, Barakat RR, et
al: Nomogram for predicting 5-year disease-specific mortality after
primary surgery for epithelial ovarian cancer. Gynecol Oncol.
125:25–30. 2012. View Article : Google Scholar : PubMed/NCBI
|
|
42
|
Lee CK, Simes RJ, Brown C, Gebski V,
Pfisterer J, Swart AM, Berton-Rigaud D, Plante M, Skeie-Jensen T,
Vergote I, et al: A prognostic nomogram to predict overall survival
in patients with platinum-sensitive recurrent ovarian cancer. Ann
Oncol. 24:937–943. 2013. View Article : Google Scholar : PubMed/NCBI
|
|
43
|
Xu XL, Cheng H, Tang MS, Zhang HL, Wu RY,
Yu Y, Li X, Wang XM, Mai J, Yang CL, et al: A novel nomogram based
on LODDS to predict the prognosis of epithelial ovarian cancer.
Oncotarget. 8:8120–8130. 2017. View Article : Google Scholar : PubMed/NCBI
|
|
44
|
Bogani G, Tagliabue E, Ditto A, Signorelli
M, Martinelli F, Casarin J, Chiappa V, Dondi G, Maggiore ULR,
Scaffa C, et al: Assessing the risk of pelvic and para-aortic nodal
involvement in apparent early-stage ovarian cancer: A predictors-
and nomogram-based analyses. Gynecol Oncol. 147:61–65. 2017.
View Article : Google Scholar : PubMed/NCBI
|