Introduction
Gastrointestinal cancer is a major health problem
with 4.8 million new cases and 3.4 million mortality cases reported
worldwide in 2018 (1). Esophageal
cancer (EC) is an aggressive malignancy originating in the
gastrointestinal tract, with the eighth highest cancer incidence
worldwide, and is the sixth most frequent cause of
cancer-associated mortality between 1995 and 2009 (2). EC is more common in Asia than in other
parts of the world (1), and EC
incidence rate in China ranks first in the world, and is >35.0%
higher than in the rest of the world. EC is categorized into
esophageal squamous cell carcinoma (ESCC) and esophageal
adenocarcinoma (EAC). ESCC is the major type of EC found in China
(3). Currently, the primary
treatment for EC is surgery; however, due to the absence of early
symptoms, most patients are diagnosed with advanced EC, which
results in high mortality rate (3).
The main risk factors for EC are cigarette smoking, tobacco
chewing, alcohol consumption, high body mass index and low fruit
consumption (4). In addition, EC
involves changes in multiple gene expression patterns (5). Therefore, understanding the mechanisms
of initiation of EC and potential prognostic molecular markers are
urgently required to improve the outcomes for patients with EC.
The present study aimed to identify differentially
expressed genes (DEGs) between normal esophageal and EC tissues,
and to subsequently classify these DEGs based on motifs and modules
at a functional level according to Gene Ontology (GO) and Kyoto
Encyclopedia of Genes and Genomes (KEGG) pathway analysis, which
could provide a model suggesting mechanisms of how these DEGs
contribute to EC. A protein-protein interaction (PPI) network was
used to identify hub genes in EC. The present study identified
which hub genes influenced the prognosis of EC, and explored the
association among hub genes with prognostic value and invasive,
metastatic, pathological and histological characteristics of EC.
Finally, biomarkers that may be involved in the occurrence and
development of EC were identified, and provide a basis for further
research.
Materials and methods
Data source
To explore DEGs between EC and normal tissues, gene
expression data were retrieved from the esophagus dataset
(20160128) from The Cancer Genome Atlas (TCGA) database (http://tcga-data.nci.nih.gov; accessed, November 10,
2018). The ‘RTCGAToolbox’ package (version 1.0) in the R software
environment was used to download quantitative gene expression data
and clinical characteristics of patients with EC in the TCGA
database (6). The running time was
‘20160128’ (updated version of esophageal cancer data in TCGA
database when analyzing data). A total of 1,413 datasets of human
ECs were retrieved from the Gene Expression Omnibus (GEO) database
(https://www.ncbi.nlm.nih.gov/geo/).
Following reading and screening, the three gene expression datasets
GSE23400 (7), GSE20347 (8) and GSE5364 (9) were selected for further analysis. Among
these, GSE23400 and GSE5364 were based on the GPL96 platform
[(HG-U133A) Affymetrix Human Genome U133A Array; Affymetrix; Thermo
Fisher Scientific, Inc.], and GSE20347 was based on the Agilent
GPL571 platform [(HG-U133A_2) Affymetrix Human Genome U133A 2.0
Array; Affymetrix; Thermo Fisher Scientific, Inc.].
Processing of DEG expression data
The ‘RTCGAToolbox’ was used to evaluate DEGs between
EC and normal tissue samples using data from the TCGA database
(6), and genes that met the cutoff
criteria [adjusted P-value =0.05; |log fold change (FC)| ≥2.0] were
considered to be significant DEGs.
The GEO2R online analysis tool (https://www.ncbi.nlm.nih.gov/geo/geo2r/)
was used to evaluate DEGs between EC and normal tissue samples in
data from the GEO database. Due to the small sample size, the
parameters used to indicate significant DEGs were adjusted P-value
=0.05 and |log FC| ≥1.0.
Finally, a Venn diagram web tool (http://bioinformatics.psb.ugent.be/webtools/Venn/) was
used to identify the intersection of DEGs between the TCGA and GEO
datasets. The present study first identified the intersection of
the three GEO datasets, and then cross-identified the DEGs common
to the TCGA and GEO datasets. These intersecting genes were
considered to be the DEGs between EC and normal tissue samples.
GO and KEGG pathway analysis of
DEGs
GO (10) and KEGG
(11) pathway enrichment analysis of
DEGs was performed using the Database for Annotation, Visualization
and Integrated Discovery (DAVID; http://david.ncifcrf.gov/) (12). P<0.05 was considered to indicate a
statistically significant difference.
PPI network construction and hub gene
identification
PPI information was analyzed using the STRING
database (http://string-db.org/) (13). PPI pairs were extracted based on the
condition of medium confidence >0.4. The PPI network was then
visualized using Cytoscape software (www.cytoscape.org/; version 22.03.6.1) (14). In the present study, genes with a
connectivity >40 were considered to be hub genes. Plug-in
molecular complex detection (MCODE) was used to screen PPI networks
(15). The maximum depth (value
=100), the degree cutoff (value =10), the node score (value =0.2)
and the k score (value =2) were set as the cutoff criteria.
Survival analysis of expression of hub
genes
To explore the association between hub gene
expression and prognosis of EC, the present study used a
Kaplan-Meier plotter tool (http://kmplot.com/analysis/) to assess the impact of
differential expression of the hub genes on the prognosis of EC
(16). The Kaplan-Meier plotter
database data are mainly derived from GEO (Affymetrix microarray
only), European Genome-phenome Archive (EGA) and TCGA. Overall
survival (OS) and relapse-free survival (RFS) were selected as the
main indicators of prognostic assessment. The mean expression of
all probes of the same gene was calculated as the expression of
each gene. All possible cutoff values between the lower and upper
quartiles were computed and the best performing threshold was used
as the cutoff. The log-rank test was used to analyze OS and RFS. A
log-rank P<0.05 was considered to indicate a statistically
significant difference.
Invasion analysis of prognostic hub
genes
To explore the role of the hub DEGs in EC invasion,
an additional dataset, GSE21293 (17), was evaluated from the GEO database
(https://www.ncbi.nlm.nih.gov/geo/).
This dataset contained gene expression data for invasive and
non-invasive EC cells. Fragments per kilobase million values for
ubiquitin conjugating enzyme E2 C (UBE2C), cyclin dependent kinase
inhibitor 3 (CDKN3), CDC28 protein kinase regulatory subunit 2
(CKS2), kinesin family member 20A (KIF20A) and RAD51 associated
protein 1 (RAD51AP1) genes were log2 transformed and the
resulting heatmap was constructed using HemI software (version 1.0)
(18). Graph design and data anlysis
were performed using GraphPad Prism 5.0 (GraphPad Software, Inc.).
Student's t test was used to analyze difference between two groups.
P<0.05 was considered to indicate a statistically significant
difference.
Pathological staging analysis of
prognostic hub gene expression
To explore the expression levels of hub genes across
different stages of EC, the Gene Expression Profiling Interactive
Analysis tool (http://gepia.cancer-pku.cn/) was used to analyze the
hub gene expression data from the TCGA EC dataset, which contained
clinical staging information (19).
Histological subtype analysis of
prognostic hub gene expression
To analyze the differential expression of the
prognostic hub genes in different histological subtypes of EC, the
interactive website Ualcan (http://ualcan.path.uab.edu/analysis.html) was used to
analyze the hub gene expression data from the TCGA EC dataset,
which contained histological subtype information (20).
Results
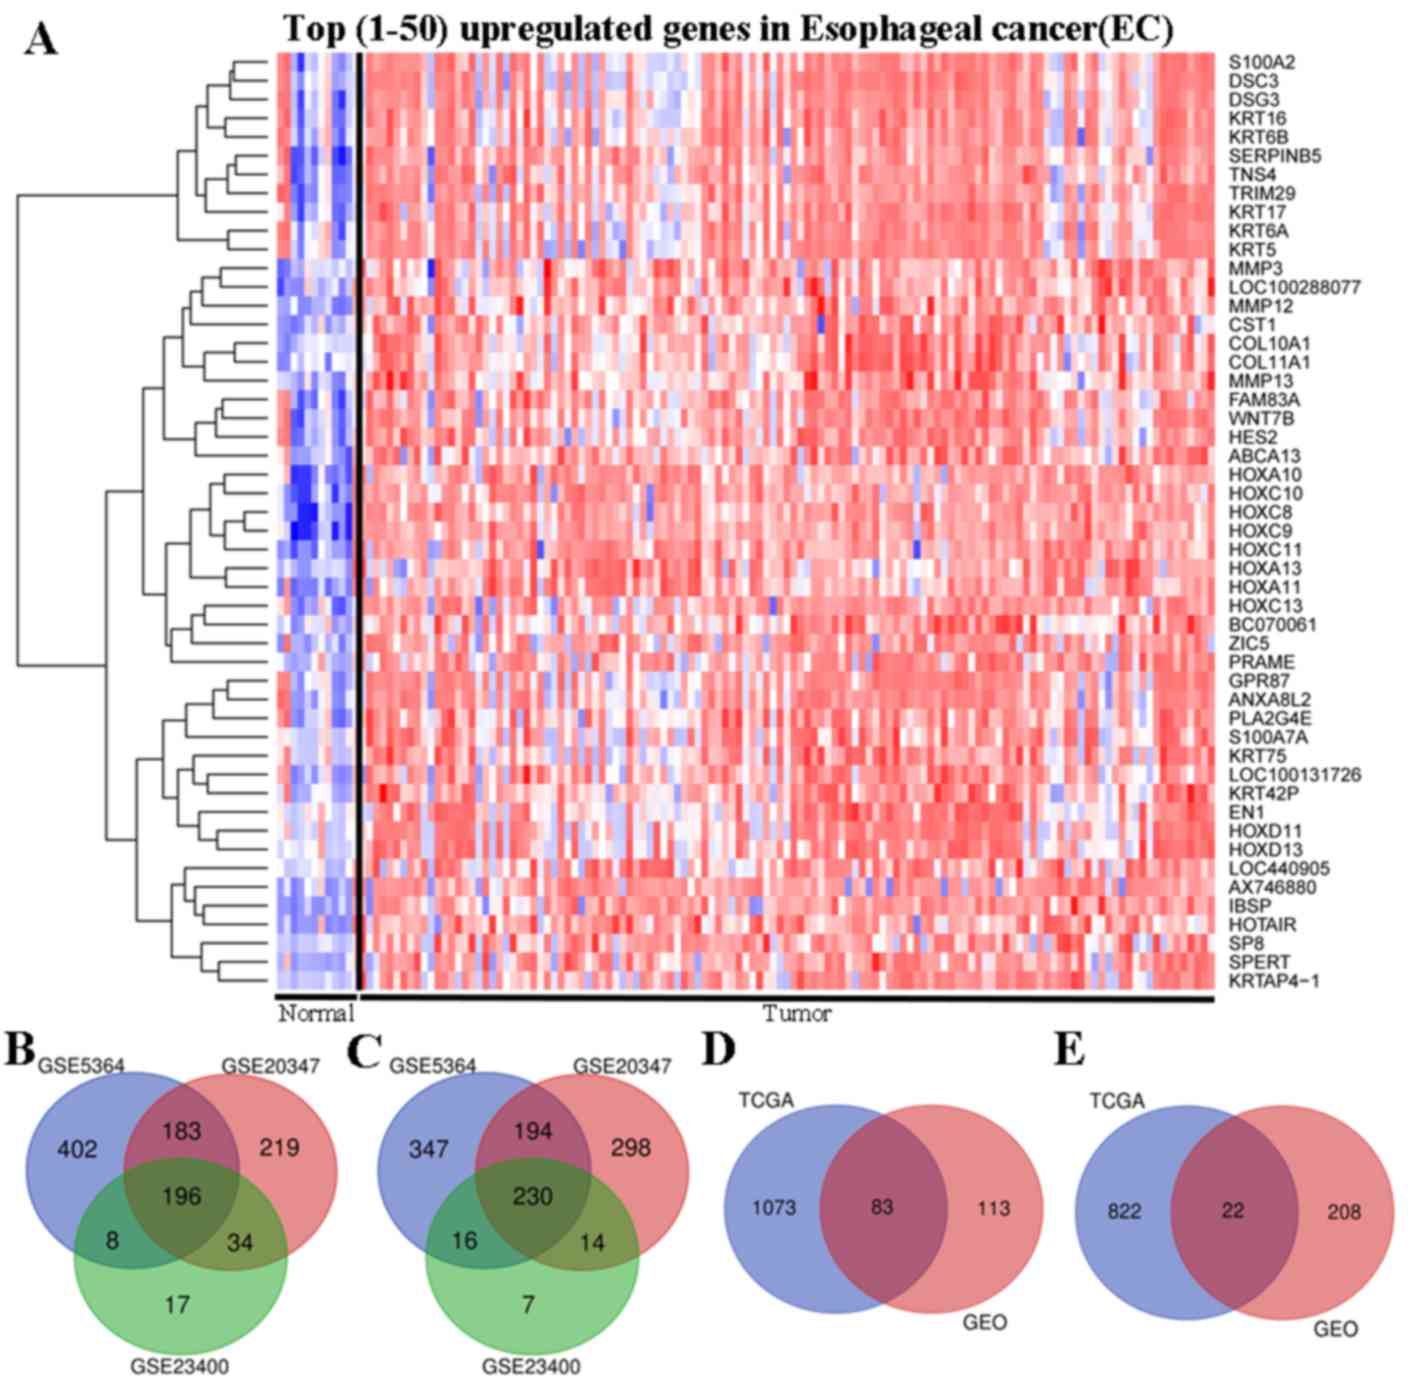
Identification of DEGs
To identify DEGs between EC and normal tissues, the
present study used two public gene expression databases. Initially,
the TCGA database EC data (including 89 EAC samples and 11 normal
esophageal samples) were used to identify DEGs. It was observed
that samples from the same tissue type aggregated into a single
group, and each tissue type exhibited one or more unique
tissue-specific mRNA blocks. The top 50 genes were significantly
upregulated in EC tissues compared with in normal tissues (Fig. 1A).
Subsequently, gene expression in three microarray
datasets [GSE5364 (7), GSE20347
(8) and GSE23400 (9)] from the GEO database was explored.
Among these, GSE5364 contained 16 EC and 13 normal samples,
GSE20347 contained 17 EC and 17 normal samples, and GSE23400
contained 53 EC and 53 normal samples (Table I). Due to the small sample size, the
criteria P<0.05 and |log FC| ≥1 were used to identify DEGs. A
total of 1,576 DEGs were identified from the GSE5364 dataset,
including 789 upregulated and 787 downregulated genes. In the
GSE20347 dataset, 1,368 DEGs were identified; 632 genes were
upregulated and 736 genes were downregulated. In the GSE23400
dataset, 522 DEGs were identified, including 255 upregulated genes
and 267 downregulated genes. To avoid bias from individual studies,
a Venn diagram was constructed to identify genes that were commonly
upregulated and downregulated among the three datasets. The present
study identified 426 DEGs that were significantly differentially
expressed among all three datasets, of which 196 were significantly
upregulated (Fig. 1B) and 230 were
downregulated (Fig. 1C).
 | Table I.Characteristics of the three
microarray datasets retrieved from the Gene Expression Omnibus
database. |
Table I.
Characteristics of the three
microarray datasets retrieved from the Gene Expression Omnibus
database.
|
| EC |
|
|
|---|
|
|
|
|
|
|---|
| Dataset ID | EAC, n | ESCC, n | Total EC, n | Normal, n | Total number,
n |
|---|
| GSE23400 | 0 | 53 | 53 | 53 | 106 |
| GSE20347 | 0 | 17 | 17 | 17 | 34 |
| GSE5364 | Unclear | Unclear | 16 | 13 | 19 |
Based on the significance criteria of P<0.05 and
|log FC| ≥2, a total of 2,000 DEGs were identified, including 1,156
upregulated genes and 844 downregulated genes in TCGA datasets
(Fig. 1D-E). A comprehensive
analysis of the data from TCGA and GEO was performed using Venn
diagram analysis to identify the intersection of all DEGs. The
present study identified 105 genes that were commonly significantly
differentially expressed between EC and normal tissues in the two
databases, of which 83 were significantly upregulated (Fig. 1D) and 22 were downregulated (Fig. 1E).
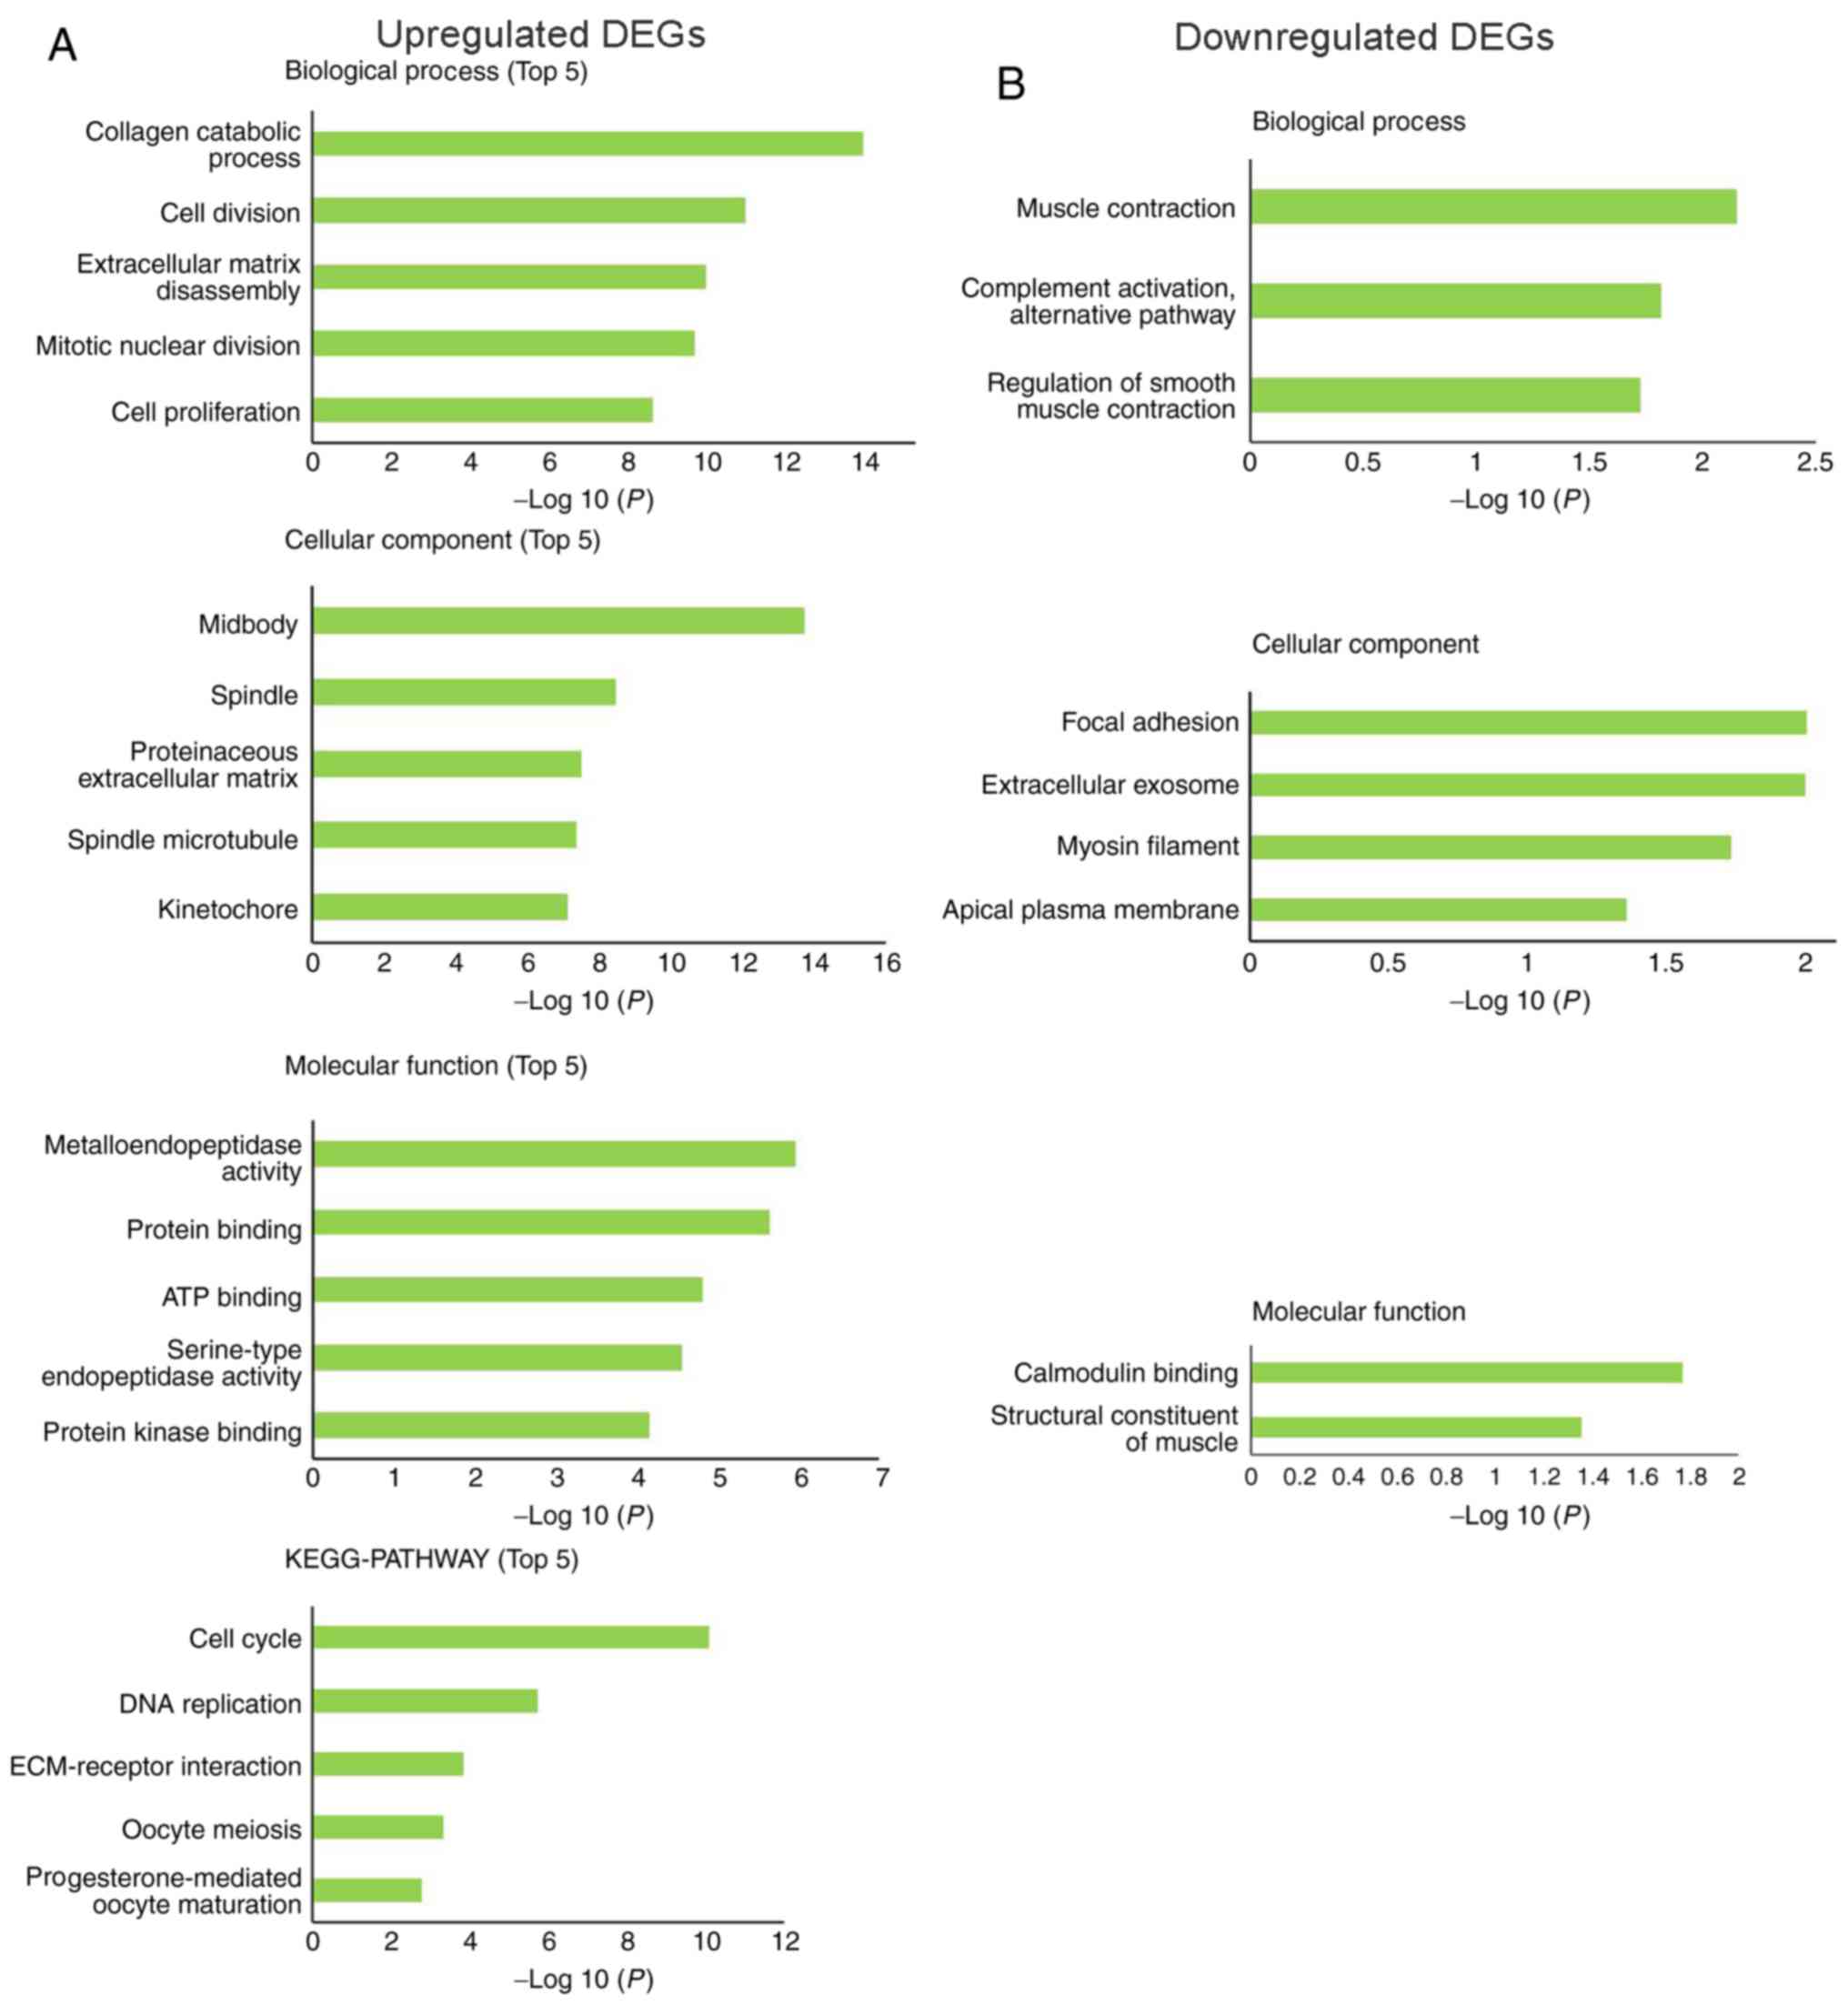
Functional enrichment analysis of
DEGs
To investigate the effects of DEGs on the occurrence
of EC at a functional level, the DAVID web tool was used to perform
GO functional and KEGG pathway enrichment analysis of the DEGs. The
enriched GO terms were divided into cellular components (CCs),
biological processes (BPs) and molecular functions (MFs). The BPs
associated with upregulated DEGs were ‘collagen catabolic process’,
‘cell division’, ‘extracellular matrix disassembly’, ‘mitotic
nuclear division’ and ‘cell proliferation’. For CCs, the
upregulated DEGs were mainly enriched in ‘midbody’, ‘spindle’,
‘proteinaceous extracellular matrix’, ‘spindle microtubule’ and
‘kinetochore’. MF analysis demonstrated that the upregulated DEGs
were mainly enriched in ‘metalloendopeptidase activity’, ‘protein
binding’, ‘ATP binding’, ‘serine-type endopeptidase activity’ and
‘protein kinase binding’. KEGG pathway analysis revealed that the
upregulated DEGs were mainly enriched in ‘cell cycle’, ‘DNA
replication’, ‘ECM-receptor interaction’, ‘oocyte meiosis’ and
‘progesterone-mediated oocyte maturation’ pathways (Fig. 2A).
The downregulated DEGs were mainly enriched in BPs,
including ‘muscle contraction’, ‘complement activation, alternative
pathway’ and ‘regulation of smooth muscle contraction’. The
downregulated DEGs were significantly enriched in the CC terms
‘focal adhesion’, ‘extracellular exosome’, ‘myosin filament’ and
‘apical plasma membrane’. Enrichment analysis of MF terms revealed
that downregulated DEGs were mainly enriched in ‘calmodulin
binding’ and ‘structural constituent of muscle’. There was no
significant KEGG pathway enrichment for the downregulated DEGs
(Fig. 2B).
PPI network construction and hub gene
identification
Cytoscape software was used to predict protein
interactions among DEGs. The PPI network comprised 82 nodes and 982
edges (Fig. 3A). After analyzing the
degree of connectivity in the PPI network, genes with a
connectivity degree >40 were considered to be hub genes. There
were 36 hub genes, and all of them were upregulated genes in EC
(Table II).
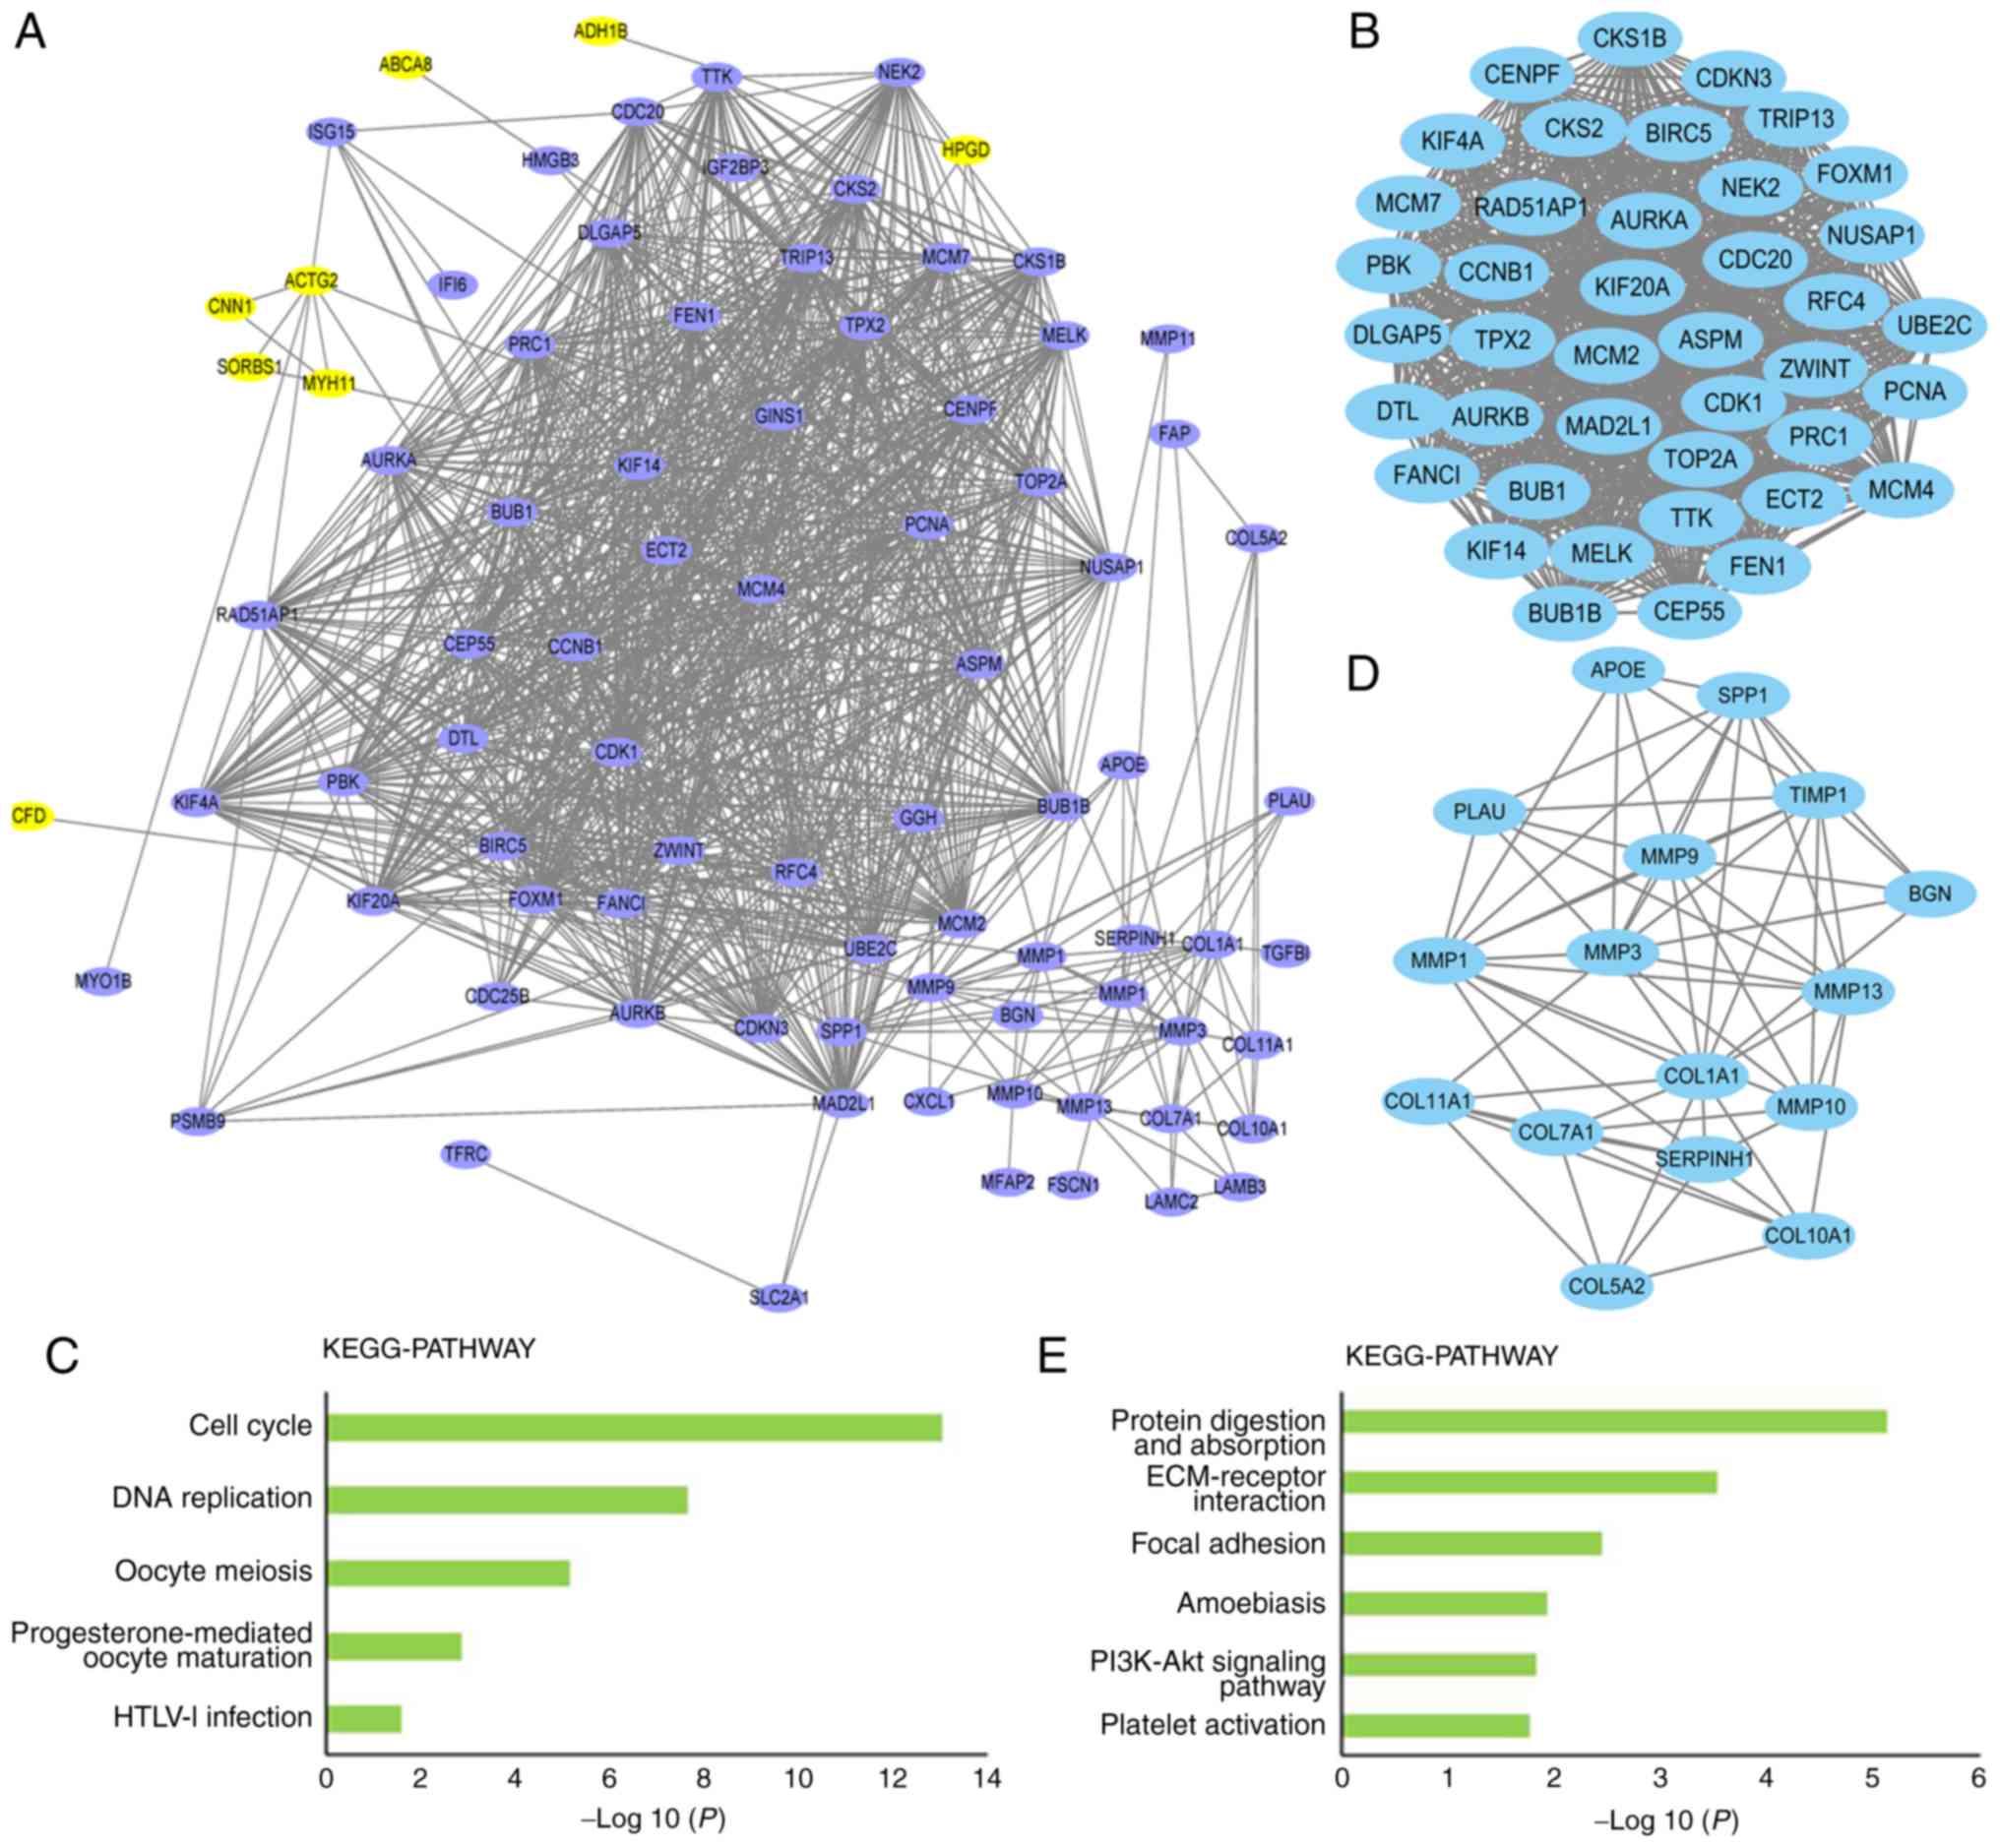 | Figure 3.Protein-protein interaction network.
(A) Protein-protein interaction network was constructed using DEGs.
Purple nodes represent upregulated DEGs and yellow nodes represent
downregulated DEGs. (B and C) Top two clusters of highly
interconnected lysine-succinylated protein networks. Interaction
network of protein-protein interaction network were analyzed using
the MCODE plug-in toolkit in the Cytoscape software (version
3.0.1). (B) Module 1. MCODE score, 40.7; nodes, 41; edges, 814. (C)
Significantly enriched KEGG pathways of module 1 DEGs. (D) Module
2. MCODE score, 8.4; nodes, 16; edges, 63. (E) Significantly
enriched KEGG pathways of module 2 DEGs. DEG, differentially
expressed gene; ECM, extracellular matrix; HTLV–I, human
T-lymphotropic virus 1; KEGG, Kyoto Encyclopedia of Genes and
Genomes; MCODE, molecular complex detection. |
| Table II.Hub genes with higher degree of
connectivity. |
Table II.
Hub genes with higher degree of
connectivity.
| Gene symbol | Degree |
|---|
| CDK1 | 46 |
| PCNA | 45 |
| BIRC5 | 44 |
| TOP2A | 44 |
| RFC4 | 44 |
| CCNB1 | 44 |
| CDC20 | 43 |
| MAD2L1 | 43 |
| FOXM1 | 43 |
| AURKA | 43 |
| AURKB | 42 |
| UBE2C | 42 |
| TTK | 42 |
| NEK2 | 42 |
| FEN1 | 42 |
| BUB1B | 42 |
| CDKN3 | 42 |
| MELK | 42 |
| TPX2 | 41 |
| BUB1 | 41 |
| CKS2 | 41 |
| MCM2 | 41 |
| ZWINT | 41 |
| PRC1 | 41 |
| CENPF | 41 |
| DTL | 41 |
| PBK | 41 |
| ASPM | 41 |
| CEP55 | 41 |
| MCM4 | 41 |
| TRIP13 | 41 |
| DLGAP5 | 40 |
| CKS1B | 40 |
| KIF20A | 40 |
| NUSAP1 | 40 |
| RAD51AP1 | 40 |
Screening of the PPI network using MCODE identified
two modules. In module 1, the MCODE score was 40.7, including 41
nodes and 814 edge connection lines (Fig. 3B). To investigate the effect of
modules on the occurrence of EC at a more functional level, DEGs
within the modules were classified into KEGG terms. The DEGs in
module 1 were mainly enriched in KEGG pathways such as ‘cell
cycle’, ‘DNA replication’, ‘oocyte meiosis’, ‘progesterone-mediated
oocyte maturation’ and ‘HTLV–I infection’ (P<0.05; Fig. 3C). The MCODE score in module 2 was
8.4, including 16 nodes and 63 edge lines (Fig. 3D), and the KEGG pathway enrichment
analysis of module 2 mostly identified terms such as ‘protein
digestion and absorption’, ‘ECM-receptor interaction’, ‘focal
adhesion’, ‘amoebiasis’, ‘PI3K-Akt signaling pathway’ and ‘platelet
activation’ (P<0.05; Fig.
3E).
Analysis of hub genes as prognostic
indicators of survival in EC
To determine whether these DEGs were associated with
survival of patients with EC, the DEGs were submitted to the
Kaplan-Meier plotter bioinformatics analysis platform. Kaplan-Meier
plotter database data is mainly derived from GEO (Affymetrix
microarray only), EGA and TCGA. All possible cutoff values between
the lower and upper quartiles were computed, and the best
performing threshold was used as a cutoff. The log-rank test was
used to analyze OS (161 EC samples) and RFS (73 EC samples). The OS
prognosis of patients with EC with high expression levels of UBE2C
(Fig. 4A), CDKN3 (Fig. 4B), CKS2 (Fig. 4C), KIF20A (Fig. 4D) and RAD51AP1 (Fig. 4E) was worse than that of patients
with low expression levels of these genes (P<0.05). There was no
significant prognostic value identified for the other hub genes
(all P>0.05). To further investigate the impact of these five
hub genes on the prognosis of patients with EC, the association
between the expression of these genes and RFS was analyzed. The
results demonstrated that UBE2C expression (Fig. 4F) was not associated with RFS, and
higher expression levels of CDKN3 (Fig.
4G) and CKS2 (Fig. 4H) were
significantly associated with shorter RFS in patients with EC.
However, the expression levels of KIF20A (Fig. 4I) and RAD51AP1 (Fig. 4J) were not associated with RFS in
patients with EC.
 | Figure 4.Kaplan-Meier overall survival
analyses for hub genes expressed in EC. A total of five hub genes
were identified to have an adverse effect on prognosis of overall
survival for patients with EC. The Kaplan-Meier Plotter
bioinformatics analysis platform was used to analyze the prognostic
value of hub genes in the Gene Expression Omnibus and The Cancer
Genome Atlas EC datasets. Overall survival of 161 patients with EC
was determined according to (A) UBE2C, (B) CDKN3, (C) CKS2, (D)
KIF20A and (E) RAD51AP1 status using the online Kaplan-Meier
Plotter tool. Relapse-free survival of 73 patients with esophageal
cancer according the (F) UBE2C, (G) CDKN3, (H) CKS2, (I) KIF20A and
(J) RAD51AP1 status in online Kaplan-Meier Plotter (HR>1).
CDKN3, cyclin dependent kinase inhibitor 3; CKS2, CDC28 protein
kinase regulatory subunit 2; EC, esophageal cancer; HR, hazard
ratio; KIF20A, kinesin family member 20A; RAD51AP1, RAD51
associated protein 1; UBE2C, ubiquitin conjugating enzyme E2 C. |
Influence of the five prognostic hub
genes on invasion of EC
Poor prognosis of EC is closely associated with
early invasion and metastasis (21).
To determine if the five prognostic hub genes mediated EC migration
and invasion, differences in expression levels of these genes in
invading and non-invading EC cells from a GEO microarray dataset
(GSE21293) were analyzed (17).
Primary esophageal cells were established from ESCC surgical
specimens (n=35). The present study revealed that UBE2C, CDKN3,
CKS2, KIF20A and RAD51AP1 were significantly differentially
expressed between invading and non-invading EC cells (Fig. 5A). UBE2C, CDKN3, CKS2, KIF20A and
RAD51AP1 were upregulated in the invading cells (n=12) compared
with the non-invading cells using Student's t test (Fig. 5B). These results indicated that these
hub genes may mediate the migration and invasion of EC.
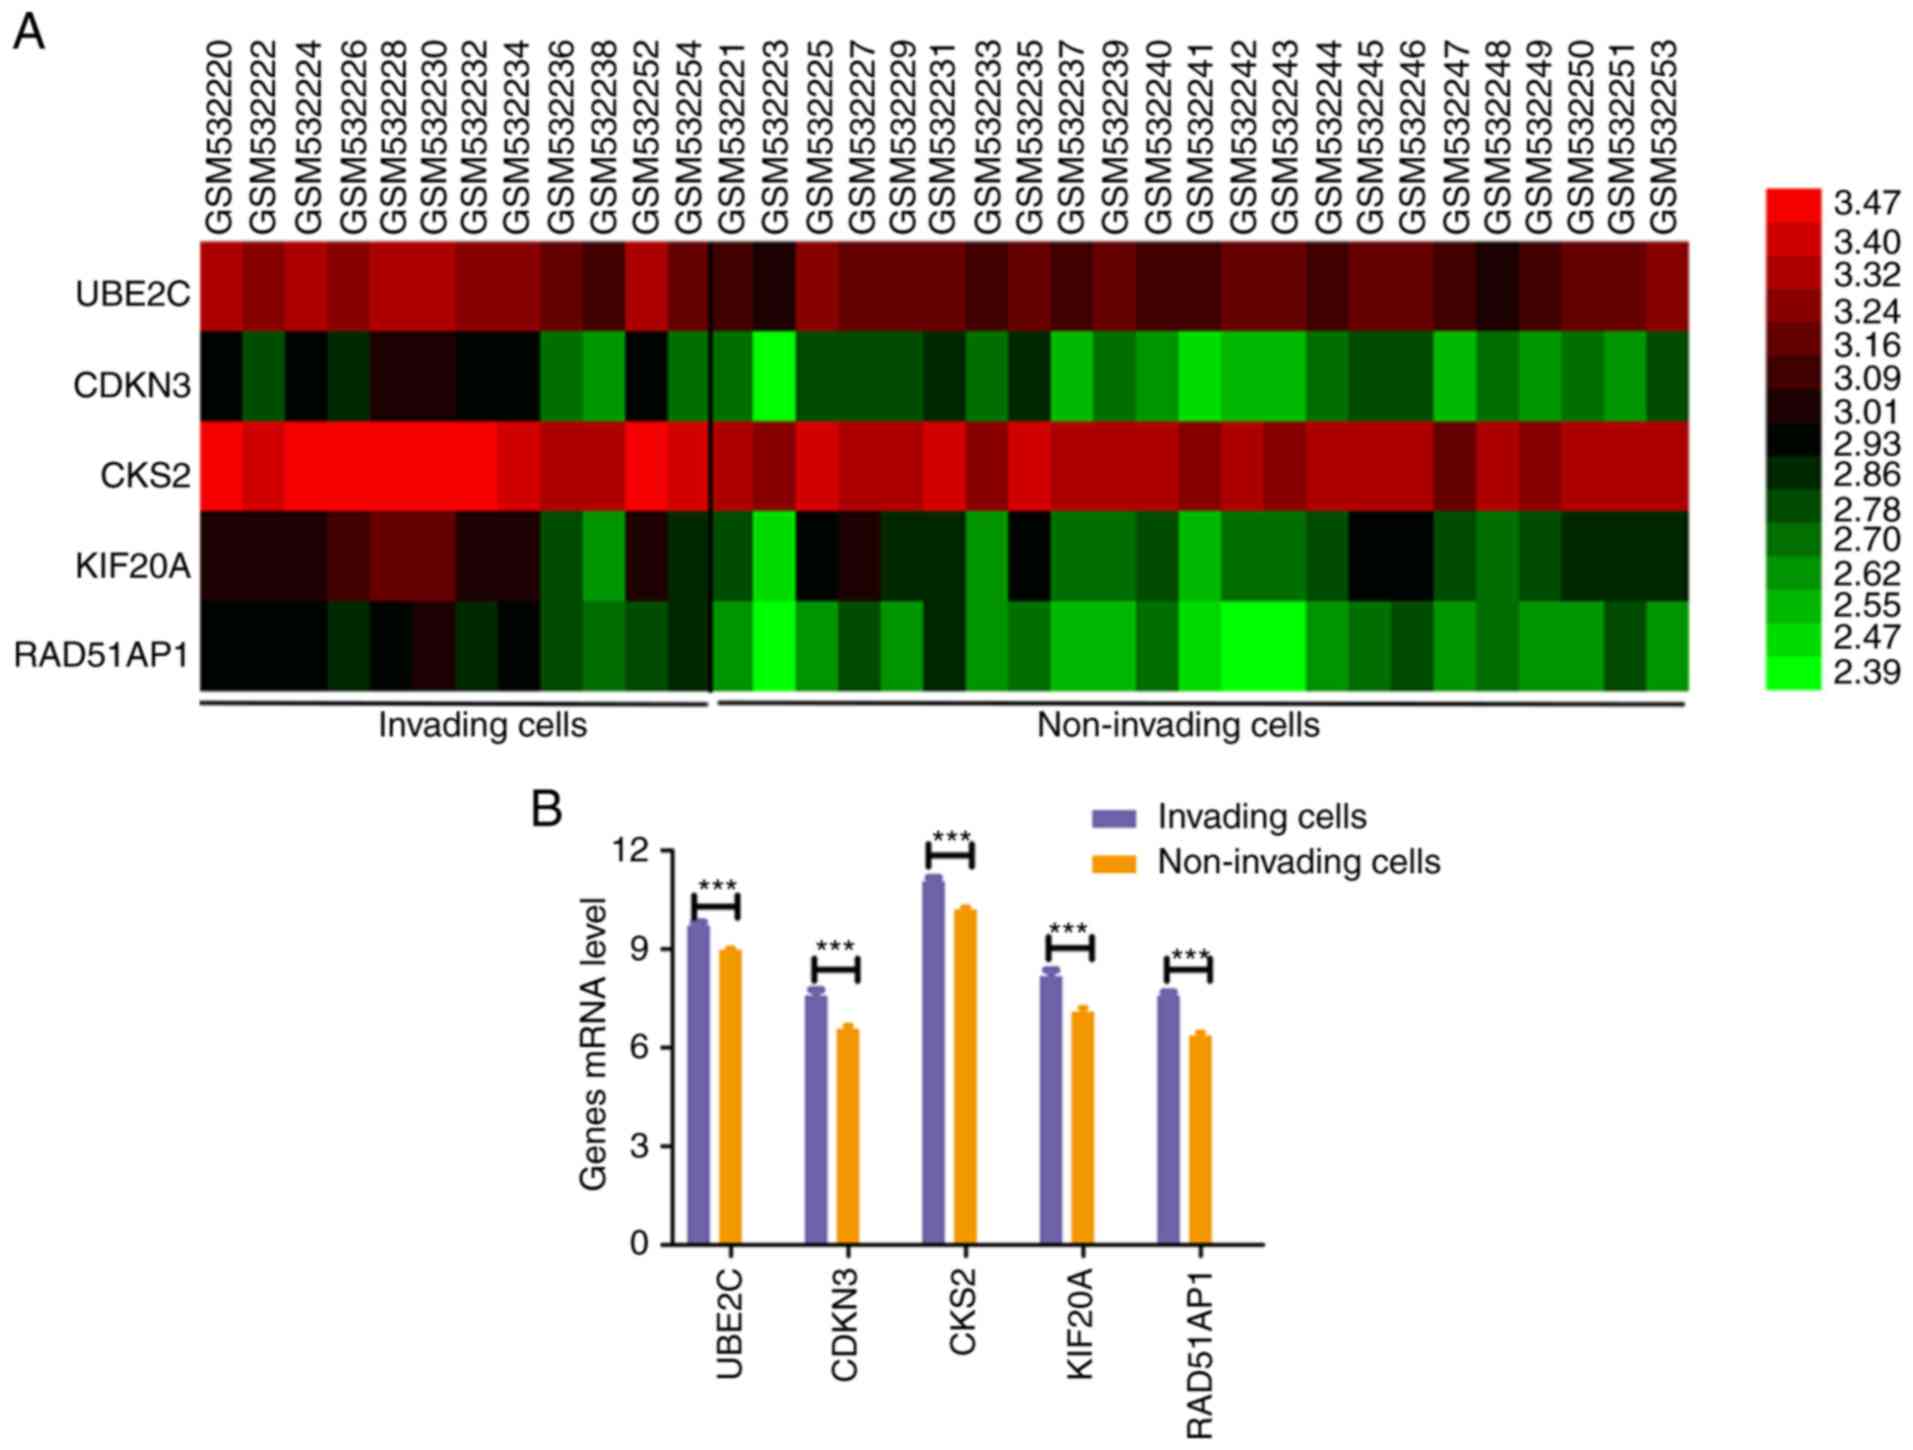 | Figure 5.Role of five prognostic hub genes in
the migration and invasion of esophageal cancer. (A) Gene
expression of UBE2C, CDKN3, CKS2, KIF20A and RAD51AP1 in invading
and non-invading cells based on the Gene Expression Omnibus
expression dataset GSE21293. Fragments per kilobase million values
of UBE2C, CDKN3, CKS2, KIF20A and RAD51AP1 genes were
log2 transformed and the resulting heatmap was
constructed using HemI software. (B) Bar chart indicating
expression levels of UBE2C, CDKN3, CKS2, KIF20A and RAD51AP1 in the
invading cells (n=12) compared with in the non-invading cells.
CDKN3, cyclin dependent kinase inhibitor 3; CKS2, CDC28 protein
kinase regulatory subunit 2; KIF20A, kinesin family member 20A;
RAD51AP1, RAD51 associated protein 1; UBE2C, ubiquitin conjugating
enzyme E2 C. ***P<0.001. |
Association of the five prognostic hub
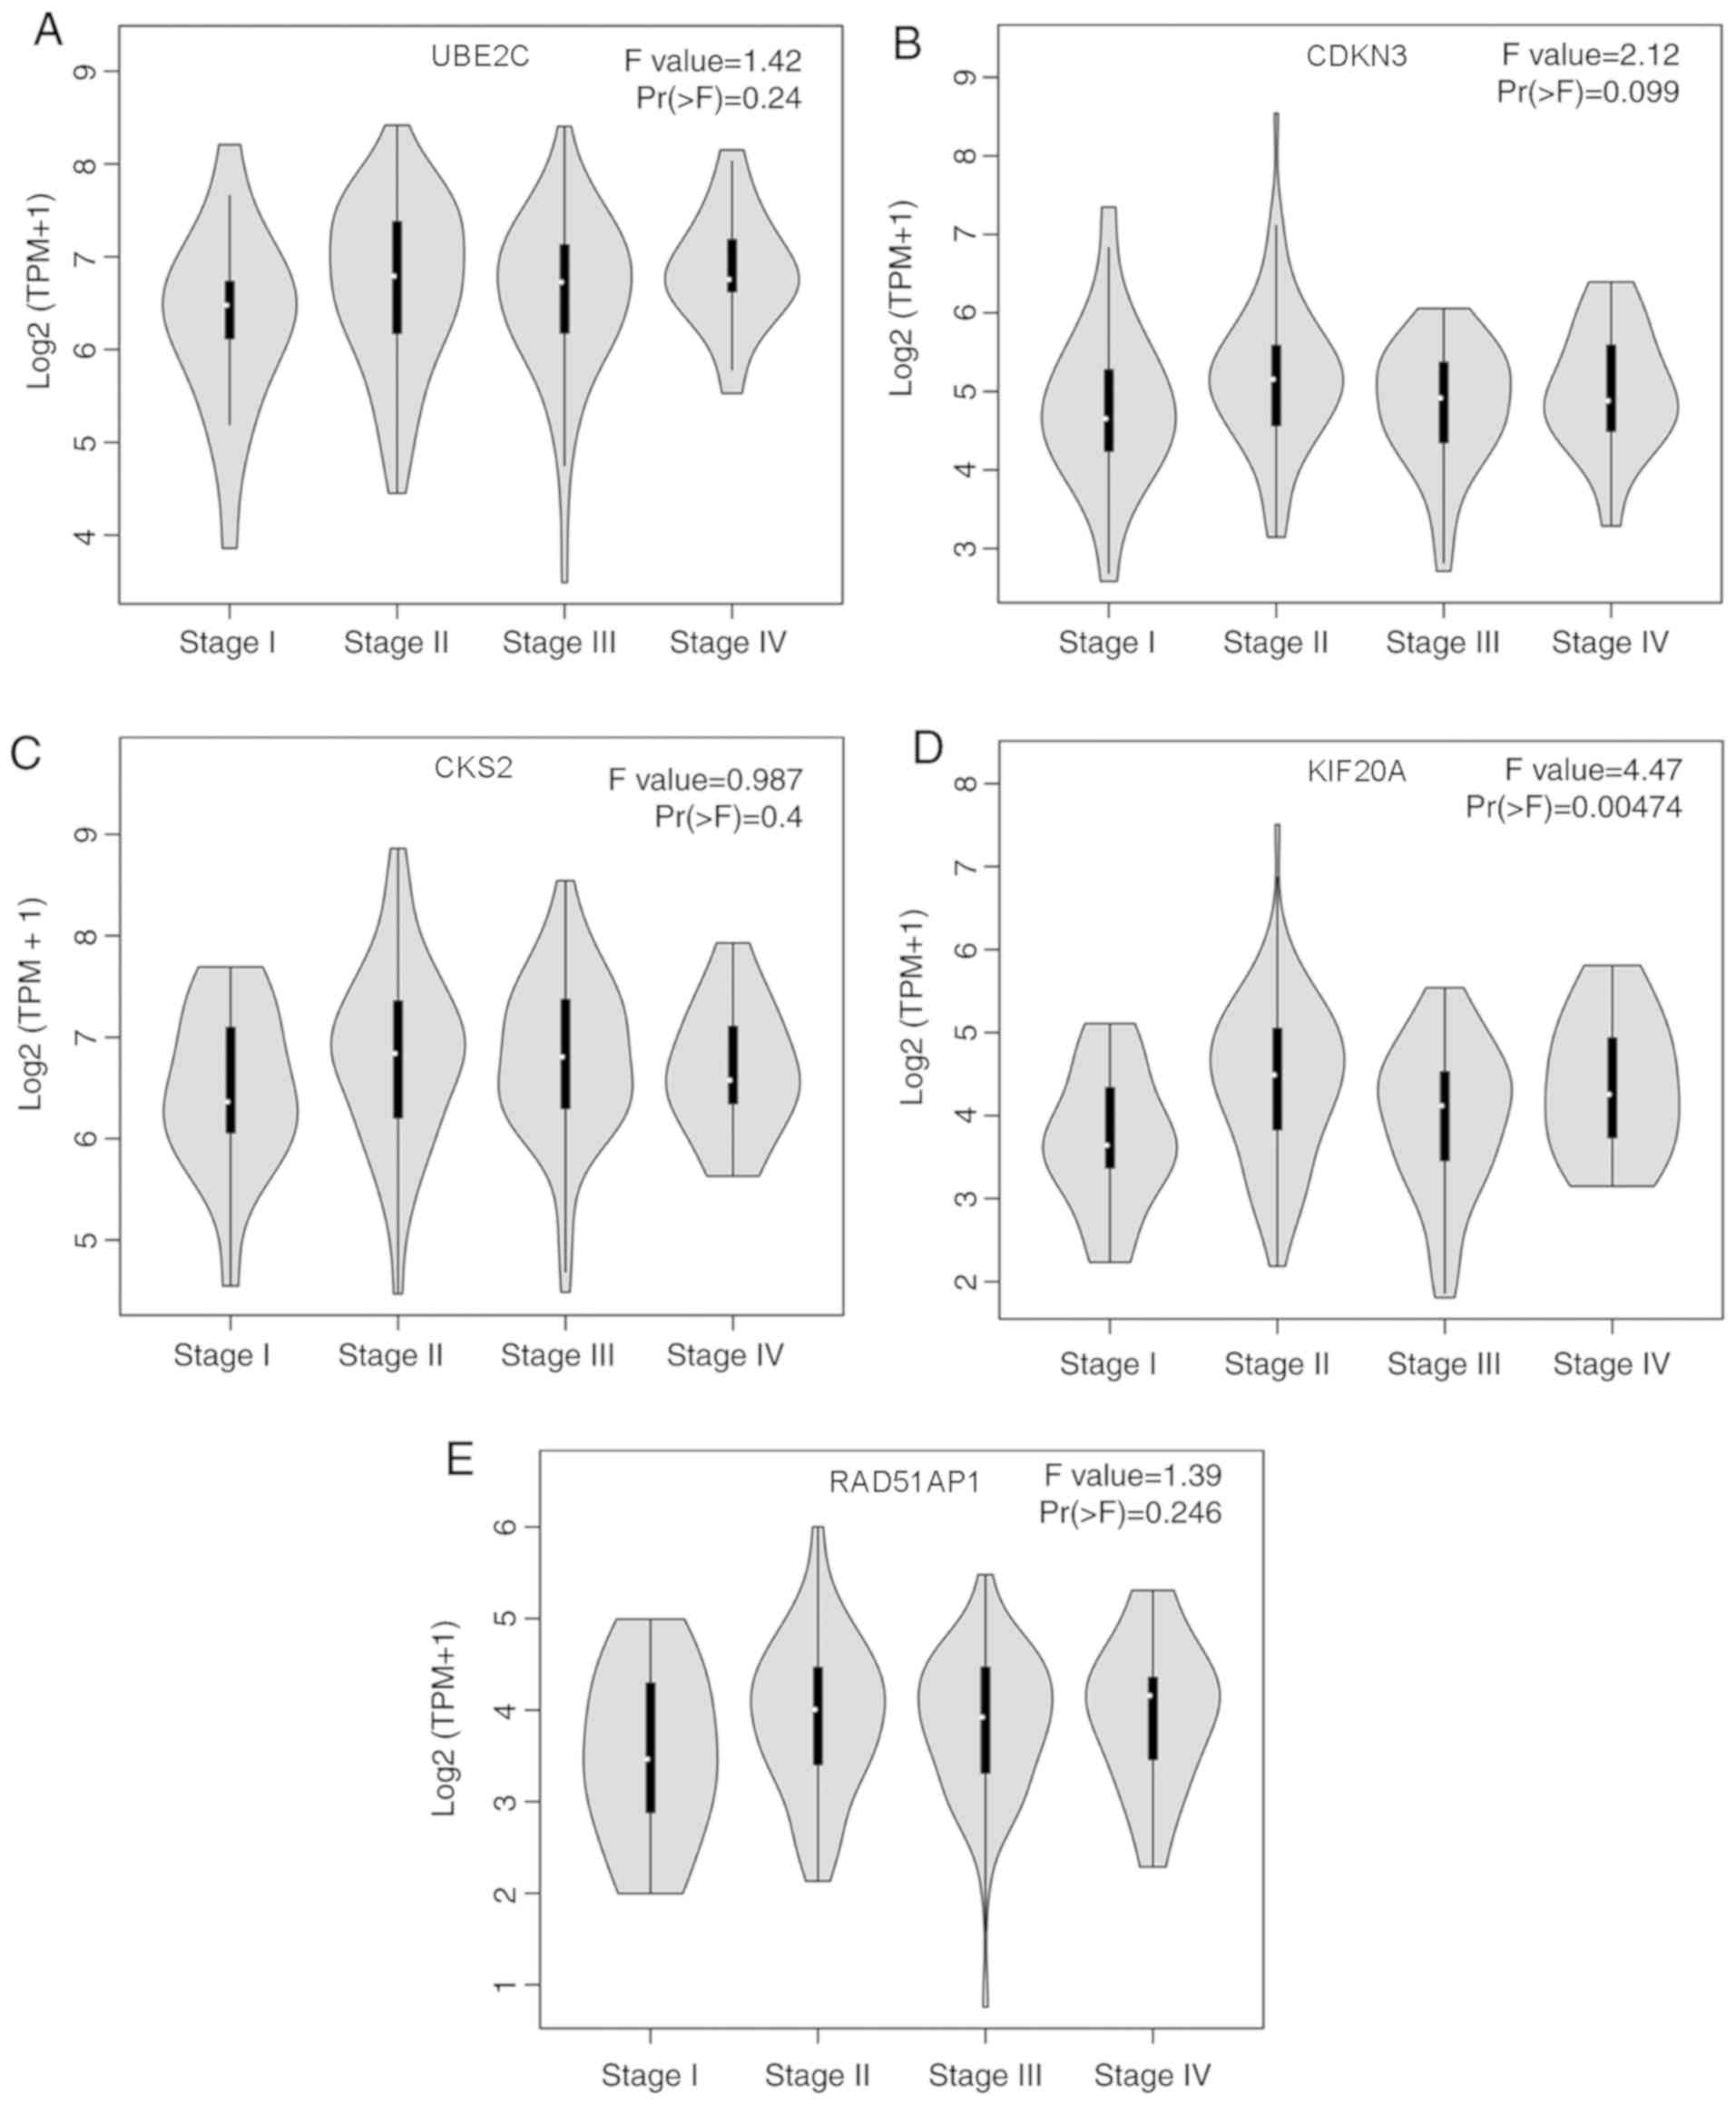
genes with pathological staging of EC
Pathological stage is a major indicator of the
progression of EC (3). The present
study ascertained the association between expression levels of the
five prognostic hub genes and pathological staging of EC. There
were no significant differences identified for expression of UBE2C
(Fig. 6A), CDKN3 (Fig. 6B) or CKS2 (Fig. 6C) in different pathological stages of
EC (P>0.05). However, KIF20A expression was associated with
different pathological stages of EC, and upregulation of KIF20A was
closely associated with advanced EC stage (P<0.05; Fig. 6D). RAD51AP1 expression exhibited a
non-significant trend of difference in different pathological
stages of EC (P>0.05; Fig. 6E).
Therefore, among these five hub genes, KIF20A expression may be
used to predict the pathological stage of EC.
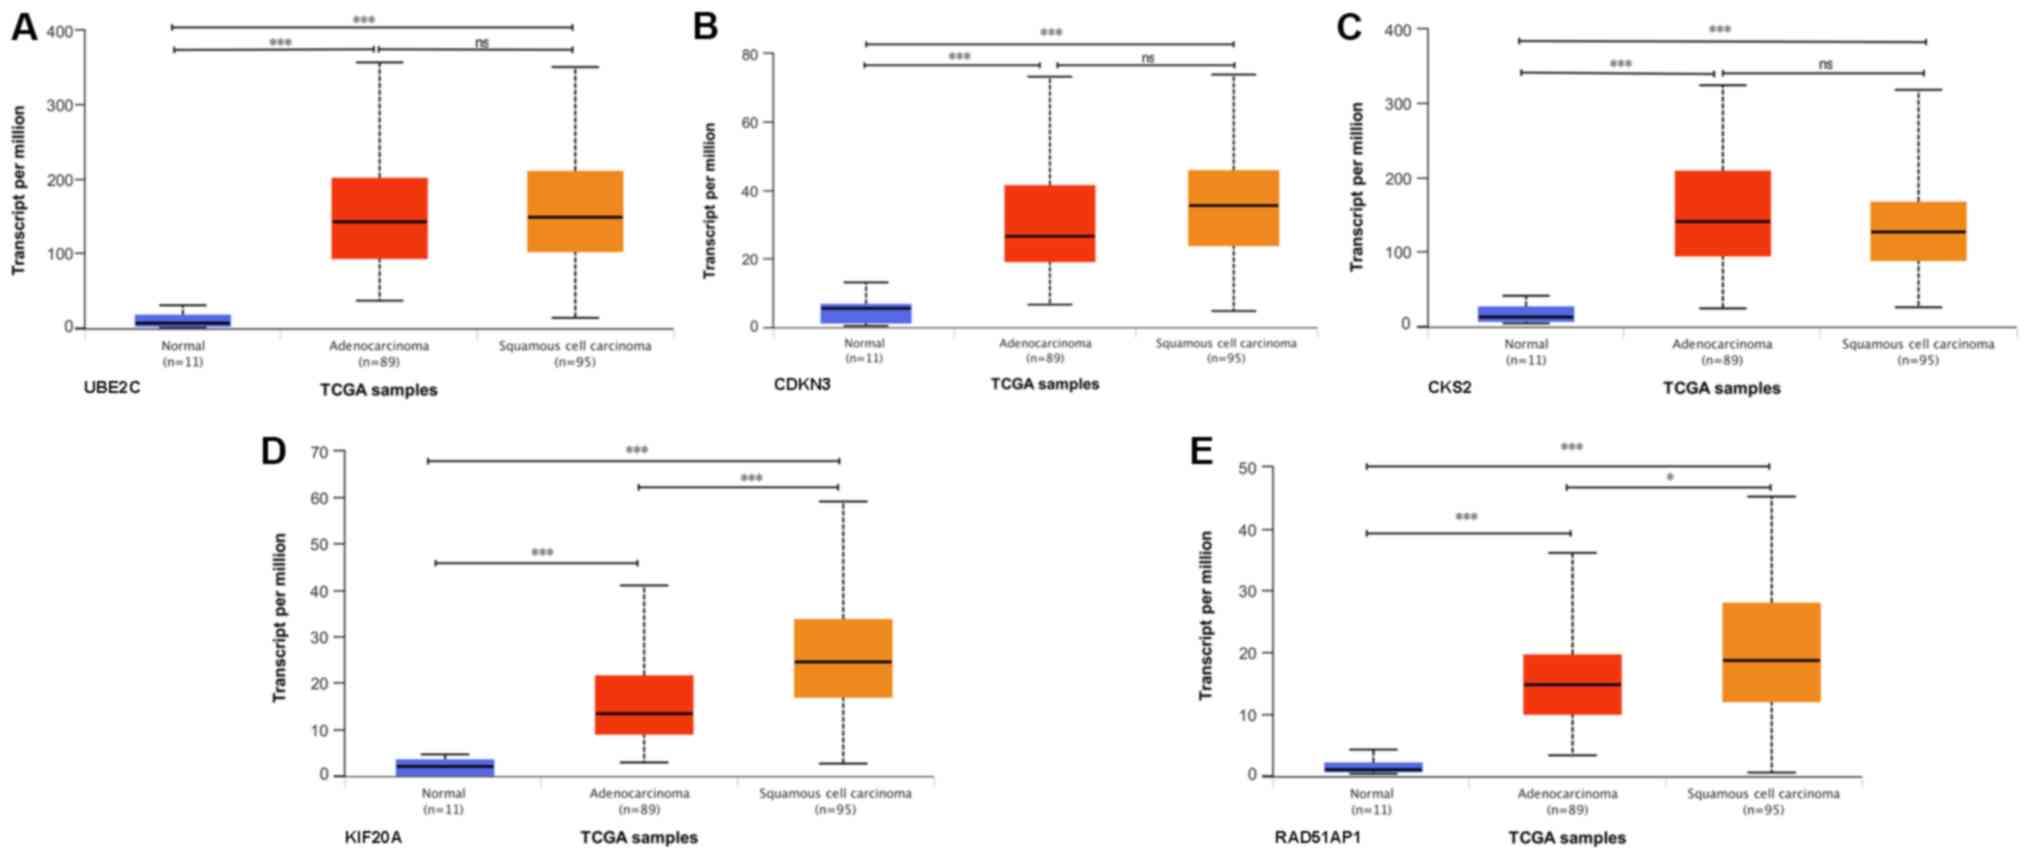
Differential expression of five
prognostic hub genes in different histological subtypes of EC
To determine if the expression of the five
prognostic hub genes differed in different histological subtypes of
EC, the expression levels of these genes in ESCC and EAC were
analyzed based on the TCGA database. The expression levels of UBE2C
(Fig. 7A), CDKN3 (Fig. 7B), CKS2 (Fig. 7C), KIF20A (Fig. 7D) and RAD51AP1 (Fig. 7E) in EAC and ESCC were significantly
higher than those in normal tissues. The expression levels of
UBE2C, CDKN3 and CKS2 exhibited no significant difference between
different histological EC subtypes. Higher expression levels of
KIF20A and RAD51AP1 were identified in ESCC compared with EAC.
KIF20A and RAD51AP1 may represent more specific molecular targets
for ESCC than EAC.
Discussion
In the present study, through comprehensive analysis
of EC gene expression profiles in the TCGA database and three
datasets from the GEO database, a total of 105 DEGs were identified
between EC and normal tissues. GO and KEGG pathway enrichment
analyses were conducted to identify functional processes and
pathways that may be mediated by these genes. GO enrichment
analysis revealed that upregulated DEGs were mainly involved in
‘collagen catabolic process’, located in the ‘midbody’ and promoted
‘metalloendopeptidase activity’. KEGG pathway analysis revealed
that the upregulated DEGs were mainly enriched in the ‘cell cycle’,
and downregulated DEGs were mainly involved in ‘muscle
contraction’, located in ‘focal adhesion’ and promoted ‘calmodulin
binding’. These DEGs were also associated with the proliferation of
tumor cells and cell matrix remodeling, which revealed that cell
cycle disorders, and invasion and migration were important
mechanisms leading to the development of EC. A total of 36 genes
were identified as hub genes in PPI network analysis. Two
significant modules of the network were identified and analyzed at
a functional level to identify KEGG pathways associated with the
occurrence of EC. The KEGG pathways identified included the
‘PI3K-Akt pathway’, which involves a series of important processes
in EC, including repressing cell proliferation and tumor growth
in vitro and in vivo, and regulation of a stem
cell-like population (22,23). Based on Kaplan-Meier plotter
analysis, upregulation of UBE2C, CDKN3, CKS2, RAD51AP1 and KIF20A
was significantly associated with shorter OS in patients with EC,
and higher expression levels of CDKN3 and CKS2 were significantly
associated with shorter RFS in patients with EC. However, the
mechanisms by which these DEGs were associated with the occurrence
of EC remains unclear. Therefore, the present study evaluated the
association between the expression levels of these DEGs and other
clinical parameters of EC. It was identified that the five
prognostic hub genes may mediate EC migration and invasion. KIF20A
may have potential value as a predictive biomarker for the
pathological staging of EC. Compared with in EAC, KIF20A and
RAD51AP1 were upregulated in ESCC.
UBE2C targets abnormal or short-lived protein
degradation during protein modification, and is a key modulator in
controlling cell proliferation (24,25).
Upregulation of UBE2C is considered to be a potential molecular
marker for the prognosis of breast cancer and advanced colon cancer
with liver metastases (26,27). Additionally, UBE2C is upregulated in
EC, where it can target and regulate cyclin B1, control the cell
cycle of EC cells and affect EC cell proliferation (28). The present study demonstrated that
UBE2C was upregulated in EC, and that upregulation of UBE2C was an
adverse prognostic indicator for patients with EC. At the
mechanistic level, a recent study found that UBE2C is involved in
the antiproliferative and apoptosis-regulating effects of ECRG4
augurin precursor (ECRG4) in EC cells (29). ECRG4 inhibits the proliferation of EC
cells by downregulating the expression levels of UBE2C via the
NF-κB signaling pathway (29).
Therefore, UBE2C may be a prognostic factor and potential
therapeutic target for EC.
CDKN3 is a member of the unspecific protein
phosphatase family and interacts with CDK2 kinase to regulate the
cell cycle (30,31). CDKN3 expression can reflect the
proliferative activity of cells (32). Upregulation of CDKN3 is considered to
be a key factor in promoting tumor cell proliferation and malignant
transformation in ovarian cancer, cervical cancer, lung
adenocarcinoma and leukemia, and is a potential molecular target
for antitumor therapy (33–36). The present study revealed that CDKN3
was upregulated in EC tissues compared with in normal tissues, and
patients with EC with high expression levels of CDKN3 tended to
have a worse prognosis. To the best of our knowledge, the role of
CDKN3 in EC remains unclear. CDKN3 may serve a role in the
development of EC, and further studies should be performed to
explore the value of CDKN3 as a therapeutic target in the treatment
of EC.
CKS2 is a downstream target gene of p53, and p53
regulates the cell cycle by controlling CKS2 (37,38).
Additionally, microRNA-7 and microRNA-26a can control the
proliferation of tumor cells by targeting CKS2 (39,40), and
Y-box binding protein 1 can regulate the cell cycle partly due to
its role in downregulating CKS2 (41). CKS2 protein is highly expressed in
EC, and is associated with higher histological grade, regional
lymph node invasion, lymphatic vessel infiltration, advanced
clinical stage and distant metastasis (42,43).
High CKS2 expression is an unfavorable prognostic indicator for
patients with EC (42,43). In the present study, the role of CKS2
in EC has been further elucidated.
KIF20A has been studied extensively in pancreatic
carcinoma (44). Inhibition of the
pancreatic carcinoma RAB6KIFL/KIF20A cell line by small interfering
RNA targeting KIF20A can significantly inhibit the proliferation of
this cell line (44). KIF20A serves
a key role in malignant biological behaviors, including invasion
and metastasis of pancreatic carcinoma cells (45). Upregulation of KIF20A has been
demonstrated in numerous types of cancer, and is an independent
prognostic factor for poor clinical outcomes for early-stage
cervical squamous cell carcinoma, glioma and breast cancer
(46–48). A KIF20A-targeted polypeptide vaccine,
which induces a specific immune response of cytotoxic T
lymphocytes, has been developed and has achieved good results in
the treatment of advanced pancreatic carcinoma (49,50).
Recently, it has been suggested that targeting KIF20A by
immunotherapy may have potential therapeutic efficacy in glioma
(51). In the present study, KIF20A
was identified to be significantly upregulated in EC tissues, and
KIF20A upregulation was associated with poor prognosis of EC and
different clinical stages of EC, suggesting that KIF20A may be a
key factor in the occurrence and development of EC, particularly
ESCC.
RAD51AP1 is an auxiliary protein of RAD51
recombinase (RAD51). RAD51AP1 facilitates the repair of damaged DNA
strands by binding to RAD51 (52,53).
Inhibiting RAD51AP1 has been demonstrated to reduce the
proliferation of cholangitis carcinoma cells. RAD51AP1 may serve a
role in DNA repair and tumor cell proliferation (54). In malignant melanoma, high expression
levels of RAD51AP1 may be an important molecular event involved in
tumor invasion and metastasis (55).
Additionally, DNA methylation in the RAD51AP1 promoter region may
be associated with prostate carcinoma (56). The potential role of RAD51AP1 in the
prognosis of EC merits further study.
In conclusion, a comprehensive bioinformatic
analysis of DEGs that may be associated with the pathogenesis of EC
was presented. A total of 105 DEGs and 36 hub genes were
identified, and the hub genes UBE2C, CDKN3, CKS2, KIF20A and
RAD51AP1 were associated with poor prognosis of patients with EC,
and may be involved in invasion of EC. Differential expression of
KIF20A was associated with different pathological stages of EC. The
expression levels of KIF20A and RAD51AP1 in ESCC were higher than
those in EAC, suggesting an EC subtype-specific expression pattern.
The role of these genes in the progression of EC merits further
investigation.
Acknowledgements
Not applicable.
Funding
The present study was supported by the National
Natural Science Foundation of China (grant nos. 81760428 and
81460363) and the Science and Technology Development Project of
Xinjiang Production and Construction Corps (grant no.
2018AB033).
Availability of data and materials
All data generated or analyzed during this study are
included in the published article.
Authors' contributions
YX, XW, CL, FL, JL, HZ and JH designed the study.
CJ, XY, AZ and LY analyzed the data. YX and XW interpreted the
data. JL and JH wrote the draft. HZ, CL and FL edited the
manuscript. JH and CL acquired the funding and supervised the whole
study. All authors read and approved the final manuscript.
Ethics approval and consent to
participate
Not applicable.
Patient consent for publication
Not applicable.
Competing interests
The authors declare that they have no competing
interests.
References
|
1
|
Arnold M, Abnet CC, Neale RE, Vignat J,
Giovannucci EL, McGlynn KA and Bray F: Global burden of 5 major
types of gastrointestinal cancer. Gastroenterology.
159:335–349.e15. 2020. View Article : Google Scholar : PubMed/NCBI
|
|
2
|
Allemani C, Weir HK, Carreira H, Harewood
R, Spika D, Wang XS, Bannon F, Ahn JV, Johnson CJ, Bonaventure A,
et al: Global surveillance of cancer survival 1995–2009: Analysis
of individual data for 25,676,887 patients from 279
population-based registries in 67 countries (CONCORD-2). Lancet.
385:977–1010. 2015. View Article : Google Scholar : PubMed/NCBI
|
|
3
|
Shuchai Z, Changliang S, Wenbing S,
Jingwei S, Juan L and Zhikun L: Prognostic factors of patients with
esophageal cancer after radical resection. Chin J Oncol.
34:281–286. 2012.
|
|
4
|
GBD 2017 Stomach Cancer Collaborators, .
The global, regional, and national burden of stomach cancer in 195
countries, 1990–2017: A systematic analysis for the global burden
of disease study 2017. Lancet Gastroenterol Hepatol. 5:42–54. 2020.
View Article : Google Scholar : PubMed/NCBI
|
|
5
|
Cui Y, Chen H, Xi R, Cui H, Zhao Y, Xu E,
Yan T, Lu X, Huang F, Kong P, et al: Whole-genome sequencing of 508
patients identifies key molecular features associated with poor
prognosis in esophageal squamous cell carcinoma. Cell Res.
12–May;2020.(Epub ahead of print). View Article : Google Scholar
|
|
6
|
Samur MK: RTCGAToolbox: A new tool for
exporting TCGA Firehose data. PLoS One. 9:e1063972014. View Article : Google Scholar : PubMed/NCBI
|
|
7
|
Su H, Hu N, Yang HH, Wang C, Takikita M,
Wang QH, Giffen C, Clifford R, Hewitt SM, Shou JZ, et al: Global
Gene expression profiling and validation in esophageal squamous
cell carcinoma and its association with clinical phenotypes. Clin
Cancer Res. 17:2955–66. 2011. View Article : Google Scholar : PubMed/NCBI
|
|
8
|
Hu N, Clifford RJ, Yang HH, Wang C,
Goldstein AM, Ding T, Taylor PR and Lee MP: Genome wide analysis of
DNA copy number neutral loss of heterozygosity (CNNLOH) and its
relation to gene expression in esophageal squamous cell carcinoma.
BMC Genomics. 11:5762010. View Article : Google Scholar : PubMed/NCBI
|
|
9
|
Yu K, Ganesan K, Tan LK, Laban M, Wu J,
Zhao XD, Li H, Leung CH, Zhu Y, Wei CL, et al: A precisely
regulated gene expression cassette potently modulates metastasis
and survival in multiple solid cancers. PLoS Genet. 4:e10001292008.
View Article : Google Scholar : PubMed/NCBI
|
|
10
|
Gene Ontology Consortium: The Gene
Ontology (GO) project in 2006. Nucleic Acids Res. 34((Database
Issue)): D322–D326. 2005.
|
|
11
|
Minoru K and Susumu G: KEGG: Kyoto
encyclopedia of genes and genomes. Nucleic Acids Res. 28:27–30.
2000. View Article : Google Scholar : PubMed/NCBI
|
|
12
|
Dennis G Jr, Sherman BT, Hosack DA, Yang
J, Gao W, Lane HC and Lempicki RA: DAVID: Database for annotation,
visualization, and integrated discovery. Genome Biol. 4:P32003.
View Article : Google Scholar : PubMed/NCBI
|
|
13
|
Szklarczyk D, Gable AL, Lyon D, Junge A,
Wyder S, Huerta-Cepas J, Simonovic M, Doncheva NT, Morris JH, Bork
P, et al: STRING v11: Protein-protein association networks with
increased coverage, supporting functional discovery in genome-wide
experimental datasets. Nucleic Acids Res. 47:D607–D613. 2019.
View Article : Google Scholar : PubMed/NCBI
|
|
14
|
Kohl M, Wiese S and Warscheid B:
Cytoscape: Software for visualization and analysis of biological
networks. Methods Mol Biol. 696:291–303. 2011. View Article : Google Scholar : PubMed/NCBI
|
|
15
|
Bader GD and Hogue CW: An automated method
for finding molecular complexes in large protein interaction
networks. BMC Bioinformatics. 4:22003. View Article : Google Scholar : PubMed/NCBI
|
|
16
|
Gyorffy B, Lánczky A and Szállási Z:
Implementing an online tool for genome-wide validation of
survival-associated biomarkers in ovarian-cancer using microarray
data from 1,287 patients. Endocr Relat Cancer. 19:197–208. 2012.
View Article : Google Scholar : PubMed/NCBI
|
|
17
|
Michaylira CZ, Wong GS, Miller CG,
Gutierrez CM, Nakagawa H, Hammond R, Klein-Szanto AJ, Lee JS, Kim
SB, Herlyn M, et al: Periostin, a cell adhesion molecule,
facilitates invasion in the tumor microenvironment and annotates a
novel tumor-invasive signature in esophageal cancer. Cancer Res.
70:5281–5292. 2010. View Article : Google Scholar : PubMed/NCBI
|
|
18
|
Deng W, Wang Y, Liu Z, Cheng H and Xue Y:
HemI: A toolkit for illustrating heatmaps. PLoS One. 9:e1119882014.
View Article : Google Scholar : PubMed/NCBI
|
|
19
|
Tang Z, Li C, Kang B, Gao G, Li C and
Zhang Z: GEPIA: A web server for cancer and normal gene expression
profiling and interactive analyses. Nucleic Acids Res. 45:W98–W102.
2017. View Article : Google Scholar : PubMed/NCBI
|
|
20
|
Chandrashekar DS, Bashel B, Balasubramanya
SAH, Creighton CJ, Ponce-Rodriguez I, Chakravarthi BVSK and
Varambally S: UALCAN: A portal for facilitating tumor subgroup gene
expression and survival analyses. Neoplasia. 19:649–658. 2017.
View Article : Google Scholar : PubMed/NCBI
|
|
21
|
Cools-Lartigue J, Spicer J and Ferri LE:
Current status of management of malignant disease: Current
management of esophageal cancer. J Gastrointest Surg. 19:964–972.
2015. View Article : Google Scholar : PubMed/NCBI
|
|
22
|
Li B, Li J, Xu WW, Guan XY, Qin YR, Zhang
LY, Law S, Tsao SW and Cheung AL: Suppression of esophageal tumor
growth and chemoresistance by directly targeting the PI3K/AKT
pathway. Oncotarget. 5:11576–11587. 2014. View Article : Google Scholar : PubMed/NCBI
|
|
23
|
Li H, Gao Q, Guo L and Lu SH: The
PTEN/PI3K/Akt pathway regulates stem-like cells in primary
esophageal carcinoma cells. Cancer Biol Ther. 11:950–958. 2011.
View Article : Google Scholar : PubMed/NCBI
|
|
24
|
Hao Z, Zhang H and Cowell J:
Ubiquitin-conjugating enzyme UBE2C: Molecular biology, role in
tumorigenesis, and potential as a biomarker. Tumour Biol.
33:723–730. 2012. View Article : Google Scholar : PubMed/NCBI
|
|
25
|
Xie C, Powell C, Yao M, Wu J and Dong Q:
Ubiquitin-conjugating enzyme E2C: A potential cancer biomarker. Int
J Biochem Cell Biol. 47:113–117. 2014. View Article : Google Scholar : PubMed/NCBI
|
|
26
|
Loussouarn D, Campion L, Leclair F,
Campone M, Charbonnel C, Ricolleau G, Gouraud W, Bataille R and
Jézéquel P: Validation of UBE2C protein as a prognostic marker in
node-positive breast cancer. Br J Cancer. 101:166–173. 2009.
View Article : Google Scholar : PubMed/NCBI
|
|
27
|
Takahashi Y, Ishii Y, Nishida Y, Ikarashi
M, Nagata T, Nakamura T, Yamamori S and Asai S: Detection of
aberrations of ubiquitin-conjugating enzyme E2C gene (UBE2C) in
advanced colon cancer with liver metastases by DNA microarray and
two-color FISH. Cancer Genet Cytogenet. 168:30–35. 2006. View Article : Google Scholar : PubMed/NCBI
|
|
28
|
Palumbo A Jr, Da Costa NM, De Martino M,
Sepe R, Pellecchia S, de Sousa VP, Nicolau Neto P, Kruel CD,
Bergman A, Nasciutti LE, et al: UBE2C is overexpressed in ESCC
tissues and its abrogation attenuates the malignant phenotype of
ESCC cell lines. Oncotarget. 7:65876–65887. 2016. View Article : Google Scholar : PubMed/NCBI
|
|
29
|
Li L, Li X, Wang W, Gao T and Shi Z: UBE2C
is involved in the functions of ECRG4 on esophageal squamous cell
carcinoma. Biomed Pharmacother. 98:201–206. 2018. View Article : Google Scholar : PubMed/NCBI
|
|
30
|
Demetrick DJ, Matsumoto S, Hannon GJ,
Okamoto K, Xiong Y, Zhang H and Beach DH: Chromosomal mapping of
the genes for the human cell cycle proteins cyclin C (CCNC), cyclin
E (CCNE), p21 (CDKN1) and KAP (CDKN3). Cytogenet Cell Genet.
69:190–192. 1995. View Article : Google Scholar : PubMed/NCBI
|
|
31
|
Nalepa G, BarnholtzSloan J, Enzor R, Dey
D, He Y, Gehlhausen JR, Lehmann AS, Park SJ, Yang Y, Yang X, et al:
The tumor suppressor CDKN3 controls mitosis. J Cell Biol.
201:997–1012. 2013. View Article : Google Scholar : PubMed/NCBI
|
|
32
|
Cress WD, Yu P and Wu J: Expression and
alternative splicing of the cyclin-dependent kinase inhibitor-3
gene in human cancer. Int J Biochem Cell Biol. 91:98–101. 2017.
View Article : Google Scholar : PubMed/NCBI
|
|
33
|
Li T, Xue H, Guo Y and Guo K: CDKN3 is an
independent prognostic factor and promotes ovarian carcinoma cell
proliferation in ovarian cancer. Oncol Rep. 31:1825–1831. 2014.
View Article : Google Scholar : PubMed/NCBI
|
|
34
|
Jaime B, Ana María E and Ingrid M:
Targeting CDKN3 in cervical cancer. Expert Opin Ther Targets.
18:1149–1162. 2014. View Article : Google Scholar : PubMed/NCBI
|
|
35
|
Fan C, Chen L, Huang Q, Shen T, Welsh EA,
Teer JK, Cai J, Cress WD and Wu J: Overexpression of major CDKN3
transcripts is associated with poor survival in lung
adenocarcinoma. Br J Cancer. 113:1735–1743. 2015. View Article : Google Scholar : PubMed/NCBI
|
|
36
|
Chen Q, Chen K, Guo G, Li F, Chen C, Wang
S, Nalepa G, Huang S and Chen JL: A critical role of CDKN3 in
Bcr-Abl-mediated tumorigenesis. PLoS One. 9:e1116112014. View Article : Google Scholar : PubMed/NCBI
|
|
37
|
Martinsson-Ahlzen HS, Liberal V,
Grunenfelder B, Chaves SR, Spruck CH and Reed SI: Cyclin-dependent
kinase-associated proteins Cks1 and Cks2 are essential during early
embryogenesis and for cell cycle progression in somatic cells. Mol
Cell Biol. 28:5698–5709. 2008. View Article : Google Scholar : PubMed/NCBI
|
|
38
|
Rother K, Dengl M, Lorenz J, Tschöp K,
Kirschner R, Mössner J and Engeland K: Gene expression of
cycli-dependent kinase subunit Cks2 is repressed by the tumor
suppressor p53 but not by the related proteins p63 or p73. FEBS
Lett. 581:1166–1172. 2007. View Article : Google Scholar : PubMed/NCBI
|
|
39
|
Lv M, Zhang X, Li M, Chen Q, Ye M, Liang
W, Ding L, Cai H, Fu D and Lv Z: miR-26a and its target CKS2
modulate cell growth and tumorigenesis of papillary thyroid
carcinoma. PLoS One. 8:e675912013. View Article : Google Scholar : PubMed/NCBI
|
|
40
|
Hua K, Jin J, Zhang H, Zhao B, Wu C, Xu H
and Fang L: MicroRNA-7 inhibits proliferation, migration and
invasion of thyroid papillary cancer cells via targeting CKS2. Int
J Oncol. 49:1531–1540. 2016. View Article : Google Scholar : PubMed/NCBI
|
|
41
|
Yu YN, Yip GW, Tan PH, Thike AA, Matsumoto
K, Tsujimoto M and Bay BH: Y-box binding protein 1 is up-regulated
in proliferative breast cancer and its inhibition deregulates the
cell cycle. Int J Oncol. 37:483–492. 2010.PubMed/NCBI
|
|
42
|
Wang JJ, Fang ZX, Ye HM, You P, Cai MJ,
Duan HB, Wang F and Zhang ZY: Clinical significance of
overexpressed cyclin-dependent kinase subunits 1 and 2 in
esophageal carcinoma. Dis Esophagus. 26:729–736. 2013.PubMed/NCBI
|
|
43
|
Kita Y, Nishizono Y, Okumura H, Uchikado
Y, Sasaki K, Matsumoto M, Setoyama T, Tanoue K, Omoto I, Mori S, et
al: Clinical and biological impact of cyclin-dependent kinase
subunit 2 in esophageal squamous cell carcinoma. Oncol Rep.
31:1986–1992. 2014. View Article : Google Scholar : PubMed/NCBI
|
|
44
|
Taniuchi K, Nakagawa H, Nakamura T, Eguchi
H, Ohigashi H, Ishikawa O, Katagiri T and Nakamura Y:
Down-regulation of RAB6KIFL/KIF20A, a kinesin involved with
membrane trafficking of discs large homologue 5, can attenuate
growth of pancreatic cancer cell. Cancer Res. 65:105–112.
2005.PubMed/NCBI
|
|
45
|
Stangel D, Erkan M, Buchholz M, Gress T,
Michalski C, Raulefs S, Friess H and Kleeff J: Kif20a inhibition
reduces migration and invasion of pancreatic cancer cells. J Surg
Res. 197:91–100. 2015. View Article : Google Scholar : PubMed/NCBI
|
|
46
|
Zhang W, He W, Shi Y, Gu H, Li M, Liu Z,
Feng Y, Zheng N, Xie C and Zhang Y: High Expression of KIF20A is
associated with poor overall survival and tumor progression in
early-stage cervical squamous cell carcinoma. PLoS One.
11:e01674492016. View Article : Google Scholar : PubMed/NCBI
|
|
47
|
Jia D, Wei H and Shi H: Positive
expression of KIF20A indicates poor prognosis of glioma patients.
Onco Targets Ther. 9:6741–6749. 2016. View Article : Google Scholar : PubMed/NCBI
|
|
48
|
Bobustuc GC, Kassam AB, Rovin RA, Jeudy S,
Smith JS, Isley B, Singh M, Paranjpe A, Srivenugopal KS and Konduri
SD: MGMT inhibition in ER positive breast cancer leads to CDC2,
TOP2A, AURKB, CDC20, KIF20A, Cyclin A2, Cyclin B2, Cyclin D1, ERα
and survivin inhibition and enhances response to temozolomide.
Oncotarget. 9:29727–29742. 2018. View Article : Google Scholar : PubMed/NCBI
|
|
49
|
Suzuki N, Hazama S, Ueno T, Matsui H,
Shindo Y, Iida M, Yoshimura K, Yoshino S, Takeda K and Oka M: A
phase I clinical trial of vaccination with KIF20A-derived peptide
in combination with gemcitabine for patients with advanced
pancreatic cancer. J Immunother. 37:36–42. 2014. View Article : Google Scholar : PubMed/NCBI
|
|
50
|
Asahara S, Takeda K, Yamao K, Maguchi H
and Yamaue H: Phase I/II clinical trial using HLA-A24-restricted
peptide vaccine derived from KIF20A for patients with advanced
pancreatic cancer. J Transl Med. 11:2912013. View Article : Google Scholar : PubMed/NCBI
|
|
51
|
Saito K, Ohta S, Kawakami Y, Yoshida K and
Toda M: Functional analysis of KIF20A, a potential
immunotherapeutic target for glioma. J Neurooncol. 132:63–74. 2017.
View Article : Google Scholar : PubMed/NCBI
|
|
52
|
Modesti M, Budzowska M, Baldeyron C,
Demmers JA, Ghirlando R and Kanaar R: RAD51AP1 is a
structure-specific DNA binding protein that stimulates joint
molecule formation during RAD51-mediated homologous recombination.
Mol Cell. 28:468–481. 2007. View Article : Google Scholar : PubMed/NCBI
|
|
53
|
Dunlop MH, Dray E, Zhao W, San Filippo J,
Tsai MS, Leung SG, Schild D, Wiese C and Sung P: Mechanistic
insights into RAD51-associated protein 1 (RAD51AP1) action in
homologous DNA repair. J Biol Chem. 287:12343–12347. 2012.
View Article : Google Scholar : PubMed/NCBI
|
|
54
|
Obama K, Satoh S, Hamamoto R, Sakai Y,
Nakamura Y and Furukawa Y: Enhanced expression of RAD51 associating
protein-1 is involved in the growth of intrahepatic
cholangiocarcinoma cells. Clin Cancer Res. 14:1333–1339. 2008.
View Article : Google Scholar : PubMed/NCBI
|
|
55
|
Kauffmann A, Rosselli F, Lazar V,
Winnepenninckx V, Mansuet-Lupo A, Dessen P, van den Oord JJ, Spatz
A and Sarasin A: High expression of DNA repair pathways is
associated with metastasis in melanoma patients. Oncogene.
27:565–573. 2008. View Article : Google Scholar : PubMed/NCBI
|
|
56
|
Wang Y, Yu Q, Cho AH, Rondeau G, Welsh J,
Adamson E, Mercola D and McClelland M: Survey of differentially
methylated promoters in prostate cancer cell lines. Neoplasia.
7(748): IN1–IN7. 2005.
|