Introduction
Colorectal cancer (CRC) has the second-highest
mortality rate among all cancers, and its associated mortality
ranks fourth (9.0%) and third (9.5%) among all cancers in male and
female patients with cancer, respectively (1). In clinical practice, surgical resection
is a common treatment for CRC (2).
However, approximately 50–60% of patients diagnosed with CRC have
metastasis and 80–90% of them are unresectable liver metastases
(3,4). In recent years, cancer immunotherapy
has become an important means of cancer treatment (5), and it is one of the hotspots in the
field of cancer research. However, the complex components and
heterogeneity of the tumor microenvironment pose a huge challenge
to cancer immunotherapy.
The tumor microenvironment, which is composed of
molecules such as immune cells and mesenchymal cells, is the cell
environment in which the tumor is located (6). A pan-immune immunogenomic analysis
revealed that numerous tumor-infiltrating lymphocytes associated
with adaptive immunity are associated with a good prognosis,
including activated CD8+ T cells, resting memory
CD4+ T cells and effector memory CD4+ T cells
(7). To achieve precise
immunotherapy, studies have defined the tumor mutation burden (TMB)
by the number of mutations per megabase of DNA, as a predictive
biomarker for evaluation (8). The
higher the TMB is associated with the likelihood of the tumor being
sensitive to immunotherapies (9).
Immune cells are the major non-tumor component of a tumor
microenvironment and have been indicated to be valuable for the
diagnosis and prognostic assessment of patients with CRC (10). Recently, an algorithm called
ESTIMATE, which calculates an immune score based on specific gene
expression characteristics of immune cells, was used to predict the
infiltration of non-tumor cells (11). Subsequent studies have demonstrated
the effectiveness of this big data-based algorithm (12–14).
Using the CRC cohort data from The Cancer Genome
Atlas (TCGA) database and immune scores derived from the ESTIMATE
algorithm, the present study investigated whether tumors with a
higher mutation burden, neoantigen burden and a greater
infiltration degree of 22 immune cell subsets are associated with
higher immune scores.
Materials and methods
Data sources and preprocessing
All genomic, clinical and mutation annotation format
(MAF) data were obtained from TCGA CRC cohorts in February 2019
according to the following specific parameters: The major site was
the colon or rectum and the experimental strategy was RNA
sequencing. First, the samples with survival times of <30 days
were discarded and the samples without complete clinical
information or MAF data were removed. Finally, the data of 432
tumor samples with 18 matched normal samples were retained.
The gene expression data in fragments per kilobase
of transcript per million mapped reads format were also retrieved
from TCGA and converted to transcripts per million (TPM). The
immune scores and stromal scores were calculated by using the
ESTIMATE algorithm based on the expression values in TPM (11). By comparing the differences in
overall survival (OS), the optimal threshold for immune score
grouping was determined. When the patient's immune score was above
this threshold, the sample was assigned to the high immune score
(HIM) group and otherwise to the low immune score (LIM) group.
The data used for verification were downloaded from
Gene Expression Omnibus (GEO, http://www.ncbi.nlm.nih.gov/geo/) and relevant
datasets were identified using the following key words:
(‘colorectal cancer’ OR ‘colon cancer’) AND (‘prognosis’ OR
‘prognostic’ OR ‘survival’) AND (‘Homo sapiens’). Datasets obtained
by sequencing using the GPL570 platform were selected and certain
datasets were excluded. Duplicates and datasets with small sample
sizes (n<50) were also excluded. The datasets GSE17536 and
GSE21510 associated with CRC were finally selected and merged into
a combined dataset. Gene probe names were transformed into gene
names based on platform annotation files. Subsequently, the gene
expression data for each sample and the corresponding clinical
information were organized for further analysis.
Functional analysis in silico
The immune cytolytic activity scores were obtained
by the geometric mean of the Granzyme A (GZMA) and Perforin 1
(PRF1) expression values in TPM (15). The data regarding microsatellite
stable (MSS) or microsatellite instability-high (MSIH) status for
291 TCGA CRC samples were also obtained (16). The consensus molecular subtypes
(CMSs) classification classifies CRC into four molecular subtypes
(CMS1, CMS2, CMS3 and CMS4) with distinct biological
characteristics. The samples in the HIM and LIM groups were
classified according to the CMS system using the R package
CMScaller (17).
The immune-associated genes were downloaded from the
immunology database and analysis portal (ImmPort; http://immport.niaid.nih.gov) (18). These immune-associated genes have a
variety of roles in immune pathways. After filtering out the
synonymous variants and variants in intergenic or noncoding
regions, the maftools package (19)
was used for mutation burden analyses and mutational spectral
visualization. The neoantigens for each sample and neoantigen
origin protein information were downloaded from The Cancer Immune
Atlas (TCIA; http://tcia.at/home).
To evaluate tumor-infiltrating immune cell (TIIC)
composition in CRC, the CIBERSORT deconvolution algorithm (20) was used to estimate the proportion of
22 immune cell types in HIM and LIM.
Differentially expressed mRNAs between samples from
the HIM and LIM groups were screened using edgeR (21) with the criteria of
|log2fold change| >1.5 and a false discovery rate
(FDR) <0.01. The TIMER online database (22) was used to analyze and visualize the
abundance of TIICs according to differentially expressed genes.
Cytoscape software (23) (two
plugins: ClueGO and CluePedia) was used for the Kyoto Encyclopedia
of Genes and Genomes analyses and only pathways with P<0.05 were
considered. The GeneMANIA (24)
plugin was also employed to investigate the functional association
of the differentially expressed mRNAs between samples from the HIM
and LIM groups.
Statistical analysis
All statistical analyses were performed using R
software (version 3.5.0) and Bioconductor (https://www.bioconductor.org/). An unpaired t-test was
used to compare differences in various parameters (including
stromal scores, cytolytic activity scores, and MSS vs. MSIH status)
between samples from the HIM and LIM groups, and to compare the
non-synonymous mutation burden in the HIM. A Wilcoxon rank sum test
was used to examine differences in medians. Kaplan-Meier curve
analyses using the survival package version 3.2 (25) were performed to analyze the
association between the mRNA expression profiles and OS. P<0.05
was considered to indicate statistical significance.
Results
Immune scores, sample grouping and
demographic statistics
The gene expression profiles and clinical
information of all 432 patients with CRC from the TCGA database
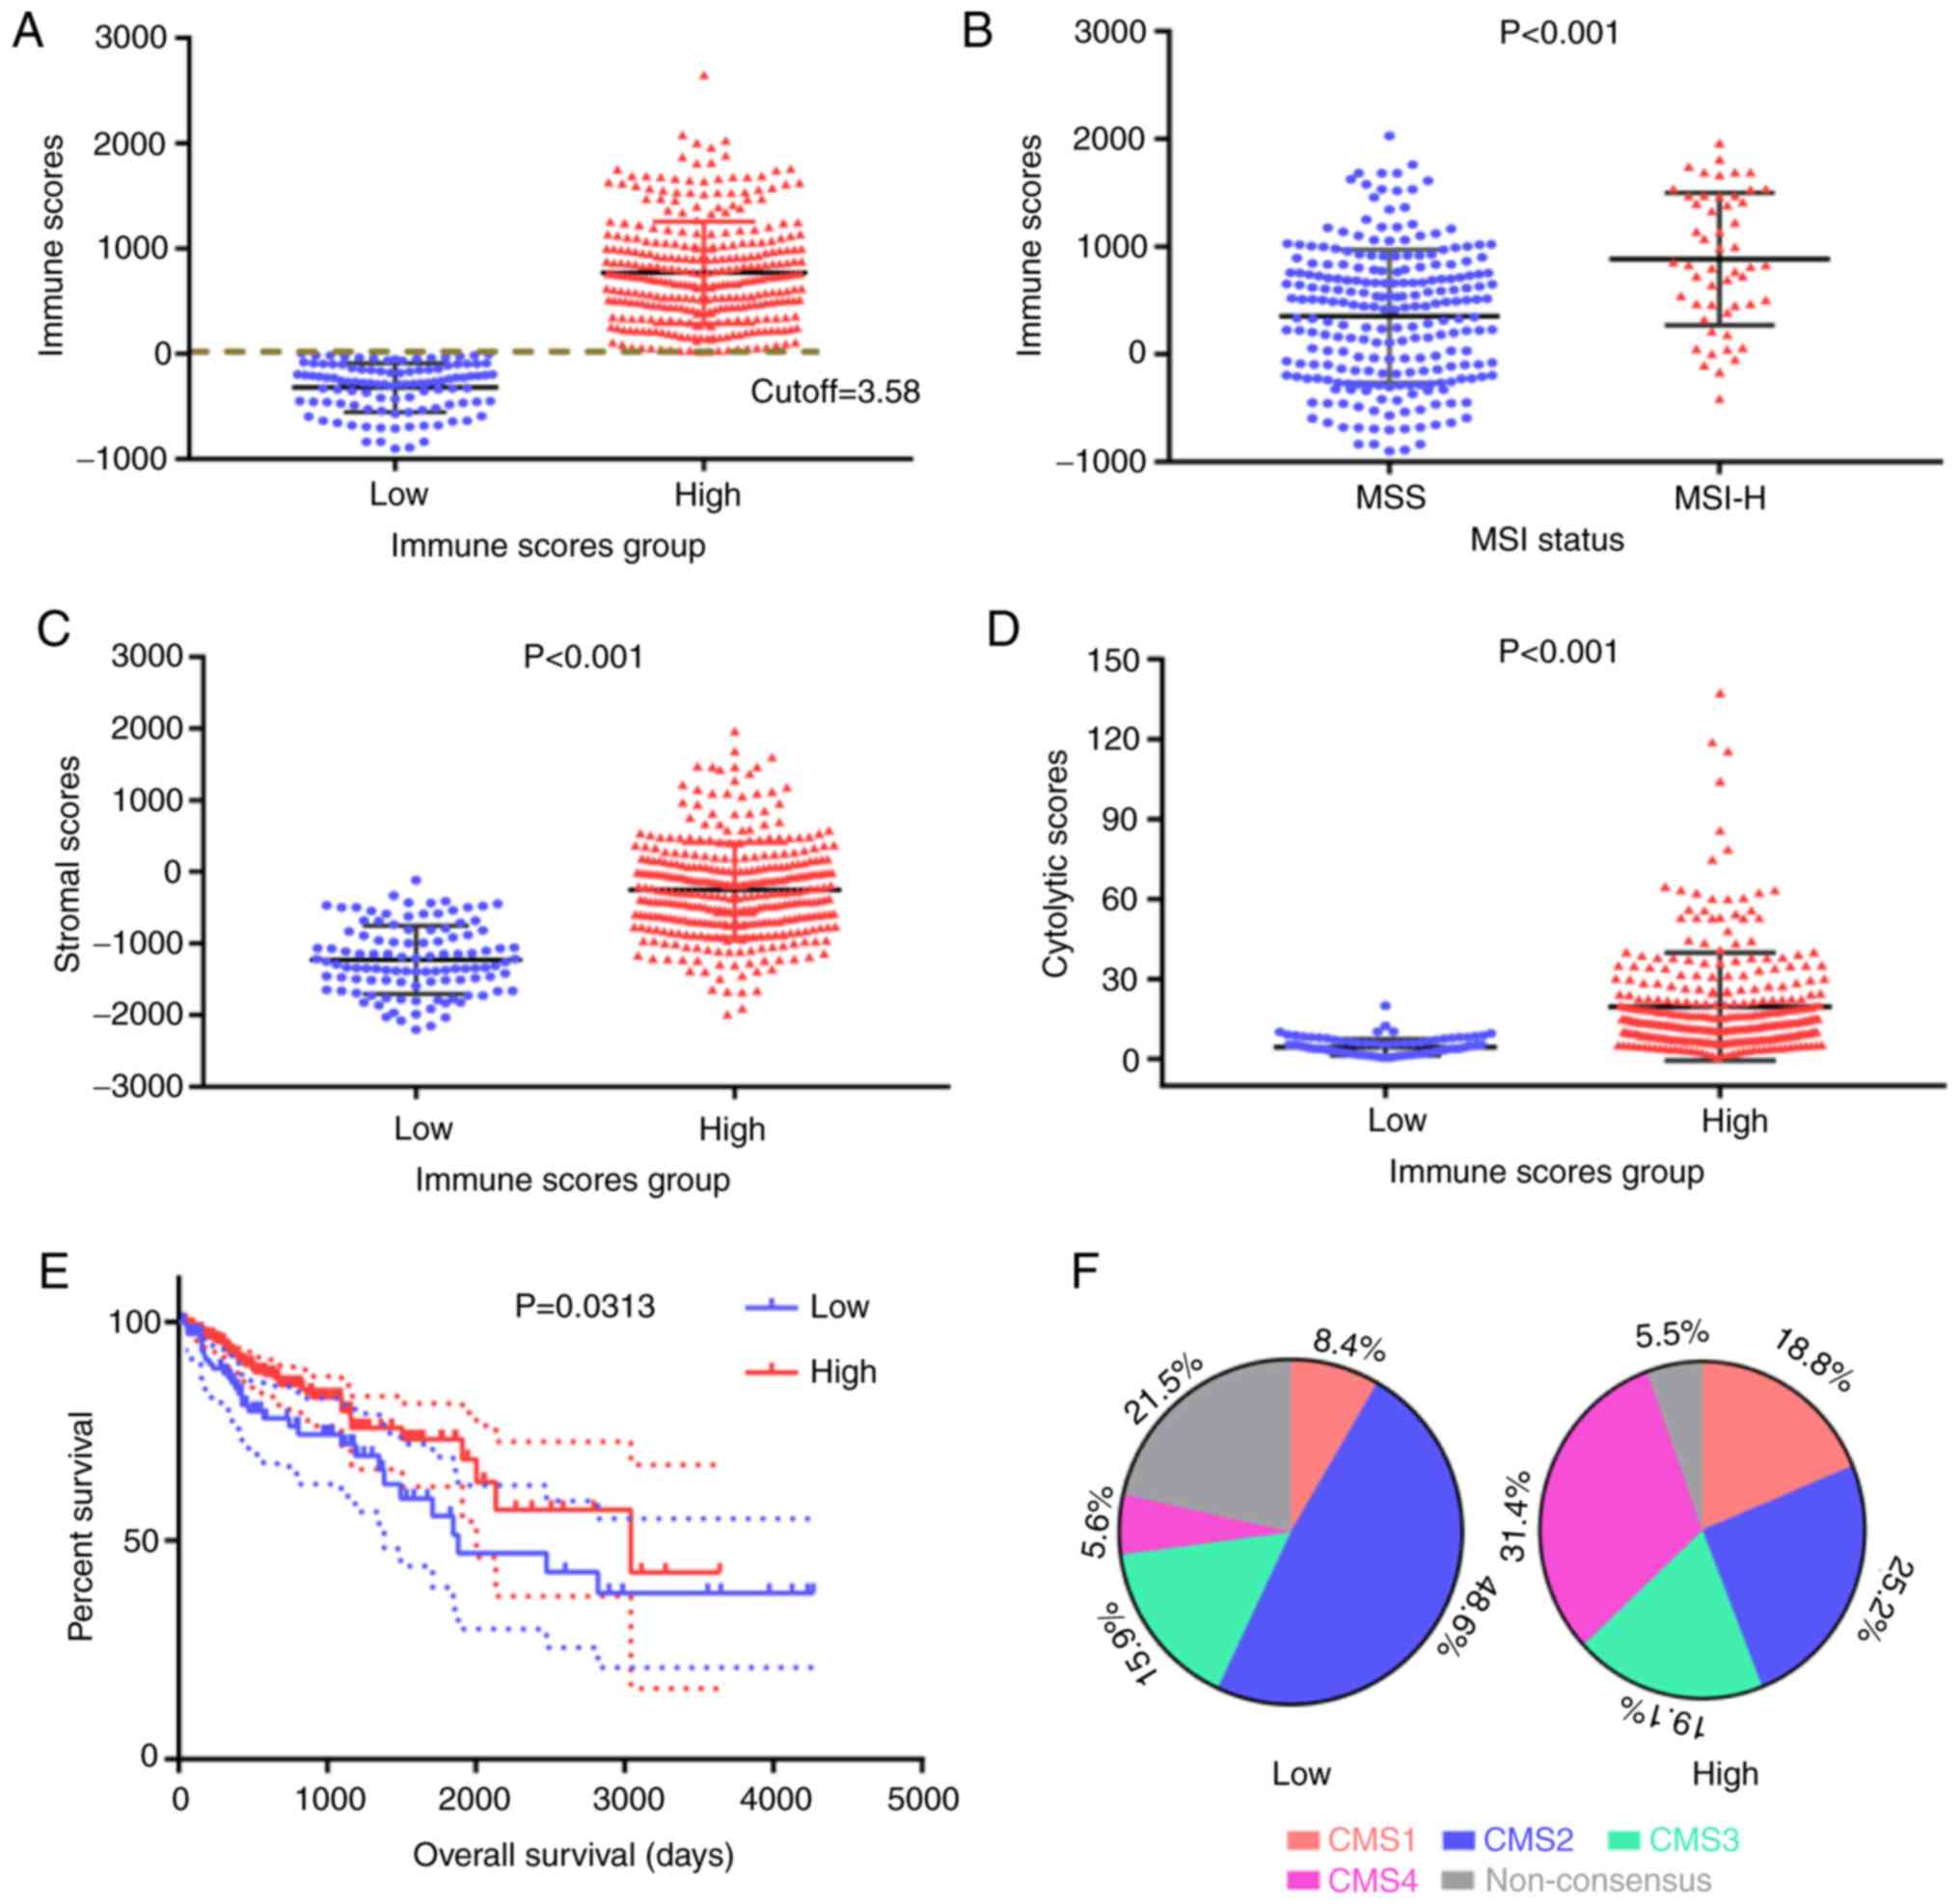
were retrieved. Based on the ESTIMATE algorithm, the immune scores
were distributed between −899.56 and 2,999.28 (Fig. 1A). The optimal threshold for dividing
samples into the HIM and LIM groups was determined using the
function surv_cutpoint of the survival package in R (cutoff=3.58).
The detailed clinical and pathological characteristics of the study
population in HIM and LIM, including age, sex, ethnicity,
pathological stage, tumor (T) stage, nodal (N) stage and metastasis
(M) stage, are summarized in Table
I. The median age for all patients was 60 years (interquartile
range, 31–90 years). Of the total patients, the HIM group contained
171 (52.6%) male and 154 (47.4%) female and the LIM group contained
24 (22.4%) male and 83 (77.6%) female.
 | Table I.Clinicopathological features of the
patients with colorectal cancer (n=432). |
Table I.
Clinicopathological features of the
patients with colorectal cancer (n=432).
| Subtype | HIM (n=325) | LIM (n=107) |
|---|
| Age (years) |
|
|
|
>60 | 243 (74.8) | 74 (69.2) |
|
≥60 | 82
(25.2) | 33 (30.8) |
| Sex |
|
|
|
Male | 171 (52.6) | 24 (22.4) |
|
Female | 154 (47.4) | 83 (77.6) |
| Ethnicity |
|
|
|
Caucasian | 157 (48.3) | 56 (52.3) |
|
Asian | 9
(2.8) | 4
(3.7) |
| Black
or African American | 30
(9.2) | 27 (25.2) |
|
Unknown | 129 (39.7) | 20 (18.7) |
| Pathologic
stage |
|
|
| Stage
I | 63
(19.4) | 14 (13.1) |
| Stage
II | 127 (39.1) | 38 (35.5) |
| Stage
III | 85
(26.2) | 31 (29.0) |
| Stage
IV | 39
(12.0) | 22 (20.6) |
|
Unknown | 11
(3.4) | 2
(1.9) |
| Pathologic T
stage |
|
|
| T1 | 6
(1.8) | 3
(2.8) |
| T2 | 66
(20.3) | 13 (12.1) |
| T3 | 214 (65.8) | 77 (72) |
| T4 | 39
(12) | 14 (13.1) |
| Pathologic M
stage |
|
|
| M0 | 251 (77.2) | 67 (62.6) |
| M1 | 48
(14.8) | 32 (29.9) |
| MX | 35
(10.8) | 18 (16.8) |
| Pathologic N
stage |
|
|
| N0 | 200 (61.5) | 57 (53.3) |
| N1 | 68
(20.9) | 29 (27.1) |
| N2 | 58
(17.8) | 21 (19.6) |
| Survival
status |
|
|
|
Alive | 279 (85.8) | 75 (70.1) |
|
Dead | 46
(14.2) | 32 (29.9) |
Comparison of characteristics between
the HIM and LIM groups
Immune scores represent the infiltration of immune
cells in tumor tissues. It was indicated that MSIH tumors were
associated with higher immune scores compared with MSS tumors
(P<0.001; Fig. 1B). Furthermore,
samples in the HIM group had higher stromal scores than those in
the LIM group (P<0.001; Fig. 1C),
indicating a positive association between immune and stromal
scores. In addition, the association of the immune score and
cytolytic activity score in CRC was examined. Of note, the
distribution of cytolytic activity scores in the HIM and LIM groups
was similar to that of the stromal scores, with a significantly
higher score in the HIM group (P<0.001; Fig. 1D).
A Kaplan-Meier survival curve analysis was also
performed, indicating that OS in the HIM group was longer than that
in the LIM group (P=0.0313 according to the log-rank test; Fig. 1E). CMSs based on gene expression
profiles provide a biological stratification framework with great
potential for biomarker development. The distribution of CMS
subtypes in the HIM and LIM groups is presented in Fig. 1F. In the LIM group, CMS2 accounted
for almost half of the cases (48.6%), while in the HIM group, the
other CMSs were comparatively more prevalent, particularly CMS4
(Fig. 1F).
Landscape of immune infiltration in
HIM CRC
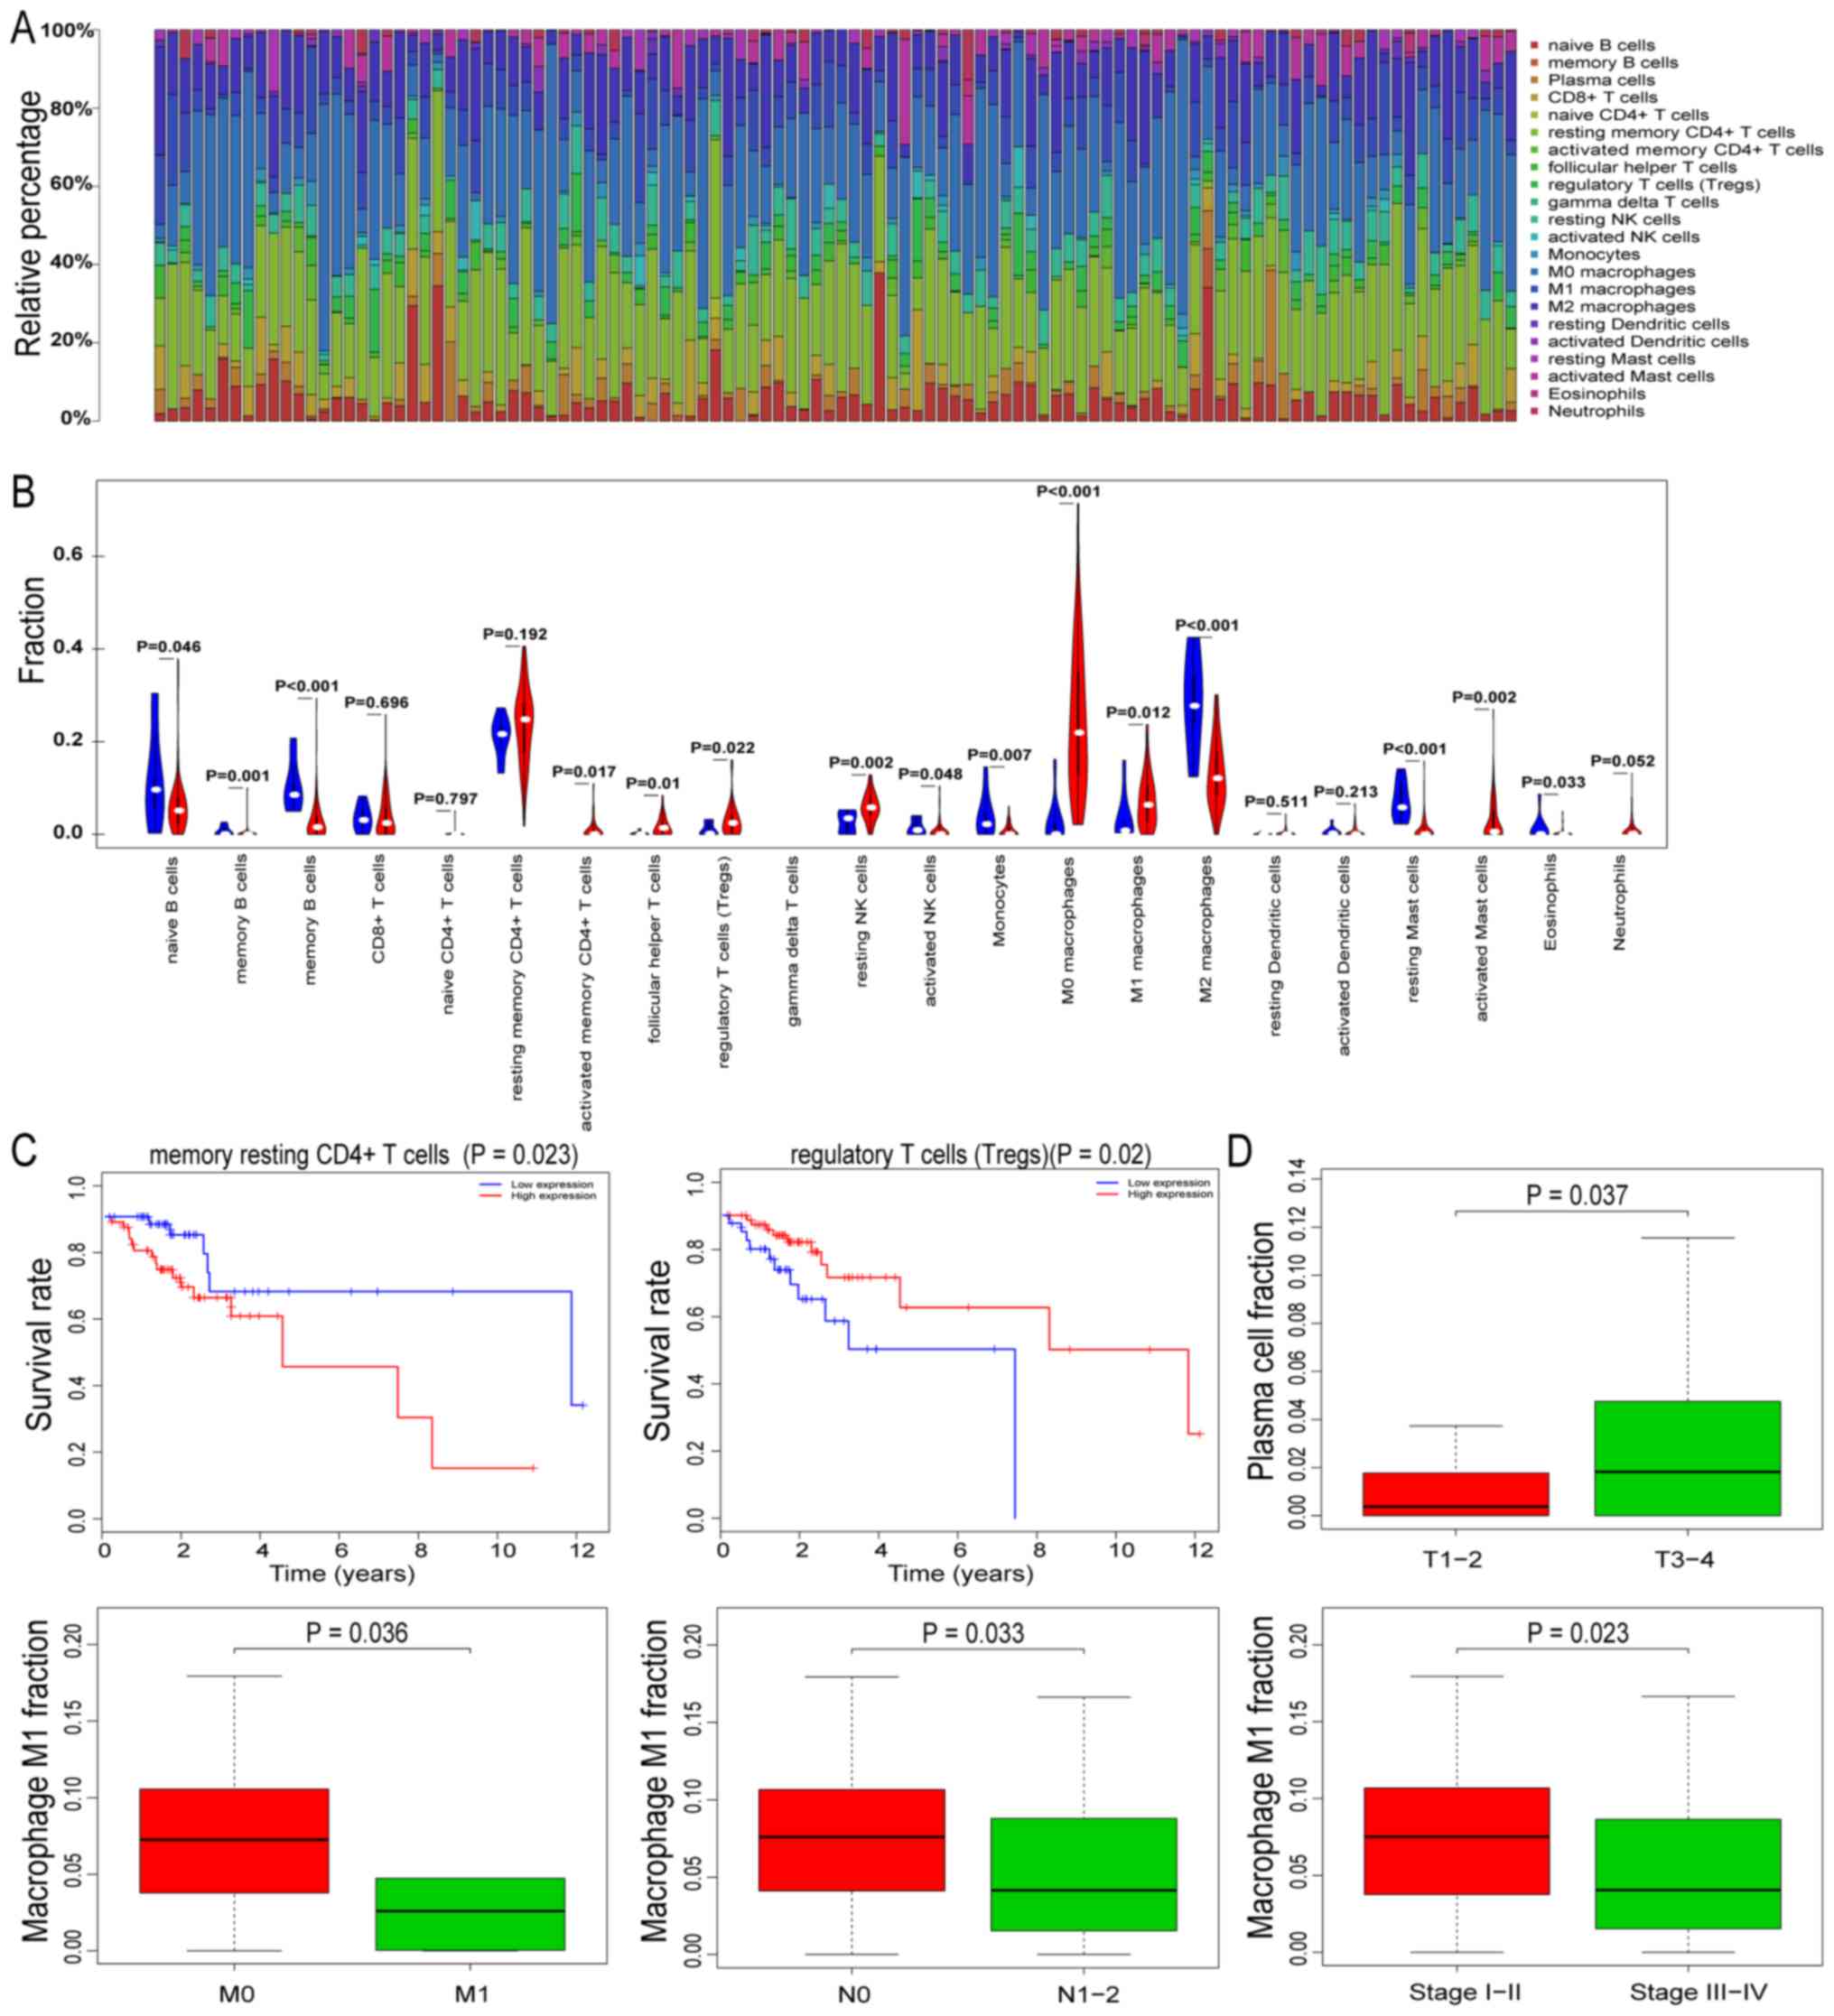
To further analyze the differences in immune cell
invasion between the HIM and LIM groups, the CIBERSORT algorithm
was used to investigate the differences in the proportion of 22
immune cell subsets between samples from the two groups. The
differences in the proportion of 22 immune cell types detected in
all LIM samples were not significant (P>0.05). Fig. 2A presents the immune cell
distribution in the HIM samples. Of note, the analysis indicated
that gamma delta T cells were not present in any of the
samples.
Differences in the proportion of TIICs between the
normal tissue samples and HIM samples were then analyzed. Compared
with the normal tissues, there were significant changes in the
proportion of 15 TIICs in the HIM samples (Fig. 2B). In the HIM samples, naïve B cells,
memory B cells, plasma cells, activated natural killer (NK) cells,
monocytes, M2 macrophages, resting mast cells and eosinophils
decreased significantly, while activated memory CD4+,
follicular helper T cells, regulatory T cells, resting NK cells, M0
macrophages, M1 macrophages and activated mast cells were
significantly increased.
Prognostic value of immune
infiltration in HIM
To determine the prognostic capacity of TIICs in
CRC, a survival analysis was performed based on the proportion of
immune cells in HIM samples. It was indicated that resting memory
CD4+ T cells and regulatory T cell levels were
associated with survival in patients with CRC (Fig. 2C). Of note, patients with CRC and low
proportions of resting memory CD4+ T cells had
significantly longer survival times than the patients with high
proportions.
To further investigate whether TIICs are involved in
the development and progression of CRC, the HIM samples were
divided into several subgroups based on the pathological TNM stage
(T3+T4 vs. T1+T2,
N2+N3 vs. N0+N1,
M1 vs. M0) and pathological stage (I–II vs.
III–IV). Comparative analyses of the TIIC proportions indicated
that plasma cells demonstrated a statistically significant
association with the pathological T stage (P=0.037). Furthermore,
M1 macrophages were significantly associated with multiple types of
clinical stage (Fig. 2D).
Mutation burden in relation to immune
scores
A high mutation burden is one of the characteristics
of malignant tumors. To obtain the burden of non-synonymous
mutations in HIM and LIM samples, the somatic mutations detected by
the mutect2 software in the two groups were analyzed. The median
non-synonymous mutation burden was 111.5 in HIM samples and 96 in
LIM samples (Fig. S1). The
mutational patterns of the highly mutated genes were distinct
between HIM and LIM. As presented in Fig. 3A and B, APC regulator of WNT
signaling pathway (APC), tumor protein p53 (TP53), titin (TTN),
KRAS proto-oncogene (KRAS) and phosphatidylinositol-4,
5-bisphosphate 3-kinase catalytic subunit α (PIK3CA) were among the
top 10 mutated genes in HIM and LIM samples. It was further
identified that most of the mutations were single base
substitutions and the substitution of C->T was the most common
type in all samples (Fig. 3C and
D).
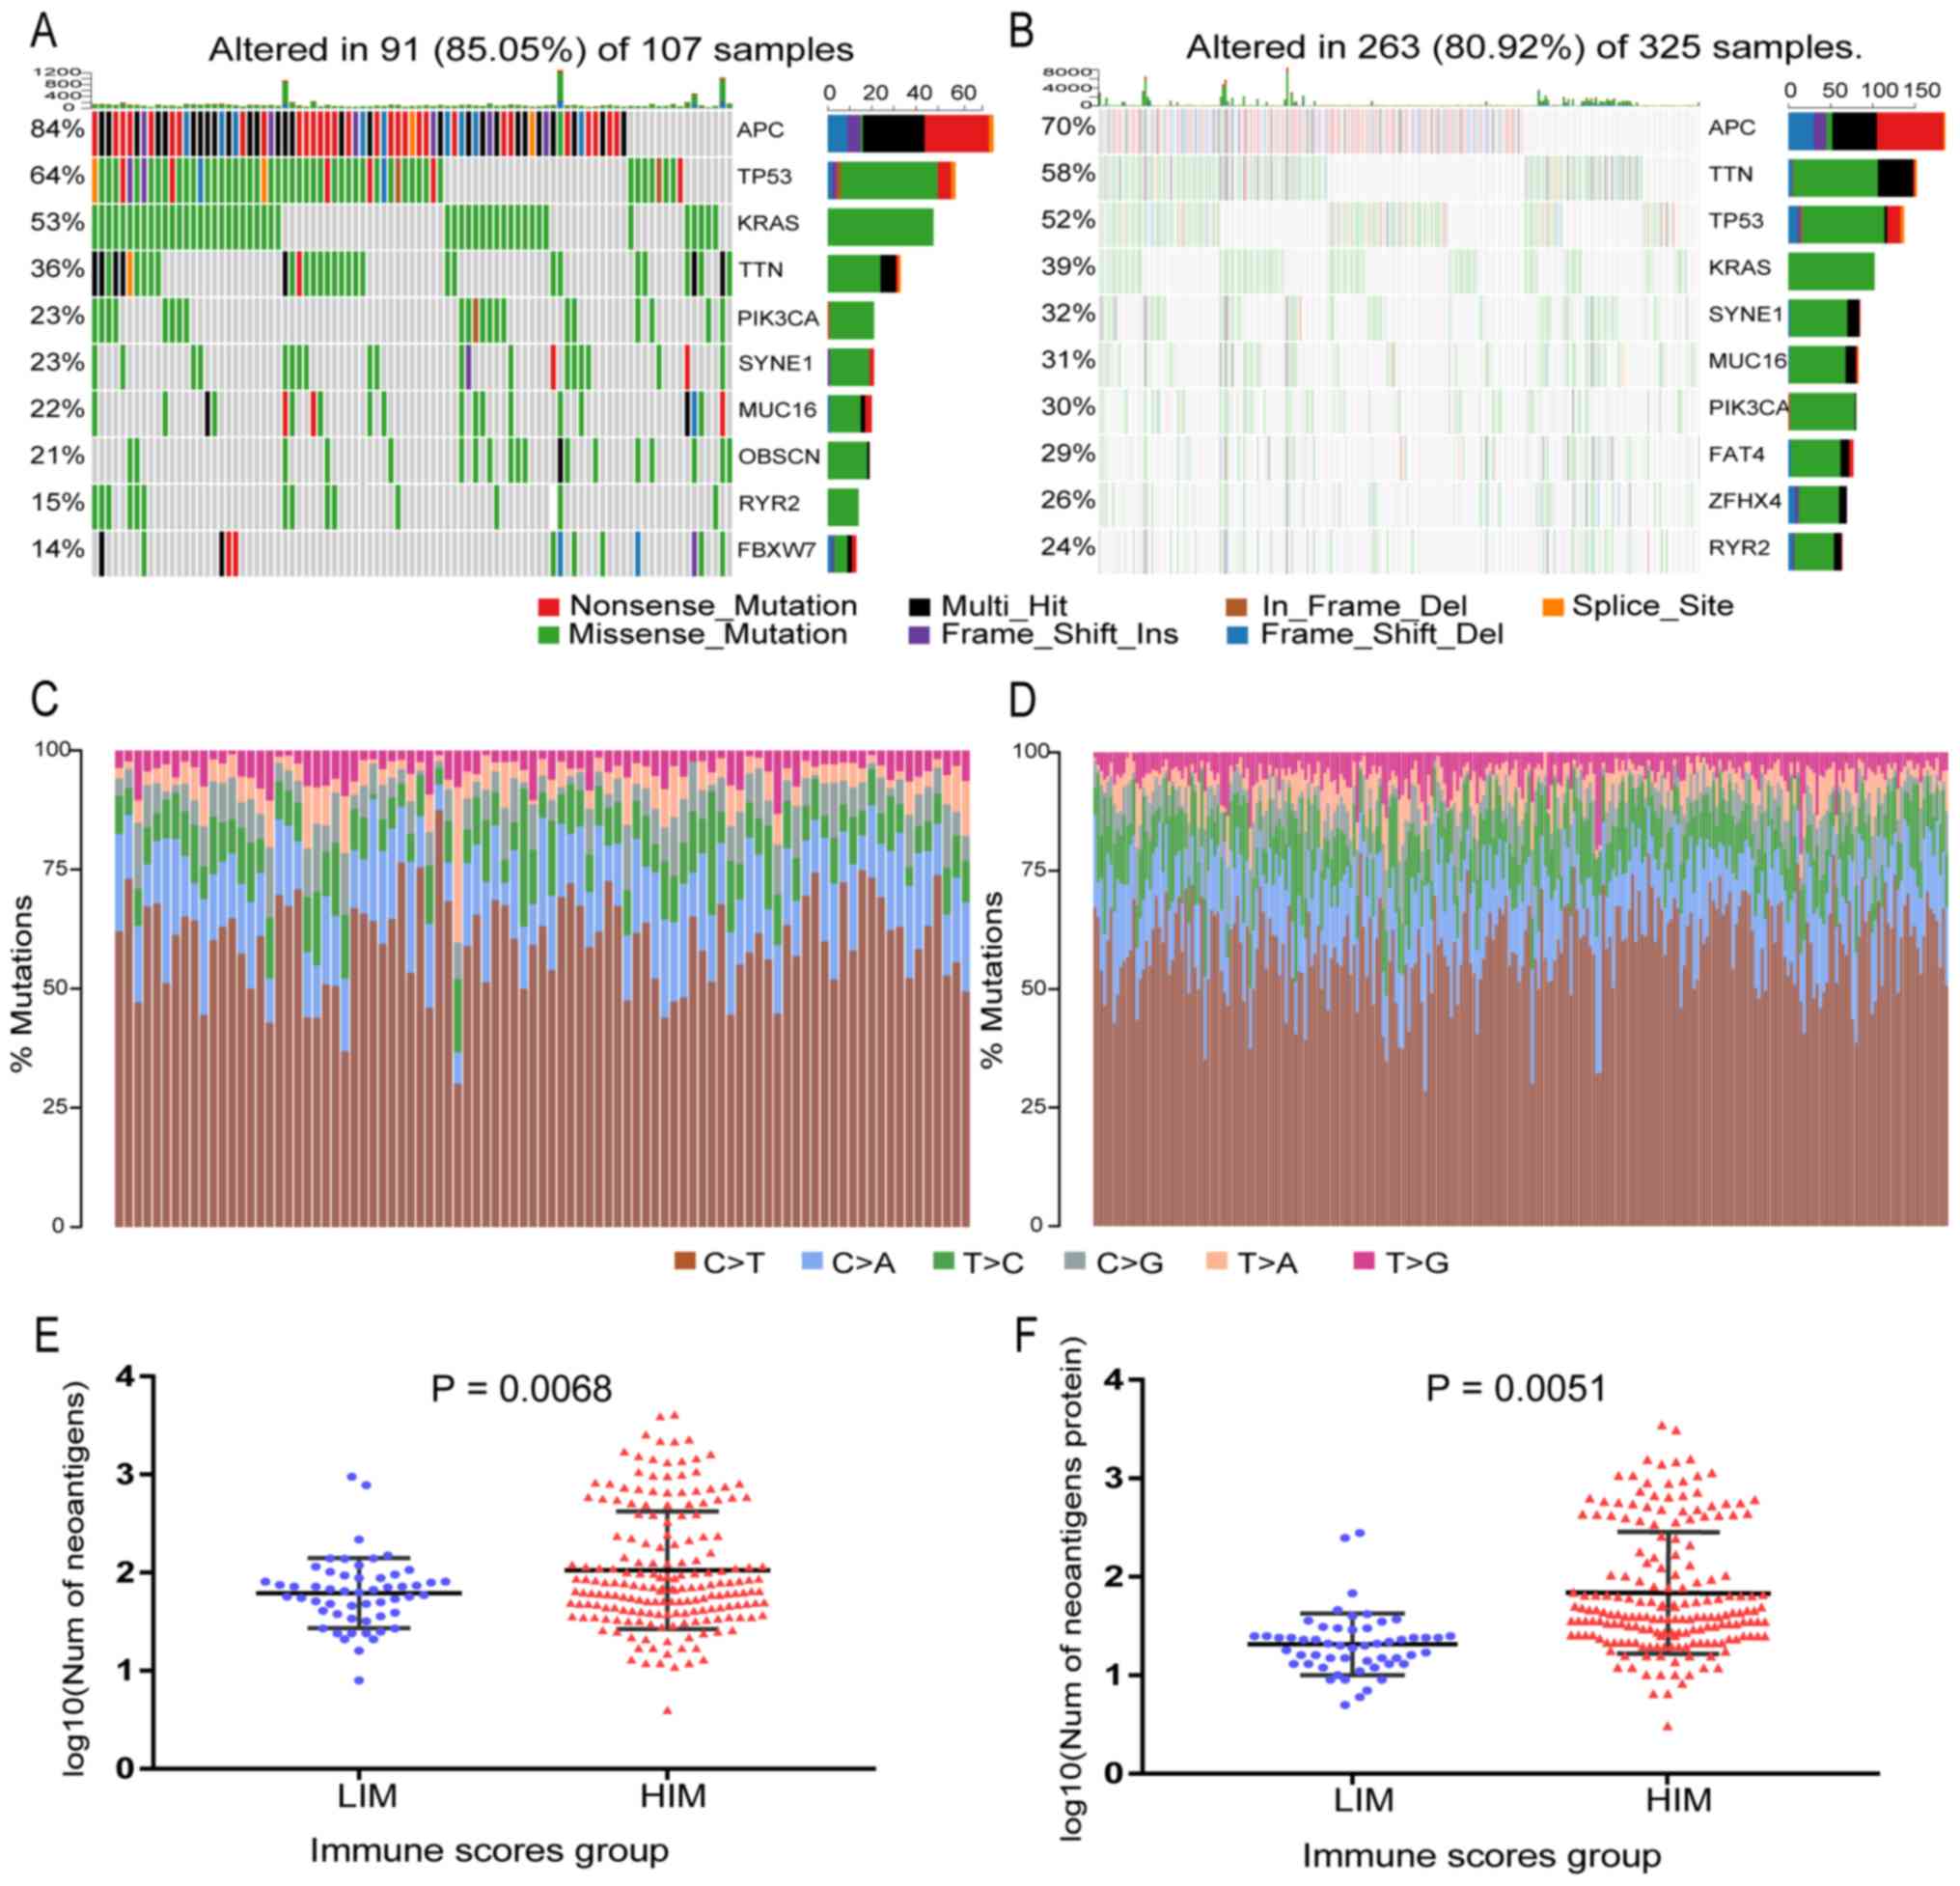 | Figure 3.Landscape of mutations in colorectal
cancer and a comparison of neoantigens between HIM and LIM samples,
including the top 10 most mutated genes for (A) LIM samples and (B)
HIM samples. The right stacked bar graph of each figure displays
the number of variant types. Substitution distribution for each (C)
LIM sample and (D) HIM sample. (E) Plots of the number of
neoantigen peptides. (F) Plots of the number of Neoantigen-related
proteins. Graph indicating a significant difference in neoantigen
burden between HIM and LIM samples (P<0.05). HIM, high immune
score; LIM, low immune score; Ins, insertion; Del, deletion; Num,
number; APC, APC regulator of WNT signaling pathway; TP53, tumor
protein p53; KRAS, KRAS proto-oncogene, GTPase; TTN, titin; PIK3CA,
phosphatidylinositol-4, 5-bisphosphate 3-kinase catalytic subunit
alpha; SYNE1, spectrin repeat containing nuclear envelope protein
1; MUC16, mucin 16, cell surface associated; OBSCN, obscurin,
cytoskeletal calmodulin and titin-interacting RhoGEF; RYR2,
ryanodine receptor 2; FBXW7, F-box and WD repeat domain containing
7; FAT4, FAT atypical cadherin 4; ZFHX4, zinc finger homeobox
4. |
Neoantigen burden in association with
immune scores
It was also investigated whether the
mutational/neoantigen patterns were associated with the immune
scores. The neoantigen counts and neoantigen origin protein counts
for each CRC sample were obtained from the TCIA database. The LIM
samples had a significantly lower neoantigen burden (Wilcoxon
rank-sum test P=0.0068; Fig. 3E) and
neoantigen origin protein burden (P=0.0051; Fig. 3F) than the samples from the HIM
group, which suggested that the HIM samples had a higher number of
mutations accumulated in the tumor cell genome than the LIM
samples, resulting in a corresponding increase in neoantigen burden
and thereby activating more T cells and producing a stronger immune
response.
Comparison of gene expression profiles
with immune scores
To reveal the correlation between gene expression
profiles and immune scores, a differential analysis of the count
data of the genes in the samples from the HIM and LIM groups was
performed. As indicated in the volcano plots in Fig. 4A, 80 genes were upregulated and 1,630
genes were downregulated in the high score group compared with the
low score group (|log2fold change|>1.5 and
FDR<0.05). A total of 283 differentially expressed genes were
identified from 1,378 immune-associated genes. To outline the
potential function of the differentially expressed genes,
functional enrichment (GO and KEGG) analysis of the 283 genes was
performed (Figs. 4B and S2). The aforementioned genes were enriched
in some immune-related pathways, such as B cell receptor signaling
pathway, Natural killer cell mediated cytotoxicity and Fc gamma
R-mediated phagocytosis. Besides, they were also enriched in
disease-related pathways, such as transcriptional misregulation in
cancer and inflammatory bowel disease (Figs. 4B and S2).
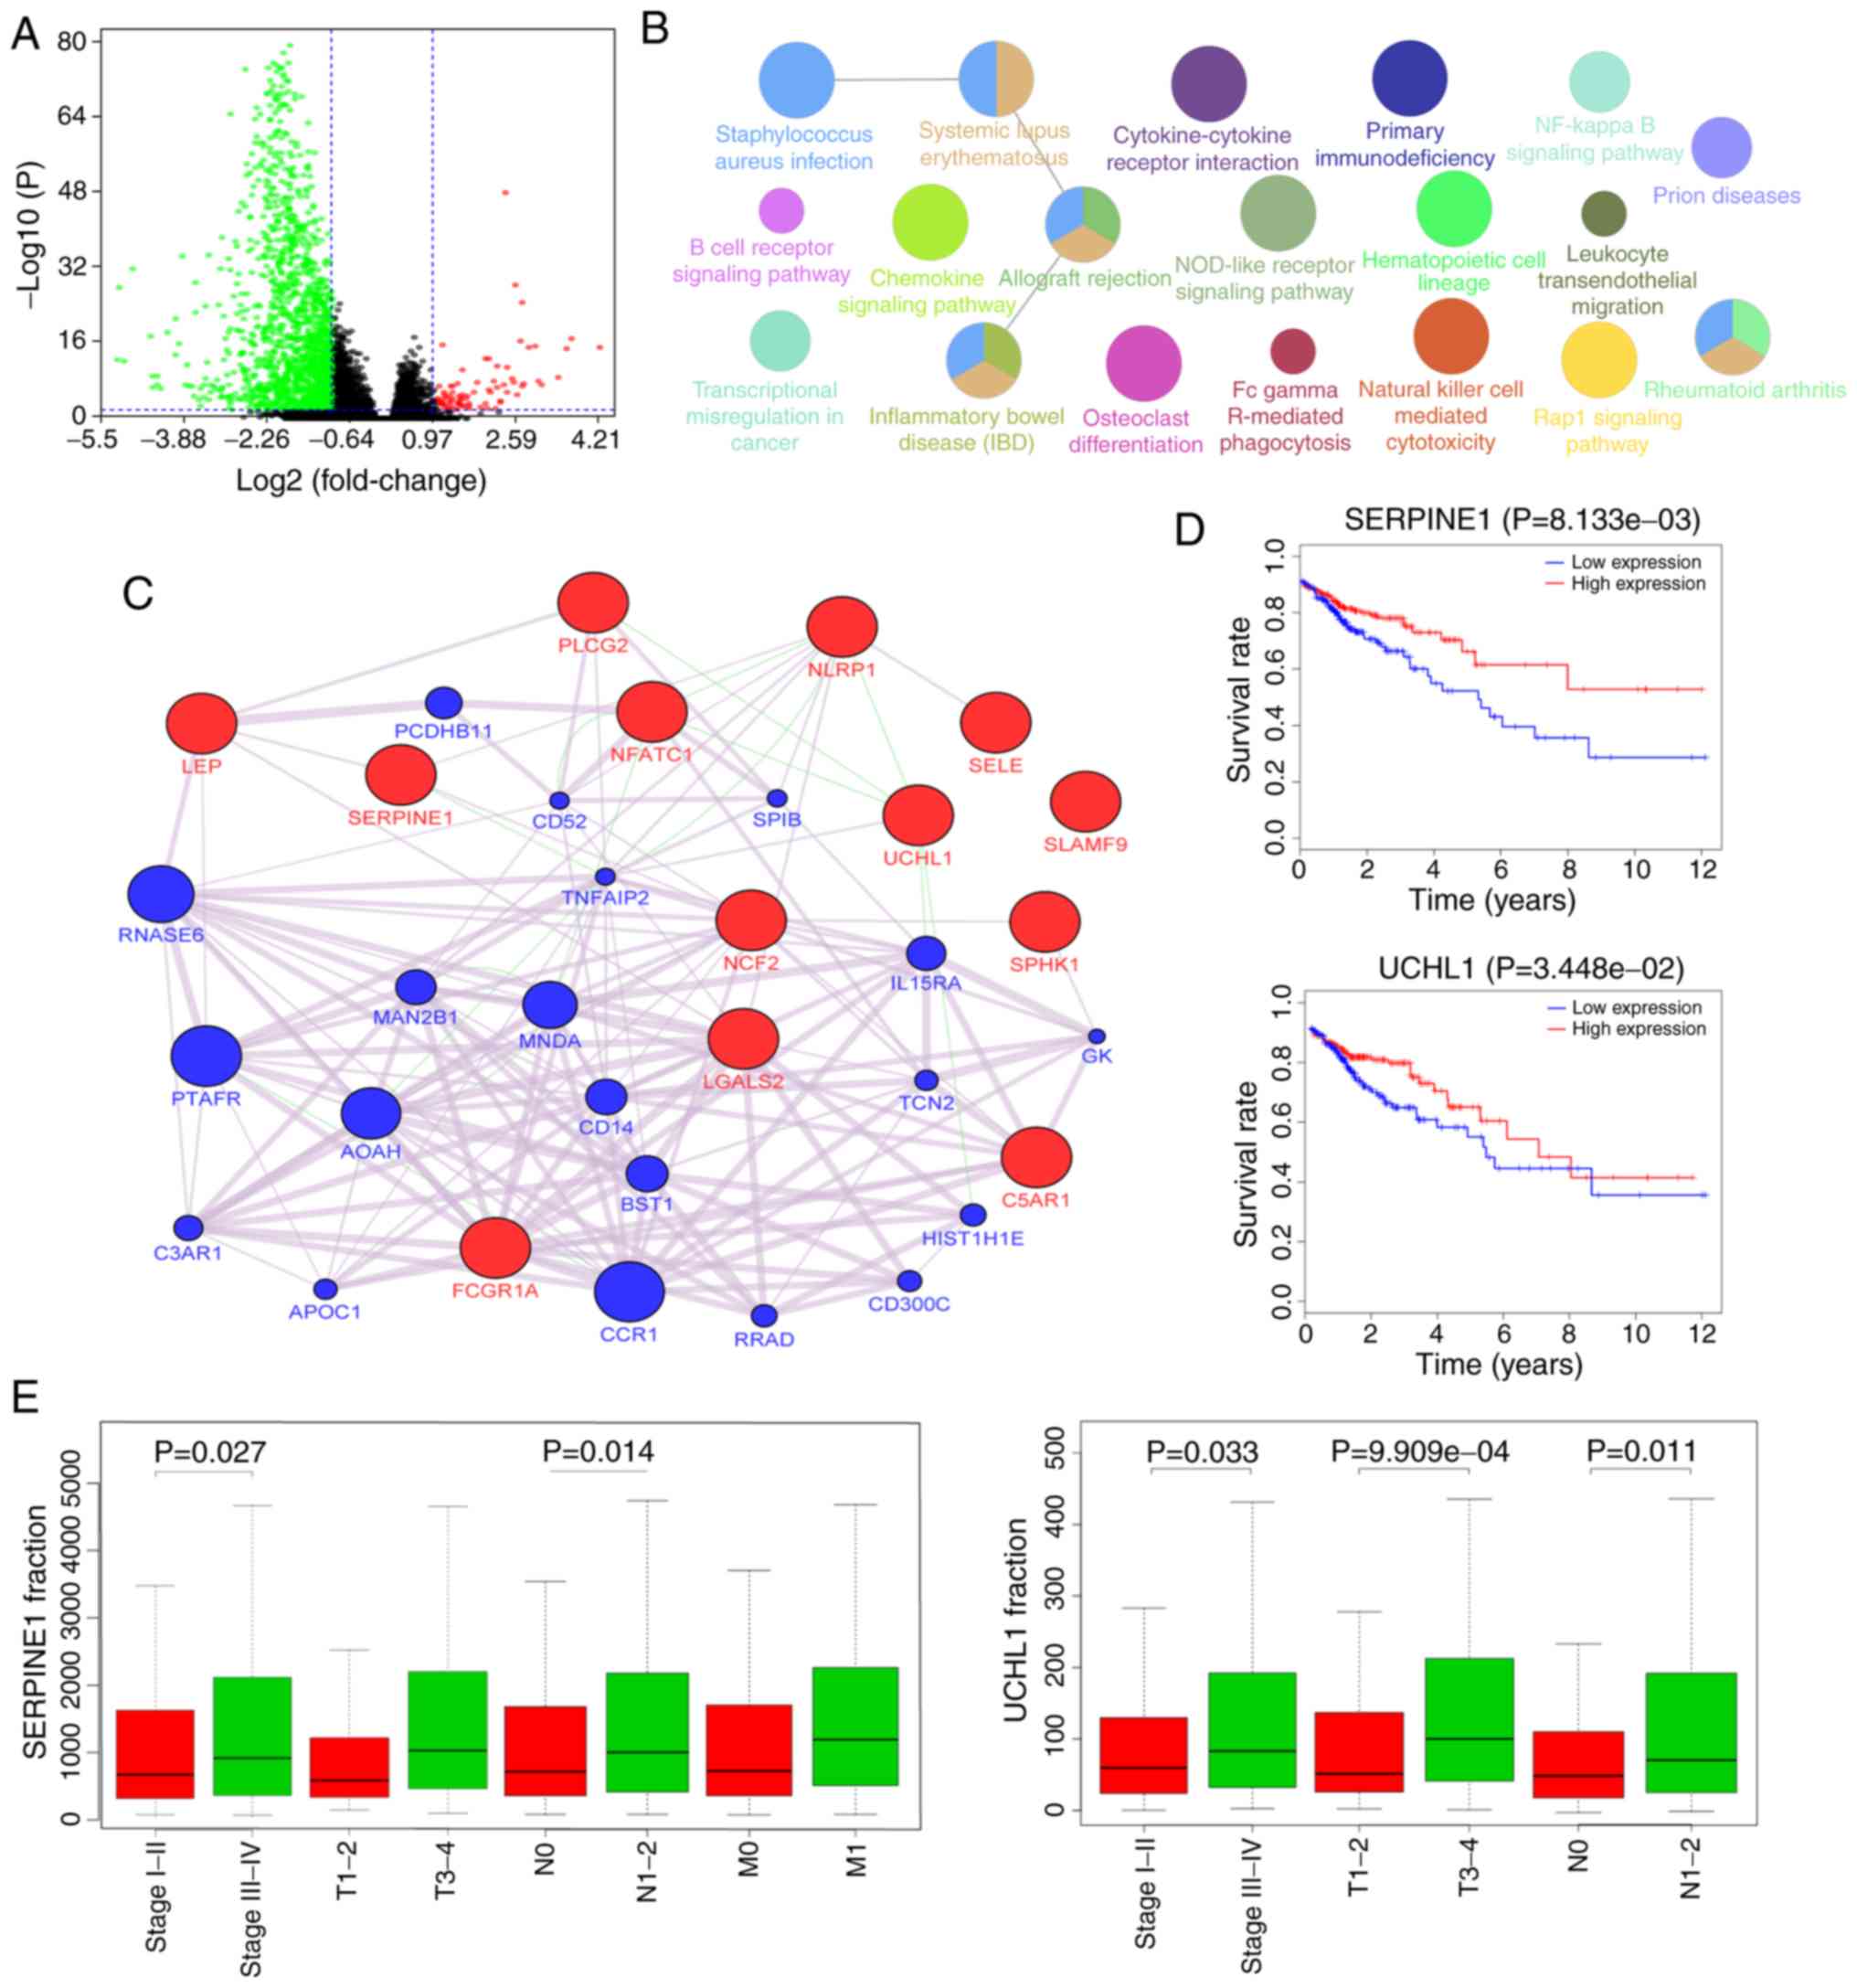 | Figure 4.Gene expression spectrum. (A) Volcano
plot of differentially expressed genes between HIM and LIM samples.
The three colored dots represent different types of mRNAs, among
which green represents a significant downregulation, red represents
a significant upregulation and black represents no significant
differential expression. (B) Kyoto Encyclopedia of Genes and
Genomes pathway analysis of 283 differentially expressed genes. (C)
GeneMANIA network of 13 genes significantly correlated with the
survival of patients with colorectal cancer. The query genes are
red and their interacting genes are blue. (D) Survival analysis for
SERPINE1 and UCHL1. The red lines denote high expression of the
gene and the blue lines denote low expression. (E) SERPINE1 and
UCHL1 are related to the progression of CRC. SERPINE1, serpin
family Emember 1; UCHL1, ubiquitin C-terminal hydrolase L1; LEP,
leptin; PLCG2, phospholipase C gamma 2; NLRP1, NLR family pyrin
domain containing 1; SELE, selectin E; SERPINE1, serpin family E
member 1; NFATC1, nuclear factor of activated T cells 1; SLAMF9,
SLAM family member 9; UCHL1, ubiquitin C-terminal hydrolase L1;
NCF2, neutrophil cytosolic factor 2; SPHK1, sphingosine kinase 1;
LGALS2, galectin 2; C5AR1, complement C5a receptor 1; FCGR1A, Fc
fragment of IgG receptor Ia; PCDHB11, protocadherin beta 11; CD52,
CD52 molecule; SPIB, Spi-B transcription factor; RNASE6,
ribonuclease A family member k6; TNFAIP2, TNF alpha induced protein
2; PTAFR, platelet activating factor receptor; MNDA, myeloid cell
nuclear differentiation antigen; IL15RA, nterleukin 15 receptor
subunit alpha; AOAH, acyloxyacyl hydrolase; CD14, CD14 molecule;
BST1, bone marrow stromal cell antigen 1; C3AR1, complement C3a
receptor 1; CCR1, C-C motif chemokine receptor 1; CD300C, CD300c
molecule; GK, glycerol kinase. |
Potential function of differentially
expressed genes
Kaplan-Meier curve analysis with the log-rank test
for each of the 283 genes provided 13 genes whose expression was
significantly correlated with the survival of the patients with
CRC. To investigate the functional association of the 13 genes, the
genes were analyzed using the GeneMANIA plugin of Cytoscape to
generate an interaction network (Fig.
4C). Most of the network interactions were coexpression. The
Kaplan-Meier survival curves that were significantly different for
the 13 genes (high vs. low expression) are presented in Figs. 4D and S3. Further clinical analysis of these
genes demonstrated that the SERPINE1 and UCHL1 were significantly
associated with multiple types of clinical stage (Fig. 4E). The association between the
expression profiles of these two genes and TIICs was also analyzed
and it was revealed that their copy number variation was
significantly associated with changes in the proportion of multiple
types of TIIC, such as B cells, CD8+ T cells,
neutrophils and dendritic cells (Fig.
S4).
Comprehensive validation in GEO
datasets
To examine the universality of the results from the
TCGA cohort, the GSE17536 and GSE21510 datasets were analyzed for
validation. After batch correction (Fig. S5A), the same cutoff as that for the
TCGA sample analysis was used to stratify all GEO samples into HIM
and LIM groups. Due to the particularity of HIM samples, the
CIBERSORT algorithm was used to assess the difference in the
proportion of 22 immune cell subsets in these samples (Fig. S5B). It was revealed that the
proportions of the immune cell subsets in the TCGA and GEO datasets
were similar. In addition, differential analysis of gene count data
in samples with HIM and LIM revealed that SERPINE1 was still
significantly differentially expressed (|log2fold
change|>1.5, P=0.00142). However, the difference in UCHL1
expression was not significant.
Discussion
The present study sought to identify tumor
microenvironment-associated factors that contribute to the OS of
patients with CRC with HIM or LIM. The results indicated that MSIH
tumors rather than MSS tumors were significantly associated with
high immune scores. A previous study indicated that in CRC, MSIH
tumors have 10s of times more somatic mutations than MSS tumors
(26). Under these conditions,
lymphocyte infiltration is prominent due to increased neoantigen
burdens and more stroma cells are present in tumor tissues
(27). In addition, the cytolytic
activity of tumor cells is positively correlated with the
neoantigen burden (15). In line
with this, the present results suggested that the HIM samples were
characterized by higher cytolytic activity and stromal scores than
LIM samples. This means that the samples in the HIM group had a
good cytolytic immune response and relatively abundant stromal
cells due to the higher levels of TIICs. In addition, a previous
study indicated that cytolytic activity was associated with immune
responses and improved prognoses (28). The present study also indicated
significantly improved OS in patients with HIM vs. LIM.
Using CIBERSORT, the proportional changes of the 22
immune cell subsets in the HIM and LIM samples were analyzed. The
TIIC proportions of the samples in LIM did not meet the criterion
of P<0.05, which was due to their comparatively lower immune
score. It is worth noting that the P-value obtained with CIBERSORT
only reflects one part of a sample that contains immune cells and
non-immune cells. Therefore, P>0.05 does not mean that TIICs do
not exist in LIM samples. However, the present results indicated
that the proportion of TIICs was not significant in samples with
lower immune scores. Tumor-associated microenvironments, which
include immune cells, are able to inhibit malignant cells. Numerous
studies have indicated that the degree of infiltration of immune
cells, tissue localization and cell type are significantly
associated with CRC progression and survival. For instance, the
5-year OS values for stage III CRC patients with lower levels of
TIICs were determined to be significantly lower than those for
stage III CRC patients with high levels of TIICs (29). The present study also indicated that
HIM samples have significant changes in the proportion of TIIC and
the survival time of patients with CRC with high immune scores was
significantly improved. In addition, the present results provided
details on the infiltration of the 22 TIIC subsets in CRC. The
proportions of resting memory CD4+ T cells and
macrophages were the highest, while gamma delta T cells were not
present in any of the samples. The present study also indicated
that resting CD4+ memory T cells were significantly
associated with the survival of patients with CRC. Resting
CD4+ memory T cells may help CD8+ T cells
inhibit tumors and block CD8+ T-cell activation and NK
cell activity (30). The present
study also confirmed that they have a key role in the development
of CRC.
The neoantigen burden is an effective biomarker in
cancer immunotherapy and neoantigens may be the focus of the
development of novel therapeutic approaches to modify T-cell
reactivity against this class of antigens (31). The probability of the presence of
CD8+ T cells in cancer lesions is higher in tumors with
high mutation burdens than in those with low mutation burdens
(32). T-cell reactivity against
neoantigens is common in melanoma (33). In CRC, the present study indicated
that the neoantigen peptide burden of HIM samples was significantly
higher than that of LIM samples. More than one neoantigen peptide
may be derived from a protein. In the HIM sample, the proportions
of infiltration of activated memory CD4+ T cells were
significantly increased. One reason is that the HIM samples have a
high neoantigen burden and studies have also indicated that most of
the new antigen-specific T-cell responses in melanoma are against
neoantigens (34).
The present study indicated that certain genes were
highly mutated in both HIM and LIM samples. The tumor suppressor
gene TP53 exhibited a discontinuous mutation distribution in the
two groups. TP53 has a regulatory role in cell proliferation and
apoptosis (35). The loss of TP53
may lead to CRC development and progression through a multistep
process (36). An association
between TP53 mutations and worse outcome in stage III CRC has been
reported (37). The present study
indicated that 68 (64%) LIM samples had TP53 gene mutations. The
number of correspondingly mutated HIM samples was 169 (52%). Of
note, the APC gene had the highest mutation frequency in HIM and
LIM samples, at 84 and 70%, respectively. In addition, the CRC
proto-oncogene KRAS was mutated in 39 and 53% of HIM and LIM
samples, respectively, and its mutations cause the RAS/RAF/MAPK
pathways to remain active with loss of normal regulation of cell
growth (38).
By comparing the gene expression profiles in HIM and
LIM samples and screening immune-associated genes, 283 tumor
microenvironment-related genes were identified in the present
study. Functional enrichment analyses indicated that these genes
mainly participated in the immune response and cell adhesion. The
study further focused on SERPINE1 and UCHL1, which are
immune-associated genes that were significantly differentially
expressed between HIM and LIM samples, and their expression was
significantly associated with OS and multiple types of clinical
stage in patients with CRC. In addition, the present analysis
revealed that their copy number variation led to significant
changes in infiltration of the multiple immune cell subsets.
Previous studies have indicated that SERPINE1 overexpression occurs
in primary tumors caused by KRAS mutations in CRC (39) and UCHL1 is associated with lymph node
metastasis in CRC (40). Therefore,
it was concluded that SERPINE1 and UCHL1 may be additional
biomarkers for CRC. The difference in expression of SERPINE1 was
also verified in the GEO dataset, however, the difference in UCHL1
expression was not significant. How they affect tumor progression
in tumor microenvironments requires further investigation. However,
the present study had certain limitations, as all of the results
were obtained in silico. Further in vivo or clinical
studies will contribute to the further elucidation of the
relationship between immune scores and microenvironmental changes
in CRC.
In conclusion, in CRC samples that had high immune
scores, a good cytolytic immune response and relatively abundant
stromal cells, significant infiltration of 22 immune cell subsets
and a high non-synonymous mutation burden and neoantigen burden was
identified, and a set of genes associated with the tumor
microenvironment was extracted. The present study revealed that a
tumor microenvironment of CRC with a high immune score is
associated with favorable survival.
Supplementary Material
Supporting Data
Acknowledgements
Not applicable.
Funding
This work was partly supported by the Shanghai
Natural Science Foundation (grant no. 15ZR1420800 to SP) and the
Quality Engineering Project of Colleges and Universities in Anhui
Province (grant nos. 2015zytz070 and 2019rcsfjd088 to XH).
Availability of data and materials
The datasets used and/or analyzed during the current
study are available from the corresponding author on reasonable
request.
Authors' contributions
WY and SP conceived the study, collected the data
and performed the bioinformatics analyses. WC and XH performed
quality control of the raw data and participated in part of the
data analyses. WY and SP wrote the manuscript and supervised the
study. All authors read and approved the final manuscript.
Ethics approval and consent to
participate
Not applicable.
Patient consent for publication
Not applicable.
Competing interests
The authors declare that they have no competing
interests.
References
|
1
|
Bray F, Ferlay J, Soerjomataram I, Siegel
RL, Torre LA and Jemal A: Global cancer statistics 2018: GLOBOCAN
estimates of incidence and mortality worldwide for 36 cancers in
185 countries. CA Cancer J Clin. 68:394–424. 2018. View Article : Google Scholar : PubMed/NCBI
|
|
2
|
Marks KM, West NP, Morris E and Quirke P:
Clinicopathological, genomic and immunological factors in
colorectal cancer prognosis. Br J Surg. 105:e99–e109. 2018.
View Article : Google Scholar : PubMed/NCBI
|
|
3
|
Nancy K: The management of resectable and
unresectable liver metastases from colorectal cancer. Curr Opin
Oncol. 22:364–373. 2010. View Article : Google Scholar : PubMed/NCBI
|
|
4
|
Lupinacci RM, Andraus W, De Paiva Haddad
LB, Carneiro D′ Albuquerque LA and Herman P: Simultaneous
laparoscopic resection of primary colorectal cancer and associated
liver metastases: A systematic review. Tech Coloproctol.
18:129–135. 2014. View Article : Google Scholar : PubMed/NCBI
|
|
5
|
Dougan M and Dranoff G: Immune therapy for
cancer. Annu Rev Immunol. 27:83–117. 2009. View Article : Google Scholar : PubMed/NCBI
|
|
6
|
Hanahan D and Coussens LM: Accessories to
the crime: Functions of cells recruited to the tumor
microenvironment. Cancer Cell. 21:309–322. 2012. View Article : Google Scholar : PubMed/NCBI
|
|
7
|
Charoentong P, Finotello F, Angelova M,
Mayer C, Efremova M, Rieder D, Hackl H and Trajanoski Z: Pan-cancer
immunogenomic analyses reveal genotype-immunophenotype
relationships and predictors of response to checkpoint blockade.
Cell Rep. 18:248–262. 2017. View Article : Google Scholar : PubMed/NCBI
|
|
8
|
Alexandrov LB, Nik-Zainal S, Wedge DC,
Aparicio SA, Behjati S, Biankin AV, Bignell GR, Bolli N, Borg A,
Børresen-Dale AL, et al: Signatures of mutational processes in
human cancer. Nature. 500:415–421. 2013. View Article : Google Scholar : PubMed/NCBI
|
|
9
|
Le DT, Durham JN, Smith KN, Wang H,
Bartlett BR, Aulakh LK, Lu S, Kemberling H, Wilt C, Luber BS, et
al: Mismatch repair deficiency predicts response of solid tumors to
PD-1 blockade. Science. 357:409–413. 2017. View Article : Google Scholar : PubMed/NCBI
|
|
10
|
Pastille E, Wasmer MH, Adamczyk A, Vu VP,
Mager LF, Phuong NNT, Palmieri V, Simillion C, Hansen W, Kasper S,
et al: The IL-33/ST2 pathway shapes the regulatory T cell phenotype
to promote intestinal cancer. Mucosal Immunol. 12:990–1003. 2019.
View Article : Google Scholar : PubMed/NCBI
|
|
11
|
Yoshihara K, Shahmoradgoli M, Martínez E,
Vegesna R, Kim H, Torres-Garcia W, Treviño V, Shen H, Laird PW,
Levine DA, et al: Inferring tumour purity and stromal and immune
cell admixture from expression data. Nat Commun. 4:26122013.
View Article : Google Scholar : PubMed/NCBI
|
|
12
|
Priedigkeit N, Watters RJ, Lucas PC,
Basudan A, Bhargava R, Horne W, Kolls JK, Fang Z, Rosenzweig MQ,
Brufsky AM, et al: Exome-capture RNA sequencing of decade-old
breast cancers and matched decalcified bone metastases. JCI
Insight. 2:e957032017. View Article : Google Scholar
|
|
13
|
Jia D, Li S, Li D, Xue H, Yang D and Liu
Y: Mining TCGA database for genes of prognostic value in
glioblastoma microenvironment. Aging (Albany NY). 10:592–605. 2018.
View Article : Google Scholar : PubMed/NCBI
|
|
14
|
Shah N, Wang P, Wongvipat J, Karthaus WR,
Abida W, Armenia J, Rockowitz S, Drier Y, Bernstein BE, Long HW, et
al: Regulation of the glucocorticoid receptor via a BET-dependent
enhancer drives antiandrogen resistance in prostate cancer. Elife.
6:e278612017. View Article : Google Scholar : PubMed/NCBI
|
|
15
|
Rooney MS, Shukla SA, Wu CJ, Getz G and
Hacohen N: Molecular and genetic properties of tumors associated
with local immune cytolytic activity. Cell. 160:48–61. 2015.
View Article : Google Scholar : PubMed/NCBI
|
|
16
|
Hause RJ, Pritchard CC, Shendure J and
Salipante SJ: Corrigendum: Classification and characterization of
microsatellite instability across 18 cancer types. Nat Med.
23:12412017. View Article : Google Scholar : PubMed/NCBI
|
|
17
|
Eide PW, Bruun J, Lothe RA and Sveen A:
CMScaller: An R package for consensus molecular subtyping of
colorectal cancer pre-clinical models. Sci Rep. 7:166182017.
View Article : Google Scholar : PubMed/NCBI
|
|
18
|
Bhattacharya S, Andorf S, Gomes L, Dunn P,
Schaefer H, Pontius J, Berger P, Desborough V, Smith T, Campbell J,
et al: ImmPort: Disseminating data to the public for the future of
immunology. Immunol Res. 58:234–239. 2014. View Article : Google Scholar : PubMed/NCBI
|
|
19
|
Mayakonda A and Koeffler HP: Maftools:
Maftools: Efficient analysis, visualization and summarization of
MAF files from large-scale cohort based cancer studies. BioRxiv.
0526622016.
|
|
20
|
Newman AM, Liu CL, Green MR, Gentles AJ,
Feng W, Xu Y, Hoang CD, Diehn M and Alizadeh AA: Robust enumeration
of cell subsets from tissue expression profiles. Nat Methods.
12:453–457. 2015. View Article : Google Scholar : PubMed/NCBI
|
|
21
|
Robinson MD, McCarthy DJ and Smyth GK:
edgeR: A bioconductor package for differential expression analysis
of digital gene expression data. Bioinformatics. 26:139–140. 2010.
View Article : Google Scholar : PubMed/NCBI
|
|
22
|
Li T, Fan J, Wang B, Traugh N, Chen Q, Liu
JS, Li B and Liu XS: TIMER: A web server for comprehensive analysis
of tumor-infiltrating immune cells. Cancer Res. 77:e108–e110. 2017.
View Article : Google Scholar : PubMed/NCBI
|
|
23
|
Smoot ME, Ono K, Ruscheinski J, Wang PL
and Ideker T: Cytoscape 2.8: New features for data integration and
network visualization. Bioinformatics. 27:431–432. 2011. View Article : Google Scholar : PubMed/NCBI
|
|
24
|
Montojo J, Zuberi K, Rodriguez H, Kazi F,
Wright G, Donaldson SL, Morris Q and Bader GD: GeneMANIA Cytoscape
plugin: Fast gene function predictions on the desktop.
Bioinformatics. 26:2927–2928. 2010. View Article : Google Scholar : PubMed/NCBI
|
|
25
|
Lin H and Zelterman D: Modeling survival
data: Extending the Cox model. Technometrics. 44:85–86. 2002.
View Article : Google Scholar
|
|
26
|
Park JH, Powell AG, Roxburgh CS, Horgan
PG, Mcmillan DC and Edwards J: Mismatch repair status in patients
with primary operable colorectal cancer: Associations with the
local and systemic tumour environment. Br J Cancer. 114:562–570.
2016. View Article : Google Scholar : PubMed/NCBI
|
|
27
|
Giannakis M, Mu XJ, Shukla SA, Qian ZR,
Cohen O, Nishihara R, Bahl S, Cao Y, Amin-Mansour A, Yamauchi M, et
al: Genomic correlates of immune-cell infiltrates in colorectal
carcinoma. Cell Rep. 15:857–865. 2016. View Article : Google Scholar : PubMed/NCBI
|
|
28
|
Narayanan S, Kawaguchi T, Yan L, Peng X,
Qi Q and Takabe K: Cytolytic activity score to assess anticancer
immunity in colorectal cancer. Ann Surg Oncol. 25:2323–2331. 2018.
View Article : Google Scholar : PubMed/NCBI
|
|
29
|
Huh JW, Lee JH and Kim HR: Prognostic
significance of tumor-infiltrating lymphocytes for patients with
colorectal cancer. Arch Surg. 147:366–372. 2012. View Article : Google Scholar : PubMed/NCBI
|
|
30
|
Rosenberg J and Huang J: CD8+ T
cells and NK cells: Parallel and complementary soldiers of
immunotherapy. Curr Opin Chem Eng. 19:9–20. 2018. View Article : Google Scholar : PubMed/NCBI
|
|
31
|
Schumacher TN and Schreiber RD:
Neoantigens in cancer immunotherapy. Science. 348:69–74. 2015.
View Article : Google Scholar : PubMed/NCBI
|
|
32
|
Brown SD, Warren RL, Gibb EA, Martin SD,
Spinelli JJ, Nelson BH and Holt RA: Neo-antigens predicted by tumor
genome meta-analysis correlate with increased patient survival.
Genome Res. 24:743–750. 2014. View Article : Google Scholar : PubMed/NCBI
|
|
33
|
Kvistborg P, Shu CJ, Heemskerk B,
Fankhauser M, Thrue CA, Toebes M, van Rooij N, Linnemann C, van
Buuren MM, Urbanus JH, et al: TIL therapy broadens the
tumor-reactive CD8(+) T cell compartment in melanoma patients.
Oncoimmunology. 1:409–418. 2012. View Article : Google Scholar : PubMed/NCBI
|
|
34
|
Linnemann C, van Buuren MM, Bies L,
Verdegaal EM, Schotte R, Calis JJ, Behjati S, Velds A, Hilkmann H,
Atmioui DE, et al: High-throughput epitope discovery reveals
frequent recognition of neo-antigens by CD4+ T cells in
human melanoma. Nat Med. 21:81–85. 2015. View Article : Google Scholar : PubMed/NCBI
|
|
35
|
Perego P, Giarola M, Righetti SC, Supino
R, Caserini C, Delia D, Pierotti MA, Miyashita T, Reed JC and
Zunino F: Association between cisplatin resistance and mutation of
p53 gene and reduced bax expression in ovarian carcinoma cell
systems. Cancer Res. 56:556–562. 1996.PubMed/NCBI
|
|
36
|
Fearon ER and Vogelstein B: A genetic
model for colorectal tumorigenesis. Cell. 61:759–767. 1990.
View Article : Google Scholar : PubMed/NCBI
|
|
37
|
Westra JL, Michael S, Harry H, de Boer JP,
Kraak MM, de Jong D, ter Elst A, Mulder NH, Buys CH, Hofstra RM and
nPlukker JT: Determination of TP53 mutation is more relevant than
microsatellite instability status for the prediction of
disease-free survival in adjuvant-treated stage III colon cancer
patients. J Clin Oncol. 23:5635–5643. 2005. View Article : Google Scholar : PubMed/NCBI
|
|
38
|
Borrero-Palacios A, Cebrián A, Gómez Del
Pulgar MT, García-Carbonero R, Garcia-Alfonso P, Aranda E, Elez E,
López-López R, Cervantes A, Valladares M, et al: Combination of
KIR2DS4 and FcγRIIa polymorphisms predicts the response to
cetuximab in KRAS mutant metastatic colorectal cancer. Sci Rep.
9:25892019. View Article : Google Scholar : PubMed/NCBI
|
|
39
|
Alamo P, Gallardo A, Di Nicolantonio F,
Pavón MA, Casanova I, Trias M, Mangues MA, Lopez-Pousa A,
Villaverde A, Vázquez E, et al: Higher metastatic efficiency of
KRas G12V than KRas G13D in a colorectal cancer model. FASEB J.
29:464–476. 2015. View Article : Google Scholar : PubMed/NCBI
|
|
40
|
Zhong J, Zhao M, Ma Y, Luo Q, Liu J, Wang
J, Yuan X, Sang J and Huang C: UCHL1 acts as a colorectal cancer
oncogene via activation of the β-catenin/TCF pathway through its
deubiquitinating activity. Int J Mol Med. 30:430–436. 2012.
View Article : Google Scholar : PubMed/NCBI
|