Introduction
Acute monocytic leukemia (AMoL) is a distinct
subtype of acute myeloid leukemia (AML) characterized by the
uncontrolled proliferation of immature cells of myelo-monocytic
origin (monoblasts, promonocytes or monocytes) within the bone
marrow and peripheral blood; AMoL accounts for 5–10% of adult AML
cases (1–3). Compared with other AML subtypes, such
as M2, M3 and M4, AMoL is discriminated by its high leukocyte
count, a tendency to infiltrate extramedullary sites and
association with intravascular coagulation (1,3,4). It also differs from other AMoL subtypes
in karyotype, genetics and immunophenotype (1). Patients with AMoL have been reported to
have a worse prognosis compared with other AML subtypes, which is
associated with hyperleukocytosis and extramedullary involvement
(4,5). The 3-year overall survival rate and
disease-free survival rate are reported to be only 31 and 26%,
respectively (4). Consequently,
there is an urgent need to discover novel therapeutic targets for
AMoL. Further characterization of the critical factors and
molecular mechanisms of AMoL may facilitate the development of new
therapies. At present, different genetic mutations and chromosomal
translocations have been demonstrated to serve prominent roles in
the pathogenesis of AMoL, which include mutations in the genes
encoding FMS-like tyrosine kinase 3, NRAS, nucleophosmin 1 and DNA
methyltransferase 3A, and translocations in the gene encoding MLL
on chromosome 11q23 (3–5). However, insight into the molecular
characteristics of this disease remains limited (4). Specifically, the regulatory networks of
AMoL gene expression level shave yet to be elucidated.
As two of the best-characterized regulators of gene
expression levels, microRNAs (miRNAs/miRs) induce mRNA degradation
or inhibit translation by binding the 3′-untranslated regions
(3′-UTRs) of target mRNAs, whereas transcription factors (TFs)
regulate gene transcription by binding to functional TF binding
sites (TFBSs) located within the promoter region of genes (6,7). It has
been confirmed that TF-mediated transcriptional regulation and
miRNA-mediated post-transcriptional regulation are tightly coupled,
which implies that they share a common regulatory mechanism
(7,8). miRNAs and TFs are capable of mutually
regulating each other in the form of feedback loops (FBLs) or
cooperatively regulating the same target gene in a combinatorial
manner to form feed-forward loops (FFLs) (7,9).
Previous studies have indicated that aberrations involving key TFs
and miRNAs essential for the regulation of gene expression levels
are major driving forces of leukemia pathogenesis (10–12). It
has been reported that the TF STAT5 can upregulate miR-21
expression levels by directly binding the promoter region of the
miR-21 locus, contributing to the subsequent downregulation of the
miR-21 target programmed cell death protein 4in the AMoL cell line
MOLM-13, which was found to participate in the antileukemic
response induced by the tyrosine kinase inhibitor imatinib
(10). miR-182 and the TF CCAAT
enhancer binding protein α (CEBPA) regulate each other to form a
negative FBL during the control of granulopoiesis progression,
whereas disrupting this balance blocks granulocytic differentiation
and is directly associated with AML initiation (11). miR-1246/1248 combined with the TFs
WT1/SOX4/REL and their target gene Notch2 form regulatory modules
that regulate T-cell acute lymphoblastic leukemia (T-ALL) cell
proliferation (12). Nevertheless,
the overall regulation of gene expression levels mediated by miRNAs
and TFs in AMoL is still unclear. Therefore, integrated analysis of
miRNAs and TFs specific for AMoL at the network level is
critical.
The present study integrated miRNA sequencing and TF
array technology, supported by bioinformatics analysis, to
construct an AMoL-associated miRNA and TF regulatory network. By
analyzing the network topology, hub miRNAs and TFs were identified
from the network and their regulatory properties were investigated
using a sub-network. These results may advance understanding of the
complicated regulatory mechanisms underlying AMoL and may indicate
potential biomarkers for AMoL in the future.
Materials and methods
Collection and storage of samples
Bone marrow samples were obtained from 10 patients
with unexplained anemia or fever (six males, four females; age
range, 10–73 years; mean age, 39.0±21.2 years) as controls, as well
as from 10 patients with newly diagnosed and untreated AMoL (six
males, four females; age range, 14–64 years; average age, 41.2±14.7
years) enrolled in the Department of Hematology of the Affiliated
Hospital of Guangdong Medical University (Zhanjiang, China).
Diagnosis of AMoL was confirmed according to the
French-American-British criteria (1), whereas control patients had confirmed
normal bone marrow morphology in bone marrow aspirates. The fresh
bone marrow samples were frozen and stored in liquid nitrogen until
use for RNA or nuclear protein extraction. All patients or their
guardians provided written informed consent for voluntary
participation in accordance with the Declaration of Helsinki, and
ethical approval was granted by the ethics committee of the
Affiliated Hospital of Guangdong Medical University (approval no.
PJ2016081KT) (Zhanjiang, China).
RNA isolation
Total RNA was extracted from bone marrow samples
using TRIzol® reagent (Invitrogen; Thermo Fisher
Scientific, Inc.) and an RNeasy kit (Qiagen GmbH) with a DNase
digestion step, according to the manufacturer's instructions. The
purity and concentration of RNA was measured with a NanoDrop™
ND-1000 instrument (NanoDrop Technologies; Thermo Fisher
Scientific, Inc.).
High-throughput miRNA sequencing and
data analysis
Small RNA libraries were constructed using the
NEBNext Multiplex Small RNA Prep Set for Illumina® Set 1
kit (cat. no. E7300S, New England BioLabs, Inc.), according to the
manufacturer's instructions. Briefly, total RNA samples were
ligated with 3′ and 5′ RNA adapters, reverse transcribed into cDNA
(protocol was 50°C for 60 min) and amplified by PCR (the
thermocycling conditions were 94°C for 30 sec, followed by 15
cycles at 94°C for 15 sec, 62°C for 30 sec and 70°C for 15 sec).
Subsequently, 130–155-bp PCR products (corresponding to 15–35-bp
small RNAs) were separated and purified from 6% polyacrylamide
gels. The quantity and length distribution of the sequencing
library was determined by Agilent 2100 Bioanalyzer instrument
(Agilent Technologies, Inc.) using an Agilent DNA 1000 chip kit
(cat. no. 5067-1504; Agilent Technologies, Inc.) according to the
manufacturer's instructions. Following denaturation with NaOH, the
sequencing libraries were diluted to a final concentration of 8 pM
and loaded on a cBot instrument to generate a clustered flowcell
utilizing the TruSeq Rapid SR cluster kit (cat. no. GD-402-4001,
both Illumina, Inc.). Single-end RNA sequencing (50 bp, 5′ to 3′
direction) of the flowcell was carried out on an IlluminaHiSeq 2000
sequencer using a TruSeq Rapid SBS kit (cat. no. FC-402-4002,
Illumina, Inc.)for 36 cycles, following the manufacturer's
recommendations. Analysis of sequencing images was performed with
Off-Line Basecaller software (version V1.8.0; Illumina, Inc.).
After passing through the Solexa CHASTITY quality control filter,
the clean reads were trimmed to remove the adapter sequence. The
remaining reads of ≥15 nucleotides were aligned to a known
reference miRNA precursor in the miRBase database (release 19.0;
www.mirbase.org/) using Novoalign software
(version v2.07.11; www.novocraft.com/). Normalization of read counts,
calculation of the relative expression levels of each miRNA and
identification of differentially expressed miRNAs were performed as
previously described (13).
TF array detection and data
analysis
Nuclear proteins were prepared from bone marrow
samples using a Nuclear Extract kit (cat. no. AY2002, Panomics,
Inc.; Affymetrix; Thermo Fisher Scientific, Inc.) according to the
manufacturer's instructions. TranSignal Combo Protein/DNA Arrays
(Panomics, Inc.; Affymetrix; Thermo Fisher Scientific, Inc.), which
enable simultaneous quantitative analysis of 345 important TFs,
were used according to the manufacturer's instructions. Briefly,
nuclear proteins were incubated with a TF probe mixture containing
345 biotin-labeled DNA binding oligonucleotides (Panomics, Inc.;
Affymetrix; Thermo Fisher Scientific, Inc.) for 30 min at 15°C to
form protein-DNA complexes. TF-bound probes were then separated
from the non-bound probes using a spin column separation system
(Panomics, Inc.; Affymetrix; Thermo Fisher Scientific, Inc.). The
bound probes were denatured and hybridized to a TranSignal Combo
array membrane containing consensus binding oligonucleotides for
TFs at 42°C overnight. After three washes, membranes were incubated
with HRP-conjugated streptavidin at room temperature for 5 min and
exposed to ECL-Hyperfilm (Amersham Pharmacia Biotech; Cytiva).
Signal intensities were quantified using a GBox Imaging System
(Syngene Europe) with ScanAlyze software (version 1.0.3; www.graphics.stanford.edu/software/scanalyze/).
The identification of differentially expressed TFs was performed as
previously described (13,14).
Reverse transcription-quantitative
(RT-q) PCR assay
Total RNA extracted from bone marrow samples was
reverse transcribed into cDNA using SuperScript III Reverse
Transcriptase (cat. no. 18080044, Invitrogen; Thermo Fisher
Scientific, Inc.) with a temperature protocol of 65°C for 5 min,
followed by 50°C for 60 min and 70°C for 15 min according to the
manufacturer's protocol. Stem-loop reverse transcription primers
(Table I) and oligodT primers were
used for cDNA synthesis of miRNAs and genes encoding TFs,
respectively. qPCR assays were performed on cDNA samples using SYBR
Green PCR Master Mix on an ABI Prism 7500 Real-time PCR System
(both Applied Biosystems; Thermo Fisher Scientific, Inc.). Primer
sequences are listed in Tables II
and III. Thermocycling parameters
were 95°C for 10 min, then 40 cycles of 95°C for 10 sec and 60°C
for 1 min. The specificity of amplified products was evaluated via
melt curve analysis following PCR amplification. U6 small nuclear
RNA and 18S ribosomal RNA were selected as internal controls to
normalize qPCR data for miRNA and TF-encoding gene expression
levels, respectively. Fold-changes in expression levels were
determined according to the 2−∆∆Cq method (15).
 | Table I.miR-specific reverse transcription
primers. |
Table I.
miR-specific reverse transcription
primers.
| miR | Primer sequence
(5′→3′) |
|---|
| miR-155-5p |
GTCGTATCCAGTGCGTGTCGTGGAGTCGGCAATTGCACTGGATACGACACCCCTA |
| miR-221-3p |
GTCGTATCCAGTGCGTGTCGTGGAGTCGGCAATTGCACTGGATACGACGAAACCC |
| miR-378a-3p |
GTCGTATCCAGTGCGTGTCGTGGAGTCGGCAATTGCACTGGATACGACGCCTTC |
| miR-106b-5p |
GTCGTATCCAGTGCGTGTCGTGGAGTCGGCAATTGCACTGGATACGACATCTGCA |
| miR-142-3p |
GTCGTATCCAGTGCGTGTCGTGGAGTCGGCAATTGCACTGGATACGACTCCATAAA |
| miR-424-5p |
GTCGTATCCAGTGCGTGTCGTGGAGTCGGCAATTGCACTGGATACGACTTCAAA |
| U6 small nuclear
RNA |
CGCTTCACGAATTTGCGTGTCAT |
| Table II.Primers for reverse
transcription-quantitative PCR of miRs. |
Table II.
Primers for reverse
transcription-quantitative PCR of miRs.
| miR | Primer (5′→3′) | Product length,
bp |
|---|
| miR-155-5p | F:
GGGGTAATGCTAATCGTGA | 66 |
|
| R:
CAGTGCGTGTCGTGGAG |
|
| miR-221-3p | F:
GGGAAGCTACATTGTCTGC | 67 |
|
| R:
CAGTGCGTGTCGTGGAGT |
|
| miR-378a-3p | F:
GGGGTCTGGACTTGGAGTCA | 64 |
|
| R:
GTGCGTGTCGTGGAGTCG |
|
| miR-106b-5p | F:
GGGGGTAAAGTGCTGACAGT | 64 |
|
| R:
GTGCGTGTCGTGGAGTCG |
|
| miR-142-3p | F:
GGGGGTGTAGTGTTTCCTA | 68 |
|
| R:
CAGTGCGTGTCGTGGA |
|
| miR-424-5p | F:
GGGCAGCAGCAATTCATGT | 63 |
|
| R:
GTGCGTGTCGTGGAGTCG |
|
| U6 small nuclear
RNA | F:
GCTTCGGCAGCACATATACTAAAAT | 89 |
|
| R:
CGCTTCACGAATTTGCGTGTCAT |
|
| Table III.Primers for reverse
transcription-quantitative PCR of TFs. |
Table III.
Primers for reverse
transcription-quantitative PCR of TFs.
| TF | Primer (5′→3′) | Product length,
bp |
|---|
| MYC | F:
ACACATCAGCACAACTACGC | 159 |
|
| R:
CCTCTTGACATTCTCCTCGGT |
|
| NR2F1 | F:
ATCGAGAGCCTGCAGGAGAA | 163 |
|
| R:
CTACCAAACGGACGAAGAAGAG |
|
| NFIC | F:
TGCCACGTCAGACACTTCCT | 154 |
|
| R:
AGTCCTGCTGGTACTGCTTTG |
|
| SRY | F:
ATCCCAGAATGCGAAACTCA | 180 |
|
| R:
AATTCTTCGGCAGCATCTTC |
|
| TP53 | F:
TTCTACAGTTGGGCAGCT | 295 |
|
| R:
GCAGTAAGCCAAGATCAC |
|
| FOXO4 | F:
ATAGCACCACCTCCAGTCA | 150 |
|
| R:
CATGTCACACTCCAGGTTCTC |
|
| 18S rRNA | F:
CCTGGATACCGCAGCTAGGA | 112 |
|
| R:
GCGGCGCAATACGAATGCCCC |
|
Integrative analysis of miRNA and TF
expression profiles
miRNA-mediated gene/TF regulation
In order to obtain miRNA-gene and miRNA-TF pairs,
miRanda (version v5; www.ebi.ac.uk/enright-srv/microcosm/htdocs/targets/v5/),
PicTar (release 2007; www.pictar.mdc-berlin.de/cgi-bin/PicTar_vertebrate.cgi)
and TargetScan (version 6.2; www.targetscan.org/) algorithms were used to predict
the target genes of all differentially expressed miRNAs identified
by miRNA sequencing (14,16). In order to decrease the probability
of false positives, the predicted miRNA-target pairs for further
analysis were supported by ≥2 of the aforementioned databases
(14,16). The predicted miRNA targets were then
merged with the experimentally validated targets, acquired from
miRTarBase (version 4.5; www.mirtarbase.mbc.nctu.edu.tw/) (17). After collecting AMoL candidate
genes/TFs from the MalaCards database (version 1.08.564; www.malacards.org/) (18), these miRNA targets were overlapped
with AMoL candidate genes/TFs to identify miRNA-mediated gene/TF
regulatory associations. Finally, the extracted miRNAs and their
target pairs were subjected to TFBS analysis.
TF-mediated gene/miRNA regulation
In order to identify the regulatory association
between TFs and AMoL candidate genes or miRNAs, TFBS prediction was
performed using the TFBS Conserved Track data tables (www.genome.ucsc.edu/cgi-bin/hgTables?hgsid=350051003&hgta_doSchemaDb=hg19&hgta_doSchemaTable=tfbsConsFactors)
from the UCSC Genome Browser, which contain the frequency and
location of TFBSs conserved among the human/mouse/rat genome
alignments (19). The putative
promoter region (−5,000/+1,000 bp around the transcription start
site) of AMoL candidate genes and precursor miRNAs were searched
for TFBSs as described previously (13). Subsequently, the predicted TFs were
overlapped with the differentially expressed TFs identified by TF
array analysis to avoid redundancy and form TF-gene and TF-miRNA
pairs.
Network construction, network node
analysis and sub-network generation
After converging four types of regulatory pairs
(TF-gene, TF-miRNA, miRNA-gene and miRNA-TF), an AMoL-associated
miRNA and TF regulatory network was constructed. The resulting
network was visualized with Gephi software (Release 0.8.1-beta;
www.gephi.github.io/). Enriched Gene
Ontology (GO; http://geneontology.org/docs/go-citation-policy/)
terms and Kyoto Encyclopedia of Genes and Genomes (KEGG; http://www.genome.jp/kegg/kegg1.html)
pathways for network nodes were examined using Database for
Annotation, Visualization and Integrated Discovery (DAVID; version
v6.7; www.david.abcc.ncifcrf.gov/) and were considered
statistically significant at P<0.05. In order to assess the
overall properties of the network, node degrees were computed based
on the number of direct links of the node inside the network. Nodes
with >15 total degrees (in-plus out-degrees) were defined as
network hubs. The sub-networks were then established by extracting
all directly linked nodes connected to the hubs.
Cell culture
The human AMoL cell line THP1, obtained from the
American Type Culture Collection, was cultivated in RPMI-1640
medium (Gibco; Thermo Fisher Scientific, Inc.) supplemented with
10% fetal bovine serum (HyClone; Cytiva), 100 U/ml penicillin and
100 µg/ml streptomycin at 37°C in 5% CO2. Cells were
routinely tested and had negative results for mycoplasma.
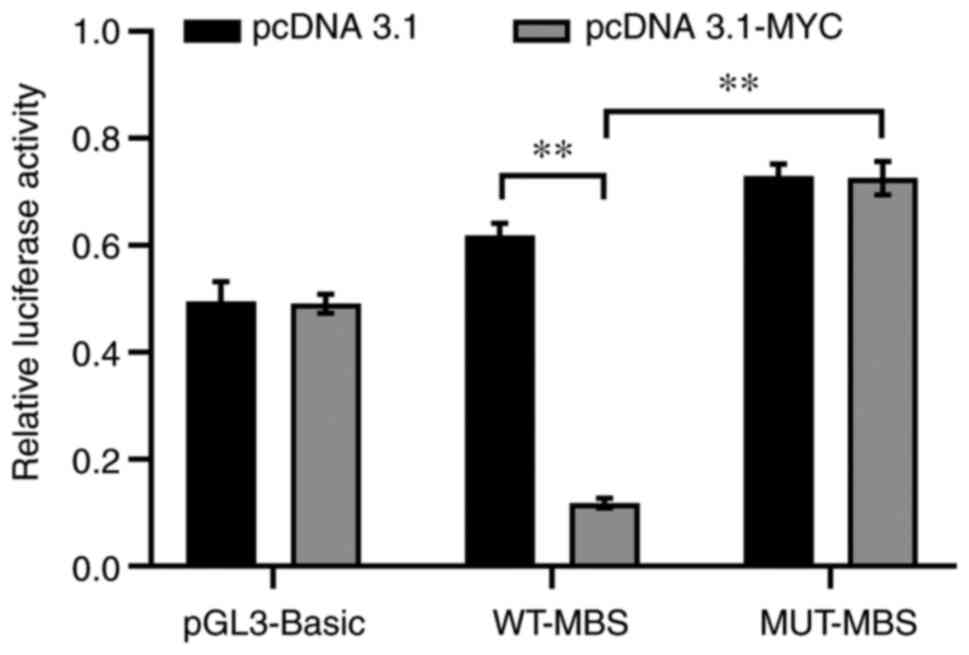
Luciferase reporter assay
For the miR-29b-3p promoter activity assay,
miR-29b-3p promoter constructs containing either a wild-type (WT)
or mutant (MUT) MYC-binding site (MBS) were cloned into
pGL3-Basic reporter vectors from Guangzhou Land Unicomed
Biotechnology Co., Ltd. In order to assess regulation of the
miR-29b-3p promoter by MYC, THP1 cells (4×10⁴
cells/well) were seeded into 24-well plates and co-transfected with
2 µg/ml promoter-luciferase reporter vectors (wild-type or mutant
miR-29b-3p promoter vectors) and 2 µg/ml MYC overexpression
vectors (pcDNA3.1-MYC), and the internal reference plasmid
phRL-TK (100 ng/ml; Promega Corporation) using
Lipofectamine® 2000 (Invitrogen; Thermo Fisher
Scientific Inc.). After 24 h transfection, a Dual-Luciferase Assay
kit (Promega Corporation) was used to measure the luciferase
activity according to the manufacturer's instructions. The values
were normalized to those of Renilla luciferase. Experiments
were performed in triplicate.
Statistical analysis
Statistical analysis was performed using SPSS
statistical software version 16.0 (SPSS Inc.). Statistical data are
presented as mean ± SD of three independent repeats. Differences
between two groups were analyzed using Student's t-test. Data were
analyzed using two-way ANOVA followed by Bonferroni's test for
multiple comparisons. P<0.05 was considered to indicate a
statistically significant difference.
Results
Differentially expressed miRNAs and
TFs in AMoL samples compared with controls
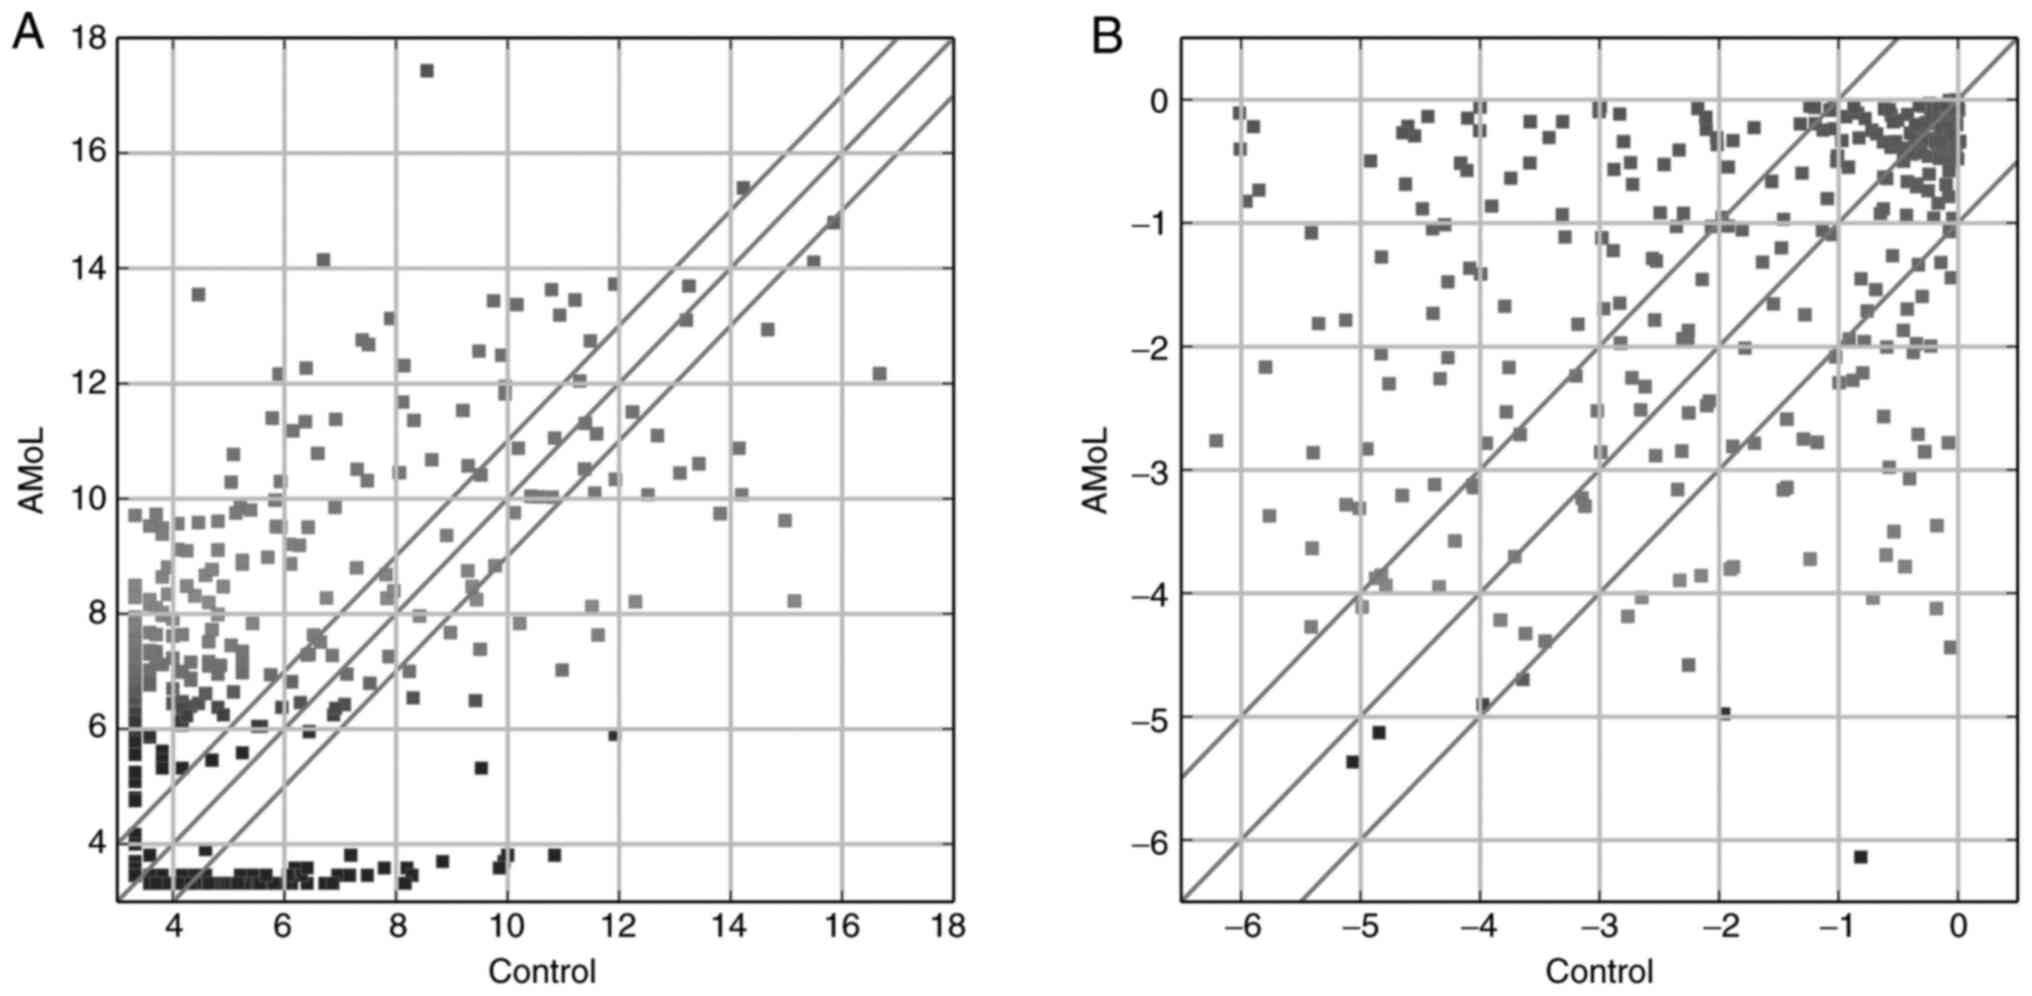
In order to collect AMoL-associated miRNAs and TFs,
miRNA deep sequencing and TF array analysis were performed to
identify dysregulated miRNAs and TFs in AMoL samples compared with
controls. A total of 285 miRNAs that exhibited aberrant expression
levels between the groups were detected (Fig. 1A), with 199 up- and 86 downregulated
in the AMoL group. The most abundantly upregulated miRNA was
miR-122-5p (fold-change, 542.2), whereas miR-941 (fold-change,
131.6) was the most downregulated miRNA. As shown in Fig. 1B, 139 TFs were differentially
expressed (90 up- and 49 downregulated) between the control and
AMoL samples. Of these TFs, nuclear factor IC (NFIC;
fold-change, 94.1) was the most upregulated, whereas transcription
factor AP4 (fold-change, 1,456.7) exhibited the highest degree of
downregulation.
Validation of miRNA and TF expression
level profiles via qPCR
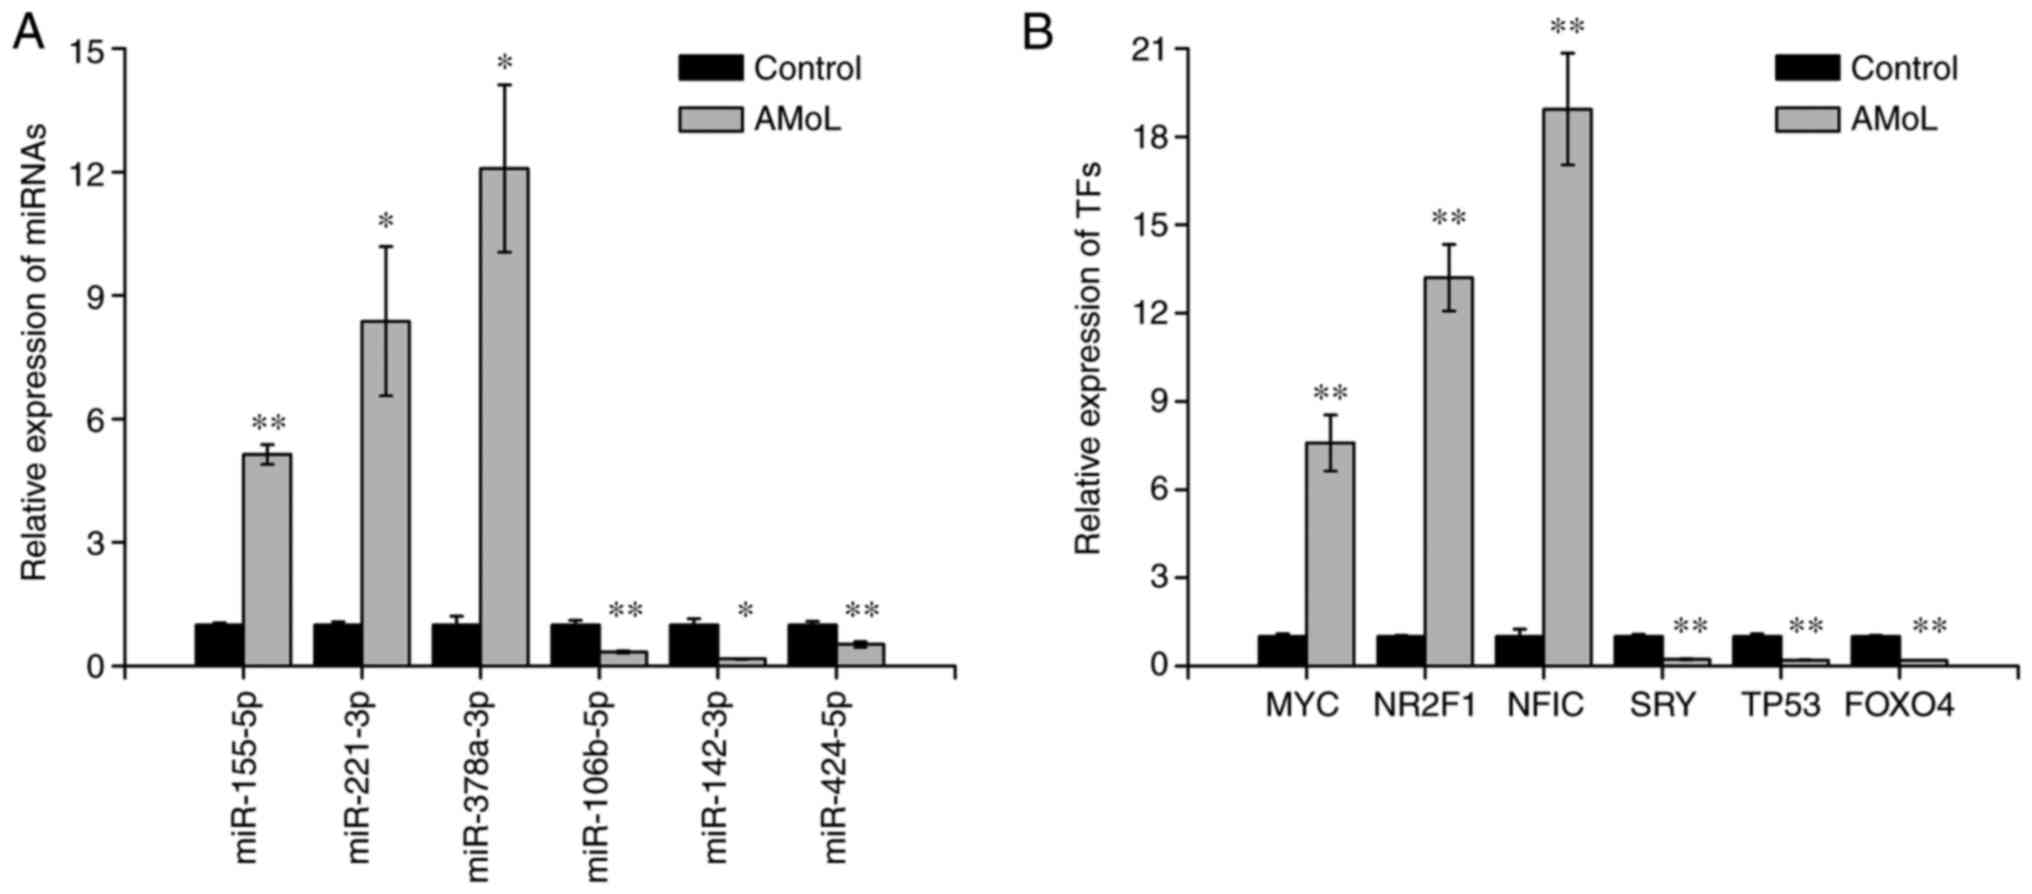
In order to validate differentially expressed miRNAs
and TFs identified by miRNA sequencing and TF arrays, respectively,
six miRNAs and six TFs were selected to further determine their
expression levels by qPCR. Similar to the miRNA sequencing results,
miR-155-5p (P<0.01), miR-221-3p (P<0.05) and miR-378a-3p
(P<0.05) were upregulated, and miR-106b-5p (P<0.01),
miR-142-3p (P<0.05) and miR-424-5p (P<0.01) were
downregulated in AMoL samples compared with controls (Fig. 2A). qPCR analysis also demonstrated
that MYC, nuclear receptor subfamily 2 group F member 1 gene
and NFIC were overexpressed in AMoL samples, whereas the
expression levels of sex-determining region Y gene, TP53 and
FOXO4 were decreased (all P<0.01; Fig. 2B), which was consistent with TF array
results.
miRNA- and TF-mediated regulatory
network in AMoL
Following amalgamation of the four types of
regulatory association among TFs, miRNAs and their targets, an
miRNA-TF regulatory network for AMoL was constructed (Fig. 3). Table
IV shows the numbers of nodes and interaction pairs in the
resultant network. Based on the master regulator, FFLs can be
classified into three types: miRNA-FFLs, TF-FFLs and composite FFLs
(7,9). MiRNA-FFL and TF-FFL can combine into a
composite FFL, in which miRNA and TF regulate each other (7). The present study identified 853 FFLs
and 29 FBLs in the network (Table
V). Among these FFLs, 715 (83.8%) belonged to TF-FFLs, in which
TFs serve as a master regulator to control the expression levels of
miRNA and target genes, 99 (11.6%) were miRNA-FFLs and 39 (4.5%)
belonged to composite-FFLs. Therefore, the TF-FFLs were the
dominant motifs in the network.
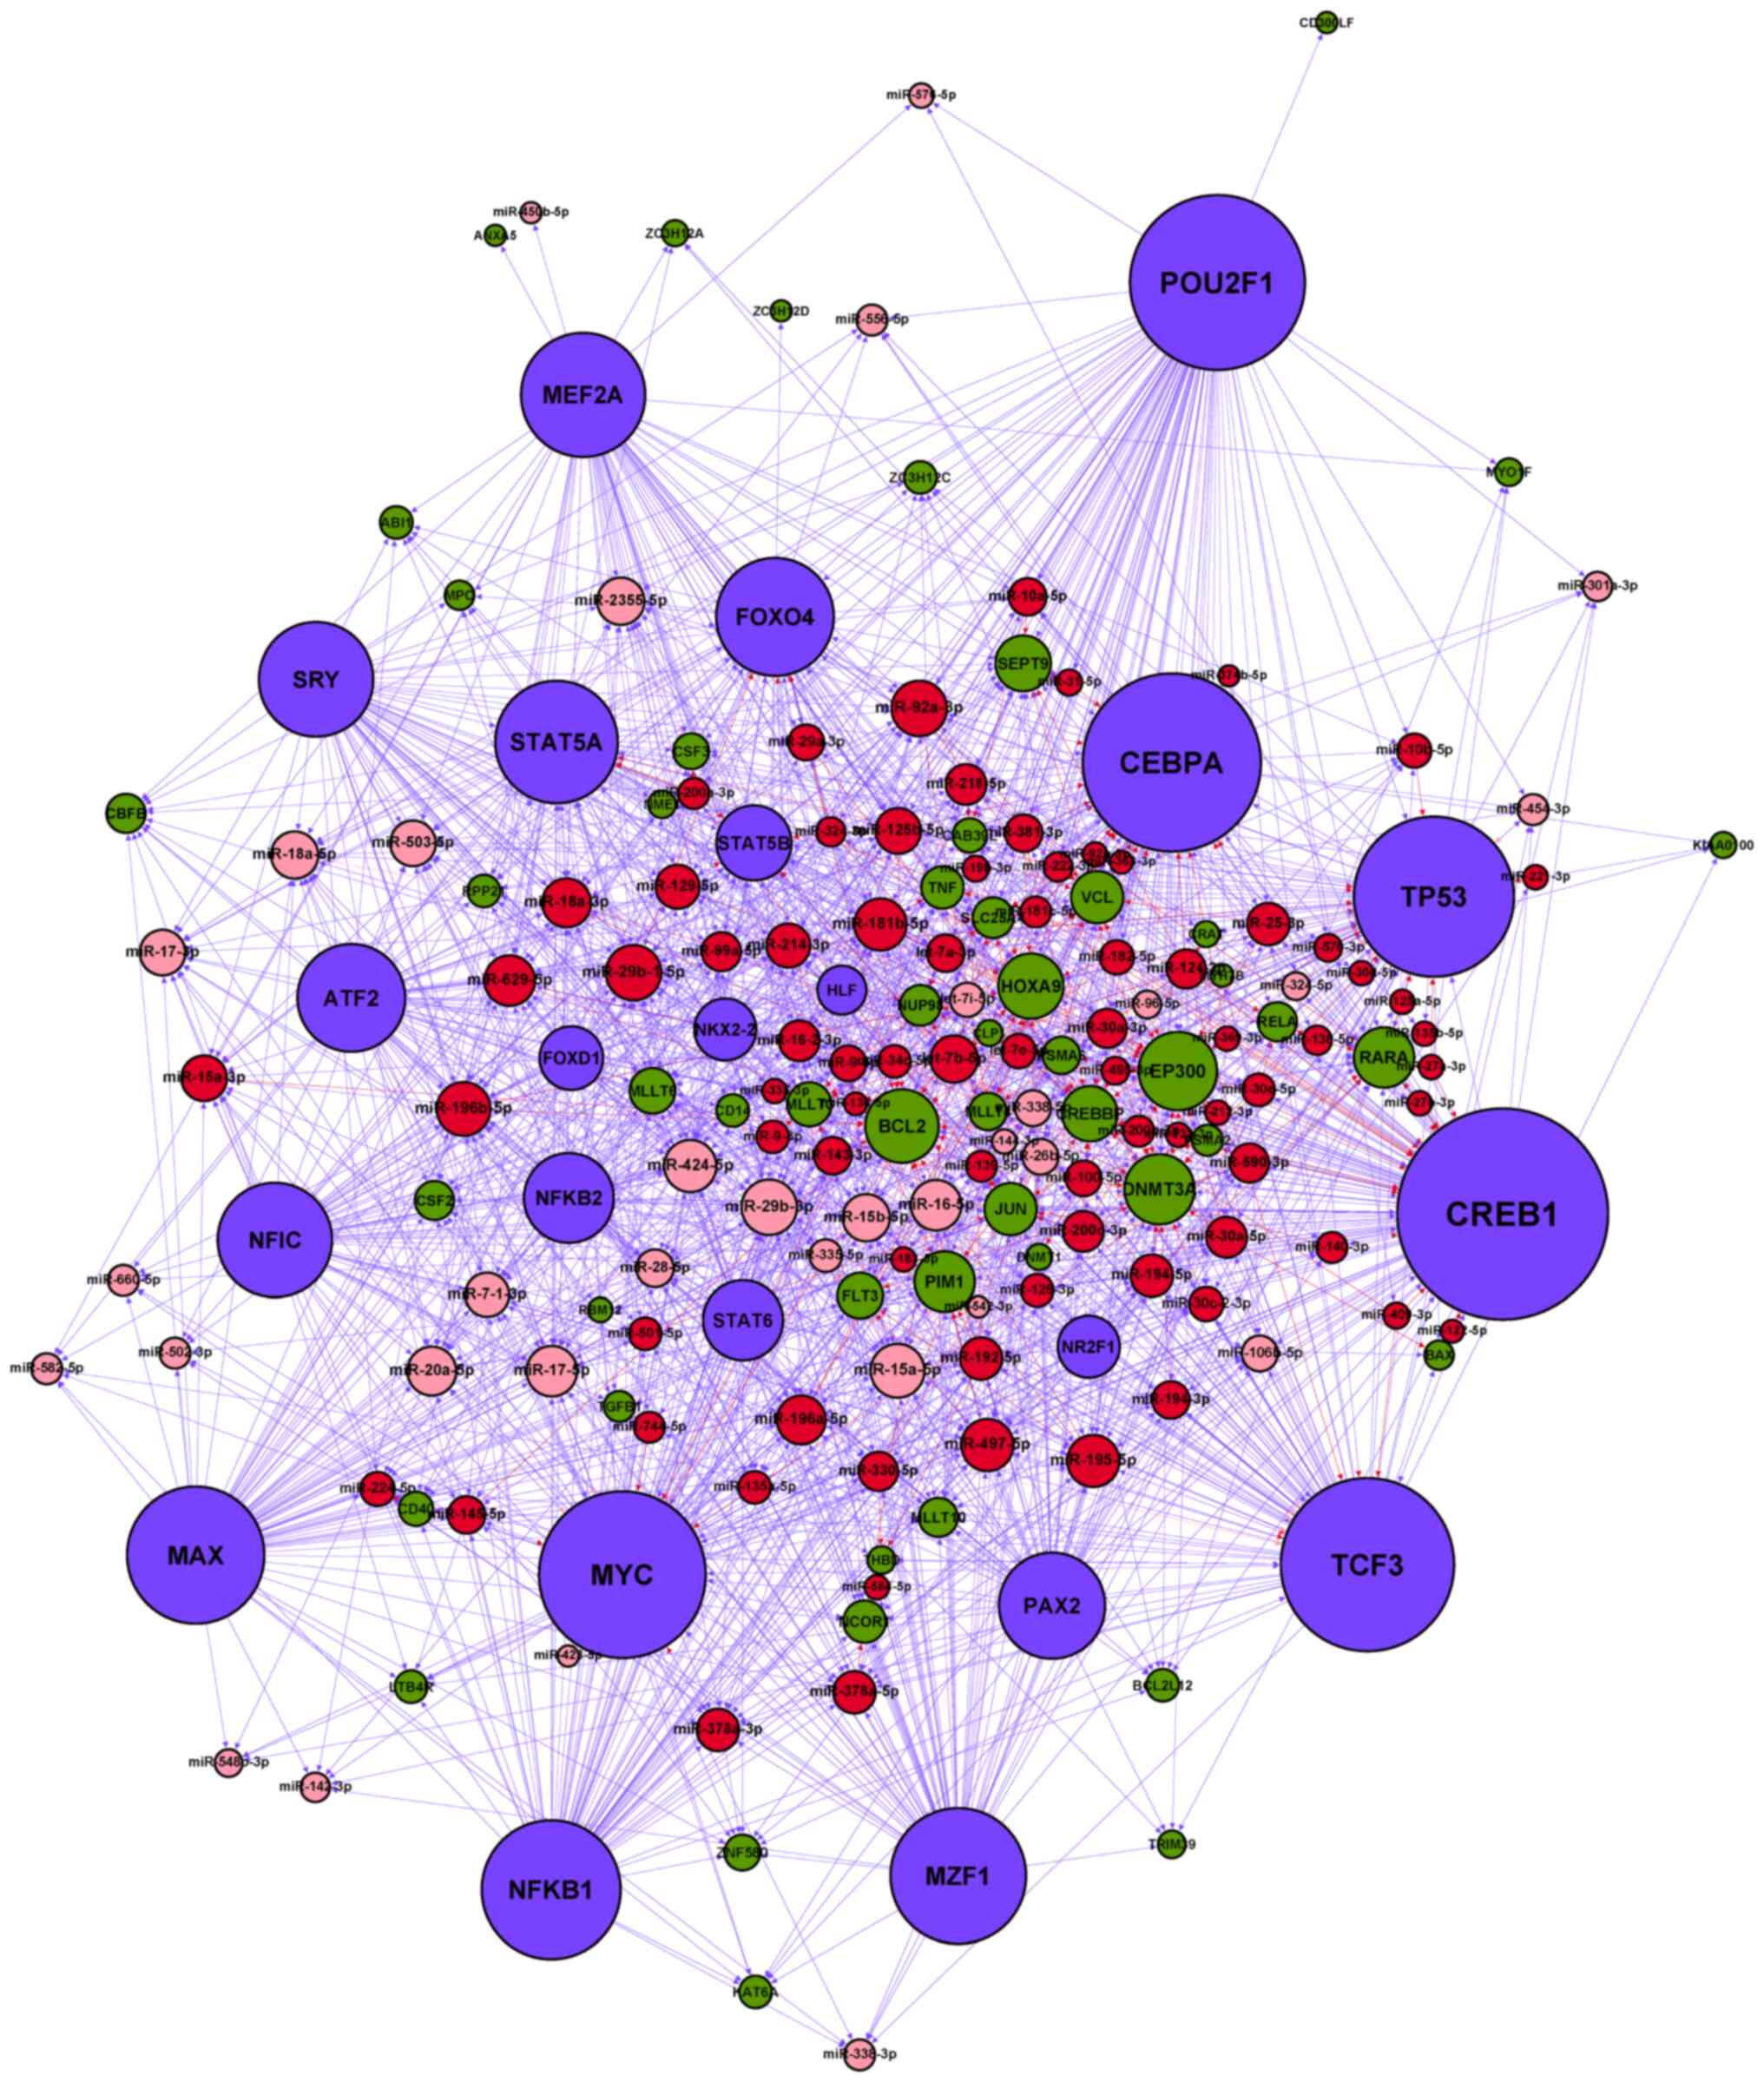 | Figure 3.miRNA-TF regulatory network in AMoL.
Red node, upregulated AMoL-associated miRNA; pink node,
downregulated AMoL-associated miRNA; green node, AMoL candidate
gene; blue node, TF. Red arrow, upregulated miRNA-gene; pink arrow,
downregulated miRNA-gene; blue arrow, TF-miRNA or TF-gene. miRNA,
microRNA; AMoL, acute monocytic leukemia; TF, transcription
factor. |
| Table IV.Regulatory associations in the acute
monocytic leukemia-associated miRNA and TF regulatory network. |
Table IV.
Regulatory associations in the acute
monocytic leukemia-associated miRNA and TF regulatory network.
| Association | Number of
pairs | Number of
miRNAs | Number of
genes | Number of TFs |
|---|
|
miRNA-genea | 304 | 100 | 40 | – |
|
miRNA-TFb | 81 | 57 | – | 8 |
|
TF-genec | 453 | – | 60 | 23 |
|
TF-miRNAd | 807 | 102 | – | 23 |
| Table V.Summary of FFLs and FBLs based on
acute monocytic leukemia-associated network data. |
Table V.
Summary of FFLs and FBLs based on
acute monocytic leukemia-associated network data.
|
|
| Number of
nodes | Number of
links |
|---|
|
|
|
|
|
|---|
| Module type | Number of
modules | Genes | miRNAs | TFs | miRNA-gene | miRNA-TF | TF-gene | TF-miRNA |
|---|
| miRNA-FFL | 99 | 22 | 38 | 7 | 73 | 54 | 46 | – |
| TF-FFL | 715 | 29 | 82 | 23 | 176 | – | 179 | 461 |
| Composite-FFL | 39 | 12 | 18 | 5 | 33 | 21 | 20 | 21 |
| FBL | 29 | – | 26 | 7 | – | 29 | – | 29 |
Functional evaluation of the
synergistic regulatory network
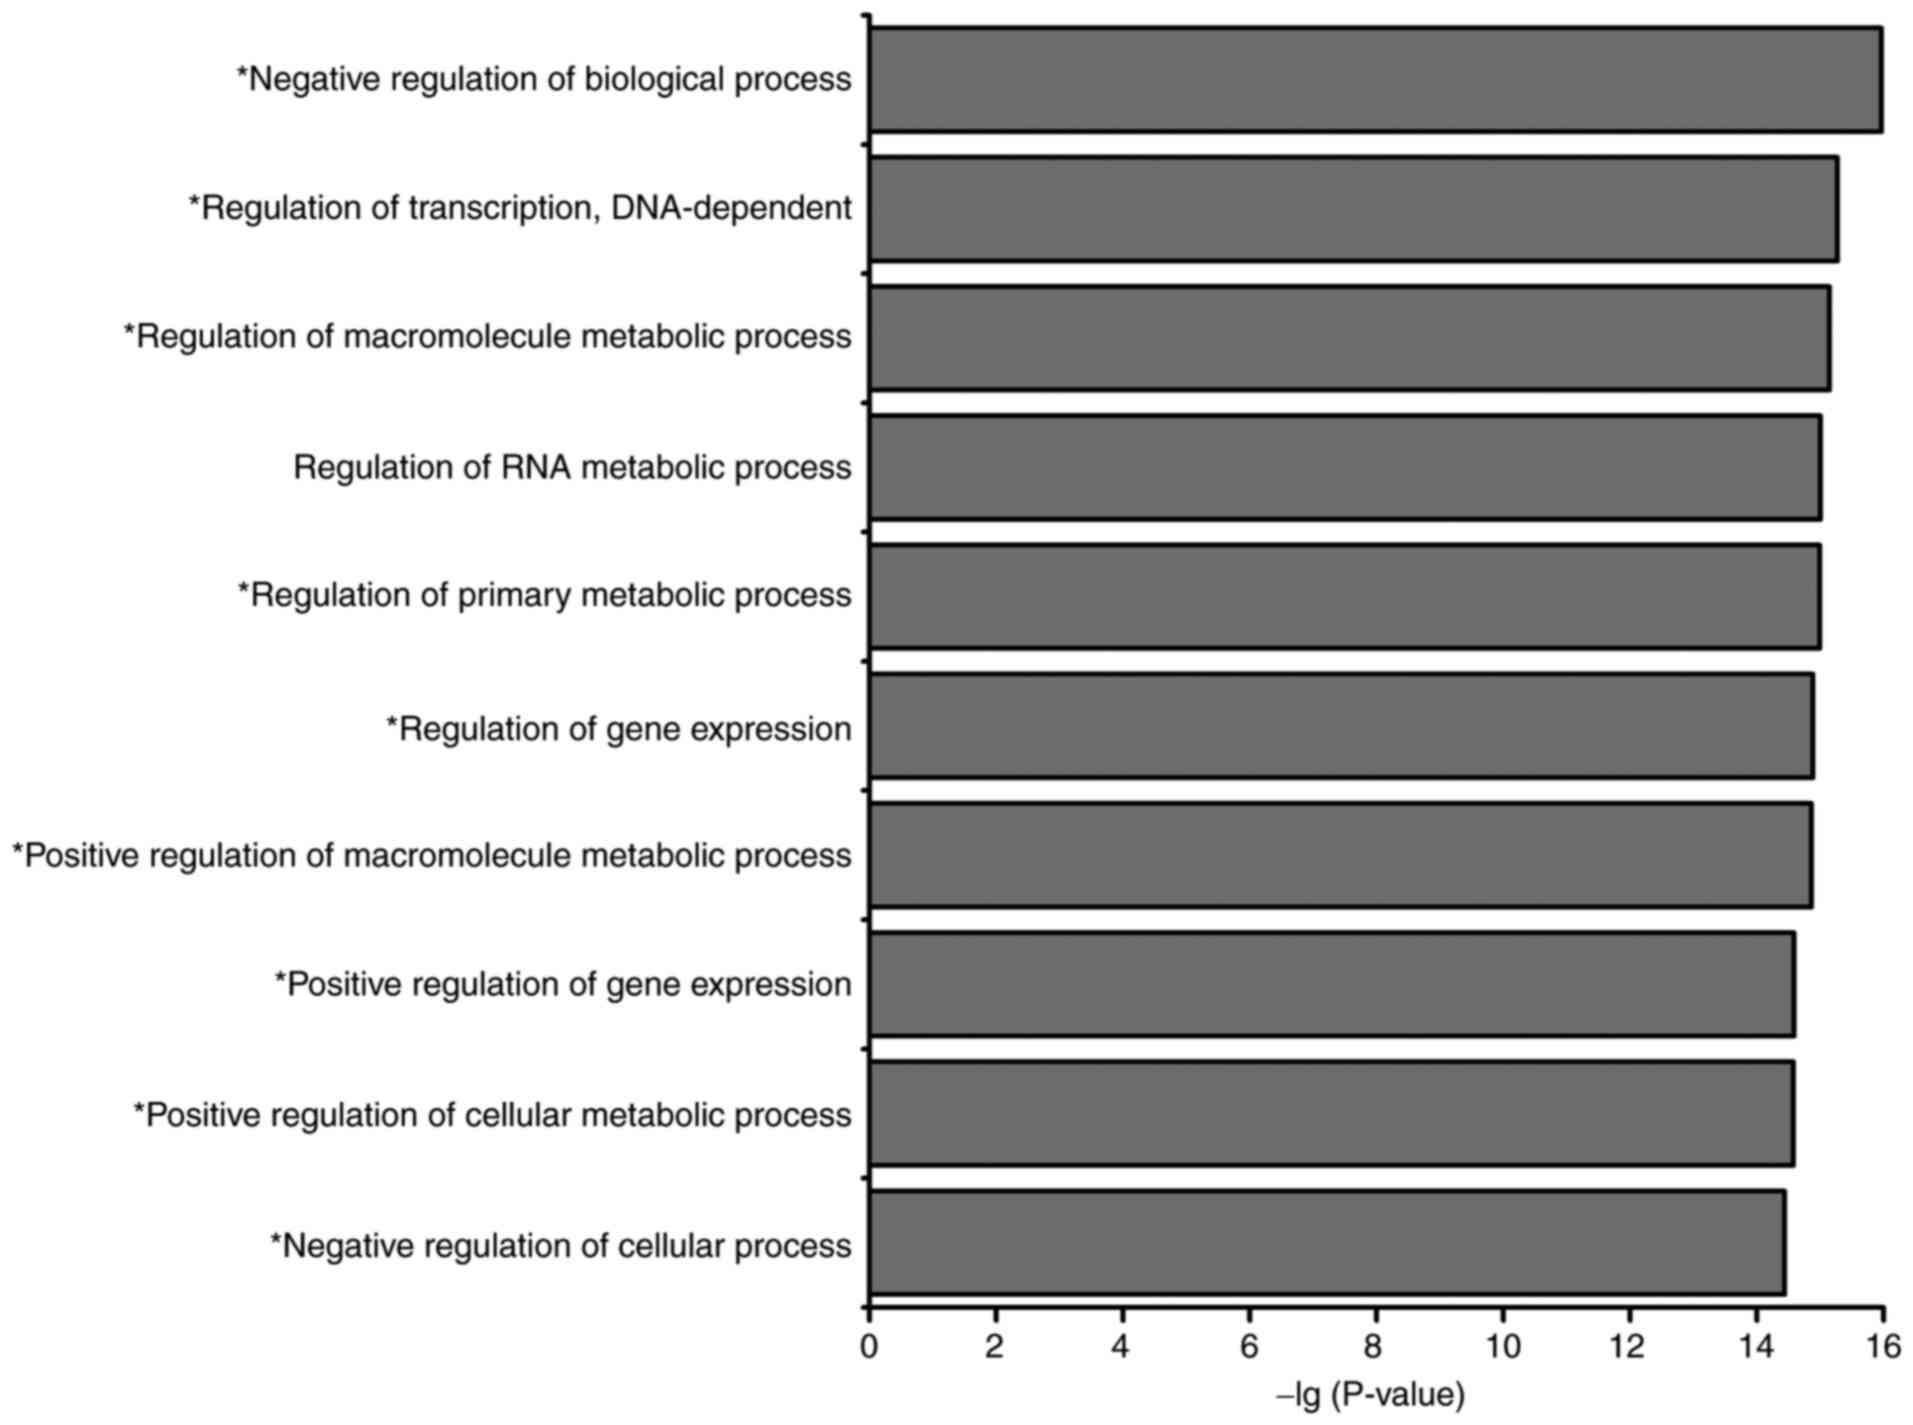
Using the DAVID online tool, GO annotation and KEGG
pathway analysis were performed for all nodes in the assembled
miRNA-TF-based networks. GO analysis identified 10 highly enriched
biological process terms, of which nine were associated with the
occurrence and development of AMoL (Fig.
4), namely ‘negative regulation of biological process’,
‘regulation of transcription, DNA-dependent’, ‘regulation of
macromolecule metabolic process’, ‘regulation of primary metabolic
process’, ‘regulation of gene expression’, ‘positive regulation of
macromolecule metabolic process’, ‘positive regulation of gene
expression’, ‘positive regulation of cellular metabolic process’
and ‘negative regulation of cellular process’. KEGG pathway
analysis indicated that the network nodes were significantly
enriched in 23 different signaling pathways (Table VI), of which 13 were associated with
hematopoiesis or leukemia. Among these pathways, ‘MAPK signaling
pathway’, ‘apoptosis signaling pathway’, ‘Toll-like receptor
signaling pathway’ and ‘TGF-β signaling pathway’ have previously
been implicated in AMoL (20–25).
| Table VI.Pathway analysis for nodes in acute
monocytic leukemia-associated microRNA and transcription factor
regulatory network. |
Table VI.
Pathway analysis for nodes in acute
monocytic leukemia-associated microRNA and transcription factor
regulatory network.
| Pathway ID | Term | Gene count | % | P-value |
|---|
| hsa05200 | Pathways in
cancer | 18 | 23.68421 |
1.41×10⁻¹⁰ |
| hsa05221 | Acute myeloid
leukemiaa | 9 | 11.84211 |
1.24×10⁻⁸ |
| hsa05220 | Chronic myeloid
leukemiaa | 8 | 10.52632 |
1.72×10⁻⁶ |
| hsa04630 | Jak-STAT signaling
pathwaya | 9 | 11.84211 |
2.53×10⁻⁵ |
| hsa04010 | MAPK signaling
pathwaya | 11 | 14.47368 |
3.54×10⁻⁵ |
| hsa05215 | Prostate
cancer | 7 | 9.210526 |
6.67×10⁻⁵ |
| hsa05222 | Small cell lung
cancer | 6 | 7.894737 |
5.13×10⁻⁴ |
| hsa05210 | Colorectal
cancer | 6 | 7.894737 |
5.13×10⁻⁴ |
| hsa04640 | Hematopoietic cell
lineagea | 6 | 7.894737 |
5.71×10⁻⁴ |
| hsa04210 | Apoptosis signaling
pathwaya | 6 | 7.894737 |
6.03×10⁻⁴ |
| hsa04620 | Toll-like receptor
signaling pathwaya | 6 | 7.894737 |
1.19×10⁻³ |
| hsa05212 | Pancreatic
cancer | 5 | 6.578947 |
2.52×10⁻³ |
| hsa04722 | Neurotrophin
signaling pathway | 6 | 7.894737 |
2.95×10⁻³ |
| hsa04110 | Cell
cyclea | 6 | 7.894737 |
3.05×10⁻³ |
| hsa04350 | TGF-β signaling
pathwaya | 5 | 6.578947 |
5.00×10⁻³ |
| hsa05014 | Amyotrophic lateral
sclerosis (ALS) | 4 | 5.263158 |
8.62×10⁻³ |
| hsa04660 | T cell receptor
signaling pathwaya | 5 | 6.578947 |
1.06×10⁻² |
| hsa05016 | Huntington's
disease | 6 | 7.894737 |
1.40×10⁻² |
| hsa04060 | Cytokine-cytokine
receptor interactiona | 7 | 9.210526 |
1.73×10⁻² |
| hsa05211 | Renal cell
carcinoma | 4 | 5.263158 |
1.83×10⁻² |
| hsa04520 | Adherens
junction | 4 | 5.263158 |
2.35×10⁻² |
| hsa04310 | Wnt signaling
pathwaya | 5 | 6.578947 |
3.23×10⁻² |
| hsa04012 | ErbB signaling
pathwaya | 4 | 5.263158 |
3.23×10⁻² |
Network hub identification and
sub-network construction
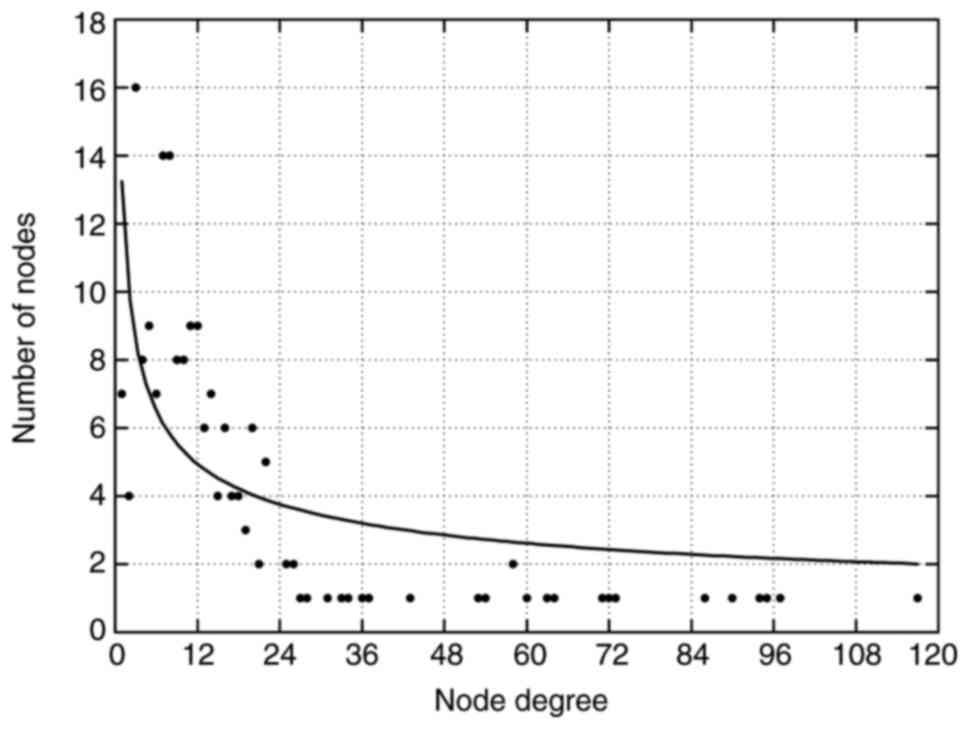
The overall properties of the network were evaluated
by analyzing the node degrees and their distributions. The average
degree values of miRNAs, TFs and genes were 9.8 (range, 1–22), 61.6
(range, 18–117), and 11.6 (range, 1–36), respectively. Furthermore,
only a few nodes exhibited a high node degree (hubs, nodes with
>15 total degrees), whereas the majority of nodes interacted
with a relatively low number of other nodes, implying that the
network was scale-free (Fig. 5).
These results also indicated that hub nodes may play critical roles
in sustaining the global connectivity and stability of the network.
Nodes were sorted in descending order and hub nodes were identified
according to their total degrees. From the miRNA-TF regulatory
network, 26 hub miRNAs (Table VII)
and 23 hub TFs (Table VIII) were
obtained. Among these hub miRNAs, eight (miR-15a-5p, miR-15a-3p,
miR-15b-5p, miR-16-5p, miR-195-5p, miR-424-5p, miR-497-5p and
miR-503-5p) belonged to the miR-15 family, indicating a potential
role of the miR-15 family in the AMoL-associated miRNA and TF
regulatory network. Notably, one hub miRNA (miR-29b-3p) and three
hub TFs (MYC, TP53 and NFKB1) have previously been
found to be associated with AMoL (26–32). In
order to further investigate their regulation inside the network,
sub-networks were constructed by extracting miR-29b-3p, MYC,
TP53, NFKB1 and all their directly connected nodes from the
network (Fig. 6). In the
subnetworks, miR-29b-3p was potentially targeted by MYC
(Fig. 6A and B), TP53
(Fig. 6A and C) and NFKB1
(Fig. 6A and D), which may establish
cross-talk between these four sub-networks.
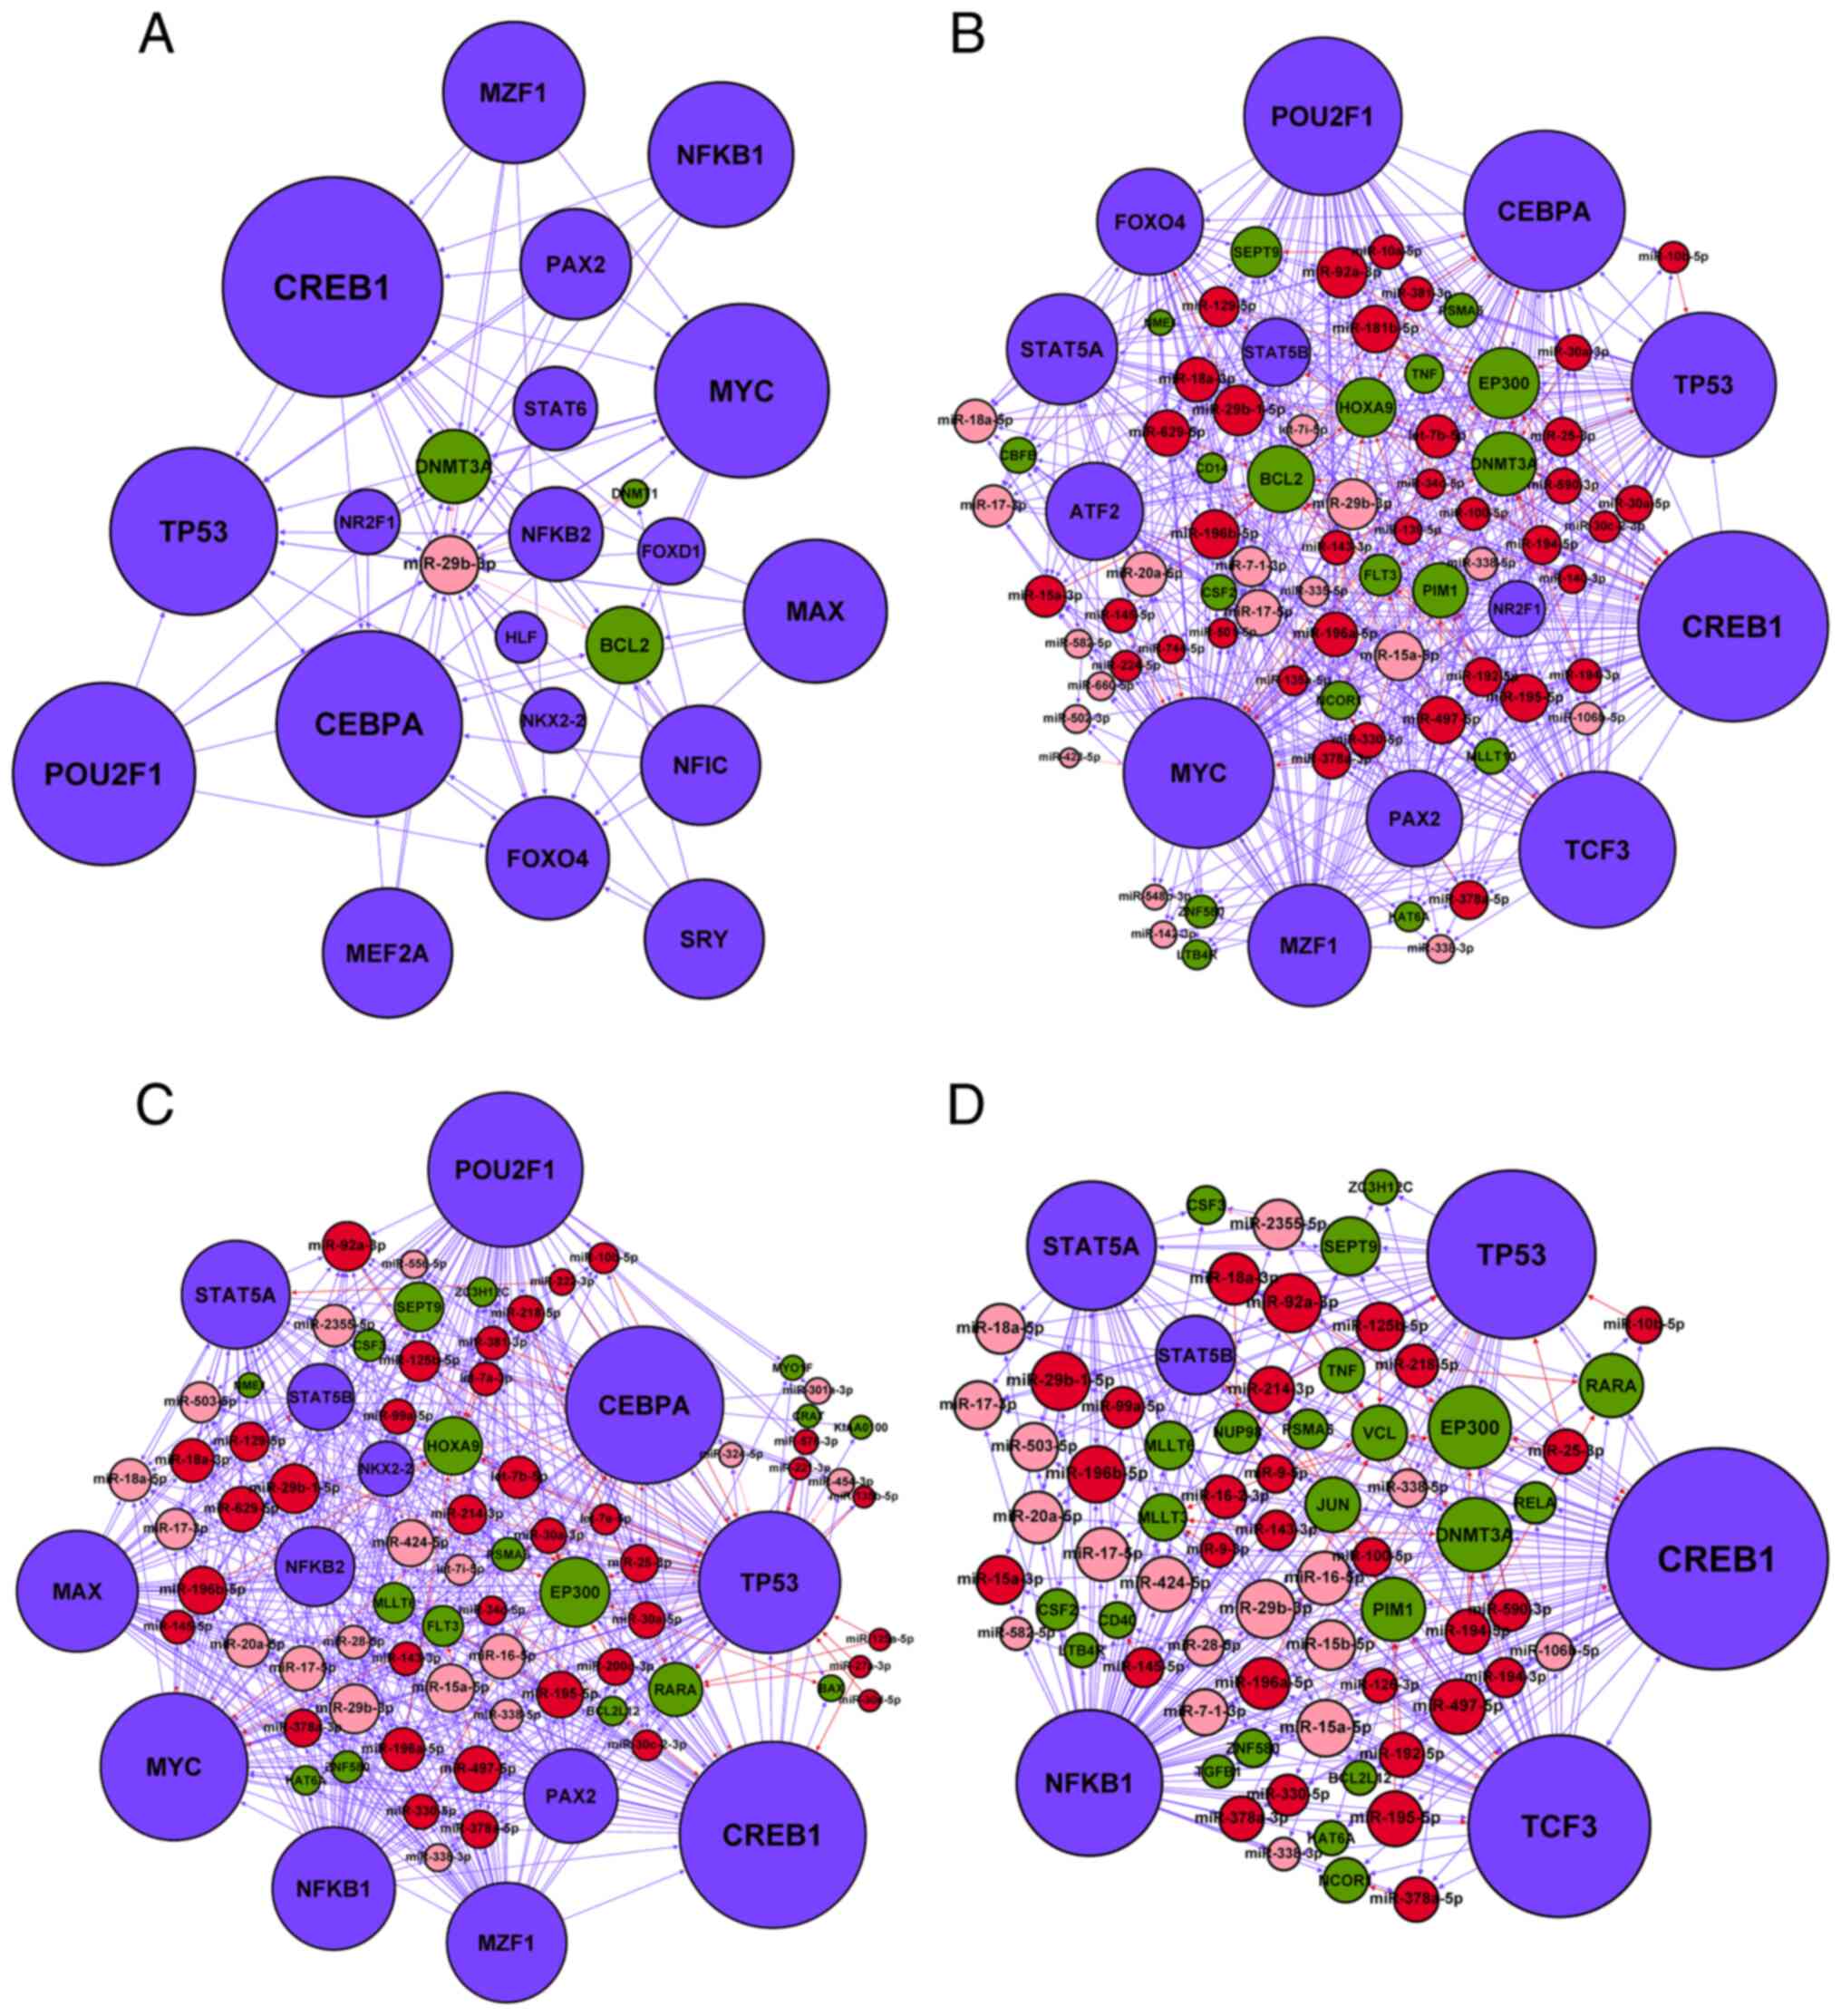 | Figure 6.Subnetworks of the four acute
monocytic leukemia-associated hubs in the miR-transcription factor
regulatory network. All directly linked nodes were extracted to
establish the sub-networks of the (A) miR-29b-3p, (B) MYC,
(C) TP53 and (D) NFKB1 hubs. Red node, upregulated
AMoL-associated miRNA; pink node, downregulated AMoL-associated
miRNA; green node, AMoL candidate gene; blue node, TF. Red arrow,
upregulated miRNA-gene; pink arrow, downregulated miRNA-gene; blue
arrow, TF-miRNA or TF-gene. miR, microRNA. |
| Table VII.Hub miRs in acute monocytic
leukemia-associated miRNA and transcription factor regulatory
network. |
Table VII.
Hub miRs in acute monocytic
leukemia-associated miRNA and transcription factor regulatory
network.
| miRNA | In-degree | Out-degree | Total degree |
|---|
| miR-29b-3p | 19 | 3 | 22 |
| miR-92a-3p | 17 | 5 | 22 |
| miR-29b-1-5p | 21 | 1 | 22 |
| miR-15a-5p | 15 | 6 | 21 |
| miR-196b-5p | 19 | 2 | 21 |
| miR-497-5p | 16 | 4 | 20 |
| miR-195-5p | 16 | 4 | 20 |
| miR-181b-5p | 13 | 7 | 20 |
| miR-424-5p | 16 | 4 | 20 |
| miR-17-5p | 16 | 3 | 19 |
| miR-16-5p | 12 | 7 | 19 |
| miR-629-5p | 17 | 2 | 19 |
| miR-20a-5p | 16 | 2 | 18 |
| miR-18a-3p | 16 | 2 | 18 |
| miR-196a-5p | 16 | 2 | 18 |
| let-7b-5p | 8 | 9 | 17 |
| miR-15b-5p | 12 | 5 | 17 |
| miR-18a-5p | 16 | 1 | 17 |
| miR-2355-5p | 16 | 1 | 17 |
| miR-17-3p | 16 | 0 | 16 |
| miR-503-5p | 16 | 0 | 16 |
| miR-15a-3p | 15 | 1 | 16 |
| miR-125b-5p | 11 | 5 | 16 |
| miR-129-5p | 13 | 2 | 15 |
| miR-214-3p | 12 | 3 | 15 |
| miR-7-1-3p | 14 | 1 | 15 |
| Table VIII.Hub TFs in acute monocytic
leukemia-associated microRNA and TF regulatory network. |
Table VIII.
Hub TFs in acute monocytic
leukemia-associated microRNA and TF regulatory network.
| TF | In-degree | Out-degree | Total degree |
|---|
| CREB1 | 26 | 91 | 117 |
| CEBPA | 26 | 71 | 97 |
| POU2F1 | 0 | 95 | 95 |
| TCF3 | 18 | 76 | 94 |
| MYC | 18 | 72 | 90 |
| TP53 | 26 | 60 | 86 |
| NFKB1 | 0 | 73 | 73 |
| MAX | 0 | 72 | 72 |
| MZF1 | 0 | 71 | 71 |
| MEF2A | 0 | 64 | 64 |
| STAT5A | 12 | 51 | 63 |
| FOXO4 | 15 | 45 | 60 |
| SRY | 0 | 58 | 58 |
| NFIC | 0 | 58 | 58 |
| ATF2 | 0 | 54 | 54 |
| PAX2 | 0 | 53 | 53 |
| NFKB2 | 0 | 43 | 43 |
| STAT6 | 0 | 37 | 37 |
| STAT5B | 15 | 19 | 34 |
| FOXD1 | 0 | 27 | 27 |
| NR2F1 | 0 | 26 | 26 |
| NKX2-2 | 0 | 26 | 26 |
| HLF | 0 | 18 | 18 |
Direct targeting of the promoters of
miR-29b-3p by MYC
In order to evaluate whether miR-29b-3p is a direct
target of MYC, luciferase reporter assays were performed in
THP1 cells with different promoter constructs of miR-29b-3p.
Luciferase activity in WT-MBS constructs was significantly
decreased when cells were transfected with the MYC
overexpression vector (pcDNA3.1-MYC) compared with those
transfected with the pcDNA3.1 plasmid (P<0.01; Fig. 7), indicating inhibition of miR-29b-3p
transcriptional activity by MYC. In addition, luciferase
reporter assays also revealed that MUT-MBS exhibited increased
luciferase activity when MYC was overexpressed (P<0.01),
demonstrating that the MBS within the miR-29b-3p promoter serves a
key role in the regulatory effects of MYC on miR-29b-3p gene
transcriptional activity.
Discussion
The mechanisms underlying AMoL are poorly
understood, which obstructs the design of therapeutic strategies to
treat this disease. Instead of focusing on a priori
candidate genes, systems biology combines experimental data and
computational analysis to investigate molecular interactions and
explain biological behavior at the network level, which may provide
deeper insight into disease pathogenesis and accelerate the
discovery of key elements and regulatory motifs associated with a
disease (33–35). The present study used miRNA
sequencing, TF array and bioinformatics technology to perform a
systems biology-based integrative analysis and construct a
comprehensive miRNA-TF regulatory network for AMoL. Subsequently,
miRNA-TF-mediated regulatory motifs, including 853 FFLs and 29
FBLs, were identified from the network, which have previously been
demonstrated to be significantly overrepresented in the mammalian
gene regulatory network (9,36). FFLs and FBLs are key motifs in gene
regulatory networks that serve important roles in multiple types of
leukemia, including AML, T-ALL and B-cell acute lymphoblastic
leukemia (B-ALL) (7,13,37).
FFLs may serve as the core for the entire gene regulatory network,
which has been used to identify cancer-associated miRNAs or genes
in multiple types of tumor, including T-ALL and B-ALL (9,13,37). The
majority of FFLs in the present network were found to be TF-FFLs,
where in a TF serves as the primary regulator to control the
expression levels of miRNAs and their target genes. This is
consistent with previous studies showing that TF-FFLs are the
prevalent motif in the miRNA-TF regulatory network of glioblastoma
and B-ALL (13,38); this has been demonstrated to be a
powerful tool to determine the etiology of these diseases, thus
unveiling the important role of TF-FFLs in AMoL pathogenesis.
In order to further evaluate the functional
properties of the present network, GO functional classification and
KEGG pathway analysis were performed to analyze the enrichment of
network nodes. Of the 10 highly enriched biological processes
terms, nine (90%) were associated with the initiation and
progression of AMoL. Furthermore, >50% of the significantly
enriched signaling pathways were associated with hematopoiesis or
leukemia. Among them, four have previously been reported to be
involved in AMoL pathogenesis, namely ‘MAPK signaling pathway’,
‘apoptosis’, ‘Toll-like receptor signaling pathway’ and ‘TGF-β
signaling pathway’. These results demonstrated the effectiveness
and reliability of the network construction.
Hubs are highly connected nodes in molecular
interaction networks that serve pivotal roles in sustaining network
structure and function (39). From
the miRNA-TF regulatory network, 26 hub miRNAs and 23 hub TFs that
exert the largest impact on network overall behavior were obtained;
these may serve important regulatory roles in AMoL. In order to
investigate this massive and highly complex network and mine the
critical regulators, subnetworks of the four hubs (miR-29b-3p,
MYC, TP53 and NFKB1) known to be involved in AMoL
were subsequently constructed.
As a positive regulator of granulocytic and
monocytic differentiation, miR-29b-3p has been found to be
downregulated in chronic lymphocytic leukemia and AML, and is a
known tumor suppressor miRNA in leukemogenesis (26,40,41). The
enforced expression of miR-29b-3p markedly inhibits cell
proliferation and induces apoptosis in the THP1 AMoL cell line
(26).
MYC is an essential TF of the
basic-helix-loop-helix-zipper family that regulates numerous
biological processes, including cell proliferation,
differentiation, metabolism, cell cycle progression and apoptosis
(42,43). High levels of MYC expression
are frequently observed in multiple types of malignant
hematopoietic cell, including AMoL (42,44).
Treatment with 10058-F4, a small molecular MYC inhibitor
that disrupts the association between MYC and
MYC-associated X protein, induces cell-cycle arrest and
monocytic differentiation of AMoL U937 cells (27). Similarly, the inhibition of
MYC expression levels by small interfering RNA also induces
cell apoptosis, enhances the sensitivity of cells to mitoxantrone
and abolishes stroma-mediated drug resistance in U937 cells
(28).
TP53 is a nuclear TF that plays a key role in
tumor suppression via the regulation of DNA repair, cell cycle
progression, differentiation, apoptosis, chemosensitivity and
senescence (45). The synergistic
induction of TP53-mediated apoptosis and autophagy by
valproic acid and nutlin-3 in the AMoL cell line MOLM-13 also
inhibits leukemia progression in an in vivo xenograft model
of MOLM-13 (29). Furthermore, the
mutual interaction of p53, Runt-related TF1 and core-binding factor
subunit β contributes to the acquisition of resistance to
cytarabine in AMoL MV4-11 cells (30).
The TF NFKB1 plays an important role in the
regulation of cell proliferation, apoptosis, angiogenesis and
immune responses, and is upregulated in numerous types of
hematological malignancy, including AMoL (46). The blockade of NFKB1 activity
in combination with nutrient depletion yields synergistic
cytotoxicity in MOLM-13 and U937 cells (31). Furthermore, the inhibition of
NFKB1 and heme oxygenase-1 in combination also results in
significant cytotoxicity in THP1 cells (32). Among these hubs, miR-29b-3p was
notable as a pivotal regulator owing to its direct link with three
other hubs (MYC, TP53 and NFKB1) inside the
subnetworks, which also revealed crosstalk between these
subnetworks.
In the subnetworks, miR-29b-3p was potentially
targeted by MYC, NFKB1, TP53 and CEBPA. Furthermore,
MYC and miR-29b-3p were predicted to coordinately regulate
their common target gene BCL2, which established a TF-FFL
composed of MYC, miR-29b-3p and BCL2. It has been
reported that MYC and NFKB1 inhibit miR-29b-3p
expression levels at the transcriptional level via direct binding
to the promoter region of the miR-29b-3p locus (47). The present study also verified that
miR-29b-3p was a direct target of MYC in AMoL THP1 cells.
The downregulation of miR-29b-3p expression levels mediated by
MYC may enhance expression of their target gene BCL2.
Thus, it is hypothesized that MYC may cooperate with
miR-29b-3p to promote BCL2 expression levels in a
MYC/miR-29b-3p/BCL2 TF-FFL. BCL2 is a member
of the BCL2 gene family, which was the first apoptosis
regulator found to be associated with cancer (48). The overexpression of BCL2 has
been detected in numerous types of hematological malignancy,
including AMoL (48,49). Selective BCL2 inhibition by
ABT-199 rapidly inhibits cell growth and induces apoptosis in the
MOLM-13 AMoL cell line and markedly inhibits leukemia progression
in an aggressive mouse xenograft model of MOLM-13 cells (50). A MYC/miR-29b-3p/BCL2
TF-FFL was identified as a potential key motif in the present
network, which may serve an important role in the occurrence and
progression of AMoL.
Notably, TP53 has previously been
demonstrated to be a direct transcriptional activator of
CEBPA (51), whereas
CEBPA activates transcription of the miR-29b-3p gene
(52), which is in accordance with
the regulatory association in the present network, and establishes
a regulatory circuit in which TP53 may regulate miR-29b-3p
expression levels via CEBPA. CEBPA was one of the hub
TFs in the network and is known to serve a crucial role in myeloid
transformation, hematopoietic stem cell self-renewal and cell cycle
control throughout the process of hematopoiesis (53,54).
CEBPA is downregulated in numerous types of human cancer,
including AML, chronic myeloid leukemia, pancreatic cancer and
hepatocellular carcinoma (55).
CEBPA loss also results in the development of AML with
complete penetrance in a CEBPA-deficient mouse model
(55,56). Consistent with these reports,
decreased expression levels of CEBPA were also observed in
the TF array analysis in the present study, implying a potential
association between CEBPA and AMoL. It is hypothesized that
miR-29b-3p is a key miRNA involved in the AMoL miRNA-TF regulatory
network, which may play an important tumor suppressive role in
AMoL.
In order to investigate the regulatory mechanism of
AMoL, a hypothetical model of miR-29b-3p was proposed, involving
signaling pathways and regulatory networks in AMoL (Fig. 8). However, the majority of
AMoL-related miRNAs and genes used in the present study have not
been confirmed to be causal, and the regulatory associations among
miRNAs, TFs and genes were neither complete nor unbiased. Further
experimental validation is warranted to confirm these hypotheses in
future studies.
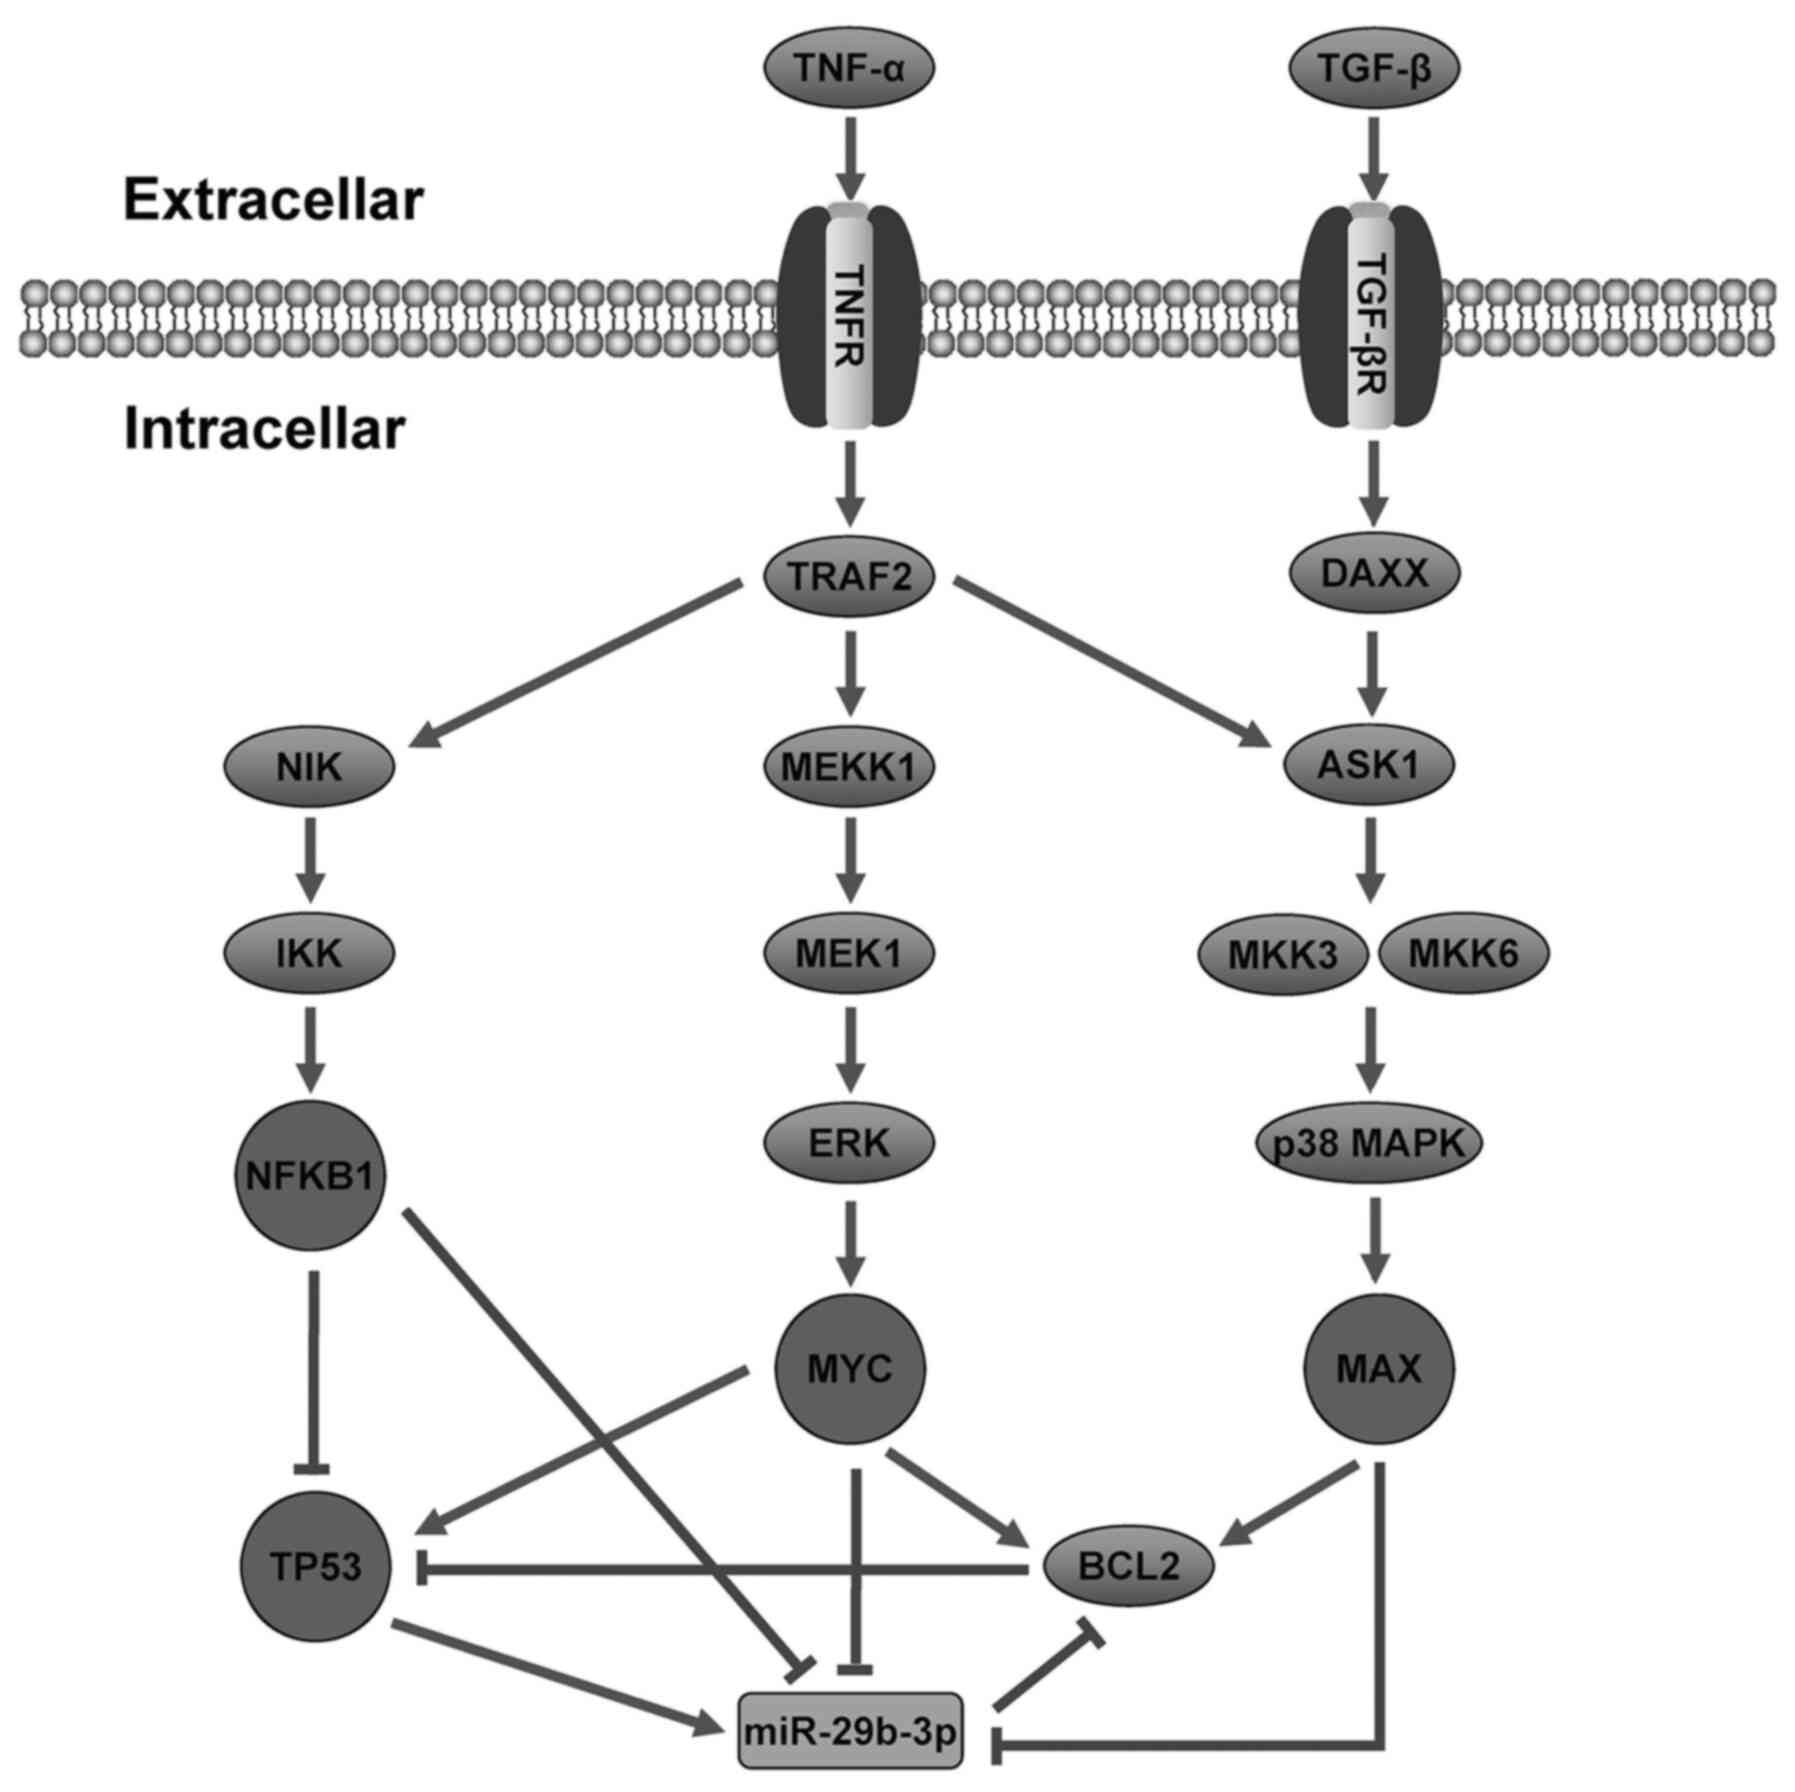 | Figure 8.Hypothetical model of miR-29b-3p
involving signaling pathways and regulatory networks in AMoL.
Following AMoL, expression levels of TNF-α and TGF-β increase, and
MAPK and apoptosis signaling pathways are activated. These signal
transductions trigger TFs such as MAX, MYC, TP53 and
NFKB1 to regulate the transcription of miR-29b-3p.
Rectangle, miRNA; ellipse, gene; circle, TF. Sharp arrow,
activation; T-shaped arrow, repression. miR, microRNA; AMoL, acute
monocytic leukemia; MAX, MYC-associated X protein; TF,
transcription factor. |
To the best of our knowledge, the present study is
the first to demonstrate an miRNA and TF synergistic regulatory
network specifically for human AMoL, which may provide valuable
information to identify critical elements and regulatory motifs in
AMoL and improve understanding of gene regulatory mechanisms in
AMoL.
Acknowledgements
Not applicable.
Funding
The present study was financially supported by the
Guangdong Provincial Natural Science Foundation of China (grant no.
2016A030313677), the Medical Scientific Research Foundation of
Guangdong Province (grant no. A2018520), Zhanjiang Municipal
Governmental Specific Financial Fund Allocated for Competitive
Scientific & Technological Projects (grant no. 2019A01010) and
the Research Fund for the Doctoral Program of Guangdong Medical
University (grant no. B2017002).
Availability of data and materials
The datasets used and/or analyzed in the present
study are available from the corresponding author upon reasonable
request.
Authors' contributions
HTZ and XCL conceived and designed the study. XCL
and QY wrote the manuscript. YMZ and NL made substantial
contributions to the collection and storage of bone marrow samples.
XCL, QY, YMZ, NL and HD conducted the experiments. XCL, WYF and LBL
performed the bioinformatics analysis. All authors read and
approved the final manuscript.
Ethics approval and consent to
participate
The present study was approved by the ethics
committee of Affiliated Hospital of Guangdong Medical University
(approval no. PJ2016081KT; Zhanjiang, China), and all patients or
their guardians provided written informed consent.
Patient consent for publication
Not applicable.
Competing interests
The authors declare that they have no competing
interests.
Glossary
Abbreviations
Abbreviations:
|
AMoL
|
acute monocytic leukemia
|
|
AML
|
acute myeloid leukemia
|
|
miRNA/miR
|
microRNA
|
|
TF
|
transcription factor
|
|
TFBS
|
transcription factor binding site
|
|
FBL
|
feedback loop
|
|
FFL
|
feed-forward loop
|
|
GO
|
Gene Oncology
|
|
KEGG
|
Kyoto Encyclopedia of Genes and
Genomes
|
|
DAVID
|
Database for Annotation,
Visualization and Integrated Discovery
|
|
T-ALL
|
T-cell acute lymphoblastic
leukemia
|
|
B-ALL
|
B-cell acute lymphoblastic
leukemia
|
References
|
1
|
Villeneuve P, Kim DT, Xu W, Brandwein J
and Chang H: The morphological subcategories of acute monocytic
leukemia (M5a and M5b) share similar immunophenotypic and
cytogenetic features and clinical outcomes. Leuk Res. 32:269–273.
2008. View Article : Google Scholar : PubMed/NCBI
|
|
2
|
Wang Y, Ma L, Wang C, Sheng G, Feng L and
Yin C: Autocrine motility factor receptor promotes the
proliferation of human acute monocytic leukemia THP-1 cells. Int J
Mol Med. 36:627–632. 2015. View Article : Google Scholar : PubMed/NCBI
|
|
3
|
Migliavacca J, Percio S, Valsecchi R,
Ferrero E, Spinelli A, Ponzoni M, Tresoldi C, Pattini L, Bernardi R
and Coltella N: Hypoxia inducible factor-1α regulates a
pro-invasive phenotype in acute monocytic leukemia. Oncotarget.
7:53540–53557. 2016. View Article : Google Scholar : PubMed/NCBI
|
|
4
|
Xing S, Wang B, Gao Y, Li M, Wang T, Sun
Y, Shen Y and Chao H: Cytogenetics and associated mutation profile
in patients with acute monocytic leukemia. Int J Lab Hematol.
41:485–492. 2019.PubMed/NCBI
|
|
5
|
Yan XJ, Xu J, Gu ZH, Pan CM, Lu G, Shen Y,
Shi JY, Zhu YM, Tang L, Zhang XW, et al: Exome sequencing
identifies somatic mutations of DNA methyltransferase gene DNMT3A
in acute monocytic leukemia. Nat Genet. 43:309–315. 2011.
View Article : Google Scholar : PubMed/NCBI
|
|
6
|
van Rooij E and Kauppinen S: Development
of microRNA therapeutics is coming of age. EMBO Mol Med. 6:851–864.
2014. View Article : Google Scholar : PubMed/NCBI
|
|
7
|
Zhang HM, Kuang S, Xiong X, Gao T, Liu C
and Guo AY: Transcription factor and microRNA co-regulatory loops:
Important regulatory motifs in biological processes and diseases.
Brief Bioinform. 16:45–58. 2015. View Article : Google Scholar : PubMed/NCBI
|
|
8
|
Hobert O: Gene regulation by transcription
factors and microRNAs. Science. 319:1785–1786. 2008. View Article : Google Scholar : PubMed/NCBI
|
|
9
|
Jiang W, Mitra R, Lin CC, Wang Q, Cheng F
and Zhao Z: Systematic dissection of dysregulated transcription
factor-miRNA feed-forward loops across tumor types. Brief
Bioinform. 17:996–1008. 2016. View Article : Google Scholar : PubMed/NCBI
|
|
10
|
Espadinha AS, Prouzet-Mauléon V, Claverol
S, Lagarde V, Bonneu M, Mahon FX and Cardinaud B: A tyrosine
kinase-STAT5-miR21-PDCD4 regulatory axis in chronic and acute
myeloid leukemia cells. Oncotarget. 8:76174–76188. 2017. View Article : Google Scholar : PubMed/NCBI
|
|
11
|
Wurm AA, Zjablovskaja P, Kardosova M,
Gerloff D, Bräuer-Hartmann D, Katzerke C, Hartmann JU, Benoukraf T,
Fricke S, Hilger N, et al: Disruption of the C/EBPα-miR-182 balance
impairs granulocytic differentiation. Nat Commun. 8:462017.
View Article : Google Scholar : PubMed/NCBI
|
|
12
|
Luo M, Zhang Q, Xia M, Hu F, Ma Z, Chen Z
and Guo AY: differential co-expression and regulatory network
analysis uncover the relapse factor and mechanism of t cell acute
leukemia. Mol Ther Nucleic Acids. 12:184–194. 2018. View Article : Google Scholar : PubMed/NCBI
|
|
13
|
Lin XC, Liu XG, Zhang YM, Li N, Yang ZG,
Fu WY, Lan LB, Zhang HT and Dai Y: Integrated analysis of microRNA
and transcription factor reveals important regulators and
regulatory motifs in adult B-cell acute lymphoblastic leukemia. Int
J Oncol. 50:671–683. 2017. View Article : Google Scholar : PubMed/NCBI
|
|
14
|
Sui W, Lin H, Peng W, Huang Y, Chen J,
Zhang Y and Dai Y: Molecular dysfunctions in acute rejection after
renal transplantation revealed by integrated analysis of
transcription factor, microRNA and long noncoding RNA. Genomics.
102:310–322. 2013. View Article : Google Scholar : PubMed/NCBI
|
|
15
|
Pfaffl MW: A new mathematical model for
relative quantification in real-time RT-PCR. Nucleic Acids Res.
29:e452001. View Article : Google Scholar : PubMed/NCBI
|
|
16
|
Dong M, Wang X, Zhao HL, Chen XL, Yuan JH,
Guo JY, Li KQ and Li G: Integrated analysis of transcription
factor, microRNA and LncRNA in an animal model of obliterative
bronchiolitis. Int J Clin Exp Pathol. 8:7050–7058. 2015.PubMed/NCBI
|
|
17
|
Lin Y, Wu J, Chen H, Mao Y, Liu Y, Mao Q,
Yang K, Zheng X and Xie L: Cyclin-dependent kinase 4 is a novel
target in micoRNA-195-mediated cell cycle arrest in bladder cancer
cells. FEBS Lett. 586:442–447. 2012. View Article : Google Scholar : PubMed/NCBI
|
|
18
|
Rappaport N, Nativ N, Stelzer G, Twik M,
Guan-Golan Y, Stein TI, Bahir I, Belinky F, Morrey CP, Safran M and
Lancet D: MalaCards: An integrated compendium for diseases and
their annotation. Database (Oxford). 2013:bat0182013. View Article : Google Scholar : PubMed/NCBI
|
|
19
|
Felice B, Cattoglio C, Cittaro D, Testa A,
Miccio A, Ferrari G, Luzi L, Recchia A and Mavilio F: Transcription
factor binding sites are genetic determinants of retroviral
integration in the human genome. PLoS One. 4:e45712009. View Article : Google Scholar : PubMed/NCBI
|
|
20
|
Choi YJ, Yoon JH, Cha SW and Lee SG:
Ginsenoside Rh1 inhibits the invasion and migration of THP-1 acute
monocytic leukemia cells via inactivation of the MAPK signaling
pathway. Fitoterapia. 82:911–919. 2011. View Article : Google Scholar : PubMed/NCBI
|
|
21
|
Wang Y, Zhang J, Wang Q, Zhang T, Yang Y,
Yi Y, Gao G, Dong H, Zhu H, Li Y, et al: Bryostatin 5 induces
apoptosis in acute monocytic leukemia cells by activating PUMA and
caspases. Eur J Pharmacol. 718:340–349. 2013. View Article : Google Scholar : PubMed/NCBI
|
|
22
|
Ash D, Subramanian M, Surolia A and Shaha
C: Nitric oxide is the key mediator of death induced by fisetin in
human acute monocytic leukemia cells. Am J Cancer Res. 5:481–497.
2015.PubMed/NCBI
|
|
23
|
Zhou H, Chen D, Xie H, Xia L, Wang T, Yuan
W and Yan J: Activation of MAPKs in the anti-β2GPI/β2GPI-induced
tissue factor expression through TLR4/IRAKs pathway in THP-1 cells.
Thromb Res. 130:e229–235. 2012. View Article : Google Scholar : PubMed/NCBI
|
|
24
|
Zhou Y, Zhang T, Wang X, Wei X, Chen Y,
Guo L, Zhang J and Wang C: Curcumin modulates macrophage
polarization through the inhibition of the toll-like receptor 4
expression and its signaling pathways. Cell Physiol Biochem.
36:631–641. 2015. View Article : Google Scholar : PubMed/NCBI
|
|
25
|
Ansa-Addo EA, Lange S, Stratton D,
Antwi-Baffour S, Cestari I, Ramirez MI, McCrossan MV and Inal JM:
Human plasma membrane-derived vesicles halt proliferation and
induce differentiation of THP-1 acute monocytic leukemia cells. J
Immunol. 185:5236–5246. 2010. View Article : Google Scholar : PubMed/NCBI
|
|
26
|
Gong JN, Yu J, Lin HS, Zhang XH, Yin XL,
Xiao Z, Wang F, Wang XS, Su R, Shen C, et al: The role, mechanism
and potentially therapeutic application of microRNA-29 family in
acute myeloid leukemia. Cell Death Differ. 21:100–112. 2014.
View Article : Google Scholar : PubMed/NCBI
|
|
27
|
Huang MJ, Cheng YC, Liu CR, Lin S and Liu
HE: A small-molecule c-Myc inhibitor, 10058-F4, induces cell-cycle
arrest, apoptosis, and myeloid differentiation of human acute
myeloid leukemia. Exp Hematol. 34:1480–1489. 2006. View Article : Google Scholar : PubMed/NCBI
|
|
28
|
Xia B, Tian C, Guo S, Zhang L, Zhao D, Qu
F, Zhao W, Wang Y, Wu X, Da W, et al: c-Myc plays part in drug
resistance mediated by bone marrow stromal cells in acute myeloid
leukemia. Leuk Res. 39:92–99. 2015. View Article : Google Scholar : PubMed/NCBI
|
|
29
|
McCormack E, Haaland I, Venås G, Forthun
RB, Huseby S, Gausdal G, Knappskog S, Micklem DR, Lorens JB,
Bruserud O and Gjertsen BT: Synergistic induction of p53 mediated
apoptosis by valproic acid and nutlin-3 in acute myeloid leukemia.
Leukemia. 26:910–917. 2012. View Article : Google Scholar : PubMed/NCBI
|
|
30
|
Morita K, Noura M, Tokushige C, Maeda S,
Kiyose H, Kashiwazaki G, Taniguchi J, Bando T, Yoshida K, Ozaki T,
et al: Autonomous feedback loop of RUNX1-p53-CBFB in acute myeloid
leukemia cells. Sci Rep. 7:166042017. View Article : Google Scholar : PubMed/NCBI
|
|
31
|
Fabre C, Carvalho G, Tasdemir E, Braun T,
Adès L, Grosjean J, Boehrer S, Métivier D, Souquère S, Pierron G,
et al: NF-kappaB inhibition sensitizes to starvation-induced cell
death in high-risk myelodysplastic syndrome and acute myeloid
leukemia. Oncogene. 26:4071–4083. 2007. View Article : Google Scholar : PubMed/NCBI
|
|
32
|
Rushworth SA, Bowles KM, Raninga P and
MacEwan DJ: NF-kappaB-inhibited acute myeloid leukemia cells are
rescued from apoptosis by heme oxygenase-1 induction. Cancer Res.
70:2973–2983. 2010. View Article : Google Scholar : PubMed/NCBI
|
|
33
|
Cho JH, Gelinas R, Wang K, Etheridge A,
Piper MG, Batte K, Dakhallah D, Price J, Bornman D, Zhang S, et al:
Systems biology of interstitial lung diseases: integration of mRNA
and microRNA expression changes. BMC Med Genomics. 4:82011.
View Article : Google Scholar : PubMed/NCBI
|
|
34
|
Chatterjee P, Roy D, Bhattacharyya M and
Bandyopadhyay S: Biological networks in Parkinson's disease: an
insight into the epigenetic mechanisms associated with this
disease. BMC Genomics. 18:7212017. View Article : Google Scholar : PubMed/NCBI
|
|
35
|
Vaidya A: Can systems biology approach
help in finding more effective treatment for acute myeloid
leukemia? Syst Synth Biol. 8:165–167. 2014. View Article : Google Scholar : PubMed/NCBI
|
|
36
|
Shalgi R, Lieber D, Oren M and Pilpel Y:
Global and local architecture of the mammalian
microRNA-transcription factor regulatory network. PLoS Comput Biol.
3:e1312007. View Article : Google Scholar : PubMed/NCBI
|
|
37
|
Ye H, Liu X, Lv M, Wu Y, Kuang S, Gong J,
Yuan P, Zhong Z, Li Q, Jia H, et al: MicroRNA and transcription
factor co-regulatory network analysis reveals miR-19 inhibits CYLD
in T-cell acute lymphoblastic leukemia. Nucleic Acids Res.
40:5201–5214. 2012. View Article : Google Scholar : PubMed/NCBI
|
|
38
|
Sun J, Gong X, Purow B and Zhao Z:
Uncovering MicroRNA and transcription factor mediated regulatory
networks in glioblastoma. PLoS Comput Biol. 8:e10024882012.
View Article : Google Scholar : PubMed/NCBI
|
|
39
|
Lin Y, Zhang Q, Zhang HM, Liu W, Liu CJ,
Li Q and Guo AY: Transcription factor and miRNA co-regulatory
network reveals shared and specific regulators in the development
of B cell and T cell. Sci Rep. 5:152152015. View Article : Google Scholar : PubMed/NCBI
|
|
40
|
Garzon R, Heaphy CE, Havelange V, Fabbri
M, Volinia S, Tsao T, Zanesi N, Kornblau SM, Marcucci G, Calin GA,
et al: MicroRNA 29b functions in acute myeloid leukemia. Blood.
114:5331–5341. 2009. View Article : Google Scholar : PubMed/NCBI
|
|
41
|
Liu H, Wang B, Lin J and Zhao L:
microRNA-29b: An emerging player in human cancer. Asian Pac J
Cancer Prev. 15:9059–9064. 2014. View Article : Google Scholar : PubMed/NCBI
|
|
42
|
Brondfield S, Umesh S, Corella A, Zuber J,
Rappaport AR, Gaillard C, Lowe SW, Goga A and Kogan SC: Direct and
indirect targeting of MYC to treat acute myeloid leukemia. Cancer
Chemother Pharmacol. 76:35–46. 2015. View Article : Google Scholar : PubMed/NCBI
|
|
43
|
Yoshida GJ: Emerging roles of Myc in stem
cell biology and novel tumor therapies. J Exp Clin Cancer Res.
37:1732018. View Article : Google Scholar : PubMed/NCBI
|
|
44
|
Zhang Y, Huang Z, Sheng F and Yin Z: MYC
upregulated LINC00319 promotes human acute myeloid leukemia (AML)
cells growth through stabilizing SIRT6. Biochem Biophys Res Commun.
509:314–321. 2019. View Article : Google Scholar : PubMed/NCBI
|
|
45
|
Zhang L, McGraw KL, Sallman DA and List
AF: The role of p53 in myelodysplastic syndromes and acute myeloid
leukemia: Molecular aspects and clinical implications. Leuk
Lymphoma. 58:1777–1790. 2017. View Article : Google Scholar : PubMed/NCBI
|
|
46
|
Breccia M and Alimena G: NF-κB as a
potential therapeutic target in myelodysplastic syndromes and acute
myeloid leukemia. Expert Opin Ther Targets. 14:1157–1176. 2010.
View Article : Google Scholar : PubMed/NCBI
|
|
47
|
Mott JL, Kurita S, Cazanave SC, Bronk SF,
Werneburg NW and Fernandez-Zapico ME: Transcriptional suppression
of mir-29b-1/mir-29a promoter by c-Myc, hedgehog, and NF-kappaB. J
Cell Biochem. 110:1155–1164. 2010. View Article : Google Scholar : PubMed/NCBI
|
|
48
|
Perini GF, Ribeiro N, Pinto Neto JV,
Campos LT and Hamerschlak N: BCL-2 as therapeutic target for
hematological malignancies. J Hematol Oncol. 11:652018. View Article : Google Scholar : PubMed/NCBI
|
|
49
|
Campos L, Rouault JP, Sabido O, Oriol P,
Roubi N, Vasselon C, Archimbaud E, Magaud JP and Guyotat D: High
expression of bcl-2 protein in acute myeloid leukemia cells is
associated with poor response to chemotherapy. Blood. 81:3091–3096.
1993. View Article : Google Scholar : PubMed/NCBI
|
|
50
|
Pan R, Hogdal LJ, Benito JM, Bucci D, Han
L, Borthakur G, Cortes J, DeAngelo DJ, Debose L, Mu H, et al:
Selective BCL-2 inhibition by ABT-199 causes on-target cell death
in acute myeloid leukemia. Cancer Discov. 4:362–375. 2014.
View Article : Google Scholar : PubMed/NCBI
|
|
51
|
Seipel K, Marques MT, Bozzini MA, Meinken
C, Mueller BU and Pabst T: inactivation of the p53-KLF4-CEBPA axis
in acute myeloid leukemia. Clin Cancer Res. 22:746–756. 2016.
View Article : Google Scholar : PubMed/NCBI
|
|
52
|
Eyholzer M, Schmid S, Wilkens L, Mueller
BU and Pabst T: The tumour-suppressive miR-29a/b1 cluster is
regulated by CEBPA and blocked in human AML. Br J Cancer.
103:275–284. 2010. View Article : Google Scholar : PubMed/NCBI
|
|
53
|
Pabst T and Mueller BU: Complexity of
CEBPA dysregulation in human acute myeloid leukemia. Clin Cancer
Res. 15:5303–5307. 2009. View Article : Google Scholar : PubMed/NCBI
|
|
54
|
Gholami M, Bayat S, Manoochehrabadi S,
Pashaiefar H, Omrani MD, Jalaeikhoo H, Yassaee VR, Ebrahimpour MR,
Behjati F and Mirfakhraie R: Investigation of CEBPA and CEBPA-AS
genes expression in acute myeloid leukemia. Rep Biochem Mol Biol.
7:136–141. 2019.PubMed/NCBI
|
|
55
|
Setten RL, Lightfoot HL, Habib NA and
Rossi JJ: Development of MTL-CEBPA: Small Activating RNA drug for
hepatocellular carcinoma. Curr Pharm Biotechnol. 19:611–621. 2018.
View Article : Google Scholar : PubMed/NCBI
|
|
56
|
Kirstetter P, Schuster MB, Bereshchenko O,
Moore S, Dvinge H, Kurz E, Theilgaard-Mönch K, Månsson R, Pedersen
TA, Pabst T, et al: Modeling of C/EBP alpha mutant acute myeloid
leukemia reveals a common expression signature of committed myeloid
leukemia-initiating cells. Cancer Cell. 13:299–310. 2008.
View Article : Google Scholar : PubMed/NCBI
|