Introduction
Glioma is the most common malignant primary brain
tumor, with an incidence of 4.7–7.3/100,000 individuals (1–4) and a
mortality rate of 1.2–4.0/100,000 individuals (5). Despite advances in treatment options
(such as radical surgery and chemo-radiotherapy), the prognosis of
most patients remains poor due to high recurrence rates and
invasiveness, with the 5-year survival rate of only 3–6% for grade
IV (1,4). Therefore, it is important to further
resolve the mechanisms underlying glioma progression to identify
novel targets and develop new therapeutic approaches.
Circular (circ)RNAs are a newly identified class of
non-coding (nc)RNAs with a covalent loop structure lacking the
5′-end cap and 3′-end ploy A tail, which prevents degradation by
RNA exonucleases and confers strong stability in specific cells,
such as tumor cells (6–8). Therefore, abnormal expression of
circRNAs may be a potential mechanism for the development and
progression of cancer, including glioma. This hypothesis has been
demonstrated in several studies. For example, Zhou et al
(9) demonstrated that
hsa_circ_0008344 was significantly upregulated in glioblastoma
tissues compared with the adjacent normal brain tissue. Zhou et
al also reported that knockdown of hsa_circ_0008344 suppressed
glioblastoma cell proliferation, colony formation, migration and
invasion, but facilitated apoptosis. Wang et al (10) found that hsa_circ_0001649 expression
was decreased in glioma specimens and cell lines. In addition,
downregulated hsa_circ_0001649 is significantly associated with
advanced grade and poor prognosis for patients with glioma. The
functions and mechanism of circRNAs remain unclear; however,
accumulating evidence indicates circRNAs have micro (mi)RNA (miR)
response elements (MREs) (6–8), while MREs are widely known to be
located in the 3′-untranslated region (3′-UTR) of the target mRNAs
and miRNAs inhibit mRNA translation by binding to MREs. Thus,
circRNAs may directly bind to miRNAs, impacting the interaction
between miRNAs and mRNAs and contributing to the progression of
glioma. This is known as the competitive endogenous RNA (ceRNA)
hypothesis (6–8). This mechanism of circRNA function has
been reported in several studies. For example, circ-pituitary
homeobox (PITX)1 is upregulated in cancerous tissues and four cell
lines of glioma. Dual-luciferase reporter and rescue assays
indicated that circ-PITX1 may exert its oncogenic functions by
sponging miR-518a-5p, leading to the release of the
miR-518a-5p-mediated repression of interleukin 17 receptor D
(IL17RD) (11). Similarly,
hsa_circ_0034642 levels are also increased in glioma tissues and
cells. Mechanistically, hsa_circ_0034642 sponges miR-1205 to
regulate basic leucine zipper ATF-like transcription factor (BATF)3
levels to facilitate cell proliferation, migration and invasion
(12). Circ-epididymis-specific
α-mannosidase (MAN2B2) regulates S100 calcium-binding protein A8
(S100A8) expression by inhibiting miR-1205 and increasing S100A8
expression rescues the tumor suppressor effects of knockout of
circ-MAN2B2 (13). Upregulated
hsa_circ_0074362 plays a role in glioma progression by regulating
the miR-1236-3p/homeobox B7 pathway (14), and downregulated hsa_circ_0001946 may
act as a ceRNA, inhibiting glioblastoma progression by modulating
miR-671-5p and cerebellar degeneration-related protein 1 (15). Overall, these findings imply that
circRNA/ceRNA axes may be potential targets for the treatment of
glioma; however, few studies have investigated this.
The present study aimed to further screen crucial
circRNA/ceRNA axes for glioma by using the circRNA sequencing data
of Yuan et al (16) and Zhu
et al (17). Only the common
differentially expressed circRNAs (DECs) in these two datasets were
used to construct the ceRNA network based on the interactions
between circRNAs-miRNAs and miRNAs-mRNAs. The expression and
prognostic ability of these hub miRNAs and mRNAs were also
validated using The Cancer Genome Atlas (TCGA) database and
microarray data, which indirectly illustrated the possible proto-
or antioncogenic roles of circRNAs. The current study may provide
some novel therapeutic targets for glioma.
Materials and methods
Data collection
In total, two circRNA datasets of glioblastoma with
the accession numbers GSE86202 (16)
and GSE92322 (17) were downloaded
from the Gene Expression Omnibus (GEO) database (http://www.ncbi.nlm.nih.gov/geo/). Three glioma
and paired normal brain tissues were used for RNA sequencing on
Illumina HiSeq 2500 (Homo sapiens, GPL16791) in GSE86202
dataset (16), while 10 samples
(five glioma and paired normal brain tissues) were included for
circRNA sequencing on Illumina HiSeq 2000 (Homo sapiens,
GPL11154) in GSE92322 dataset (17).
Screening of DECs
The normalized data of each dataset was downloaded
from the GEO database. The gene symbol and circID of circRNAs were
annotated using the circBase database (http://www.circbase.org) (18) according to the chromosome location
and information of the positive-negative chain. The DECs were
identified using edgeR package (http://www.bioconductor.org/packages/release/bioc/html/edgeR.html)
(19). |log2FC
(fold-change) |>1 and P<0.05 were defined as the significance
threshold values. The heatmap of DECs was created using pheatmap
package (version 1.0.8; http://cran.r-project.org/web/packages/pheatmap)
of R language (version 3.4.1; http://www.r-project.org/) (20).
Construction of circRNA-miRNA-mRNA
ceRNA network
The miRNAs that interacted with common DECs in two
datasets were predicted using the CircInteractome (https://circinteractome.nia.nih.gov) (21) and StarBase (http://starbase.sysu.edu.cn/starbase2/) (22) databases. Only the shared miRNAs
predicted in these two databases were used for further analysis.
The target genes of these miRNAs were subsequently predicted using
the miRwalk 2.0 database (23),
which included 12 prediction programs (miRWalk, MicroT4, miRanda,
miRBridge, miRDB, miRMap, miRNAMap, PICTAR2, PITA, RNA22, RNAhybrid
and Targetscan). Only the target genes predicted by at least six
algorithms were retained, which were then compared with established
glioma-related genes collected from the Comparative Toxicogenomics
database (CTD) (24) to obtain
glioma-associated miRNA-mRNA interaction pairs. The
circRNA-miRNA-mRNA-ceRNA network was then established based on
these interaction relationships between DECs-miRNAs and
miRNAs-mRNAs using Cytoscape software (version 3.6.1; www.cytoscape.org/) (25).
Functional enrichment analysis for
DECs and target genes in the ceRNA network
Enrichment analyses for Kyoto Encyclopedia of Genes
and Genomes (KEGG) pathways and Gene Ontology (GO) [including
biological process (BP), cellular component (CC) and molecular
function (MF)] terms were conducted using the ClusterProfiler tool
(26) to predict the possible
function of DECs and target genes in the ceRNA network. P<0.05
adjusted for multiple testing according to Benjamini and Hochberg
(27) was regarded as the cut-off
value.
Prognosis and expression validation
for miRNAs and target genes in the ceRNA network
The LinkedOmics online database (http://www.linkedomics.org/) (28) was searched to explore the
associations between miRNAs/mRNAs and overall survival (OS) rate
for glioma based on a Cox regression, after which Kaplan-Meier
survival curves were automatically provided. TCGA-glioblastoma
multiforme-low grade glioma (GBMLGG) miRNASeq/RNA-seq and clinical
data were selected for miRNAs/mRNAs analysis. The UALCAN web-portal
(http://ualcan.path.uab.edu/index.html) (29) was used for validation of the
expression of target genes of miRNAs between unmatched glioblastoma
multiforme and normal control tissues using TCGA data, in which the
statistical significance was estimated using unpaired Student's
t-tests. GSE103229 (including five glioblastoma and five normal
control tissues) and GSE25632 (including 82 glioblastoma and five
normal controls) (30) microarray
datasets in the GEO database were used to determine the expression
of crucial miRNAs with GEO2R, an interactive web-based statistical
tool (https://www.ncbi.nlm.nih.gov/geo/geo2r/). P<0.05
was considered to indicate a statistically significant
difference.
Results
Identification of DECs
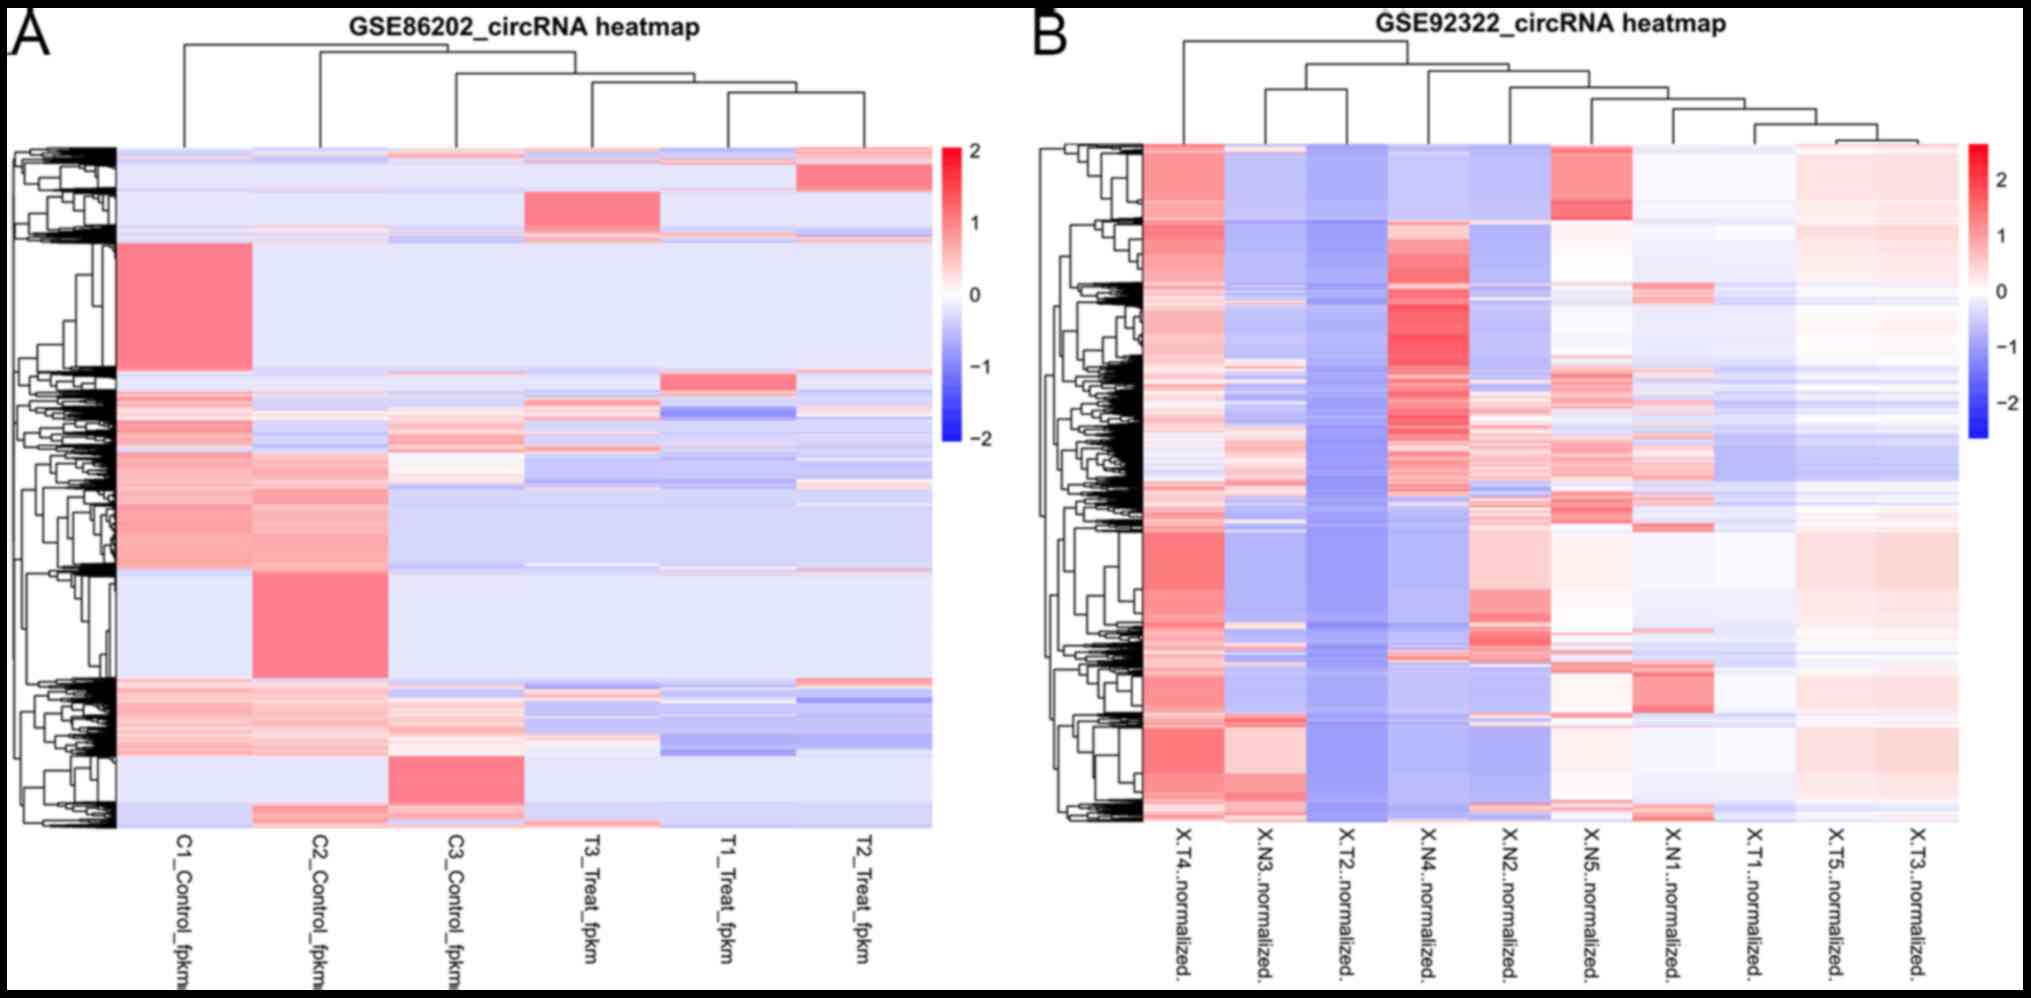
In the GSE86202 dataset, 23,463/37,085 circRNAs were
annotated to the circID in the circBase database and 6,131 had
corresponding Gene_symbols. In the GSE92322 dataset, 12,863/59,386
circRNAs were annotated to the circID in the circBase database and
4,676 of them had corresponding Gene_symbol.
Using the edgeR package, a total of 22 upregulated
(20 had circID and Gene_symbol) and 2,068 (1,874 had circID and
1,332 had Gene_symbol) DECs were identified between glioma and
paired normal brain tissues in the GSE86202 dataset. Meanwhile, 29
upregulated (zero had circID and Gene_symbol) and 1,205 (1,196 had
circID and 884 had Gene_symbol) DECs were identified in the
GSE92322 dataset (Table I). The heat
maps of these DECs are displayed in Fig.
1. These findings suggested that these DECs may be effective to
classify the samples into two groups.
 | Table I.circRNAs identified for glioma. |
Table I.
circRNAs identified for glioma.
|
|
| GSE92322 | GSE86202 |
|---|
|
|
|
|
|
|---|
| circID | Gene_symbol | logFC | P-value | logFC | P-value |
|---|
|
hsa_circ_0001368 | KLHL24 | −7.03946 |
1.62×10⁻⁷ | −11.743 |
3.62×10⁻³ |
|
hsa_circ_0098551 | YAF2 | −6.11209 |
1.81×10⁻⁴ | −9.32971 |
1.72×10⁻² |
|
hsa_circ_0100496 | DGKH | −5.23572 |
6.47×10⁻³ | −8.82079 |
2.37×10⁻² |
|
hsa_circ_0001367 | KLHL24 | −5.88609 |
5.50×10⁻⁴ | −10.9425 |
6.07×10⁻³ |
|
hsa_circ_0064615 | SLC4A7 | −5.87691 |
3.79×10⁻⁴ | −10.562 |
7.75×10⁻³ |
|
hsa_circ_0060425 | PTPRT | −5.01633 |
1.54×10⁻² | −7.7421 |
4.77×10⁻² |
|
hsa_circ_0001936 | BRWD3 | −5.02396 |
1.54×10⁻² | −8.73538 |
2.51×10⁻² |
|
hsa_circ_0104727 | SH3GL3 | −5.67125 |
7.75×10⁻⁴ | −11.395 |
4.53×10⁻³ |
|
hsa_circ_0005114 | RIMS2 | −8.09913 |
3.48×10⁻¹¹ | −6.44629 |
3.90×10⁻² |
|
hsa_circ_0104726 | SH3GL3 | −4.80592 |
1.18×10⁻² | −10.2547 |
9.46×10⁻³ |
|
hsa_circ_0000120 | MAN1A2 | −4.33712 |
3.20×10⁻² | −11.2985 |
4.83×10⁻³ |
|
hsa_circ_0069718 | DCUN1D4 | −5.42038 |
2.74×10⁻³ | −10.1942 |
9.83×10⁻³ |
|
hsa_circ_0130887 | PEX3 | −5.26036 |
6.47×10⁻³ | −10.2911 |
9.24×10⁻³ |
|
hsa_circ_0004516 | C12orf24 | −4.78292 |
1.18×10⁻² | −9.66325 |
1.38×10⁻² |
|
hsa_circ_0117841 | SLC4A10 | −5.46976 |
2.74×10⁻³ | −10.8846 |
6.30×10⁻³ |
|
hsa_circ_0001369 | KLHL24 | −5.94584 |
2.61×10⁻⁴ | −10.6354 |
7.40×10⁻³ |
Functional enrichment analysis for
DECs
A comparison between the two aforementioned datasets
reported that 424 downregulated DECs with Gene_symbol were shared.
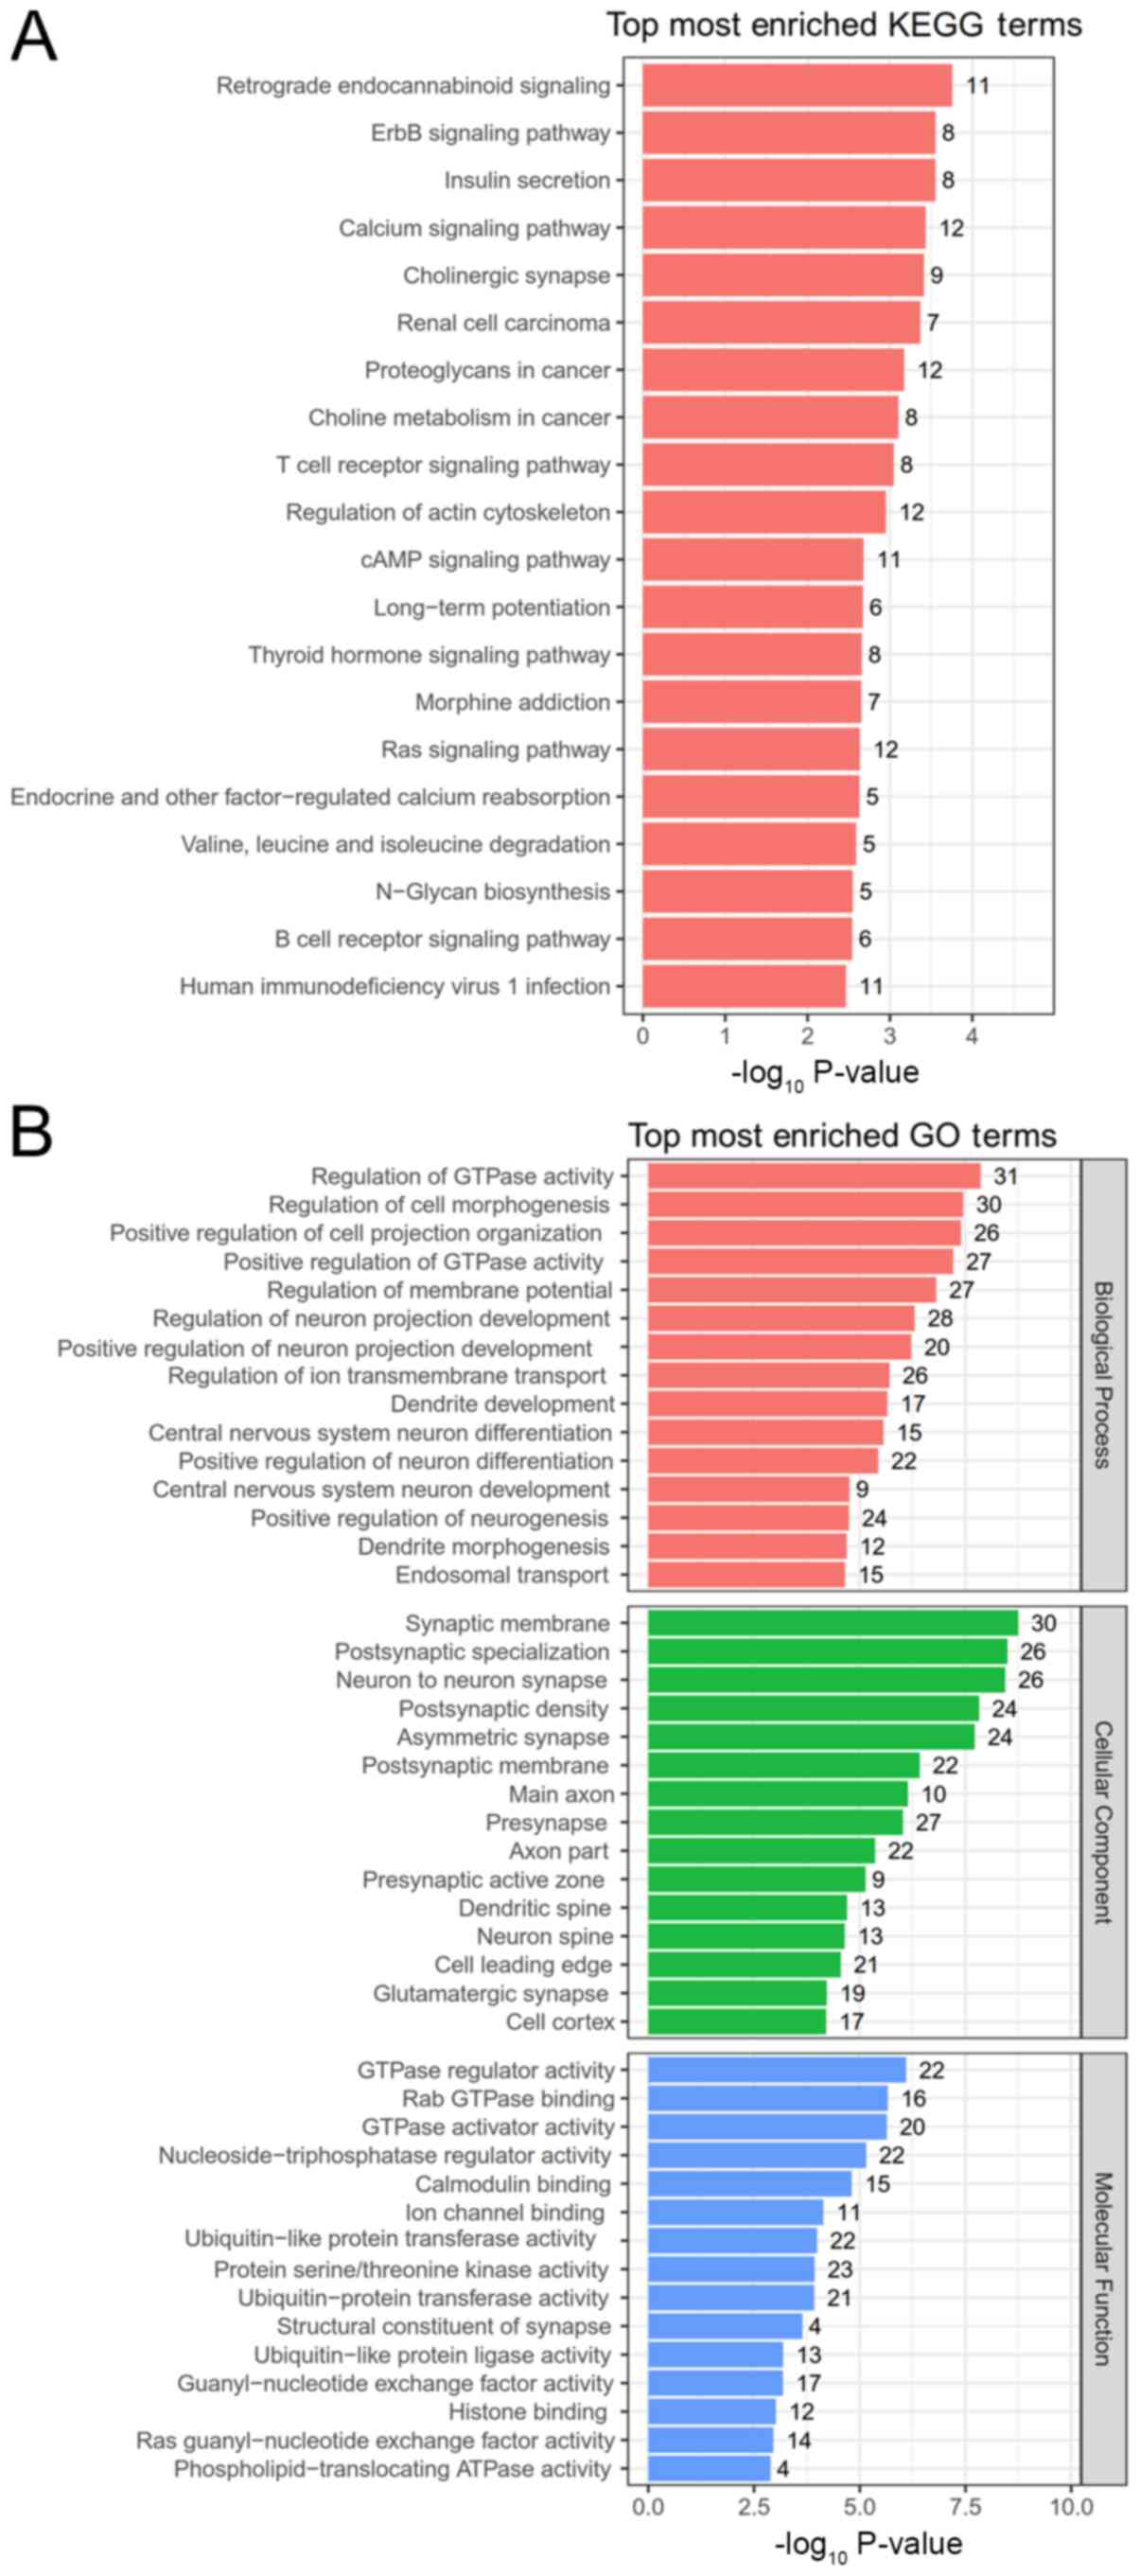
The functions of DECs were enriched according to their
corresponding Gene_symbols. The results showed that 23 KEGG
pathways were enriched (Table II
and Fig. 2A), mainly including
‘retrograde endocannabinoid signaling’, ‘ErbB signaling pathway’
and ‘insulin secretion’ for hsa_circ_0005114. Meanwhile, KEGG
pathways enriched for hsa_circ_0100496 were ‘calcium signaling
pathway’, ‘cholinergic synapse’ and ‘choline metabolism in cancer’,
and ‘N-Glycan biosynthesis’ was enriched for hsa_circ_0000120.
Furthermore, 143 GO terms (including 87 BPs, 38 CCs and 18 MFs;
Table III and Fig. 2B) were also enriched, including
‘regulation of cell morphogenesis’ (hsa_circ_0005114 and
hsa_circ_0001936), ‘regulation of neuron projection development’
(hsa_circ_0005114), ‘central nervous system neuron differentiation’
(hsa_circ_0117841), ‘positive regulation of neuron differentiation’
(hsa_circ_0005114, hsa_circ_0104727) and ‘cell-cell junction’
(hsa_circ_0001368). These findings suggested that hsa_circ_0005114
may be crucial for the development of glioma since it was enriched
in KEGG pathways and GO terms.
| Table II.Kyoto Encyclopedia of Genes and
Genomes pathways enriched for differentially expressed
circRNAs. |
Table II.
Kyoto Encyclopedia of Genes and
Genomes pathways enriched for differentially expressed
circRNAs.
| ID | Description | Adjusted
P-value | Gene ID |
|---|
| hsa04723 | Retrograde
endocannabinoid signaling |
1.65×10⁻² |
CACNA1A/CACNA1C/GABRB2/GABRG3/GNAQ/NAPEPLD/NDUFA10/NDUFS1/PRKACB/PRKCB/RIMS1 |
| hsa04012 | ErbB signaling
pathway |
1.65×10⁻² |
AKT2/AKT3/PAK1/PAK3/PIK3CA/PRKCB/PTK2/SOS2 |
| hsa04911 | Insulin
secretion |
1.65×10⁻² |
CACNA1C/GNAQ/KCNMA1/PCLO/PRKACB/PRKCB/RIMS2/RYR2 |
| hsa04020 | Calcium signaling
pathway |
1.65×10⁻² |
RYR2/CACNA1A/CACNA1C/CACNA1E/CAMK4/GNAQ/PDE1C/PHKB/PRKACB/PRKCB/RYR2/SLC8A1 |
| hsa04725 | Cholinergic
synapse |
1.65×10⁻² |
AKT2/AKT3/CACNA1A/CACNA1C/CAMK4/GNAQ/PIK3CA/PRKACB/PRKCB |
| hsa05211 | Renal cell
carcinoma |
1.65×10⁻² |
AKT2/AKT3/CREBBP/PAK1/PAK3/PIK3CA/SOS2 |
| hsa05205 | Proteoglycans in
cancer |
2.22×10⁻² |
AKT2/AKT3/ANK2/ANK3/ARHGEF12/PAK1/PIK3CA/PRKACB/PRKCB/PTK2/SOS2/TIAM1 |
| hsa05231 | Choline metabolism
in cancer |
2.27×10⁻² |
AKT2/AKT3/DGKB/DGKH/DGKI/PIK3CA/PRKCB/SOS2 |
| hsa04660 | T cell receptor
signaling pathway |
2.30×10⁻² |
AKT2/AKT3/DGKI/4CACNA1C/PAK1/PAK3/PIK3CA/SOS2 |
| hsa04810 | Regulation of actin
cytoskeleton |
2.58×10⁻² |
APC/ARHGEF12/ARHGEF7/DOCK1/MYH10/PAK1/PAK3/PIK3CA/PIKFYVE/PTK2/SOS2/TIAM1 |
| hsa04024 | cAMP signaling
pathway |
3.38×10⁻² |
AKT2/AKT3/RYR2/CACNA1C/CAMK4/CREBBP/PAK1/PIK3CA/PRKACB/RYR2/TIAM1 |
| hsa04720 | Long-term
potentiation |
3.38×10⁻² |
CACNA1C/CAMK4/CREBBP/GNAQ/PRKACB/PRKCB |
| hsa04919 | Thyroid hormone
signaling pathway |
3.38×10⁻² |
AKT2/AKT3/CREBBP/MED13L/PIK3CA/PRKACB/PRKCB/THRB |
| hsa05032 | Morphine
addiction |
3.38×10⁻² |
CACNA1A/GABRB2/GABRG3/PDE1C/PDE8A/PRKACB/PRKCB |
| hsa04014 | Ras signaling
pathway |
3.38×10⁻² |
AKT2/AKT3/NTRK2/PAK1/PAK3/PIK3CA/PRKACB/PRKCB/RAPGEF5/RASA2/SOS2/TIAM1 |
| hsa04961 | Endocrine and other
factor-regulated calcium reabsorption |
3.38×10⁻² |
RYR2/GNAQ/PRKACB/PRKCB/SLC8A1 |
| hsa00280 | Valine, leucine and
isoleucine degradation |
3.48×10⁻² |
HADHB/HMGCLL1/HMGCS1/MCCC1/PCCA |
| hsa00510 | N-Glycan
biosynthesis |
3.48×10⁻² |
FUT8/MAN1A2/MAN2A1/ST6GAL2/TUSC3 |
| hsa04662 | B cell receptor
signaling pathway |
3.48×10⁻² |
AKT2/AKT3/4CACNA1C/PIK3CA/PRKCB/SOS2 |
| hsa05170 | Human
immunodeficiency virus 1 infection |
3.94×10⁻² |
AKT2/AKT3/CUL5/GNAQ/4CACNA1C/PAK1/PAK3/PDIA3/PIK3CA/PRKCB/PTK2 |
| hsa04070 |
Phosphatidylinositol signaling system |
3.94×10⁻² |
DGKB/DGKH/DGKI/PIK3C3/PIK3CA/PIKFYVE/PRKCB |
| hsa05214 | Glioma |
3.95×10⁻² |
AKT2/AKT3/CAMK4/PIK3CA/PRKCB/SOS2 |
| hsa04728 | Dopaminergic
synapse |
4.67×10⁻² |
AKT2/AKT3/CACNA1A/CACNA1C/CLOCK/GNAQ/PRKACB/PRKCB |
| Table III.Significant GO terms enriched for
differentially expressed circRNAs. |
Table III.
Significant GO terms enriched for
differentially expressed circRNAs.
| GO term | ID | Description | Adjusted
P-value | Gene ID |
|---|
| BP | GO:0022604 | Regulation of cell
morphogenesis |
4.70×10⁻⁵ |
ARHGAP44/ARHGEF7/BRWD1/BRWD3/CAPRIN1/CORO1C/CUX1/DLG1/DOCK1/FMNL2/HECW1/HECW2/MKLN1/MYH10/NTRK2/PAK1/PAK3/PARP6/PHIP/PSEN1/PTK2/RHOBTB3/RIMS1/RIMS2/ROBO1/ROBO2/SYT1/TIAM1/TNIK/ZMYM4 |
| BP | GO:0031346 | Positive regulation
of cell projection organization |
4.70×10⁻⁵ |
APC/ARHGEF7/ATP8A2/AUTS2/CAPRIN1/CBFA2T2/CCDC88A/CORO1C/CPEB3/CUX1/HTT/KDM1A/LRRC7/MAGI2/NTRK2/PAK1/PAK3/PARP6/PSEN1/RIMS1/RIMS2/ROBO1/ROBO2/SYT1/TENM3/TIAM1 |
| BP | GO:0042391 | Regulation of
membrane potential |
1.09×10⁻⁴ |
AKAP6/AKT2/ANK2/ANK3/APP/CACNA1A/CACNA1C/CACNA1E/DGKI/DLG1/FGF14/GABRB2/GABRG3/GCLM/GNAQ/KCNH1/KCNK2/KCNMA1/NALCN/NDUFS1/NTRK2/PSEN1/RIMS1/RIMS2/RYR2/SLC8A1/SLMAP |
| BP | GO:0010975 | Regulation of
neuron projection development |
2.93×10⁻⁴ |
ARHGAP44/ATP8A2/CAMSAP2/CAPRIN1/CBFA2T2/CCDC88A/CPEB3/CUX1/FBXO7/HECW1/HECW2/KDM1A/LRRC7/MAGI2/NTRK2/PAK1/PAK3/PARP6/PSEN1/PTK2/RIMS1/RIMS2/ROBO1/ROBO2/SYT1/TENM3/TIAM1/TNIK |
| BP | GO:0034765 | Regulation of ion
transmembrane transport BP |
8.62×10⁻⁴ |
AKAP6/AKT2/ANK2/ANK3/APP/ATG5/CACNA1A/CACNA1C/CACNA1E/CRBN/DLG1/FGF14/HECW1/HECW2/HTT/KCNH1/KCNMA1/KLHL24/NALCN/PKD2/PSEN1/RYR2/SLC8A1/SLMAP/STK39/UBQLN1 |
| BP | GO:0021953 | Central nervous
system neuron differentiation |
9.64×10⁻⁴ |
ADARB1/AGTPBP1/DCLK1/DCLK2/GIGYF2/HERC1/LRP6/NFIB/NTRK2/PSEN1/PTK2/ROBO1/ROBO2/SATB2/SLC4A10 |
| BP | GO:0045666 | Positive regulation
of neuron differentiation |
1.17×10⁻⁴ |
ATP8A2/CAPRIN1/CBFA2T2/CPEB3/CUX1/KDM1A/LRRC7/MAGI2/NTRK2/PAK1/PAK3/PARP6/PSEN1/RIMS1/RIMS2/ROBO1/ROBO2/SH3GL3/SYT1/TCF4/TENM3/TIAM1 |
| BP | GO:0021954 | Central nervous
system neuron development |
4.84×10⁻³ |
ADARB1/DCLK1/DCLK2/NFIB/NTRK2/PTK2/ROBO1/ROBO2/SLC4A10 |
| BP | GO:0050769 | Positive regulation
of neurogenesis |
4.84×10⁻³ |
APP/ATP8A2/CAPRIN1/CBFA2T2/CPEB3/CUX1/KDM1A/LRRC7/MAGI2/MAN2A1/NTRK2/PAK1/PAK3/PARP6/PSEN1/RIMS1/RIMS2/ROBO1/ROBO2/SH3GL3/SYT1/TCF4/TENM3/TIAM1 |
| BP | GO:0097479 | Synaptic vesicle
localization |
5.75×10⁻³ |
AP3B2/CADPS2/DGKI/ERC2/MAGI2/PCLO/PRKCB/PSEN1/RIMS1/RIMS2/STXBP5L/SYN3/SYT1 |
| CC | GO:0097060 | Synaptic
membrane |
5.96×10⁻⁷ |
ANK2/ANK3/ANKS1B/ARHGAP32/ATP2B1/CACNA1C/CADPS2/CNKSR2/CPEB3/DENND1A/DGKI/DLG1/DLG2/ERC1/ERC2/GABRB2/GABRG3/KCNH1/KCNMA1/LRRC7/PICALM/PSD3/PSEN1/RIMS1/RIMS2/SLC8A1/STRN/SYNE1/SYT1/TIAM1 |
| CC | GO:0099572 | Postsynaptic
specialization |
5.96×10⁻⁷ |
ANKS1B/ARHGAP32/ARHGAP44/CACNA1C/CNKSR2/CPEB3/DCLK1/DGKI/DLG1/DLG2/GABRB2/KCNH1/LRRC7/MAGI2/MIB1/NTRK2/PAK3/PCLO/PSD3/SEPT11/SH3GL3/STRN/SYN3/TANC2/TIAM1/TNIK |
| CC | GO:0098984 | Neuron to neuron
synapse |
5.96×10⁻⁷ |
ANKS1B/ARHGAP32/ARHGAP44/CACNA1C/CNKSR2/CPEB3/DCLK1/DGKI/DLG1/DLG2/KCNH1/LRRC7/MAGI2/MIB1/NTRK2/PAK3/PCLO/PSD3/SEPT11/SH3GL3/STRN/SYN3/SYT1/TANC2/TIAM1/TNIK |
| CC | GO:0014069 | Postsynaptic
density |
1.84×10⁻⁶ |
ANKS1B/ARHGAP32/ARHGAP44/CACNA1C/CNKSR2/CPEB3/DCLK1/DGKI/DLG1/DLG2/KCNH1/LRRC7/MAGI2/MIB1/NTRK2/PAK3/PCLO/PSD3/SH3GL3/STRN/SYN3/TANC2/TIAM1/TNIK |
| CC | GO:0098793 | Presynapse |
5.86×10⁻⁵ |
APP/ARHGAP44/ATP2B1/CADPS2/DENND1A/DGKI/ERC1/ERC2/HTT/ICA1/KCNH1/KCNK2/MCTP1/NTRK2/PCLO/PICALM/PRKCB/PSEN1/RIMS1/RIMS2/RPH3A/SH3GL3/STX12/SYN3/SYT1/TNIK/WDR7 |
| CC | GO:0048786 | Presynaptic active
zone |
3.58×10⁻⁴ |
APP/ARHGAP44/ATP2B1/DGKI/ERC1/ERC2/PCLO/RIMS1/RIMS2 |
| CC | GO:0098978 | Glutamatergic
synapse |
2.05×10⁻³ |
ARHGAP44/ATP2B1/CADPS2/CAMK4/CNKSR2/DGKB/DGKI/DLG1/DLG2/ERC2/MYH10/PAK3/SEPT11/SH3GL3/SYN3/SYT1/TANC2/TIAM1/TNIK |
| CC | GO:0005938 | Cell cortex |
2.05×10⁻³ |
AKT2/ARHGAP32/ARHGEF7/ERC2/EXOC6B/FMN2/MKLN1/MYH10/PCLO/PKD2/PSEN1/PTK2/RHOBTB3/RIC8B/RIMS1/RIMS2/SEPT11 |
| CC | GO:0043025 | Neuronal cell
body |
2.28×10⁻³ |
AMFR/ARHGEF7/ATP2B1/CACNA1A/CACNA1C/CNKSR2/DENND1A/DGKI/GIGYF2/KCNH1/KCNK2/KLHL24/LMTK2/LRP6/MYH10/PDE1C/PICALM/PSEN1/SLC1A4/SLC4A10/STRN/TIAM1/TMEM50A |
| CC | GO:0005911 | Cell-cell
junction |
8.24×10⁻³ |
AKAP6/ANK2/ANK3/APC/APP/ASH1L/DLG1/KLHL24/LRRC7/MAGI2/NFASC/PAK1/PIKFYVE/PKD2/SDCCAG8/SLC8A1/SPECC1L/STRN/TIAM1/TJP1 |
| MF | GO:0017137 | Rab GTPase
binding |
4.74×10⁻⁴ |
ACAP2/CLEC16A/DENND1A/DENND1B/DENND5B/ERC1/GAPVD1/PICALM/RHOBTB3/RIMS1/RIMS2/RPH3A/STXBP5L/TBC1D12/TBC1D1/TBCK |
| MF | GO:0044325 | Ion channel
binding |
7.48×10⁻³ |
AKAP6/ANK2/ANK3/DLG1/HTT/KCNH1/PKD2/RIMS1/RIMS2/RYR2/SLC8A1 |
| MF | GO:0004143 | Diacylglycerol
kinase activity |
4.94×10⁻² | DGKB/DGKH/DGKI |
Construction of the ceRNA network and
functional enrichment
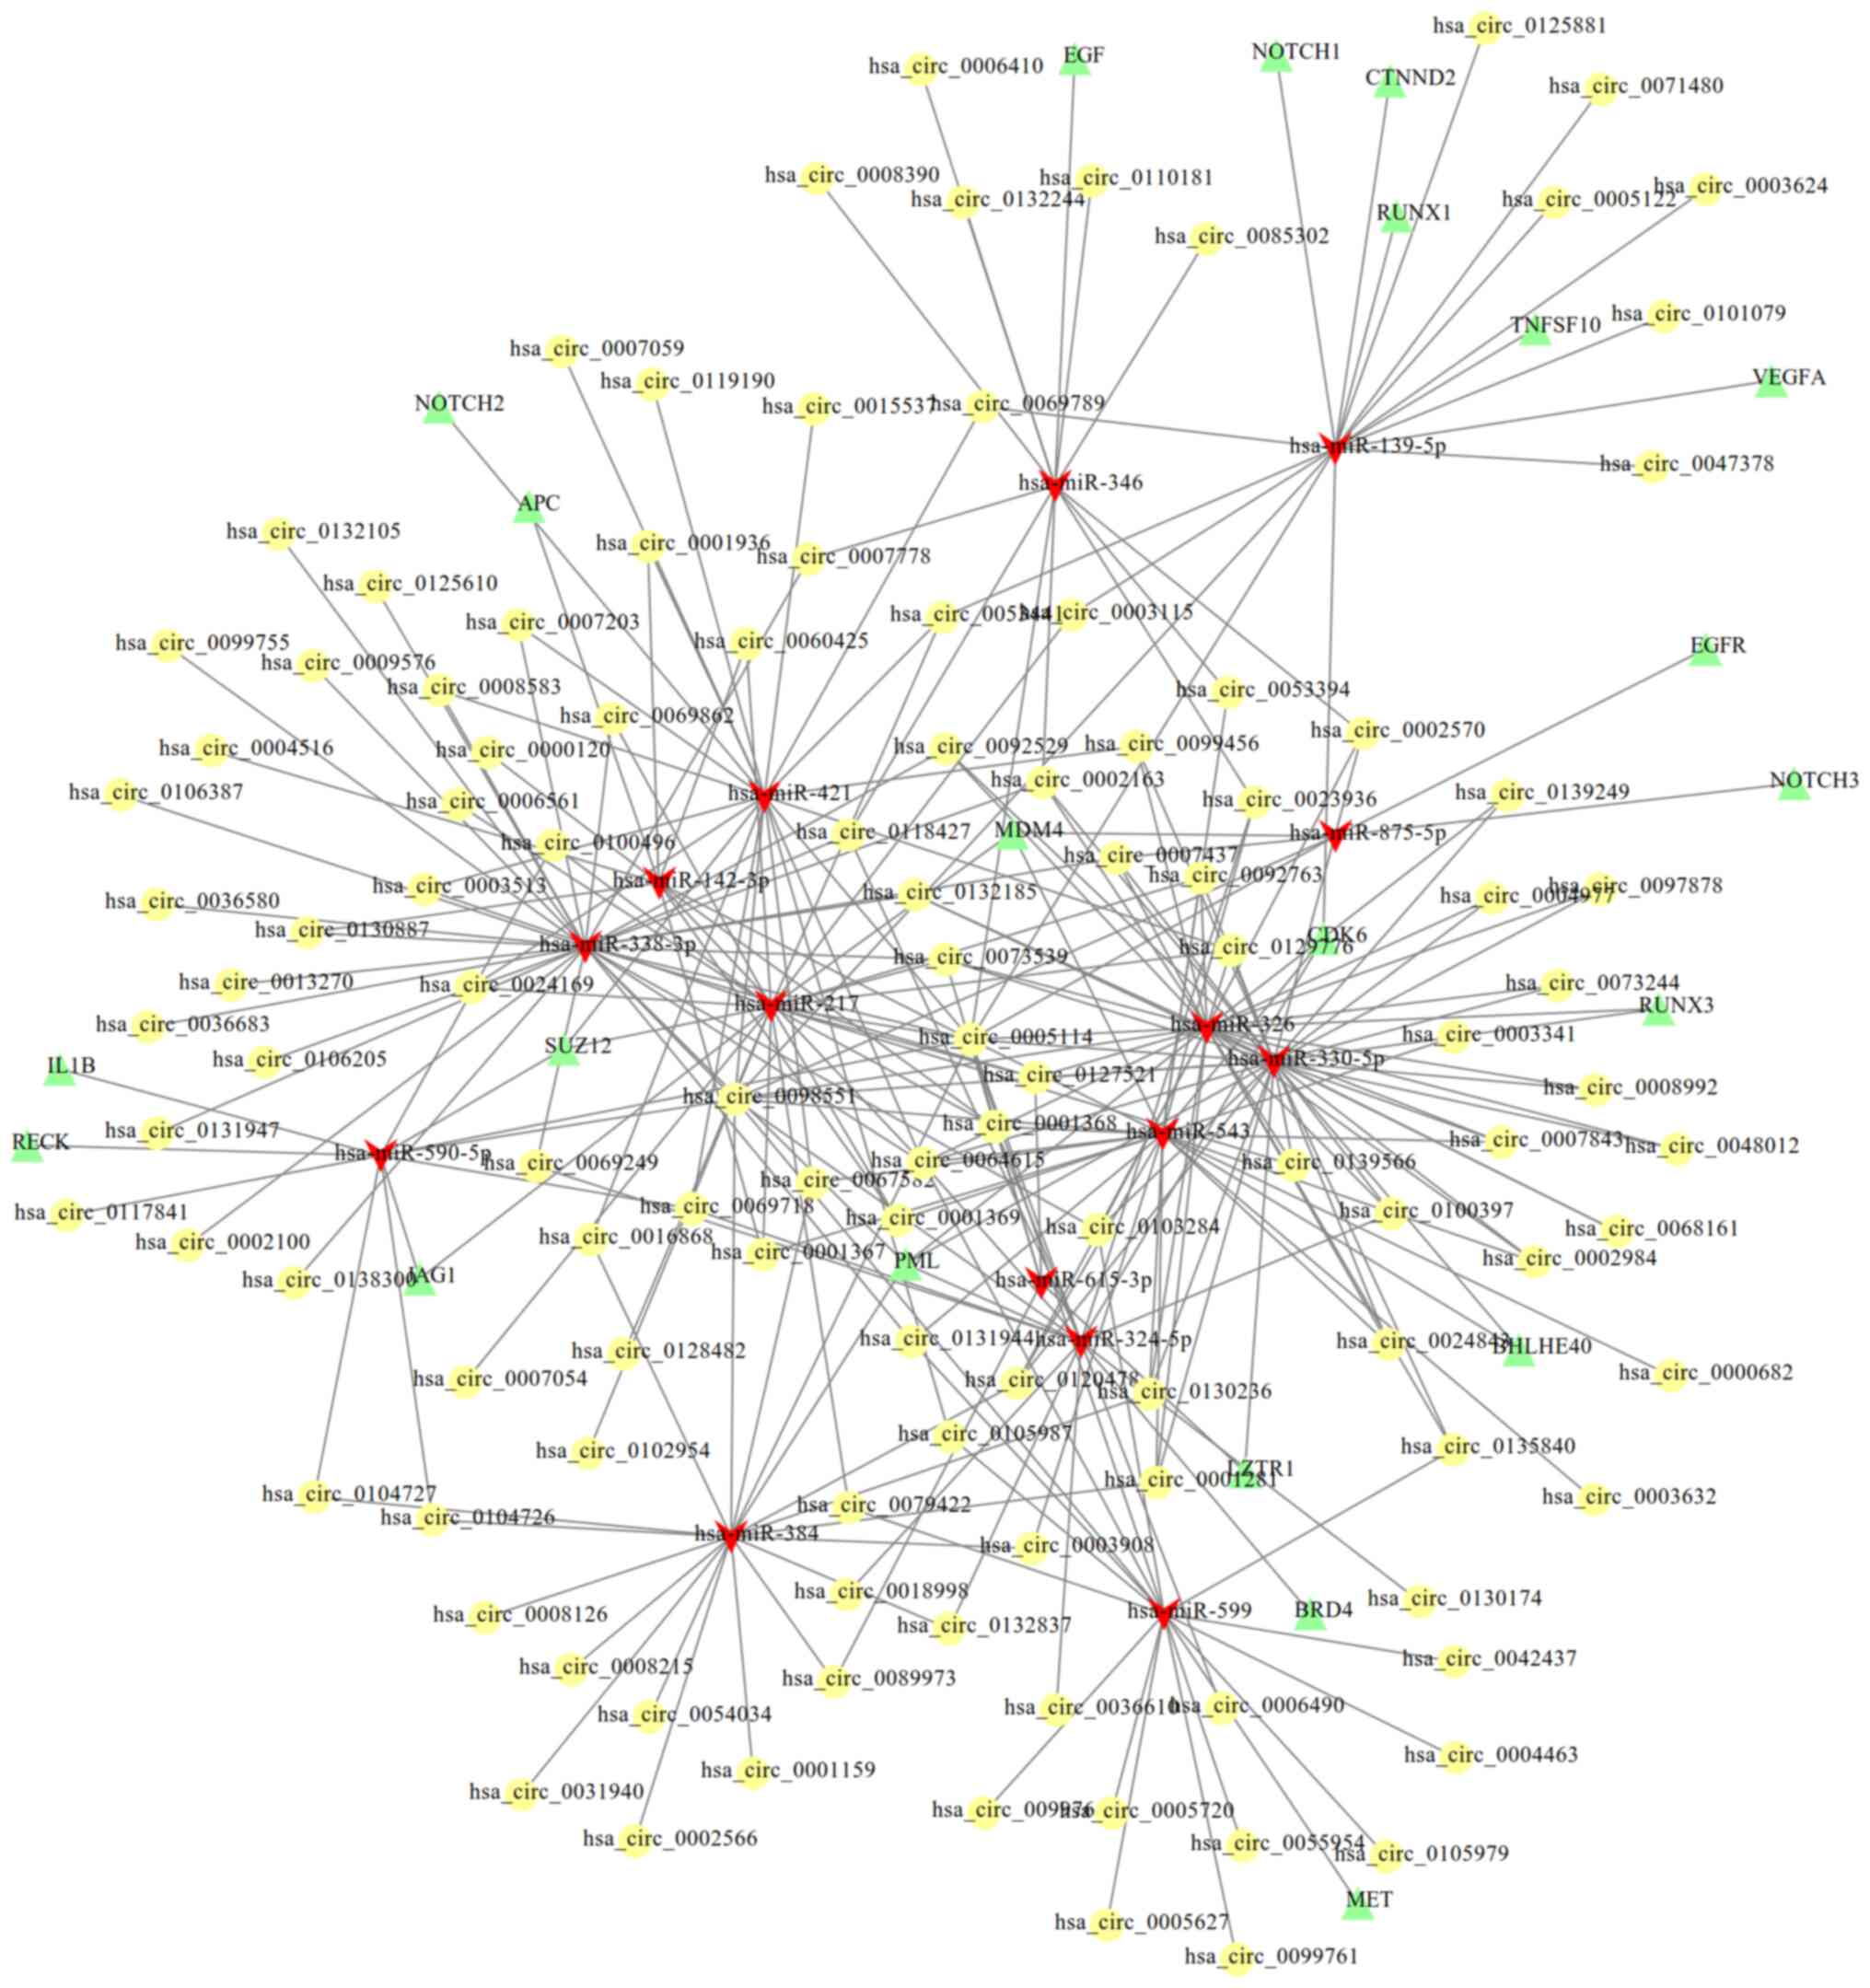
After uploading the circID (197 common in the two
datasets) to the CircInteractome database, 313 miRNAs were
predicted to interact with DECs. Using Gene_symbol, 276 miRNAs were
predicted to interact with DECs using Starbase. Among them, 18
miRNAs were shared, including hsa-miR-139-5p, −142-3p, −184, −217,
−324-5p, −326, −330-5p, −338-3p, −346, −375, −384, −421, −496,
−543, −590-5p, −599, −615-3p and −875-5p). Subsequently, the target
genes were predicted for these 18 miRNAs using the miRwalk 2.0
database, which were then compared with 65 pre-established
glioma-related genes collected from the CTD database. In total, 22
genes were shared, including BRD4, SUZ12, VEGFA, NOTCH3, NOTCH2,
RUNX3, CTNND2, EGFR, CDK6, PML, BHLHE40, EGF, NOTCH1, TNFSF10,
LZTR1, RUNX1, MDM4, MET, IL1B, JAG1, APC and RECK. Then, the ceRNA
network was established based on 115 DECs, 15 miRNAs and the
aforementioned 22 mRNAs (Fig.
3).
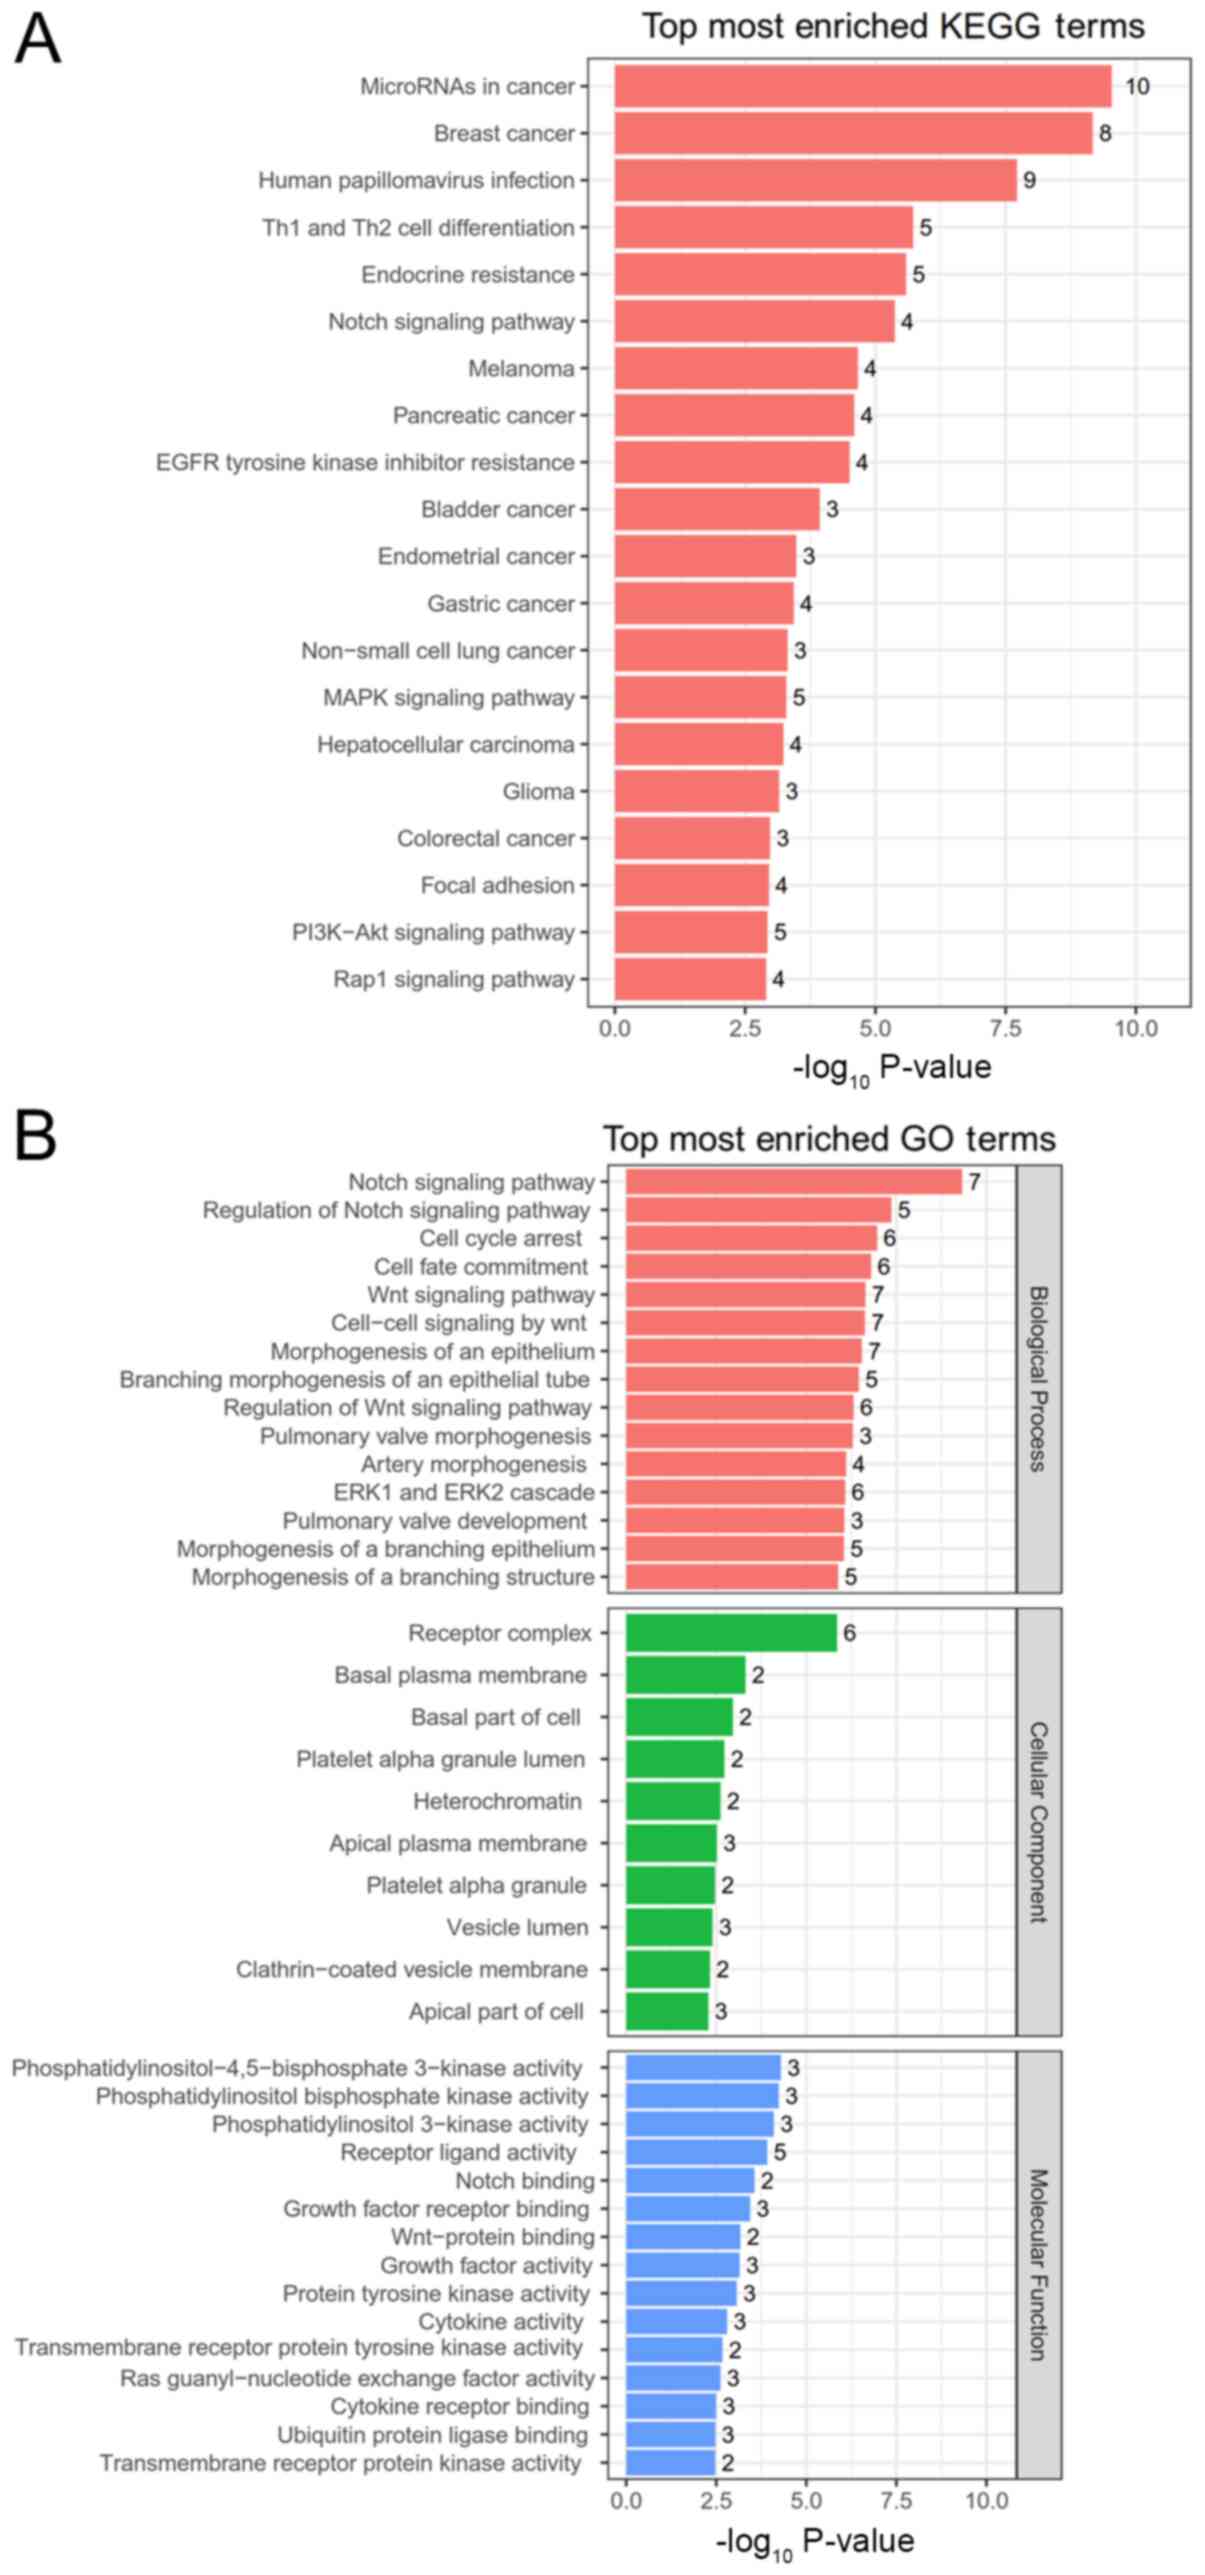
Function analysis for the target genes of miRNAs in
this ceRNA network showed that 44 KEGG pathways (Table IV and Fig. 4A) and 736 GO terms (including 713
BPs, three CCs and 20 MFs) (Table V
and Fig. 4B) were enriched, such as
‘regulation of actin cytoskeleton’ (Table IV), various cancer pathways
(including ‘miRNAs in cancer’, ‘breast cancer’, ‘endometrial
cancer’, ‘gastric cancer’, ‘hepatocellular carcinoma’ and
‘colorectal cancer’; Fig. 4A), ‘Wnt
signaling pathway’, ‘cell cycle arrest’, ‘cell fate commitment’
(Fig. 4B) and cell junction assembly
(Table V), in all of which the APC
gene was included. These findings suggested that the
circRNAs-miRNAs that regulated APC may be crucial for the
development of glioma.
| Table IV.Kyoto Encyclopedia of Genes and
Genomes pathways enriched for genes in the competing endogenous RNA
network. |
Table IV.
Kyoto Encyclopedia of Genes and
Genomes pathways enriched for genes in the competing endogenous RNA
network.
| ID | Description | Adjusted
P-value | Gene ID |
|---|
| hsa05206 | microRNAs in
cancer |
3.02×10⁻⁸ |
APC/CDK6/EGFR/MDM4/MET/NOTCH1/NOTCH2/NOTCH3/RECK/VEGFA |
| hsa05224 | Breast cancer |
3.50×10⁻⁸ |
APC/CDK6/EGF/EGFR/JAG1/NOTCH1/NOTCH2/NOTCH3 |
| hsa05165 | Human
papillomavirus infection |
6.64×10⁻⁷ |
APC/CDK6/EGF/EGFR/JAG1/NOTCH1/NOTCH2/NOTCH3/VEGFA |
| hsa04658 | Th1 and Th2 cell
differentiation |
4.91×10⁻⁵ |
JAG1/NOTCH1/NOTCH2/NOTCH3/RUNX3 |
| hsa01522 | Endocrine
resistance |
5.38×10⁻⁵ |
EGFR/JAG1/NOTCH1/NOTCH2/NOTCH3 |
| hsa04330 | Notch signaling
pathway |
7.36×10⁻⁵ |
JAG1/NOTCH1/NOTCH2/NOTCH3 |
| hsa05218 | Melanoma |
3.22×10⁻⁴ |
CDK6/EGF/EGFR/MET |
| hsa05212 | Pancreatic
cancer |
3.31×10⁻⁴ |
CDK6/EGF/EGFR/VEGFA |
| hsa01521 | EGFR tyrosine
kinase inhibitor resistance |
3.62×10⁻⁴ |
EGF/EGFR/MET/VEGFA |
| hsa05219 | Bladder cancer |
1.22×10⁻³ | EGF/EGFR/VEGFA |
| hsa05213 | Endometrial
cancer |
3.13×10⁻³ | APC/EGF/EGFR |
| hsa05226 | Gastric cancer |
3.21×10⁻³ |
APC/EGF/EGFR/MET |
| hsa05223 | Non-small cell lung
cancer |
3.81×10⁻³ | CDK6/EGF/EGFR |
| hsa04010 | MAPK signaling
pathway |
3.81×10⁻³ |
EGF/EGFR/RUNX3/MET/VEGFA |
| hsa05225 | Hepatocellular
carcinoma |
4.05×10⁻³ |
APC/CDK6/EGFR/MET |
| hsa05214 | Glioma |
4.59×10⁻³ | CDK6/EGF/EGFR |
| hsa05210 | Colorectal
cancer |
6.37×10⁻³ | APC/EGF/EGFR |
| hsa04510 | Focal adhesion |
6.37×10⁻³ |
EGF/EGFR/MET/VEGFA |
| hsa04151 | PI3K-Akt signaling
pathway |
6.44×10⁻³ |
CDK6/EGF/EGFR/MET/VEGFA |
| hsa04015 | Rap1 signaling
pathway |
6.52×10⁻³ |
EGF/EGFR/MET/VEGFA |
| hsa04066 | HIF-1 signaling
pathway |
8.06×10⁻³ | EGF/EGFR/VEGFA |
| hsa05163 | Human
cytomegalovirus infection |
8.22×10⁻³ |
CDK6/EGFR/RUNX3/VEGFA |
| hsa04014 | Ras signaling
pathway |
8.80×10⁻³ |
EGF/EGFR/MET/VEGFA |
| hsa04919 | Thyroid hormone
signaling pathway |
1.08×10⁻² |
NOTCH1/NOTCH2/NOTCH3 |
| hsa05020 | Prion diseases |
1.29×10⁻² | RUNX3/NOTCH1 |
| hsa04068 | FoxO signaling
pathway |
1.38×10⁻² |
EGF/EGFR/TNFSF10 |
| hsa05162 | Measles |
1.38×10⁻² |
CDK6/RUNX3/TNFSF10 |
| hsa04934 | Cushing
syndrome |
2.02×10⁻² | APC/CDK6/EGFR |
| hsa05160 | Hepatitis C |
2.02×10⁻² | CDK6/EGF/EGFR |
| hsa05144 | Malaria | 2.08E-02 | RUNX3/MET |
| hsa05164 | Influenza A |
2.48×10⁻² |
RUNX3/PML/TNFSF10 |
| hsa05202 | Transcriptional
misregulation in cancer |
3.00×10⁻² | MET/PML/RUNX1 |
| hsa05230 | Central carbon
metabolism in cancer |
3.27×10⁻² | EGFR/MET |
| hsa05221 | Acute myeloid
leukemia |
3.27×10⁻² | PML/RUNX1 |
| hsa05120 | Epithelial cell
signaling in Helicobacter pylori infection |
3.27×10⁻² | EGFR/MET |
| hsa05205 | Proteoglycans in
cancer |
3.27×10⁻² | EGFR/MET/VEGFA |
| hsa05211 | Renal cell
carcinoma |
3.27×10⁻² | MET/VEGFA |
| hsa04115 | p53 signaling
pathway |
3.36×10⁻² | CDK6/MDM4 |
| hsa04520 | Adherens
junction |
3.36×10⁻² | EGFR/MET |
| hsa04810 | Regulation of actin
cytoskeleton |
3.51×10⁻² | APC/EGF/EGFR |
| hsa05220 | Chronic myeloid
leukemia |
3.55×10⁻² | CDK6/RUNX1 |
| hsa04012 | ErbB signaling
pathway |
4.28×10⁻² | EGF/EGFR |
| hsa04540 | Gap junction |
4.47×10⁻² | EGF/EGFR |
| hsa05323 | Rheumatoid
arthritis |
4.55×10⁻² | RUNX3/VEGFA |
| Table V.Significant GO terms enriched for
genes in the competing endogenous RNA network. |
Table V.
Significant GO terms enriched for
genes in the competing endogenous RNA network.
| GO term | ID | Description | Adjusted
P-value | Gene ID |
|---|
| BP | GO:0016055 | Wnt signaling
pathway |
2.09×10⁻⁵ |
APC/CTNND2/EGF/EGFR/MET/NOTCH1/RECK/RUNX1 |
| BP | GO:0198738 | Cell-cell signaling
by wnt |
2.09×10⁻⁵ |
APC/CTNND2/EGF/EGFR/MET/NOTCH1/RECK/RUNX1 |
| BP | GO:0030111 | Regulation of Wnt
signaling pathway |
2.17×10⁻⁵ |
APC/CTNND2/EGF/EGFR/NOTCH1/RECK/RUNX1 |
| BP | GO:0060828 | Regulation of
canonical Wnt signaling pathway |
7.32×10⁻⁵ |
APC/CTNND2/EGF/EGFR/NOTCH1/RECK |
| BP | GO:0007050 | Cell cycle
arrest |
7.32×10⁻⁵ |
APC/CDK6/MDM4/NOTCH1/NOTCH2/PML |
| BP | GO:0045165 | Cell fate
commitment |
9.34×10⁻⁵ |
APC/JAG1/NOTCH1/NOTCH2/NOTCH3/PML |
| BP | GO:0060070 | Canonical Wnt
signaling pathway |
1.31×10⁻⁴ |
APC/CTNND2/EGF/EGFR/NOTCH1/RECK |
| BP | GO:0042176 | Regulation of
protein catabolic process |
3.36×10⁻⁴ |
APC/EGF/EGFR/IL1B/MDM4/PML |
| BP | GO:0048871 | Multicellular
organismal homeostasis |
7.99×10⁻⁴ |
APC/EGFR/IL1B/MET/NOTCH1/VEGFA |
| BP | GO:0033044 | Regulation of
chromosome organization |
1.45×10⁻³ |
APC/BRD4/IL1B/PML/VEGFA |
| BP | GO:0034329 | Cell junction
assembly |
3.62×10⁻³ |
APC/CTNND2/RUNX1/VEGFA |
| BP | GO:1901652 | Response to
peptide |
3.98×10⁻³ |
APC/IL1B/JAG1/NOTCH1/TNFSF10 |
| BP | GO:0071900 | Regulation of
protein serine/threonine kinase activity |
4.29×10⁻³ |
APC/EGF/EGFR/IL1B/VEGFA |
| BP | GO:0045930 | Negative regulation
of mitotic cell cycle |
1.45×10⁻³ |
APC/EGFR/MDM4/PML |
| BP | GO:0034330 | Cell junction
organization |
4.78×10⁻³ |
APC/CTNND2/RUNX1/VEGFA |
| BP | GO:0007043 | Cell-cell junction
assembly |
5.19×10⁻³ |
APC/CTNND2/RUNX1 |
| BP | GO:0010948 | Negative regulation
of cell cycle process |
5.30×10⁻³ |
APC/MDM4/PML/SUZ12 |
| BP | GO:0106106 | Cold-induced
thermogenesis |
6.58×10⁻³ |
APC/NOTCH1/VEGFA |
| BP | GO:0045216 | Cell-cell junction
organization |
7.56×10⁻³ |
APC/CTNND2/RUNX1 |
| MF | GO:0008013 | Beta-catenin
binding |
3.47×10⁻² | APC/CTNND2 |
| MF | GO:0031625 | Ubiquitin protein
ligase binding |
3.47×10⁻² | APC/EGFR/PML |
| MF | GO:0044389 | Ubiquitin-like
protein ligase binding |
3.78×10⁻² | APC/EGFR/PML |
Prognosis and expression analysis for
miRNAs and target genes
LinkedOmics online analysis using TCGA data showed
that 19 mRNAs and nine miRNAs were significantly associated with OS
(Table VI and Fig. 5). These prognosis-related miRNAs and
mRNAs constituted 20 interaction relationships in the ceRNA
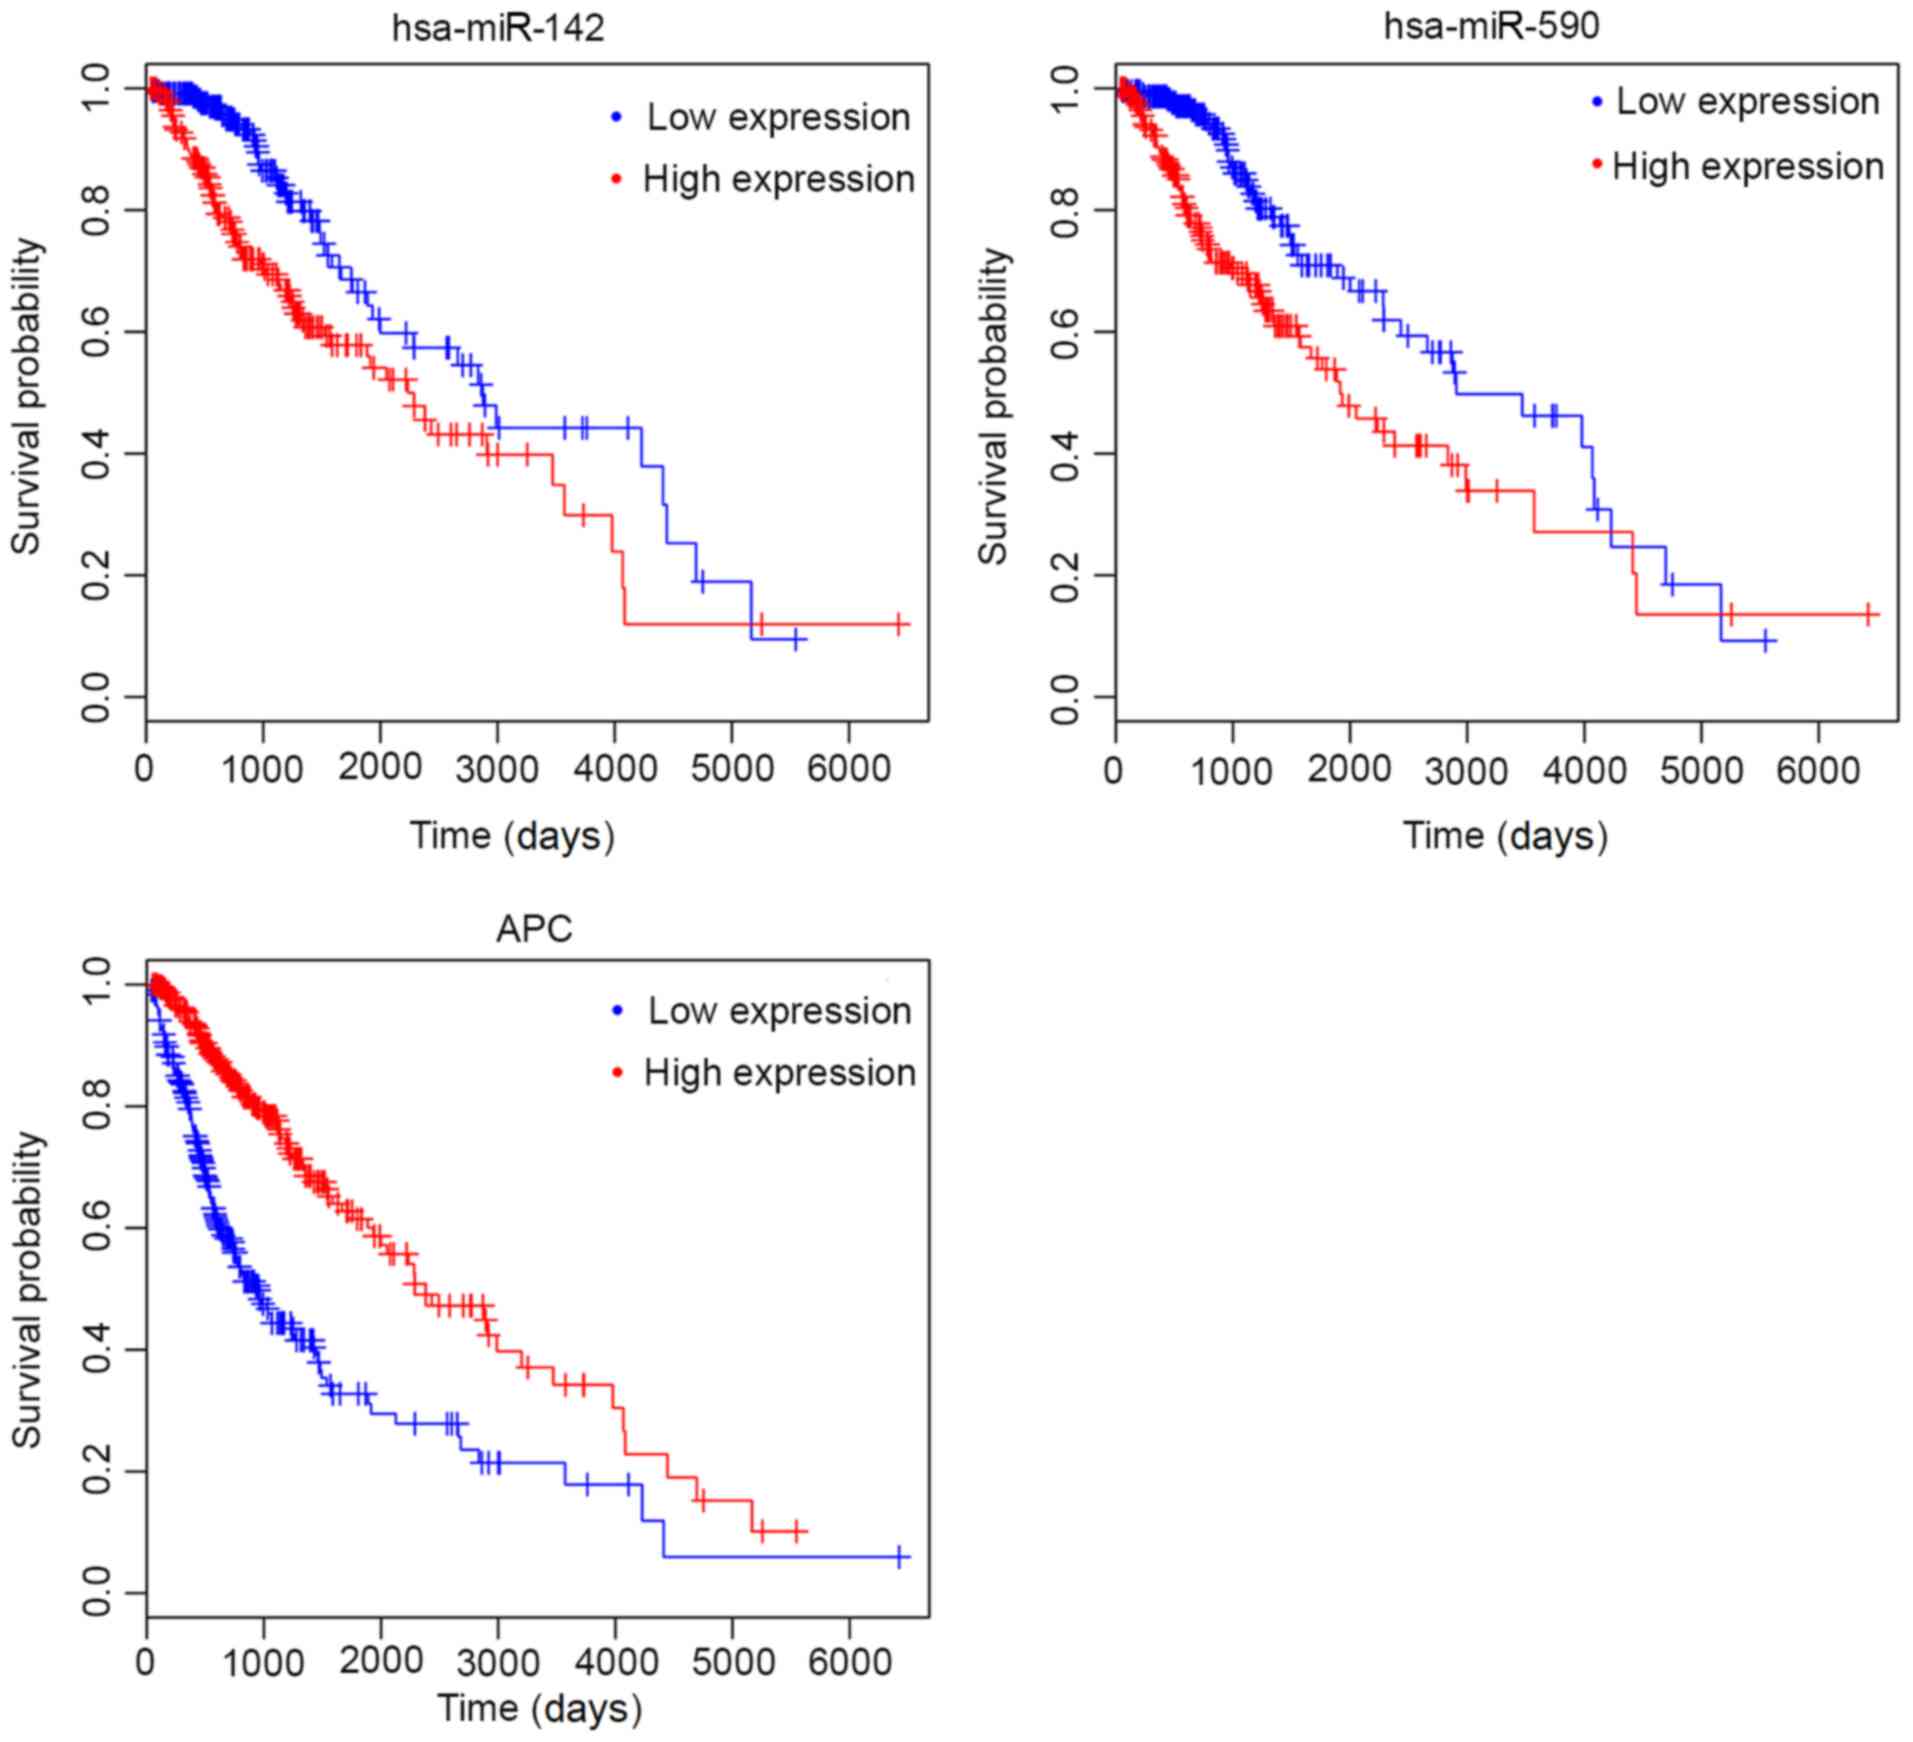
network. However, the prognosis trend between
hsa-miR-217/hsa-miR-324-5p/hsa-miR-590-5p/hsa-miR-599/hsa-miR-875-5p
and their target genes were consistent, with high expression levels
of both miRNAs and their target genes indicating a poor prognosis,
which is not in accordance with the negative regulatory mechanisms
of miRNAs on mRNAs. Thus, only
hsa-miR-139-5p-NOTCH1/RUNX1/CDK6/TNFSF10/VEGFA and
hsa-miR-142-3p-APC-related ceRNA axes may be important.
Furthermore, as all the circRNAs in the ceRNA network were
downregulated, its interactive miRNAs should be upregulated
according to the ceRNA theory (6–8);
however, similarly to circRNAs, high expression levels of
hsa-miR-139-5p were also associated with an excellent overall
survival rate, indicating that hsa-miR-139-5p was also
downregulated in glioma. Thus, hsa-miR-139-5p-related interaction
relationships were excluded from further analyses and only
hsa-miR-142-3p-APC-related ceRNA axes (in which high hsa-miR-142-3p
expression was associated with poor OS, while high APC expression
was associated with a good prognosis, as shown in Fig. 5) were crucial.
| Table VI.Overall survival-related mRNAs and
miRNAs. |
Table VI.
Overall survival-related mRNAs and
miRNAs.
| A, mRNA |
|---|
|
|---|
| RNA | Cox regression
test | P-value | FDR (BH) |
|---|
| SUZ12 |
7.823×10⁻¹ |
4.984×10−05 |
2.991×10⁻⁴ |
| VEGFA |
4.428×10⁻¹ |
1.000×10−50 |
1.000×10−49 |
| NOTCH3 |
5.14×10⁻¹ |
2.21×10⁻¹¹ |
6.64×10⁻¹¹ |
| RUNX3 |
5.539×10⁻¹ |
1.000×10−38 |
1.000×10−37 |
| CTNND2 |
−6.151×10⁻¹ |
1.000×10⁻²⁶ |
1.000×10⁻²⁵ |
| EGFR |
1.815×10⁻¹ |
2.405×10⁻⁶ |
1.443×10⁻⁵ |
| CDK6 |
4.738×10⁻¹ |
1.000×10⁻¹⁷ |
1.000×10⁻¹⁶ |
| PML |
8.536×10⁻¹ |
3.663×10⁻¹² |
2.198×10⁻¹¹ |
| BHLHE40 |
4.879×10⁻¹ |
3.331×10⁻¹⁵ |
1.998×10⁻¹⁴ |
| EGF |
3.093×10⁻¹ |
2.355×10⁻⁹ |
7.065×10⁻⁹ |
| NOTCH1 |
5.332×10⁻¹ |
1.000×10−52 |
1.000×10−52 |
| TNFSF10 |
3.983×10⁻¹ |
2.207×10⁻¹³ |
6.621×10⁻¹³ |
| RUNX1 |
5.332×10⁻¹ |
1.000×10−52 |
1.000×10−52 |
| MDM4 |
3.306×10⁻¹ |
1.131×10⁻⁷ |
6.784×10⁻⁷ |
| MET |
2.378×10⁻¹ |
1.000×10⁻¹⁶ |
1.000×10⁻¹⁶ |
| IL1B |
1.159×10⁻¹ |
1.164×10⁻⁴ |
2.329×10⁻⁴ |
| JAG1 |
6.596×10⁻¹ |
1.000×10⁻³³ |
1.000×10⁻³² |
| APC |
−7.618×10⁻¹ |
1.000×10−36 |
1.000×10⁻³⁵ |
| RECK |
4.158×10⁻¹ |
6.612×10⁻³ |
1.984×10⁻² |
|
| B,
miRNA |
| RNA | Cox regression
test | P-value | FDR
(BH) |
|
| hsa-miR-139-5p |
−1.909×10⁻¹ |
3.418×10⁻³ |
1.025×10⁻² |
| hsa-miR-142-3p |
4.080×10⁻¹ |
6.370×10⁻⁹ |
3.822×10⁻⁸ |
| hsa-miR-217 |
2.006×10⁻¹ |
2.422×10⁻⁶ |
1.453×10⁻⁵ |
| hsa-miR-324-5p |
2.797×10⁻¹ |
6.083×10⁻³ |
3.650×10⁻² |
| hsa-miR-346 |
−6.408×10⁻¹ |
2.317×10⁻⁹ |
1.390×10⁻⁸ |
| hsa-miR-590-5p |
5.611×10⁻¹ |
2.461×10⁻⁷ |
7.384×10⁻⁷ |
| hsa-miR-599 |
4.453×10⁻¹ |
9.471×10⁻⁷ |
2.841×10⁻⁶ |
| hsa-miR-615-3p |
9.771×10⁻¹ |
1.000×10⁻⁸ |
1.000×10⁻⁷ |
| hsa-miR-875-5p |
1.369×10⁻¹ |
5.275×10⁻⁴ |
1.361×10⁻³ |
Accordingly, hsa_circ_0000120/ 0001367/ 0001368/
0001369/ 0001936/ 0004516/ 0005114/
0060425/0064615/0130887-hsa-miR-142-3p-APC ceRNA axes may be
potential targets for the development of glioma. Additionally,
UALCAN analysis using TCGA data of glioblastoma multiforme
demonstrated that APC was significantly downregulated in glioma
compared with in normal tissues (P=0.0000822); while GSE25632
microarray analysis showed the expression of hsa-miR-142-3p was
significantly higher in glioma compared with that in normal tissues
(log2FC=1.21, P=0.00284), further confirming the
creditability of these crucial ceRNA axes for glioma (data not
shown).
In addition, both of GSE25632
(log2FC=5.75, P=0.0226) and GSE103229
(log2FC=1.65, P=0.0208) microarray analyses revealed
that hsa-miR-590-5p was upregulated in glioma compared with that in
normal tissues (data not shown). In fact, the interaction between
hsa-miR-590-5p and APC was also predicted by RNA22 and RNAhybrid
using miRwalk2.0 analysis (data not shown). Therefore, circRNAs
interacting with hsa-miR-590-5p were also important, including
hsa_circ_0005114, 0069718, 0098551, 0100496, 0104726, 0104727 and
0117841 (Fig. 3), among which
hsa_circ_0005114 interacted with hsa-miR-142-3p. Therefore, the
hsa_circ_0005114-miR-142-3p/miR-590-5p-APC ceRNA axis may represent
a potential mechanism for the development of glioma.
Discussion
In the present study, 16 crucial downregulated
circRNAs were identified that may sponge miR-142-3p/miR-590-5p to
suppress glioma progression via regulating the APC gene. Most of
them, to the best of our knowledge, were newly reported circRNAs
associated with cancer, except for hsa_circ_0001368 that has a
tumor-suppression role in gastric cancer by regulating the
miR-6506-5p/forkhead box (FOX) protein O3 axis (31). However, hsa_circ_0005114 may be
particularly important as it was a circRNA interacting with both
miR-142-3p and miR-590-5p.
The present analysis did not identify the roles of
hsa_circ_0005114 in cancer; however, hsa_circ_0005114 is derived
from the regulating synaptic membrane exocytosis (RIMS)2 gene.
Thus, the function of hsa_circ_0005114 may be similar to that of
RIMS2. Notably, Mukasa et al (32) observed that RIMS2 expression is
significantly higher in normal brain tissues compared with
glioblastoma. In addition, it was reported that RIMS2 mediates the
cAMP-guanidine nucleotide exchange factor II pathway to promote
incretin-potentiated insulin secretion (33,34). The
downregulation of RIMS2 may lead to the lower levels of insulin and
the development of diabetes and obesity, as while 11.1% of patients
with glioma (35) and 30% of those
with brain tumor are diagnosed with obesity and insulin
resistance/impaired glucose tolerance (36). Therefore, hsa_circ_0005114 may be
involved in glioma by influencing the insulin secretion pathway,
which was also predicted in the present function enrichment
analysis. However, how hsa_circ_0005114 influences insulin
secretion needs further investigation. A recent study proposed that
high insulin index is positively associated with a high risk of
glioma development (37). However,
another study reported that decreased insulin receptor expression
impairs cellular functions and represses orthotopic glioblastoma
(38). These conflicting reports may
be attributed to the dual roles of insulin (39).
In addition to insulin secretion mechanisms, the
present study predicted that hsa_circ_0005114 may exert tumor
suppressor functions by upregulating miR-142-3p and miR-590-5p,
which subsequently inhibited the expression of APC. Studies have
demonstrated that miR-590-5p is upregulated in liver (40), colorectal (41), gastric (42) and cervical cancer (43). miR-590-5p promotes cancer cell
proliferation, invasion and therapy resistance by targeting FOXO1
(34), TGF-β R2 (44), matrix metalloproteinases (41), reversion-inducing cysteine-rich
protein with Kazal motifs (36) and
cell adhesion molecule L1-like (43). Furthermore, a previous study also
showed that miR-590-3p is upregulated in human glioma tissues
(especially high grade) and radioresistant human glioblastoma cells
(45). The use of anti-miR-590-3p
suppresses cell viability, decreases colony formation capacity,
increases the apoptotic rate and enhances the radiosensitivity. A
luciferase reporter assay demonstrated that leucine-rich repeats
and immunoglobulin-like domains protein 1 is the direct target of
miR-590-3p. Similarly, other studies using quantitative PCR also
detected that miR-142-3p expression is significantly upregulated in
renal cell carcinoma (46) and
nasopharyngeal carcinoma (47)
compared with adjacent tissues. Downregulation of miR-142-3p
significantly suppresses cell proliferation, migration and cell
cycle progression, promotes apoptosis in vitro (46) and blocks tumor growth in a mouse
model via upregulating its targeted genes, including suppressor of
cytokine signaling 6 (47) and
Ras-related C3 botulinum toxin substrate 1 in colorectal cancer
(48). High expression of miR-142-3p
is correlated with histological differentiation and a poor
prognosis for patients with esophageal squamous cell carcinoma
(49). In line with the
aforementioned findings, the present study reported that miR-590-5p
and miR-142-3p were upregulated in glioblastoma tissues compared
with normal controls and were associated with a worse prognosis.
However, the targeted genes of these two miRNAs were not completely
validated in cancer. It was predicted that APC, a regulator of the
WNT signaling pathway (50), may be
a direct target for both miR-590-5p and miR-142-3p. Their negative
regulatory relationship was indirectly investigated by Naseri et
al (51) who showed that
delivery of anti-miR-142-3p by exosomes to breast cancer cells
leads to a significant increase in APC mRNA levels. In addition, Wu
et al (52) used
dual-luciferase and western blot analysis in mesenchymal stem cells
to demonstrate that miR-590-3p binds to the 3′UTR of APC mRNA.
Notably, APC encodes a protein that acts as an antagonist of the
Wnt signaling pathway (53), which
is often activated in cancer (54).
Thus, APC may be downregulated during carcinogenesis, which has
been confirmed in various cancer types, including glioma (55–57). For
example, Cole et al (55)
reported that APC expression is decreased in pancreatic ductal
adenocarcinoma tissues, and that APC siRNA treatment promotes cell
proliferation and migration. Wang et al (56) reported that the expression of APC
mRNA is significantly decreased in ovarian tumor cells and tissues
compared with in normal ovarian cells and tissues. In addition,
overexpression of APC induces increased apoptosis of ovarian tumor
cells by decreasing the ATP binding cassette subfamily B member 1
(also known as multidrug resistance gene 1)/chemokine (C-X-C motif)
ligand 1 signaling pathway. Zhang et al (57) demonstrated that APC expression is
downregulated in colorectal cancer tissues, which is associated
with the expression of miR-494. Overexpression of miR-494 promotes
colorectal cancer cell proliferation by inhibiting APC and
consequently inducing Wnt/β-catenin signaling. Western blot assays
of Li et al (58) also
suggested that miR-106a-5p reduces APC protein levels and
upregulates target proteins of the Wnt/β-catenin pathway, resulting
in the invasion of glioblastoma cells (58). In accordance with these studies, the
present study reported that APC expression was decreased in
glioblastoma tissues compared with normal controls and high
expression of APC was associated with a good prognosis. Functional
enrichment analysis showed APC was involved in Wnt signaling
pathway, cell fate commitment, and cell junction.
Overall, the present study suggested that
hsa_circ_0005114-miR-142-3p/miR-590-5p-APC ceRNA axes may be
mechanisms for the development and progression of glioma. These
axes may also have potential as novel targets for the treatment of
glioma. However, additional in vitro and in vivo
experiments, such as gene interaction experiments involving
knockout/overexpression of
hsa_circ_0005114-miR-142-3p/miR-590-5p-APC and their influence on
tumor cells (using cell proliferation, apoptosis, invasion and
migration assays) and tumor growth, are required to validate these
conclusions in the future, and the lack of these experiments is a
limitation of the present study.
Acknowledgements
Not applicable.
Funding
The present study was funded by grants from The
Natural Science Foundation of China (grant no. 81400404) and The
Science and Technology of Jilin Province (grant no.
20200201470JC).
Availability of data and materials
The GSE86202, GSE92322, GSE103229 and GSE25632
datasets were downloaded from the Gene Expression Omnibus
repository (http://www.ncbi.nlm.nih.gov/geo/). LinkedOmics and
UALCAN database used the miRNA and mRNA sequencing data of The
Cancer Genome Atlas (https://gdc-portal.nci.nih.gov/) for analysis.
Authors' contributions
BW, LW and JWZ conceived and designed the study. BW
collected and analyzed the data. LW and JWZ contributed to the
interpretation of data. BW and LW drafted the manuscript. JWZ
revised the manuscript. All authors read and approved the final
manuscript.
Ethics approval and consent to
participate
Not applicable.
Patient consent for publication
Not applicable.
Competing interests
The authors declare that they have no competing
interests.
References
|
1
|
Ryan CS, Juhn YJ, Kaur H, Wi CI, Ryu E,
King KS and Lachance DH: Long-term incidence of glioma in Olmsted
County, Minnesota, and disparities in postglioma survival rate: A
population-based study. Neurooncol Pract. 7:288–298.
2020.PubMed/NCBI
|
|
2
|
Sehmer EA, Hall GJ, Greenberg DC, O'Hara
C, Wallingford SC, Wright KA and Green AC: Incidence of glioma in a
northwestern region of England, 2006–2010. Neuro Oncol. 16:971–974.
2014. View Article : Google Scholar : PubMed/NCBI
|
|
3
|
Larjavaara S, Mäntylä R, Salminen T,
Haapasalo H, Raitanen J, Jääskeläinen J and Auvinen A: Incidence of
gliomas by anatomic location. Neuro Oncol. 9:319–325. 2007.
View Article : Google Scholar : PubMed/NCBI
|
|
4
|
Rasmussen BK, Hansen S, Laursen RJ,
Kosteljanetz M, Schultz H, Nørgård BM, Guldberg R and Gradel KO:
Epidemiology of glioma: Clinical characteristics, symptoms, and
predictors of glioma patients grade I–IV in the the Danish
Neuro-Oncology Registry. J Neurooncol. 135:571–579. 2017.
View Article : Google Scholar : PubMed/NCBI
|
|
5
|
Piñeros M, Sierra MS, Izarzugaza MI and
Forman D: Descriptive epidemiology of brain and central nervous
system cancers in Central and South America. Cancer Epidemiol. 44
(Suppl 1):S141–S149. 2016. View Article : Google Scholar : PubMed/NCBI
|
|
6
|
Ebbesen KK, Kjems J and Hansen TB:
Circular RNAs: Identification, biogenesis and function. Biochim
Biophys Acta. 1859:163–168. 2016. View Article : Google Scholar : PubMed/NCBI
|
|
7
|
Yu CY and Kuo HC: The emerging roles and
functions of circular RNAs and their generation. J Biomed Sci.
26:292019. View Article : Google Scholar : PubMed/NCBI
|
|
8
|
Belousova EA, Filipenko ML and Kushlinskii
NE: Circular RNA: New regulatory molecules. Bull Exp Biol Med.
164:803–815. 2018. View Article : Google Scholar : PubMed/NCBI
|
|
9
|
Zhou J, Wang H, Chu J, Huang Q, Li G, Yan
Y, Xu T, Chen J and Wang Y: Circular RNA hsa_circ_0008344 regulates
glioblastoma cell proliferation, migration, invasion, and
apoptosis. J Clin Lab Anal. 32:e224542018. View Article : Google Scholar : PubMed/NCBI
|
|
10
|
Wang Y, Sui X, Zhao H, Cong L, Li Y, Xin
T, Guo M and Hao W: Decreased circular RNA hsa_circ_0001649
predicts unfavorable prognosis in glioma and exerts oncogenic
properties in vitro and in vivo. Gene. 676:117–122. 2018.
View Article : Google Scholar : PubMed/NCBI
|
|
11
|
Zhan L, Mu Z, Yang M, Zhang T and Qian L:
Elevation of circ-ITX1 upregulates interleukin 17 receptor D
expression via sponging miR8a and facilitates cell progression in
glioma. J Cell Biochem. 120:16495–16502. 2019. View Article : Google Scholar : PubMed/NCBI
|
|
12
|
Yi C, Li H, Li D, Qin X, Wang J, Liu Y,
Liu Z and Zhang J: Upregulation of circular RNA circ_0034642
indicates unfavorable prognosis in glioma and facilitates cell
proliferation and invasion via the miR-1205/BATF3 axis. J Cell
Biochem. 120:13737–13744. 2019. View Article : Google Scholar : PubMed/NCBI
|
|
13
|
Xiong J, Wang T, Tang H, Lv Z and Liang P:
Circular RNA circMAN2B2 facilitates glioma progression by
regulating the miR-1205/S100A8 axis. J Cell Physiol.
234:22996–23004. 2019. View Article : Google Scholar : PubMed/NCBI
|
|
14
|
Duan X, Liu D, Wang Y and Chen Z: Circular
RNA hsa_circ_0074362 promotes glioma cell proliferation, migration,
and invasion by attenuating the inhibition of miR-1236-3p on HOXB7
expression. DNA Cell Biol. 37:917–924. 2018. View Article : Google Scholar : PubMed/NCBI
|
|
15
|
Li X and Diao H: Circular RNA circ_0001946
acts as a competing endogenous RNA to inhibit glioblastoma
progression by modulating miR-671-5p and CDR1. J Cell Physiol.
234:13807–13819. 2019. View Article : Google Scholar : PubMed/NCBI
|
|
16
|
Yuan Y, Li J, Xiang W, Liu Y and Mao Q:
Analyzing the interactions of mRNAs, miRNAs, lncRNAs and circRNAs
to predict competing endogenous RNA networks in glioblastoma. J
Neurooncol. 137:493–502. 2018. View Article : Google Scholar : PubMed/NCBI
|
|
17
|
Zhu J, Ye J, Zhang L, Xia L, Hu H, Jiang
H, Wan Z, Sheng F, Ma Y, Li W, et al: Differential expression of
circular RNAs in glioblastoma multiforme and its correlation with
prognosis. Transl Oncol. 10:271–279. 2017. View Article : Google Scholar : PubMed/NCBI
|
|
18
|
Glažar P, Papavasileiou P and Rajewsky N:
circBase: A database for circular RNAs. RNA. 20:1666–1670. 2014.
View Article : Google Scholar : PubMed/NCBI
|
|
19
|
Nikolayeva O and Robinson MD: edgeR for
Differential RNA-seq and ChIP-seq analysis: An application to stem
cell biology. Methods Mol Biol. 1150:45–79. 2014. View Article : Google Scholar : PubMed/NCBI
|
|
20
|
R Development Core Team, . R: A language
and environment for statistical computing. 2015, simplehttp://www.r-project.org/February
10–2015
|
|
21
|
Dudekula DB, Panda AC, Grammatikakis I, De
S, Abdelmohsen K and Gorospe M: CircInteractome: A web tool for
exploring circular RNAs and their interacting proteins and
microRNAs. RNA Biol. 13:34–42. 2016. View Article : Google Scholar : PubMed/NCBI
|
|
22
|
Li JH, Liu S, Zhou H, Qu LH and Yang JH:
Starbase v2.0: Decoding miRNA-ceRNA, miRNA-ncRNA and protein-RNA
interaction networks from large-scale clip-seq data. Nucleic Acids
Res. 42((Database issue)): D92–D97. 2014. View Article : Google Scholar : PubMed/NCBI
|
|
23
|
Dweep H and Gretz N: miRWalk2.0: A
comprehensive atlas of microRNA-target interactions. Nat Methods.
12:6972015. View Article : Google Scholar : PubMed/NCBI
|
|
24
|
Davis AP, Grondin CJ, Johnson RJ, Sciaky
D, McMorran R, Wiegers J, Wiegers TC and Mattingly CJ: The
Comparative Toxicogenomics Database: Update 2019. Nucleic Acids
Res. 47:D948–D954. 2019. View Article : Google Scholar : PubMed/NCBI
|
|
25
|
Kohl M, Wiese S and Warscheid B:
Cytoscape: Software for visualization and analysis of biological
networks. Methods Mol Biol. 696:291–303. 2011. View Article : Google Scholar : PubMed/NCBI
|
|
26
|
Yu G, Wang LG, Han Y and He QY:
clusterProfiler: An R package for comparing biological themes among
gene clusters. OMICS. 16:284–287. 2012. View Article : Google Scholar : PubMed/NCBI
|
|
27
|
Ferreira JA: The Benjamini-Hochberg method
in the case of discrete test statistics. Int J Biostat. 3:112007.
View Article : Google Scholar
|
|
28
|
Vasaikar SV, Straub P, Wang J and Zhang B:
LinkedOmics: Analyzing multi-omics data within and across 32 cancer
types. Nucleic Acids Res. 46((Database issue)): D956–D963.
2017.
|
|
29
|
Chandrashekar DS, Bashel B, Balasubramanya
SAH, Creighton CJ, Ponce-Rodriguez I, Chakravarthi BVSK and
Varambally S: UALCAN: A portal for facilitating tumor subgroup gene
expression and survival analyses. Neoplasia. 19:649–658. 2017.
View Article : Google Scholar : PubMed/NCBI
|
|
30
|
Zhang W, Zhang J, Hoadley K, Kushwaha D,
Ramakrishnan V, Li S, Kang C, You Y, Jiang C, Song SW, et al:
miR-181d: A predictive glioblastoma biomarker that downregulates
MGMT expression. Neuro Oncol. 14:712–719. 2012. View Article : Google Scholar : PubMed/NCBI
|
|
31
|
Lu J, Zhang PY, Li P, Xie JW, Wang JB, Lin
JX, Chen QY, Cao LL, Huang CM and Zheng CH: Circular RNA
hsa_circ_0001368 suppresses the progression of gastric cancer by
regulating miR-6506-5p/FOXO3 axis. Biochem Biophys Res Commun.
512:29–33. 2019. View Article : Google Scholar : PubMed/NCBI
|
|
32
|
Mukasa A, Ueki K, Ge X, Ishikawa S, Ide T,
Fujimaki T, Nishikawa R, Asai A, Kirino T and Aburatani H:
Selective expression of a subset of neuronal genes in
oligodendroglioma with chromosome 1p loss. Brain Pathol. 14:34–42.
2010. View Article : Google Scholar
|
|
33
|
Kashima Y, Miki T, Shibasaki T, Ozaki N,
Miyazaki M, Yano H and Seino S: Critical role of cAMP-GEFII-Rim2
complex in incretin-potentiated insulin secretion. J Biol Chem.
276:46046–46053. 2001. View Article : Google Scholar : PubMed/NCBI
|
|
34
|
Fujimoto K, Shibasaki T, Yokoi N, Kashima
Y, Matsumoto M, Sasaki T, Tajima N, Iwanaga T and Seino S: Piccolo,
a Ca2+ sensor in pancreatic beta-cells. Involvement of
cAMP-GEFII.Rim2. Piccolo complex in cAMP-dependent exocytosis. J
Biol Chem. 277:50497–50502. 2002. View Article : Google Scholar : PubMed/NCBI
|
|
35
|
Sani I and Albanese A: Endocrine long-term
follow-up of children with neurofibromatosis type 1 and optic
pathway glioma. Horm Res Paediatr. 87:178–188. 2017. View Article : Google Scholar
|
|
36
|
Masanori A, Takayoshi T, Koji M, Yumi A,
Ken-Ichi S and Hironobu S: Prevalence of obesity, hyperlipemia and
insulin resistance in children with suprasellar brain tumors. Clin
Pediatr Endocrinol. 16:1–9. 2007. View Article : Google Scholar : PubMed/NCBI
|
|
37
|
Anjom-Shoae J, Shayanfar M,
Mohammad-Shirazi M, Sadeghi O, Sharifi G, Siassi F and Esmaillzadeh
A: Dietary insulin index and insulin load in relation to glioma:
Findings from a case-control study. Nutr Neurosci. 29:1–9. 2019.
View Article : Google Scholar
|
|
38
|
Gong Y, Ma Y, Sinyuk M, Loganathan S,
Thompson RC, Sarkaria JN, Chen W, Lathia JD, Mobley BC, Clark SW
and Wang J: Insulin-mediated signaling promotes proliferation and
survival of glioblastoma through Akt activation. Neuro Oncol.
18:48–57. 2016. View Article : Google Scholar : PubMed/NCBI
|
|
39
|
Yang BC, Wang YS, Wang CH, Lin HH, Tang MJ
and Yang TL: Transient apoptosis elicited by insulin in
serum-starved glioma cells involves Fas/Fas-L and Bcl-2. Cell Biol
Int. 23:533–540. 1999. View Article : Google Scholar : PubMed/NCBI
|
|
40
|
Jia G, Tang Y, Deng G, Fang D, Xie J, Yan
L and Chen Z: miR-590-5p promotes liver cancer growth and
chemotherapy resistance through directly targeting FOXO1. Am J
Transl Res. 11:2181–2193. 2019.PubMed/NCBI
|
|
41
|
Kim CW, Oh ET, Kim JM, Park JS, Lee DH,
Lee JS, Kim KK and Park HJ: Hypoxia-induced microRNA-590-5p
promotes colorectal cancer progression by modulating matrix
metalloproteinase activity. Cancer Lett. 416:31–41. 2018.
View Article : Google Scholar : PubMed/NCBI
|
|
42
|
Shen B, Yu S, Zhang Y, Yuan Y, Li X, Zhong
J and Feng J: miR-590-5p regulates gastric cancer cell growth and
chemosensitivity through RECK and the AKT/ERK pathway. Onco Targets
Ther. 9:6009–6019. 2016. View Article : Google Scholar : PubMed/NCBI
|
|
43
|
Chu Y, Ouyang Y, Wang F, Zheng A, Bai L,
Han L, Chen Y and Wang H: MicroRNA-590 promotes cervical cancer
cell growth and invasion by targeting CHL1. J Cell Biochem.
115:847–853. 2014. View Article : Google Scholar : PubMed/NCBI
|
|
44
|
Jiang X, Xiang G, Wang Y, Zhang L, Yang X,
Cao L, Peng H, Xue P and Chen D: MicroRNA-590-5p regulates
proliferation and invasion in human hepatocellular carcinoma cells
by targeting TGF-β RII. Mol Cells. 33:545–551. 2012. View Article : Google Scholar : PubMed/NCBI
|
|
45
|
Chen L, Wang W, Zhu S, Jin X, Wang J, Zhu
J and Zhou Y: MicroRNA-590-3p enhances the radioresistance in
glioblastoma cells by targeting LRIG1. Exp Ther Med. 14:1818–1824.
2017. View Article : Google Scholar : PubMed/NCBI
|
|
46
|
Li Y, Chen D, Jin L, Liu J, Li Y, Su Z, Qi
Z, Shi M, Jiang Z, Yang S, et al: Oncogenic microRNA-142-3p is
associated with cellular migration, proliferation and apoptosis in
renal cell carcinoma. Oncol Lett. 11:1235–12341. 2016. View Article : Google Scholar : PubMed/NCBI
|
|
47
|
Qi X, Li J, Zhou C, Lv C and Tian M:
miR-142-3p suppresses SOCS6 expression and promotes cell
proliferation in nasopharyngeal carcinoma. Cell Physiol Biochem.
36:1743–1752. 2015. View Article : Google Scholar : PubMed/NCBI
|
|
48
|
Gao X, Xu W, Lu T, Zhou J, Ge X and Hua D:
MicroRNA-142-3p promotes cellular invasion of colorectal cancer
cells by activation of RAC1. Technol Cancer Res Treat.
17:15330338187905082018. View Article : Google Scholar : PubMed/NCBI
|
|
49
|
Lin RJ, Xiao DW, Liao LD, Chen T, Xie ZF,
Huang WZ, Wang WS, Jiang TF, Wu BL, Li EM and Xu LY: miR-142-3p as
a potential prognostic biomarker for esophageal squamous cell
carcinoma. J Surg Oncol. 105:175–182. 2012. View Article : Google Scholar : PubMed/NCBI
|
|
50
|
Hankey W, Frankel WL and Groden J:
Functions of the APC tumor suppressor protein dependent and
independent of canonical WNT signaling: Implications for
therapeutic targeting. Cancer Metastasis Rev. 37:159–172. 2018.
View Article : Google Scholar : PubMed/NCBI
|
|
51
|
Naseri Z, Oskuee RK, Jaafari MR and
Forouzandeh Moghadam M: Exosome-mediated delivery of functionally
active miRNA-142-3p inhibitor reduces tumorigenicity of breast
cancer in vitro and in vivo. Int J Nanomedicine. 13:7727–7747.
2018. View Article : Google Scholar : PubMed/NCBI
|
|
52
|
Wu S, Liu W and Zhou L: miR-590-3p
regulates osteogenic differentiation of human mesenchymal stem
cells by regulating APC gene. Biochem Biophys Res Commun.
478:1582–1587. 2016. View Article : Google Scholar : PubMed/NCBI
|
|
53
|
Saito-Diaz K, Benchabane H, Tiwari A, Tian
A, Li B, Thompson JJ, Hyde AS, Sawyer LM, Jodoin JN, Santos E, et
al: APC inhibits ligand-independent Wnt signaling by the clathrin
endocytic pathway. Dev Cell. 44:566–581.e8. 2018. View Article : Google Scholar : PubMed/NCBI
|
|
54
|
Ghosh N, Hossain U, Mandal A and Sil PC:
The Wnt signaling pathway: A potential therapeutic target against
cancer. Ann N Y Acad Sci. 1443:54–74. 2019. View Article : Google Scholar : PubMed/NCBI
|
|
55
|
Cole JM, Simmons K and Prosperi JR: Effect
of adenomatous polyposis coli loss on tumorigenic potential in
pancreatic ductal adenocarcinoma. Cells. 8:10842019. View Article : Google Scholar
|
|
56
|
Wang Y, Cao C, Fang D and Hu Y: Role of
APC-mediated MDR-1/CLCX-1 signaling pathway in ovarian tumors. J
Biol Regul Homeost Agents. 32:529–536. 2018.PubMed/NCBI
|
|
57
|
Zhang Y, Guo L, Li Y, Feng GH, Teng F, Li
W and Zhou Q: MicroRNA-494 promotes cancer progression and targets
adenomatous polyposis coli in colorectal cancer. Mol Cancer.
17:12018. View Article : Google Scholar : PubMed/NCBI
|
|
58
|
Li D, Wang Z, Chen Z, Lin L, Wang Y,
Sailike D, Luo K, Du G, Xiang X and Jiafu GD: MicroRNA-106a-5p
facilitates human glioblastoma cell proliferation and invasion by
targeting adenomatosis polyposis coli protein. Biochem Biophys Res
Commun. 481:245–250. 2016. View Article : Google Scholar : PubMed/NCBI
|