Introduction
The energy metabolism of cancer cells and breast
cancer cells in particular is different than that of most
non-proliferating epithelial cells (1,2). This
altered energy metabolism, variously termed the Warburg effect or
aerobic glycolysis, is characterized by breast cancer cells
importing vast amounts of glucose from the blood, metabolizing it
through the glycolysis pathway and releasing most of the produced
pyruvate as lactate. While this type of metabolism is found in
certain anaerobic organisms and temporarily under hypoxic
conditions in mammalian cells, it is a permanent feature for almost
all cancer cells, even in the presence of sufficient oxygen levels,
hence ‘aerobic’ glycolysis. The discovery of this peculiar effect
has been made almost a century ago (3), however its potential for therapeutic
exploitation has only recently started to be elucidated. In 1995,
Nebeling and colleagues (4) placed
two pediatric patients with advanced astrocytoma on a low
carbohydrate diet, with the idea to reduce the availability of
glucose to the cancer cells. Both patients went into remission and
remained progression-free while on the diet. While a small case
study, it indicated that glucose deprivation through dietary
adaptation (ketogenic diets or low-carbohydrate diets) could be
detrimental to tumor and be useful for cancer patient treatment.
Ketogenic diets are characterized by replacing the almost all
calories from carbohydrate with lipids and protein, with calories
from carbohydrates as low as 5% of total calories (5). These diets are used clinically to treat
refractory epilepsy, obesity, and type-2 diabetes (6–8). This
leads to hepatic activation of ketone body production as
alternative fuel primarily for the central nervous system, ketone
bodies however can be used by all cell types as metabolic fuel
(9). Since the 1995 case study
report ketogenic diets have been trialed for their effect against
tumors in both mouse and human studies with varying results
(10–13). In vitro studies have mainly
focused on the role of ketone bodies, specifically
β-hydroxybutyrate (BHB) as a treatment of cancer cells under
regular glucose conditions (14,15).
They show similar discrepancies as clinical studies in that some
show no effect on breast cancer cell behavior (15,16),
while others do demonstrate reduced survival or metabolic changes
in cancer cells (17,18). However, if breast cancer cells
artificially express enzymes for ketone body metabolism, they are
able to survive and even thrive in low glucose conditions (19). Similar effects were observed in
glioblastoma patients that failed to respond to ketogenic diet
interventions. Their tumors had developed the ability to metabolize
ketone bodies (20). Even if ketone
bodies are not metabolized for energy, recent research demonstrates
that BHB may also act as a signaling molecule that could
potentially have other effects on breast cancer cells besides being
an inert metabolic substrate (21).
Since ketogenic diets are increasingly used in clinical practice
for adjuvant cancer treatment, there is a need to better understand
how cancer cells react when confronted with ketogenic
environments.
Here we present the results of exposing luminal-A
type breast cancer cells MCF-7 and T47D (22) to ketogenic environments. As such we
reduced glucose exposure to these cells to 5% of their usual amount
and supplemented with up to 25 mM BHB. We examined the breast
cancer cell's rate of proliferation and analyzed gene expression
changes under these conditions.
Materials and methods
Cell culture
Human breast cancer cell lines MCF-7 (cat. no.
HTB-22) and T47D (cat no. HTB-133) were purchased from the American
Tissue Culture Collection (ATCC) and routinely maintained in DMEM
(Gibco; Thermo Fisher Scientific, Inc.) with 10% FBS (Atlanta
Biologicals; R&D Systems), 2 mM glutamine (Gibco; Thermo Fisher
Scientific, Inc.) and 50 ng/ml gentamycin (Lonza Biologicals).
Human breast epithelial cells MCF-10A (cat. no. CRL-10317) cells
were purchased from ATCC and routinely maintained in DMEM/F-12
Medium (Gibco; Thermo Fisher Scientific, Inc.) supplemented with 5%
Horse Serum (Sigma-Aldrich; Merck KGaA), 10 µg/ml human insulin
(Sigma-Aldrich; Merck KGaA), 0.5 µg/ml hydrocortisone
(Sigma-Aldrich; Merck KGaA) 20 µg/ml human epidermal growth factor
(Invitrogen; Thermo Fisher Scientific, Inc.), 100 ng/ml cholera
toxin (Sigma-Aldrich; Merck KGaA), 50 ng/ml gentamycin (Lonza).
Sodium β-hydroxybutyrate was purchased from Sigma-Aldrich; Merck
KGaA. Cell lines were incubated at 37°C humidified 5%
CO2-supplemented air. Cell lines were routinely
maintained in 75 cm2 tissue culture flasks with filtered
lids (Thermo Fisher Scientific, Inc.) and sub-cultured when
reaching approximately 80% confluence. Cell cultures were inspected
daily for visible contamination and consistent growth rates. After
purchase from ATCC, cell lines were maintained exclusively within
the research group and handled by qualified researchers. The cell
culture facility is only accessible to qualified researchers and
does not maintain HeLa cells. Cell stock were stored in a locked
designated cryo-vessel and inventory records were maintained
including clear labeling of cryo-tubes and flasks with full cell
line name, date, passage number and initials of the researcher.
Trypsin (0.25%) (Gibco; Thermo Fisher Scientific, Inc.) was
maintained in 10 ml aliquots at −20°C in sterile 15 ml falcon tubes
(Thermo Fisher Scientific, Inc.). Fetal bovine serum (R&D
Systems) was maintained in 50 ml aliquots at −20°C in sterile 50 ml
falcon tubes (Thermo Fisher Scientific, Inc.). Cells were routinely
maintained in mycoplasma suppressing antibiotic gentamycin and
prepared medium was used for a maximum of three weeks. Experiments
on cell lines were performed within 25 passages of receipt from
ATCC.
Cell proliferation
In 96-well dishes, 5×10³ cells were
plated in 100 µl of regular DMEM and incubated overnight. After
removing all medium, cells were treated with decreasing glucose
concentrations [4.5, 2.25, 1.5, 1., 0.75, 0.5, 0.225, 0.125, 0 (all
in g/l)] alone, or in combination with 10 or 25 mM BHB for either
48 or 72 h. Four hours prior to analysis, cells were supplemented
with 1 mg/ml MTT (Thermo Fisher Scientific, Inc.) solution. After
finalizing the indicated treatment periods, all media was removed
from the wells and 200 µl DMSO (Sigma-Aldrich; Merck KGaA) was
added to each well. After incubating the plates at room temperature
for 15 min with gentle shaking, absorbance of each well was read at
540 nm using a BioRad Mark plate reader. For MCF-7 and MCF-10A at
least three experiments with six replicates for each treatment were
performed, while a single experiment with six replicates for each
treatment was performed for T47D cells.
In 10 cm dishes, 105 MCF-10A breast
epithelial cells or MCF-7 breast cancer cells were plated and
treated for 18 days with regular DMEM and either 225 mg/l glucose
or 225 mg/l glucose with 10 or 25 mM β-hydroxybutyrate (BHB).
Medium and treatment conditions were renewed every four days. Cells
were counted every day using Trypan Blue exclusion counts. Cells
were observed with a Nikon Microscope and brightfield pictures were
captured at ×40 magnification daily. Experiments were performed in
duplicates for a total of three experiments.
RNA sequencing
In 10 cm dishes, 1×10⁶ MCF-7 or T47D
breast cancer cells were incubated in regular DMEM medium or
treated with 225 mg/l (5% of glucose in regular DMEM medium) alone
or in combination with 10 mM BHB or 25 mM BHB for four days for a
total of two experiments. Then total RNA was extracted using
Qiagen's RNeasy Mini Kit (Qiagen) and submitted for RNA sequencing
using Psomagen's mRNA sequencing service, which included library
development and delivered in excess of 6×10⁶ 150 bp
pair-ended reads per sample (Psomagen Inc.). We performed two
independent experiments for each cell line and treatment
condition.
RNA sequence analysis
After obtaining sequences, abundances were
quantified from raw fastq files and mapped against human Ensembl
v96 transcriptomes pre-indexed files using Lior Pachter's kallisto
(23). Abundance files were analyzed
using Bioconductor's DESeq2 (version 1.28.1) package for R
(24). Data quality control was
established using Bioconductor's principal component analysis (PCA)
to detect variance within samples. PCA results are displayed as
two-dimensional graphs showing contribution of the highest
component variance in each sample comparison. Results were reduced
for expression changes of over 1.5-fold and analyzed for false
discoveries as previously described (25). P-adjusted values of <0.05 were
considered to be statistically significant. We used Bioconductor
version 3.11 (26,27) and R version 4.0 (28) on RStudio version 1.3.959.
Gene ontology and over representation
analysis
Gene ontology analysis was performed using the
WikiPathway package (29) for R and
further processed for pathway enrichment (30) in Cytoscape version 3.8.0 (31), using a hypergeometric test with a
Benjamini-Hochberg false discovery rate correction (32). A P-value of less than 0.05 was used
to identify enriched pathways. Selected pathways that had been
identified were visualized using WikiPathway (33) or using clusterProfiler for pathway
visualization (34).
Comparison of catabolic ketone
metabolism enzymes in The Cancer Genome Atlas
We queried The Cancer Genome Atlas (TCGA) PanCancer
Atlas studies at cBioPortal (cBioPortal.org) (35,36) for
expression of BDH1, OXCT1, and ACAT1 genes encoding enzymes for
catabolic metabolism of ketone bodies. This returned 32 studies
with 10,953 patient samples. Additionally, we selected the Breast
Invasive Carcinoma (TCGA, PanCancer Atlas) database and plotted
mRNA expression levels (high: Above 1.5-fold; low: Below −1.5-fold
expression based on mRNA expression z-scores relative to all
samples, with a z-score threshold of ±2.0) of BDH1, OXCT1 and ACAT1
against overall survival.
Statistical analysis
Cell proliferation data from MTT assays are
presented as bars representing interquartile range including the
observed median (horizontal line). Whiskers represent highest and
lowest observed values. Outliers detected by Tukey's method are
shown in each graph if present.
Cell proliferation data were analyzed by two-way
ANOVA, followed by Holm-Sidak post-hoc corrections to test for
statistical differences of survival of each condition (control; 25
mM BHB) at any glucose concentration compared to regular glucose
concentration of 4.5 g/l. Cell proliferation data were also
analyzed using multiple t-tests with Holm-Sidak corrections for
multiple analyses to test for statistical differences between
non-BHB and BHB treated samples at every glucose concentration.
Cell proliferation data in Fig. S1
are presented as the mean of two independent experiment with six
replicates. Error bars represent standard deviation. Cell
proliferation data in Fig. S1 were
analyzed for statistical differences between each BHB concentration
and control using Dunnett's corrections following two-way ANOVA for
T47D cells and MCF-7 cells and Tukey correction following one-way
ANOVA for MCF-10A cells. Cell count data (Fig. 1G) are presented by means of three
experiments with two replicates per experiments. Error bars were
omitted for clarity. Cell count data were analyzed by multiple
t-tests using the Holm-Sidak method to determine statistical
significance for count differences between all three experimental
conditions on each day (control; no glucose no BHB; no glucose 25
mM BHB). A P-value of <0.05 was considered statistically
significant. Statistical analysis was performed using GraphPad
Prism software v.8.4.3 (GraphPad Software, Inc.). Statistical
analysis of the RNA sequencing workflow was integrated into the
DESeq2 analysis as previously described (24). Kaplan-Meier curves were drawn to
compare overall survival in patients with breast cancer where
tumors express high or low mRNA levels of BDH1, OXCT1 or ACAT1. A
log rank test was used for detection of statistical differences of
patient survival data was performed using cBioPortal built-in
analysis. A P-value of <0.05 was considered statistically
significant.
Results
Ketone bodies are tolerated by breast
cancer cells
We performed kill curves of BHB on all cell lines of
up to 200 mM using MTT assays (Fig.
S1). No significant impact on cell proliferation was observed
for BHB concentrations of up 25 mM, which was chosen as the highest
BHB treatment concentration, while 10 mM BHB corresponds to a high
physiological level of BHB in medically therapeutic uses of
ketogenic diets (37).
Ketone bodies do not rescue breast
cancer cells during glucose deprivation
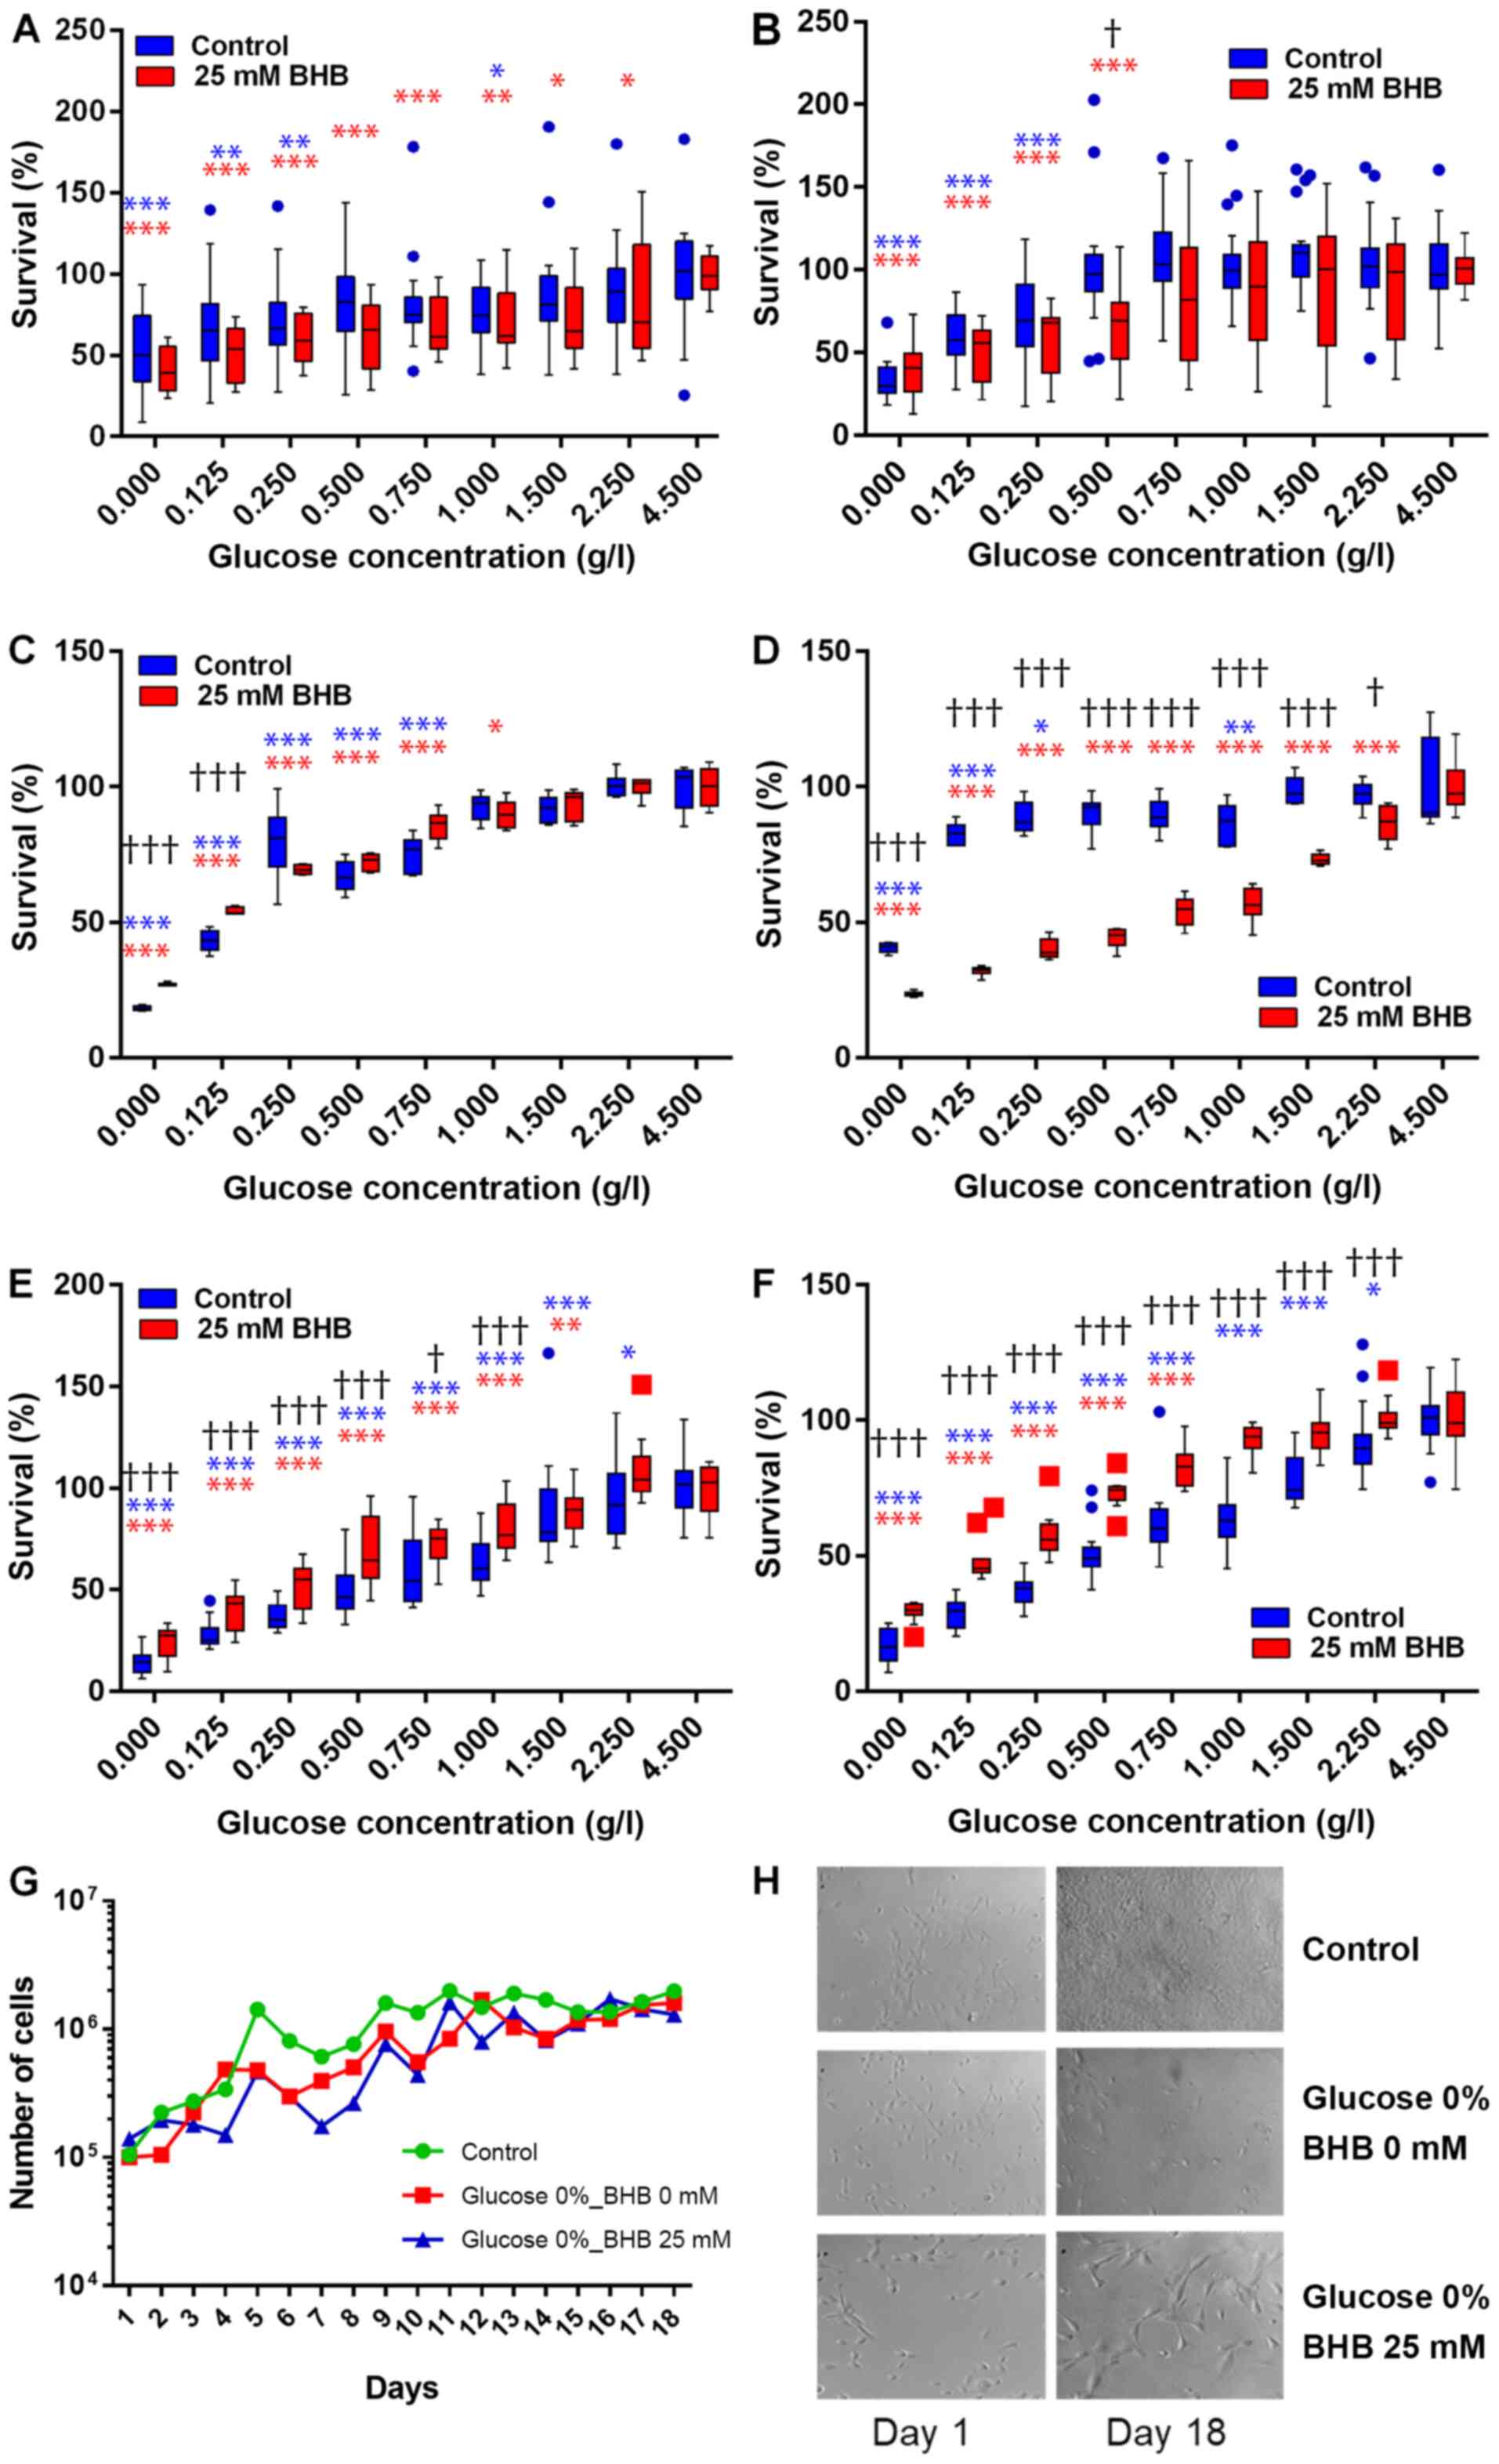
MCF-7 and T47D breast cancer cells and MCF-10A
breast epithelial cells were incubated in decreasing glucose
concentrations with 25 mM BHB for 48 h or 72 h (Fig. 1A-F). Cell proliferation decreased in
both cell lines with decreasing glucose concentrations. For MCF-7
cells, cell proliferation significantly decreased after reducing
glucose concentrations to 1 g/l and below glucose concentrations of
250 mg/l when compared to proliferation at 4.5 g/l glucose after 48
h. When supplementing with 25 mM BHB cell proliferation decreased
significantly after treatment with 2.25 g/l glucose and below
compared to proliferation at 4.5 g/l glucose and 25 mM BHB after 48
h. There was no significant difference in cell proliferation
between not BHB- and BHB-supplemented MCF-7 cells at any of the
different glucose treatment concentrations (Fig. 1A). Cell proliferation significantly
decreased after treatment of MCF-7 cells with reduced glucose of
250 mg/l and below compared to proliferation at 4.5 g/l glucose
after 72 h. When supplementing with 25 mM BHB cell proliferation
decreased significantly after treatment with 500 mg/l glucose and
below compared to proliferation at 4.5 g/l glucose and 25 mM BHB
after 72 h. We observed a significant difference in proliferation
between not-BHB- and BHB-supplemented MCF-7 cells after treatment
with 1 g/l glucose (Fig. 1B).
For T47D cells, cell proliferation significantly
decreased after reducing glucose concentrations below 750 mg/l when
compared to proliferation at 4.5 g/l glucose after 48 h. When
supplementing with 25 mM BHB cell proliferation decreased
significantly after treatment with 1 g/l glucose and below compared
to proliferation at 4.5 g/l glucose and 25 mM BHB after 48 h. There
was a significantly higher levels of cell proliferation in
BHB-supplemented T47D cells compared to not-BHB-supplemented cells
at very low glucose concentration (0 g/l and 125 mg/l) (Fig. 1C), indicating that BHB may be
metabolized by these cells when there is no glucose present. Cell
proliferation significantly decreased after treatment of T47D cells
with reduced glucose concentrations of 1 g/l and below glucose
concentrations of 250 mg/l when compared to proliferation at 4.5
g/l glucose after 72 h. When supplementing with 25 mM BHB cell
proliferation decreased significantly after treatment with 2.25 g/l
glucose and below compared to proliferation at 4.5 g/l glucose and
25 mM BHB after 72 h. Conversely to 48 h treatments, there was
significantly lower proliferation in BHB-supplemented cells
compared to not-BHB supplemented cells at all glucose treatment
conditions of 2.25 g/l and below (Fig.
1D).
We were interested if extending the incubation time
beyond 72 h would demonstrate adaptation of the breast cancer cells
to the ketogenic environment as a reflection of the transition
period observed during ketogenic diets in patients. When using cell
counts, we did not find any significant difference between
treatment conditions and control (Fig.
1G).
For MCF-10A cells, cell proliferation significantly
decreased after reducing glucose concentrations below 2.25 g/l when
compared to proliferation at 4.5 g/l glucose after 48 h. When
supplementing with 25 mM BHB cell proliferation decreased
significantly after treatment with 1.5 g/l glucose and below
compared to proliferation at 4.5 g/l glucose and 25 mM BHB after 48
h. There was a significantly higher levels of cell proliferation in
BHB-supplemented MCF-10A cells compared to not-BHB-supplemented
cells at glucose concentration of 1 g/l and below (Fig. 1E). Cell proliferation significantly
decreased after treatment of MCF-10A cells with reduced glucose
concentrations of 2.25 g/l and below when compared to proliferation
at 4.5 g/l glucose after 72 h. When supplementing with 25 mM BHB
cell proliferation was significantly decreased after treatment with
750 mg/l glucose and below compared to proliferation at 4.5 g/l
glucose and 25 mM BHB after 72 h. Complementary to 48 h treatments,
there was significantly higher proliferation in BHB-supplemented
cells compared to not-BHB supplemented cells at all glucose
treatment conditions of 2.25 g/l and below (Fig. 1F).
When treatment times of MCF-10A breast epithelial
cells was extended to 18 days we observed that glucose deprivation
decreased proliferation, but the BHB supplementation increased
proliferation and cell size (Fig.
1H). This indicates that non-cancerous epithelial cells can
metabolize ketone bodies such as BHB and would be able to survive
under ketogenic conditions.
Differential gene expression in low
glucose environments
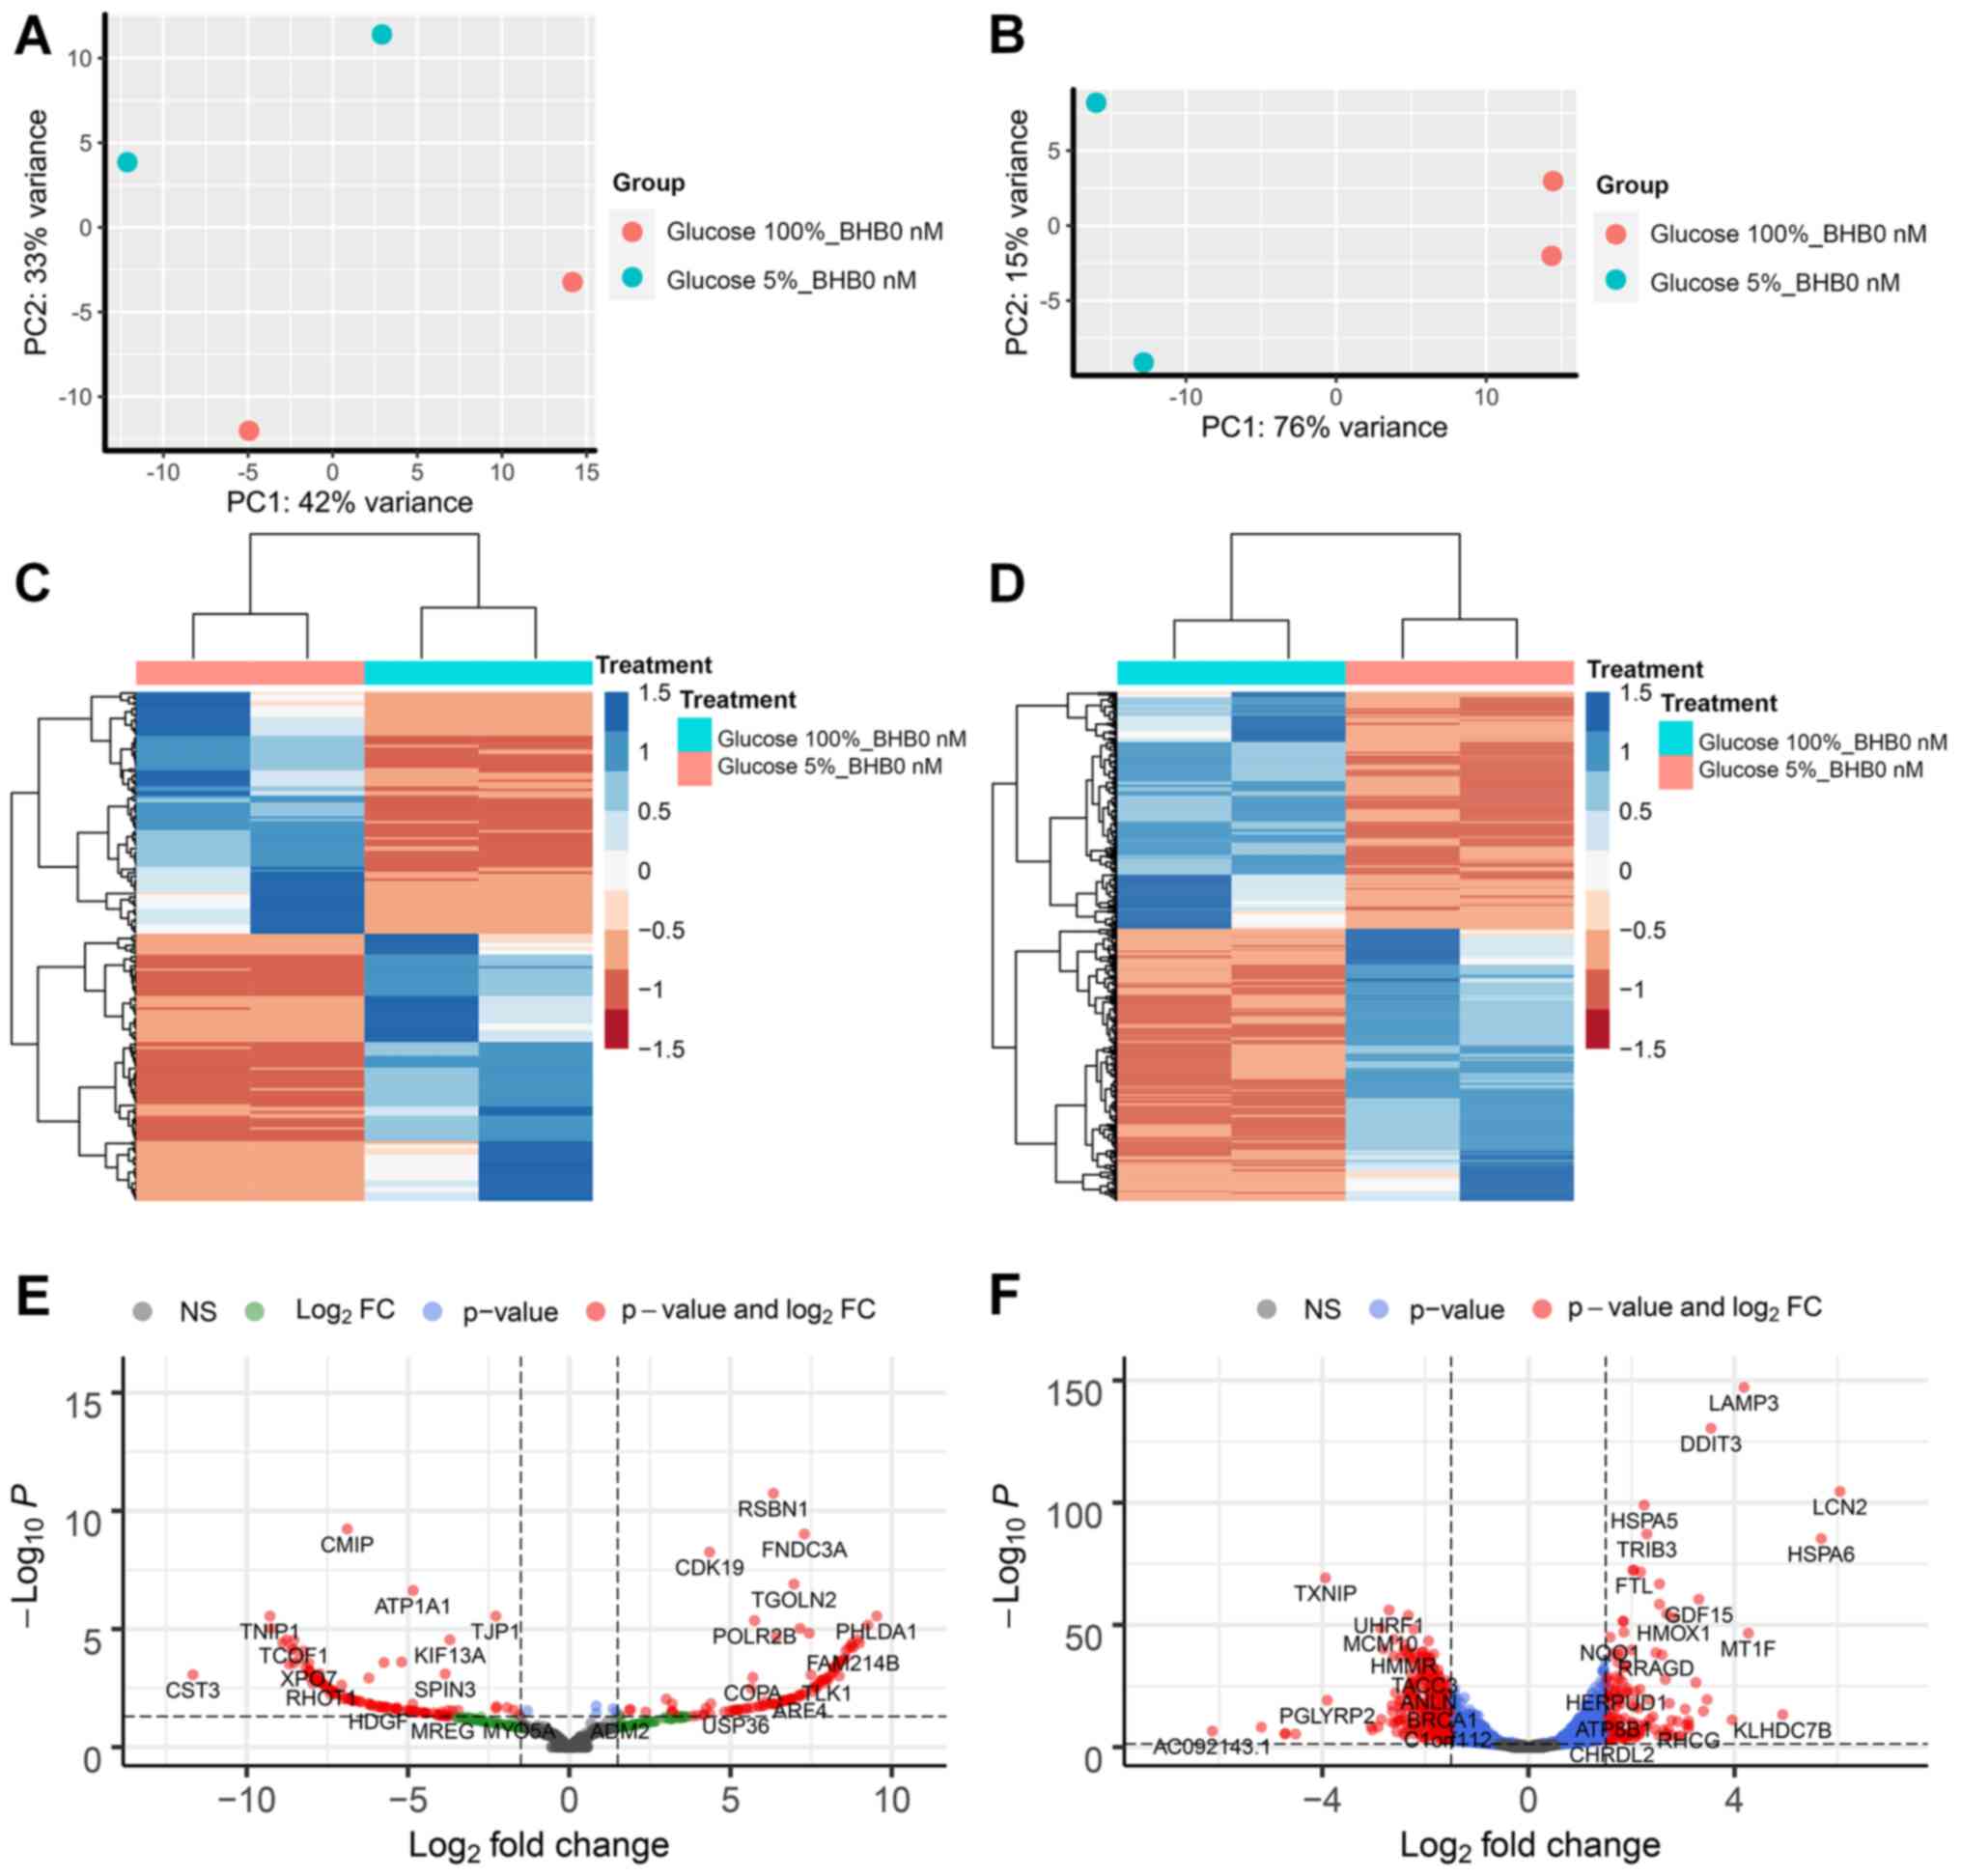
We performed RNA sequencing analysis on MCF-7 and
T47D breast cancer cells and compared treatments in three pairs per
cell line. The first comparison examined the effect of low glucose
conditions on gene expression changes in breast cancer cells
without BHB supplementation compared to cells grown in normal (4.5
g/l) glucose concentrations. We observed that for MCF-7 breast
cancer cells 221 genes had at least 1.5-fold difference in
expression and less than 0.05 p-adjusted value and 1182 genes for
T47D breast cancer cells (Fig. 2E and
F). Both comparisons showed distinction between the treatment
methods based on PCA (Fig. 2A and
B). Comparison between the two cell lines demonstrated that
there are almost five times as many genes that show differential
expression in T47D breast cancer cells compared to MCF-7 breast
cancer cells, while the ratio of up- and down-regulated gene
expression is similar in both cell lines (MCF-7 100 genes up, 113
gene down; T47D 447 gene up and 425 down). Unsupervised cluster
analysis demonstrated gene expression changes in MCF-7 and T47D
breast cancer cells (Fig. 2C and D).
Volcano plots between differences in expression levels and
significant show high levels of expression changes with relatively
low levels of significance in MCF-7 cells (Fig. 2E), while T47D cells demonstrate
higher levels of significance on the expression of several genes
(Fig. 2F).
Differential gene expression in low
glucose environments with BHB treatment
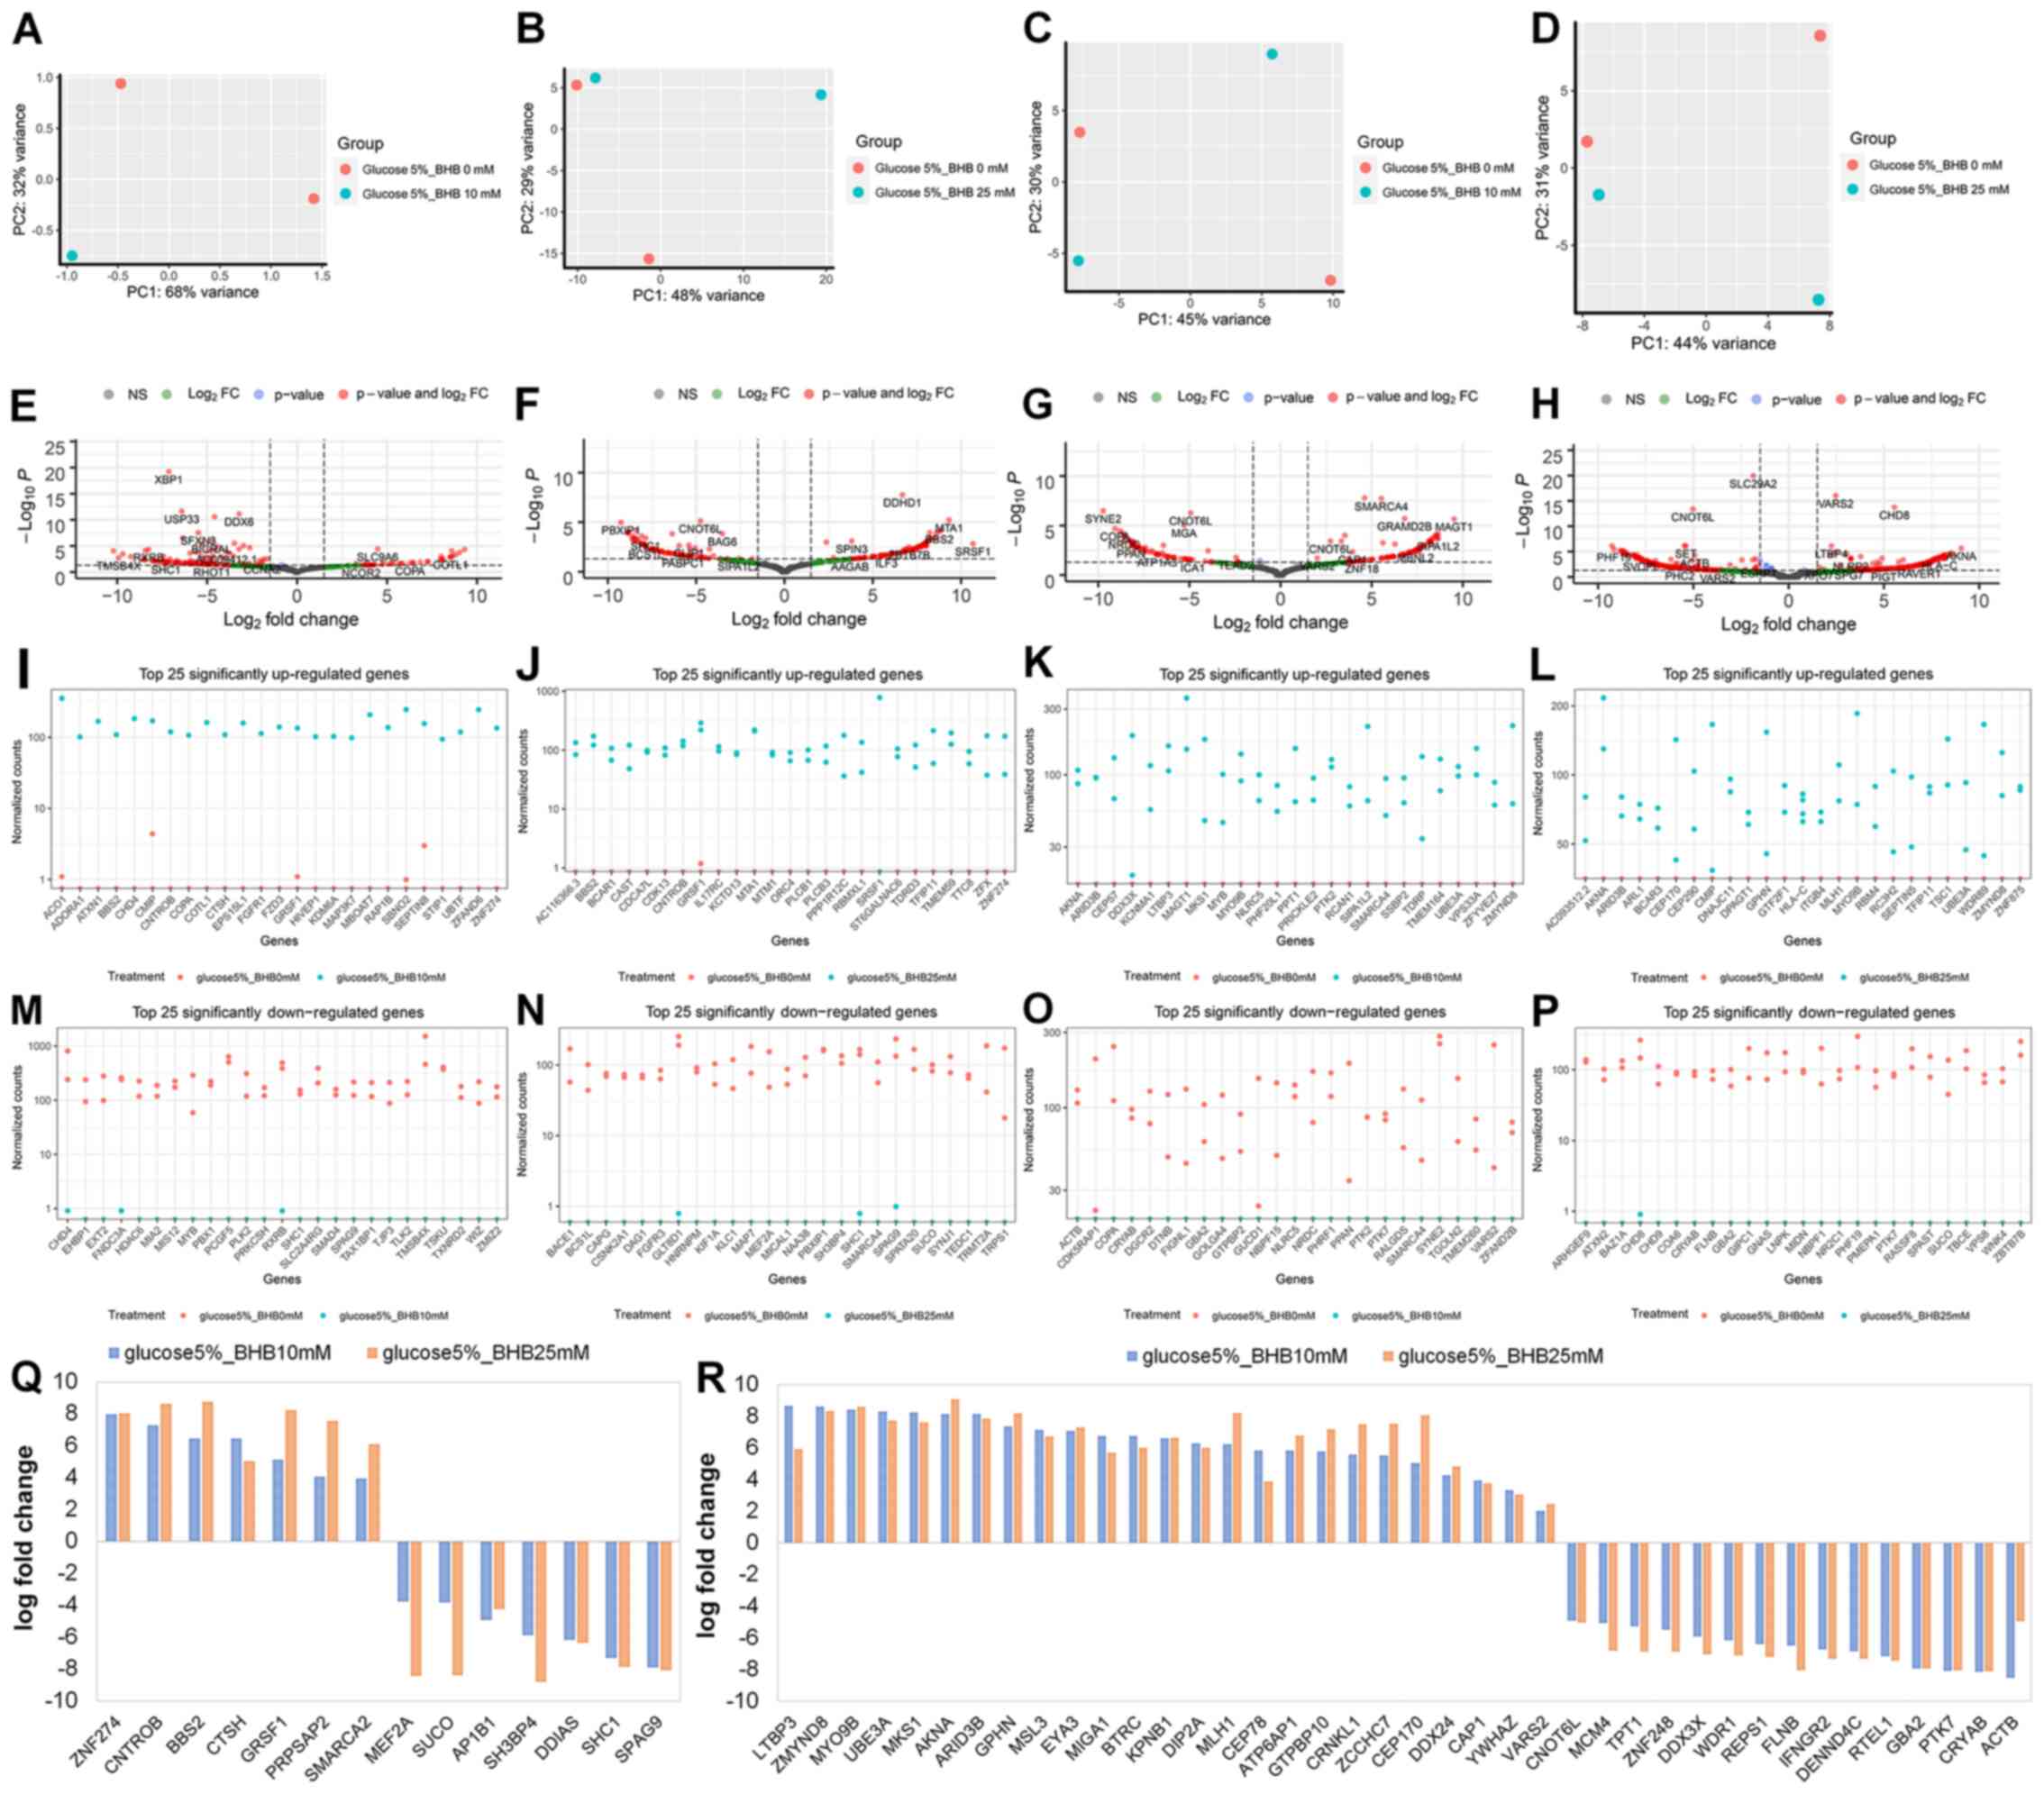
Next, we examined the effect of BHB supplementation
on gene expression in MCF-7 and T47D breast cancer cells. The
comparisons in this analysis were comparing either 225 mg/l
glucose-treated cells with 225 mg/ml glucose and 10 mM BHB-treated
cells, or 225 mg/l glucose-treated cells with 225 mg/ml glucose and
25 mM BHB-treated cells for both MCF-7 and T47D cells. One of the
samples for MCF-7 breast cancer cells treated with 5% glucose and
10 mM BHB failed during library creation, thus this treatment has
only a single replicate (Fig. 3A).
For MCF-7 cells we observed 163 differentially expressed genes
after treatment with 10 mM BHB (Fig.
3E) and 177 differentially expressed genes after treatment with
25 mM BHB (Fig. 3F). Since we did
not observe any ontological clustering for MCF-7 glucose deprived
breast cancer cells treated with 25 mM BHB (Fig. 4), the 25 most upregulated (Fig. 3I and J) and downregulated (Fig. 3M and N) genes are displayed. In total
we observed 14 differentially expressed genes with BHB treatment in
both 10 and 25 mM BHB treated groups (Fig. 3Q). Metabolically interesting is the
increased expression of PRPSAP2, which codes for a protein
associated with ribosyl-phosphate production (38).
For T47D cells we observed 156 differentially
expressed genes after treatment of glucose deprived cells with 10
mM BHB (Fig. 3G) and 394
differentially expressed genes after treatment with 25 mM BHB
(Fig. 3H). Despite the number of
changes in genes expression, similar to MCF-7 cells, there were no
clusters identified in glucose deprived T47D cells following
treatment with wither 10 or 25 mM BHB. The 25 most upregulated
(Fig. 3K and L) and downregulated
(Fig. 3O and P) are displayed. In
total we found 40 differentially expressed genes with BHB treatment
in both 10 and 25 mM BHB treated groups (Fig. 3R).
Glucose deprivation increases
expression of HIPPO pathway inhibitors
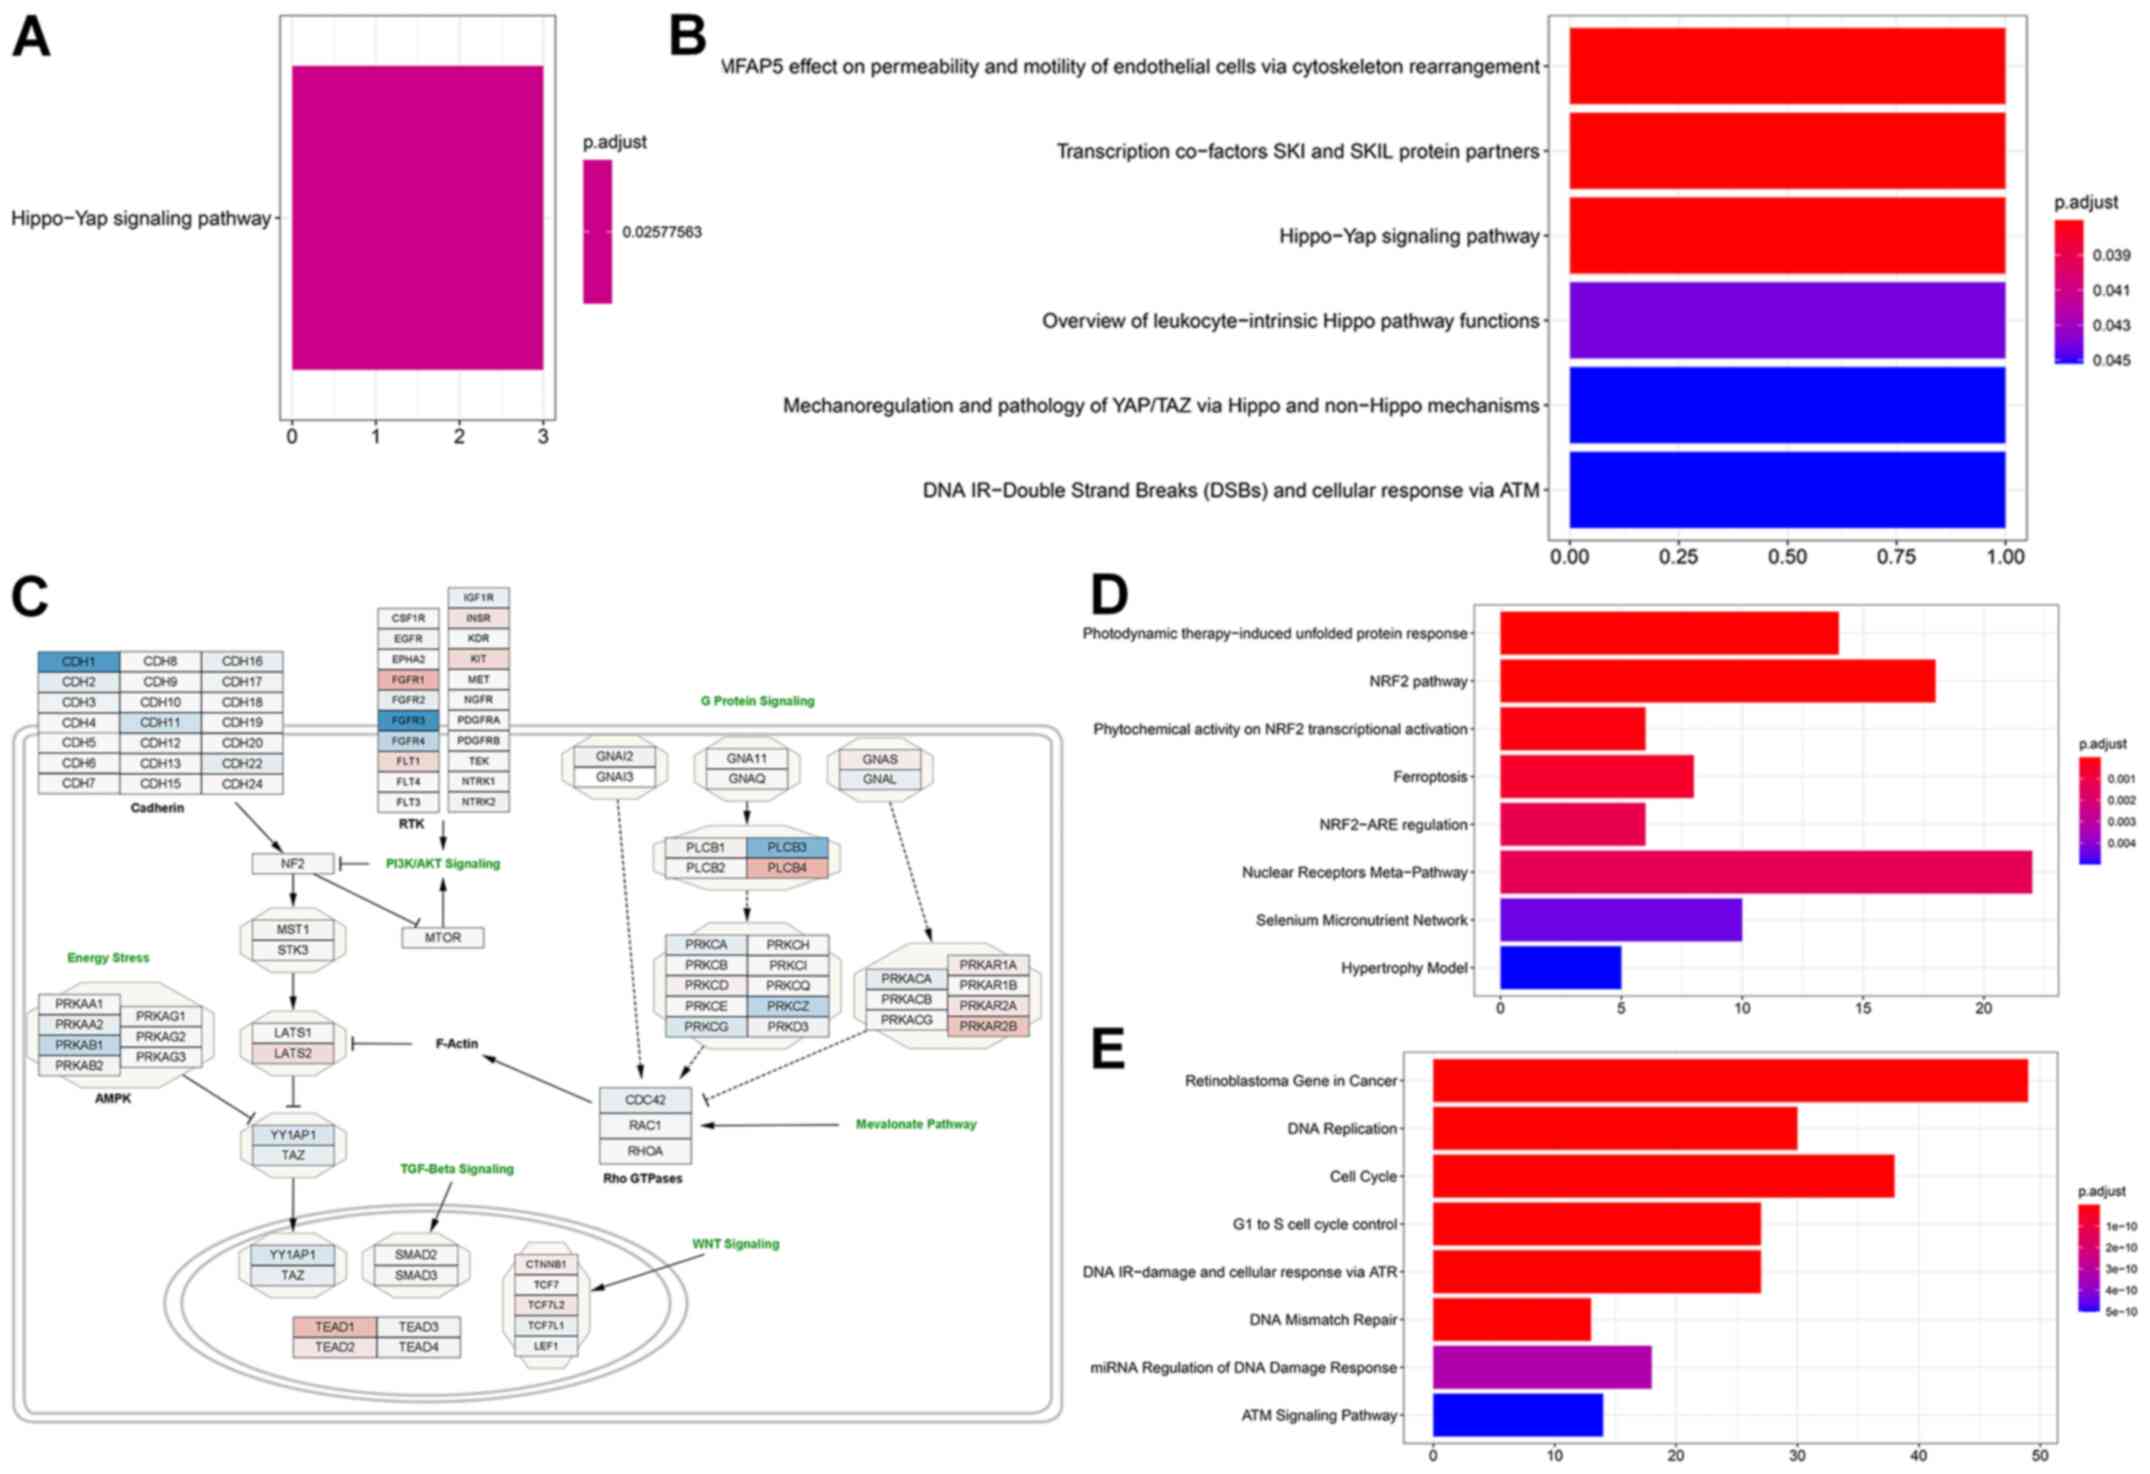
When we performed gene ontology, in MCF-7 cells
genes that were significantly increased in expression associated
with the Hippo-Yap signaling pathway (Fig. 4A) after glucose deprivation
(comparison 1), while down-regulated genes were not associated with
any pathway. Interestingly gene ontology analysis also indicated
that genes that were upregulated when glucose starved cells were
compared to those supplemented with 10 mM BHB (comparison 2)
returned the Hippo signaling pathway (Fig. 4B), however only one gene
(LATS1) was responsible for this result. Since we did not
find the same results after treatment with 25 mM BHB (comparison
3), we did not follow up on this discovery. We downloaded the
WikiPathway No. WP4540 to Cytoscape and superimposed the results
from comparison 1 for MCF-7 cells. Glucose deprivation of MCF-7
breast cancer cells lead to a decrease in Hippo signaling due to
the higher expression of LATS2 and the reduced expression of
YAP1 and TAZ (Fig.
4C). Additionally, several members of pathways interacting with
the Hippo pathway are identified as being differentially expressed
in glucose deprived MCF-7 cells such as TEAD1, and the
reduced expression of members of the AMPK pathway.
Glucose deprivation activates
ferroptosis in T47D breast cancer cells
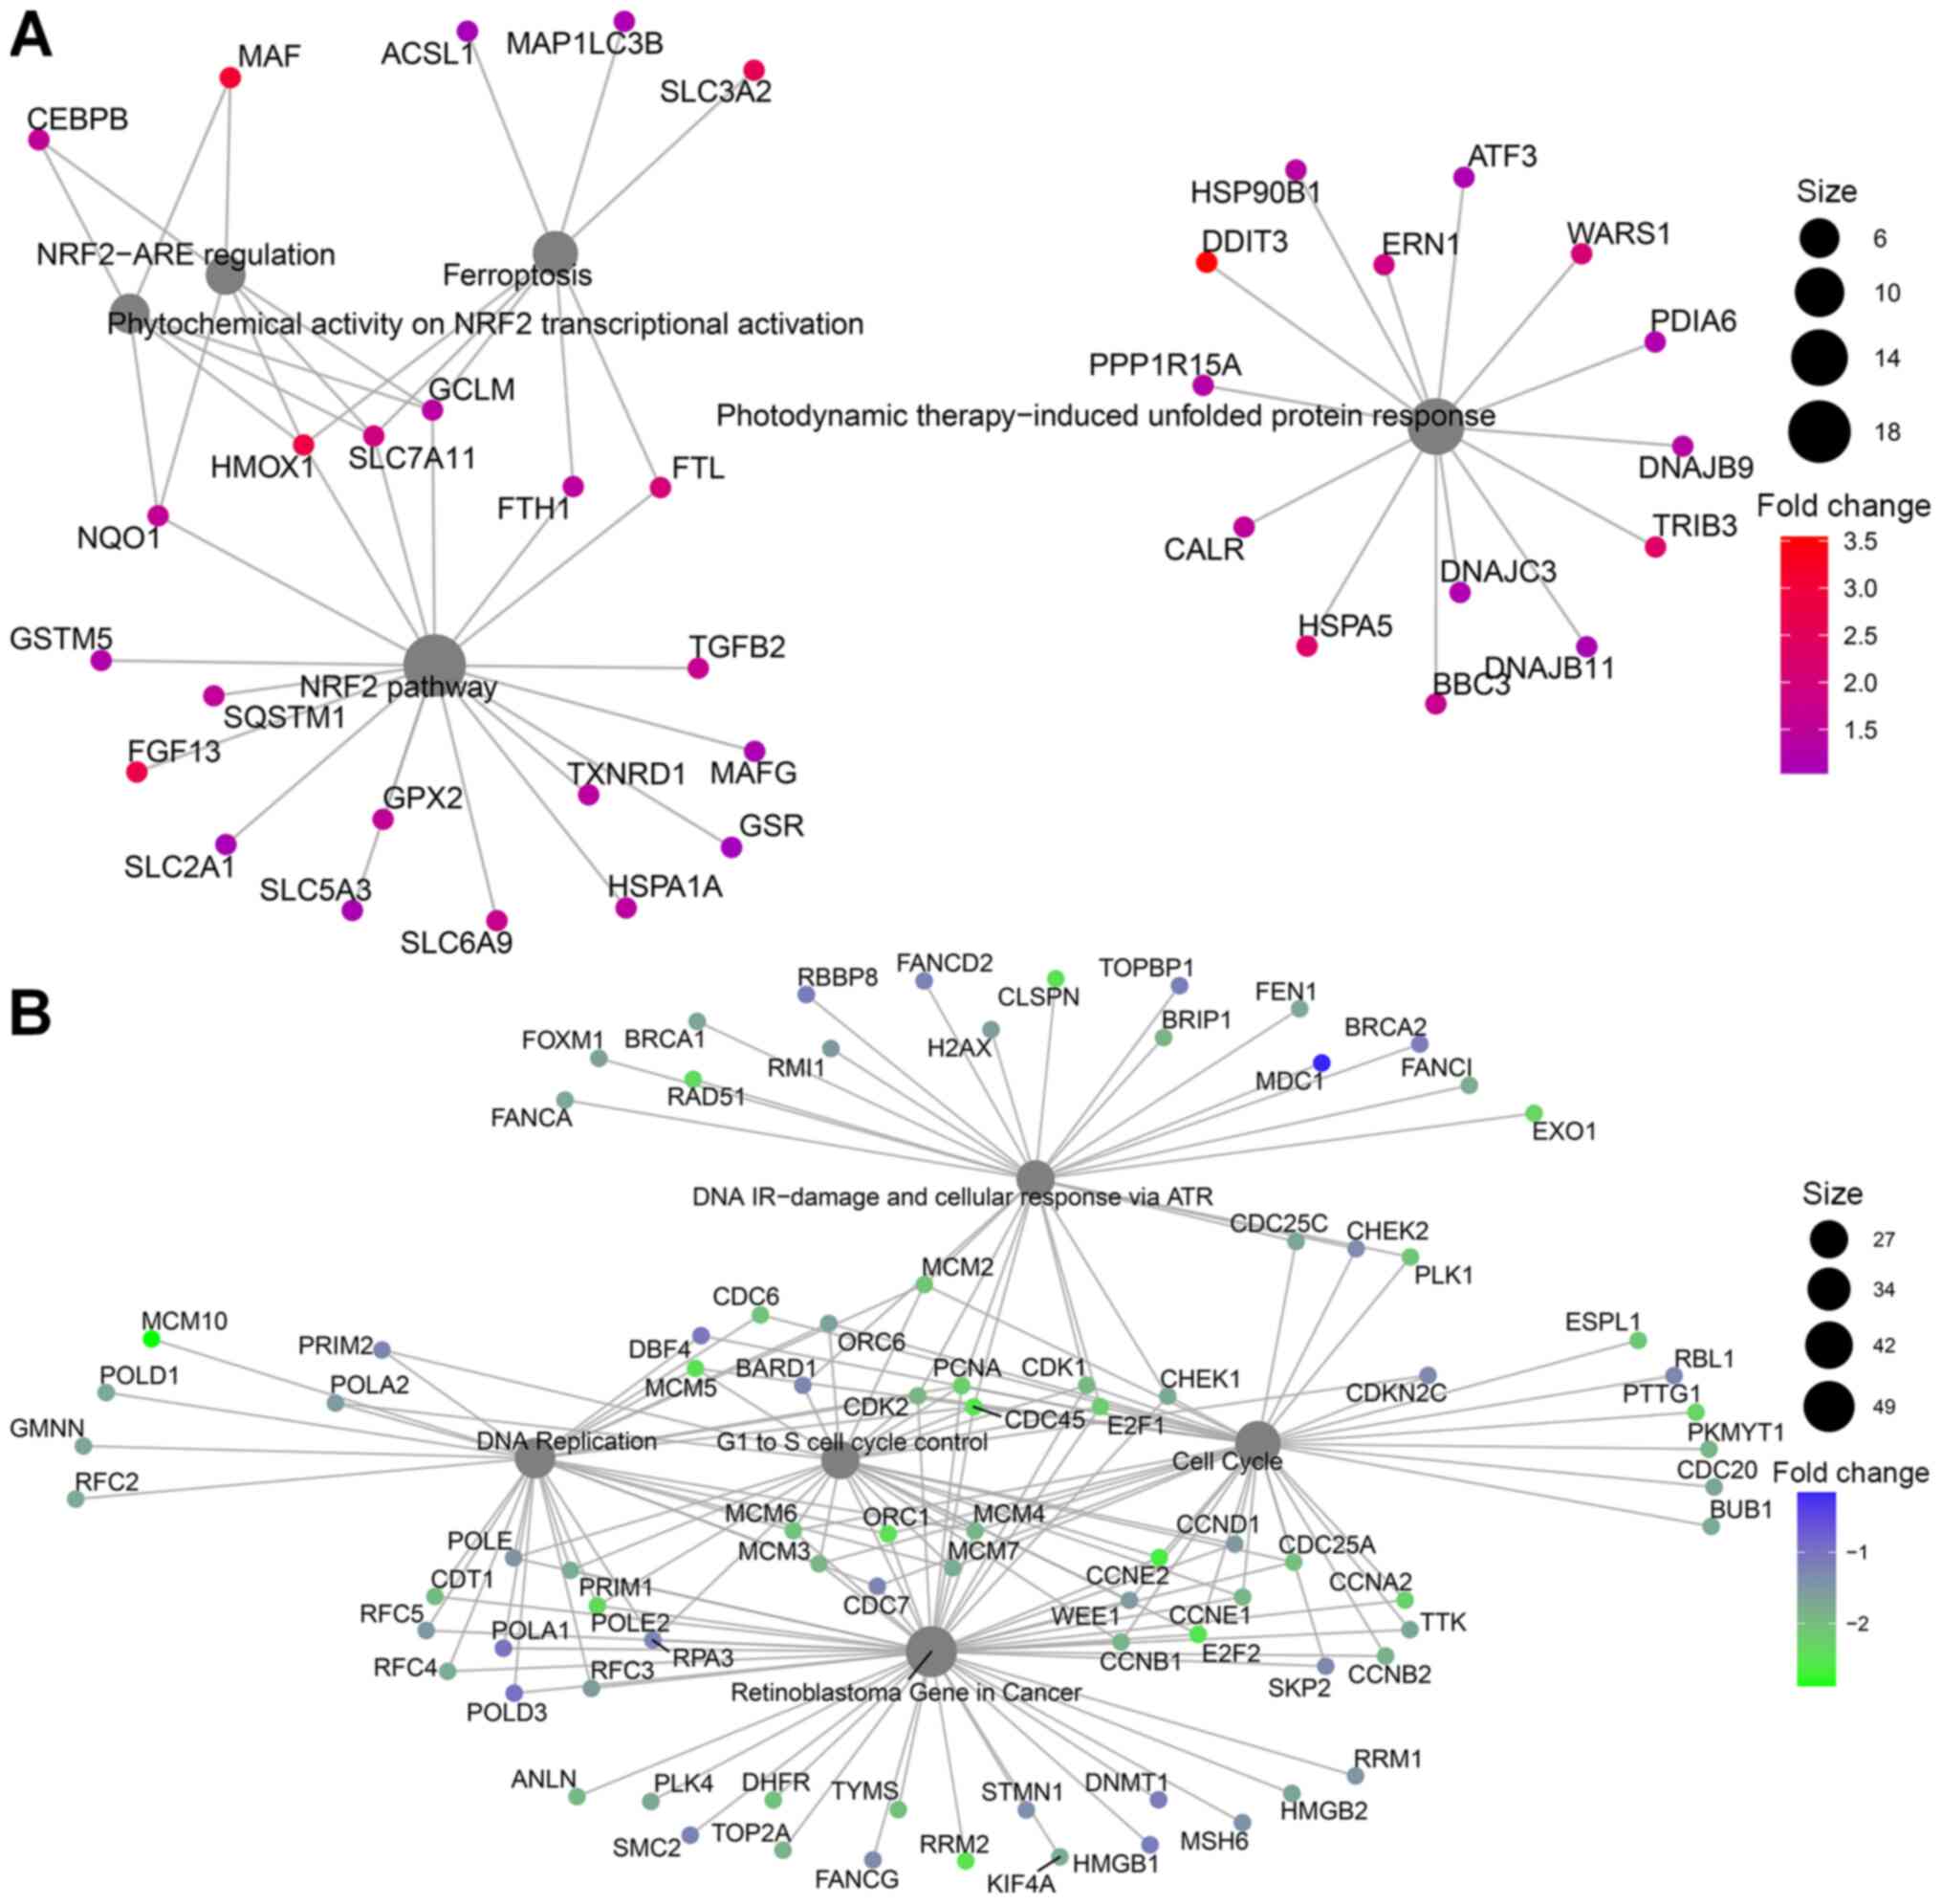
In T47D breast cancer cells, gene ontology indicated
different pathway involvements for comparison 1 between normal
glucose and low glucose treatments. Genes with increased expression
after glucose deprivation clustered around the NRF2 pathway,
regulation of ferroptosis and unfolded protein response (Figs. 4D and 5A). Within differentially regulated genes
around the NRF2 pathway there is increased expression of SLC2A1,
the gene coding for the glucose transporter GLUT1 as well as other
members of the solute carrier family (SLC5A3, SLC6A9, SLC3A2,
SLC7A11). Additionally, several genes regulating ferroptosis showed
increased expression, indicating that T47D cells may be susceptible
to this unusual cell suicide pathway following glucose deprivation.
Genes that showed decreased expression after glucose deprivation
are primarily involved in cell cycle control and DNA replication
(Figs. 4E and 5B). This is in line with the finding of
decreased proliferation in Fig. 1D and
E.
Expression of enzymes that catalyze
ketone body catabolism in MCF-7 and T47D cells and patient
samples
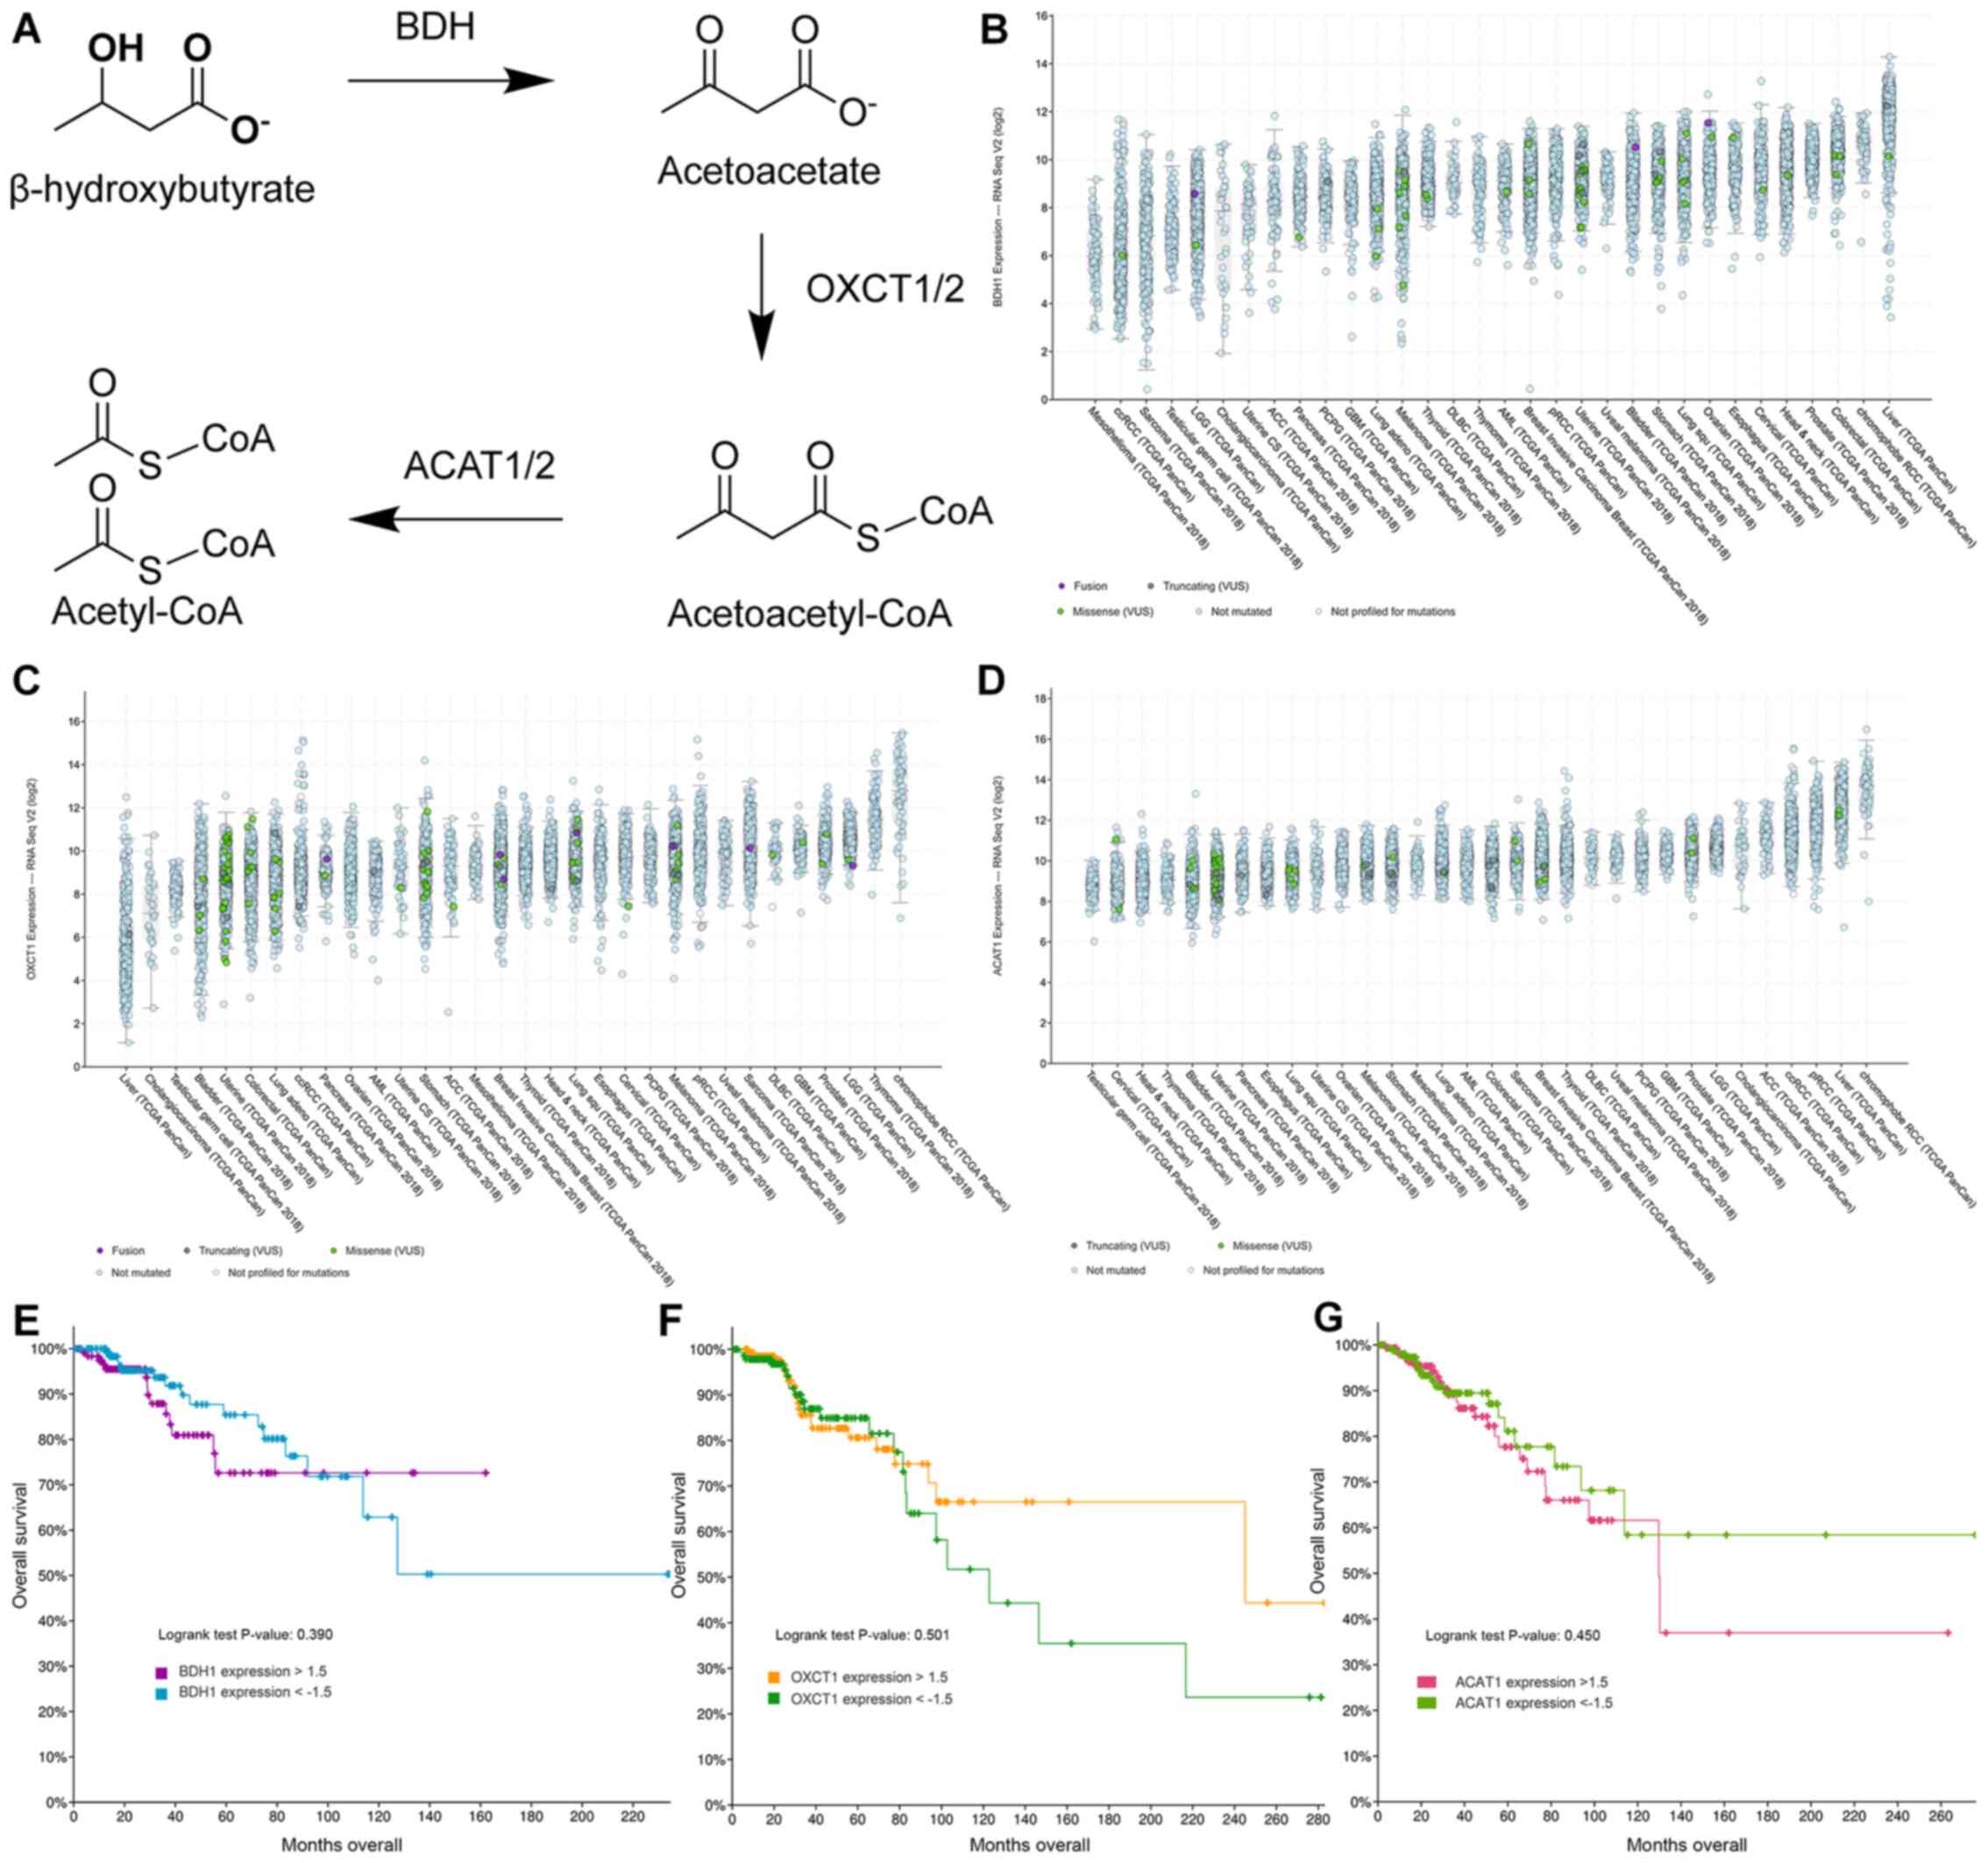
Ketone body catabolism transforms BHB to Acetyl-CoA
for immediate oxidation in the TCA cycle (Fig. 6A). The enzymes responsible for this
process are BDH, OXCT and ACAT, with OXCT being the rate limiting
step in the process. When we extracted the expression results of
these genes, we did not find any significant difference in their
expression with any treatment (Table
SI). Using fragments per kilobase per million mapped reads
(FPKM) to provide a means of comparing expression levels, OXCT1
expression is higher in MCF-7 cells than in T47D cells and vice
versa for BDH1 expression. In cBioPortal 32 studies with samples
from 10953 patients were selected spanning 32 cancer sites and
queried for gene expression of BDH1 (Fig. 6B), OXCT1 (Fig. 6C), and ACAT1 (Fig. 6D). All genes showed high expression
levels in all queried cancer types. Testicular cancer samples were
consistently the lowest expressing samples for all three genes.
Interestingly, liver cancer samples showed high expression of BDH1
and ACAT1, but the lowest expression of OXCT1. Meanwhile renal cell
carcinoma patient samples consistently showed high expression among
all three genes. Among all patient samples though BDH1/2 and
OXCT1/2 enzymes tended to be co-expressed (Table SII). Genetic or chromosomal
mutations of either BDH1 (624/10953), or OXCT1 (377/10953), or
ACAT1 (173/10953) in patient samples was a rare occurrence
(Fig. 6B-D).
Next, we selected the Breast Invasive Carcinoma
(TCGA, PanCancer Atlas) database in cBioPortal and queried the
database for gene expression levels of above 1.5-fold or below
−1.5-fold change based on mRNA expression z-scores relative to all
samples. Low and high expression of BDH1 (Fig. 6E), OXCT1 (Fig. 6F), and ACAT1 (Fig. 6G) were plotted against overall
survival. High expression of BDH1 or ACAT1 was significantly
correlated with lower survival, while there was no significant
difference in survival between low and high OXCT1 expressing breast
cancer tumors. In fact, there is a non-significant trend to higher
survival for patients with tumors overexpressing OXCT1.
Discussion
Metabolic alterations during cancer etiology are
essential for carcinogenesis and have been identified as an
emerging hallmark of all cancers (39). At the time of writing there are four
clinical trials registered at clinicaltrials.gov that resulted from a query of
‘breast cancer’ and ‘ketogenic diet’ and seven trials when queried
for ‘breast cancer’ and ‘low carbohydrate’. This demonstrates that
dietary intervention trials for the treatment of breast cancer is
of interest. The molecular actions of ketone bodies on breast
cancer cells during low glucose have not been elucidated. This is
important because breast cancer cells may start metabolizing ketone
bodies, instead of their preferred fuel glucose, under these
conditions. In the presented study we aimed to determine the
effects of BHB, the main circulating hepatic ketone body during
starvation or ketogenic diets, on two breast cancer cell lines in
low glucose conditions.
Reduction in glucose availability decreased
proliferation in breast cancer cells. Similarly, glucose
restrictions affected breast cancer cells in vitro in long
term glucose deprivation experiments (40). We did not observe any changes in cell
proliferation when breast cancer cells were treated with BHB in low
glucose conditions (Fig. 1G). For
breast cancer cells it was observed that BHB treatment decreased
cell proliferation further than glucose deprivation alone. The only
exception was for T47D cells with 125 mg/l or 0 g/l glucose after
48 h treatment. However this effect was no longer observed when
treatment times were extended to 72 h. Similar results were
observed for BT20, BT474, HBL100, MCF-7, MDA-MB 231, MDA-MB 468,
and T47D breast cancer cells under hypoxic conditions (15). Glucose deprivation may be useful in
reducing the growth of breast tumor and a ketogenic approach can be
utilized for this purpose since breast cancer cells do not seem to
increase proliferation in high ketone body environments. It can
also be concluded that this effect is specific to cancer cells,
since treatment of MCF-10A breast epithelial cells showed higher
proliferation with BHB supplementation than without during glucose
deprivation.
In MCF-7 breast cancer cells, we found that genes
with decreased expression clustered around the Hippo-Yap cell
signaling pathway when glucose was removed from the medium.
Interestingly pathway enrichment analysis demonstrated that LATS1/2
was further decreased in expression when we compared 10 mM BHB with
no BHB supplementation in glucose deprived MCF-7 breast cancer
cells. The Hippo-Yap pathway is a conserved pathway involved in
organ growth originally discovered in Drosophila. This
pathway is a kinase cascade that is activated by G-protein coupled
receptors which results in Merlin/NF-2 activation. The signal is
further transduced through SAV1-MST1/2 complexes (human ortholog to
Drosophila's Hippo) and LATS1/2 before ending in
inactivation of YAP/TAZ transcription factors. When active these
translocate to the nucleus and dimerize with TEAD1/2 or other
co-activators (41). It has been
implicated in cancer growth and includes the known tumor suppressor
gene NF-2 (42) and implicates a
TEAD1 mutation in excessive lesions retina and optical nerve
leading to a rare autosomal dominant disease called Sveinsson's
chorioretinal atrophy (SCRA) (43).
The Hippo pathway transcription factor targets YAP/TEAD have
recently been found to accumulate in the nucleus of trastuzumab
resistance HER2-positive breast cancer patient samples (44). Additionally, YAP activation was
implicated in FAK mediated development of triple-negative breast
cancer cells (45). Metabolically
the inactivation of the Hippo pathway is involved in maintaining
and mediating glucose metabolism in breast cancer cells (46–48).
Based on our findings and the supporting literature the Hippo
pathway may be involved in mediating the aerobic glycolysis
phenotype at least in MCF-7 breast cancer cells.
In T47D breast cancer cells glucose deprivation
increased gene expression of genes associates with the
NRF2-Ferroptosis axis. Ferroptosis is a recently discovered pathway
of programmed cell death driven by iron-dependent lipid
peroxidation and distinct from other forms of apoptosis. Cell death
is caused by iron mediated lipid reactive oxygen species
accumulation exceeding the cell's antioxidant defenses (49,50).
Activation of ferroptosis following glucose deprivation in breast
cancer cells has not been shown previously and the mechanistic
induction is open to speculation. However, several approaches have
been used to induce ferroptosis in pancreatic cancer cells
(51), hepatocellular (52), and breast cancer cells (53).
One way in which ferroptosis can be activated is
through the NRF2 pathway, which our data indicates is activated in
response to glucose deprivation in T47D breast cancer cells.
Indeed, previous studies found that NRF2 protein levels increased
in glucose deprived T47D breast cancer cells and knockdown of NRF2
impaired survival during glucose deprivation (54). Thus, it may be possible that glucose
deprivation activated NRF2 signaling as a protective measure
against increased autophagic flux, while simultaneously increasing
ferroptosis.
In glucose deprived breast cancer cells treated with
different levels of BHB we did not find any pathways associated
with the treatment. We propose this as another incremental evidence
that breast cancer cells do not or cannot utilize ketone bodies for
their metabolic functions and support the use of ketogenic diets in
cancer therapy.
T47D and MCF-7 breast cancer cells were chosen for
this analysis since both are luminal A breast cancer subtype and it
was expected that their reaction to glucose deprivation would be
similar. However, T47D cells reacted by significantly changing 1182
genes compared to 221 genes for MCF-7. Additionally, MCF-7 cell's
proliferation remained at ~50% without any glucose for up to 72 h
(Fig. 1A). When the incubation time
was extended up to 18 days, MCF-7 cells showed no difference in
proliferation between any of the treatment groups (Fig. 1G). Compared to T47D cells, MCF-7
cells are therefore more resistant to glucose deprivation and it
can be suggested that they are utilizing an alternative metabolic
fuel. Our results rule out that MCF-7 cells utilize BHB as fuel and
we suggest that the alternative could be glutamine. We retained
glutamine in the medium, since most ketogenic diets do not include
reduction in protein intake and may even promote increased protein
intake in order to increase satiety and palatability of ketogenic
diets (55). In other works,
glutamine deprivation of MCF-7 cells resulted in decreased
proliferation and increased apoptosis (56,57),
supporting this assertion. It was also observed that genes coding
for enzymes able to metabolize ketone bodies to acetyl-CoA are
expressed in our breast cancer cells (Table SI) and that patient samples indicate
decreased survival in patients with tumors expressing high levels
of BDH1 and ACAT1. Thus while the breast cancer cells in this study
are not utilizing BHB as energetic substrate, the inherent ability
of cells to sustain energetic requirements through a number of
different metabolic fuels mandates fuller investigation into the
metabolic patterns that breast cancer cells display before engaging
in therapeutic interventions. It may be catastrophic to alter diets
of cancer patients that inadvertently provide their tumors with a
metabolic fuel, including glutamine and BHB, they are adapted to
consume.
We aimed to elucidate the gene expression changes
that occur when breast cancer cells are adapting their metabolism
to a ketogenic environment and are required to use BHB as an
energetic metabolite. However, some of the observed gene expression
changes may be due to a secondary function of BHB, i.e. its ability
to act as a signaling molecule (21,58,59).
While the signaling ability of BHB has primarily been demonstrated
to activate the starvation response, it is possible that BHB may
have effects on breast cancer cells independently of its role as
energetic substrate, which may explain some of the changes we have
observed. This may in part explain why a substantial number of
genes were differentially expressed in glucose deprived cells
treated with BHB, without demonstrating any known cell signaling
pathway involvement.
In conclusion, glucose deprivation through ketogenic
diets may provide a useful tool in battling breast cancer. Similar
to a recent study (15), we did not
observe any effect of BHB on cell proliferation in breast cancer
cells, suggesting that breast cancer cells are unable to use BHB as
a fuel to drive proliferation. However, it may be necessary to
screen patients for the presences of ketone catabolic enzymes
OXCT1/2, BDH1/2, and ACAT1/2, which show increased expression in a
variety of patient samples. A ketogenic diet may be disastrous for
this subgroup of patients. Additionally, further research is
required to understand the different responses we observed in just
two breast cancer cell lines to glucose deprivation. This
heterogeneity in breast cancer cells will likely impact the ongoing
clinical trials using ketogenic diets and possibly lead to
dismissing ketogenic diets for cancer treatments, when there might
be a substantial subgroup of patients that will benefit from this
intervention.
Supplementary Material
Supporting Data
Acknowledgements
The authors would like to thank Dr Dirk Geerts
(Department of Medical Biology, Academic Medical Center Amsterdam,
Amsterdam, Netherlands) for consulting on the experimental
conditions for the RNA sequencing samples and the Epigenetics Core
(Department of Native Hawaiian Health, John A. Burns School of
Medicine, University of Hawai'i at Manoa, Honolulu, HI, USA) for
consultation on the RNA sequencing analysis. The authors would also
like to acknowledge undergraduate interns Mr. Colin
Andres-Paguirigan, Ms. Alyssa Sato, Ms. Leslie Ann Villanueva and
Ms. Chanya Techasurungkul (School of Natural Sciences and
Mathematics, Chaminade University of Honolulu, Honolulu, HI,
USA).
Funding
This study was funded by a grant from the Alana Dung
Research Foundation. MW received pilot funding from the National
Institutes of Health (NIH), National Institute of General Medical
Sciences (NIGMS), IDeA Networks of Biomedical Research Excellence
(INBRE), Award no. P20GM103466.
Availability of data and materials
The sequencing datasets generated for this study can
be found in the Gene Expression Omnibus (GEO) DataSets (https://www.ncbi.nlm.nih.gov/gds) under the
accession no. GSE153830. Cell proliferation datasets are available
from the corresponding author upon reasonable request.
Authors' contributions
Conception and design of the study: RM, CAT and MW.
Acquisition of data: RM, CAT, CS, AD, KU and MW. Analysis and
interpretation of data: RM, AD, KU, CAT and MW. Drafting the
manuscript: RM, KU and MW. All authors read and approved the
manuscript and agree to be accountable for all aspects of the
research in ensuring that the accuracy or integrity of any part of
the work are appropriately investigated and resolved.
Ethics approval and consent to
participate
Not applicable.
Patient consent for publication
Not applicable.
Competing interests
The authors declare that they have no competing
interests.
References
|
1
|
Warburg O: On the origin of cancer cells.
Science. 123:309–314. 1956. View Article : Google Scholar : PubMed/NCBI
|
|
2
|
Arora R, Schmitt D, Karanam B, Tan M,
Yates C and Dean-Colomb W: Inhibition of the Warburg effect with a
natural compound reveals a novel measurement for determining the
metastatic potential of breast cancers. Oncotarget. 6:662–678.
2015. View Article : Google Scholar : PubMed/NCBI
|
|
3
|
Warburg O, Wind F and Negelein E: The
metabolism of tumors in the body. J Gen Physiol. 8:519–530. 1927.
View Article : Google Scholar : PubMed/NCBI
|
|
4
|
Nebeling LC, Miraldi F, Shurin SB and
Lerner E: Effects of a ketogenic diet on tumor metabolism and
nutritional status in pediatric oncology patients: Two case
reports. J Am Coll Nutr. 14:202–208. 1995. View Article : Google Scholar : PubMed/NCBI
|
|
5
|
Li Z and Heber D: Ketogenic diets. JAMA.
323:3862020. View Article : Google Scholar : PubMed/NCBI
|
|
6
|
Bueno NB, de Melo IS, de Oliveira SL and
da Rocha Ataide T: Very-low-carbohydrate ketogenic diet v. low-fat
diet for long-term weight loss: A meta-analysis of randomised
controlled trials. Br J Nutr. 110:1178–1187. 2013. View Article : Google Scholar : PubMed/NCBI
|
|
7
|
Martin-McGill KJ, Jackson CF, Bresnahan R,
Levy RG and Cooper PN: Ketogenic diets for drug-resistant epilepsy.
Cochrane Database Syst Rev. 11:CD0019032018.PubMed/NCBI
|
|
8
|
Clifton P, Carter S, Headland M and Keogh
J: Low carbohydrate and ketogenic diets in type 2 diabetes. Curr
Opin Lipidol. 26:594–595. 2015. View Article : Google Scholar : PubMed/NCBI
|
|
9
|
Masino SA and Rho JM: Mechanisms of
ketogenic diet action. Jasper's Basic Mechanisms of the Epilepsies.
4th edition. Noebels JL, Avoli M, Rogawski MA, Olsen RW and
Delgado-Escueta AV: National Center for Biotechnology Information;
Bethesda, MD: pp. 1483–1516. 2012
|
|
10
|
Erickson N, Boscheri A, Linke B and
Huebner J: Systematic review: Isocaloric ketogenic dietary regimes
for cancer patients. Med Oncol. 34:722017. View Article : Google Scholar : PubMed/NCBI
|
|
11
|
Klement RJ: Beneficial effects of
ketogenic diets for cancer patients: A realist review with focus on
evidence and confirmation. Med Oncol. 34:1322017. View Article : Google Scholar : PubMed/NCBI
|
|
12
|
Klement RJ, Champ CE, Otto C and Kämmerer
U: Anti-tumor effects of ketogenic diets in mice: A meta-analysis.
PLoS One. 11:e01550502016. View Article : Google Scholar : PubMed/NCBI
|
|
13
|
Rieger J, Bähr O, Maurer GD, Hattingen E,
Franz K, Brucker D, Walenta S, Kämmerer U, Coy JF, Weller M and
Steinbach JP: ERGO: A pilot study of ketogenic diet in recurrent
glioblastoma. Int J Oncol. 44:1843–1852. 2014. View Article : Google Scholar : PubMed/NCBI
|
|
14
|
Kadochi Y, Mori S, Fujiwara-Tani R, Luo Y,
Nishiguchi Y, Kishi S, Fujii K, Ohmori H and Kuniyasu H: Remodeling
of energy metabolism by a ketone body and medium-chain fatty acid
suppressed the proliferation of CT26 mouse colon cancer cells.
Oncol Lett. 14:673–680. 2017. View Article : Google Scholar : PubMed/NCBI
|
|
15
|
Bartmann C, Janaki Raman SR, Flöter J,
Schulze A, Bahlke K, Willingstorfer J, Strunz M, Wöckel A, Klement
RJ, Kapp M, et al: Beta-hydroxybutyrate (3-OHB) can influence the
energetic phenotype of breast cancer cells, but does not impact
their proliferation and the response to chemotherapy or radiation.
Cancer Metab. 6:82018. View Article : Google Scholar : PubMed/NCBI
|
|
16
|
Huang D, Li T, Wang L, Zhang L, Yan R, Li
K, Xing S, Wu G, Hu L, Jia W, et al: Hepatocellular carcinoma
redirects to ketolysis for progression under nutrition deprivation
stress. Cell Res. 26:1112–1130. 2016. View Article : Google Scholar : PubMed/NCBI
|
|
17
|
Hao GW, Chen YS, He DM, Wang HY, Wu GH and
Zhang B: Growth of human colon cancer cells in nude mice is delayed
by ketogenic diet with or without omega-3 fatty acids and
medium-chain triglycerides. Asian Pac J Cancer Prev. 16:2061–2068.
2015. View Article : Google Scholar : PubMed/NCBI
|
|
18
|
Poff AM, Ari C, Arnold P, Seyfried TN and
D'Agostino DP: Ketone supplementation decreases tumor cell
viability and prolongs survival of mice with metastatic cancer. Int
J Cancer. 135:1711–1720. 2014. View Article : Google Scholar : PubMed/NCBI
|
|
19
|
Martinez-Outschoorn UE, Lin Z,
Whitaker-Menezes D, Howell A, Sotgia F and Lisanti MP: Ketone body
utilization drives tumor growth and metastasis. Cell Cycle.
11:3964–3971. 2012. View
Article : Google Scholar : PubMed/NCBI
|
|
20
|
Schwartz KA, Noel M, Nikolai M and Chang
HT: Investigating the ketogenic diet as treatment for primary
aggressive brain cancer: Challenges and lessons learned. Front
Nutr. 5:112018. View Article : Google Scholar : PubMed/NCBI
|
|
21
|
Newman JC and Verdin E: β-Hydroxybutyrate:
A signaling metabolite. Annu Rev Nutr. 37:51–76. 2017. View Article : Google Scholar : PubMed/NCBI
|
|
22
|
Dai X, Cheng H, Bai Z and Li J: Breast
cancer cell line classification and its relevance with breast tumor
subtyping. J Cancer. 8:3131–3141. 2017. View Article : Google Scholar : PubMed/NCBI
|
|
23
|
Bray NL, Pimentel H, Melsted P and Pachter
L: Near-optimal probabilistic RNA-seq quantification. Nat
Biotechnol. 34:525–527. 2016. View Article : Google Scholar : PubMed/NCBI
|
|
24
|
Love MI, Huber W and Anders S: Moderated
estimation of fold change and dispersion for RNA-seq data with
DESeq2. Genome Biol. 15:5502014. View Article : Google Scholar : PubMed/NCBI
|
|
25
|
Stephens M: False discovery rates: A new
deal. Biostatistics. 18:275–294. 2017.PubMed/NCBI
|
|
26
|
Huber W, Carey VJ, Gentleman R, Anders S,
Carlson M, Carvalho BS, Bravo HC, Davis S, Gatto L, Girke T, et al:
Orchestrating high-throughput genomic analysis with Bioconductor.
Nat Methods. 12:115–121. 2015. View Article : Google Scholar : PubMed/NCBI
|
|
27
|
Gentleman RC, Carey VJ, Bates DM, Bolstad
B, Dettling M, Dudoit S, Ellis B, Gautier L, Ge Y, Gentry J, et al:
Bioconductor: Open software development for computational biology
and bioinformatics. Genome Biol. 5:R802004. View Article : Google Scholar : PubMed/NCBI
|
|
28
|
R Core Team: R: A language and environment
for statistical computing. simplehttps://www.R-project.org/February 10–2015
|
|
29
|
Slenter DN, Kutmon M, Hanspers K, Riutta
A, Windsor J, Nunes N, Mélius J, Cirillo E, Coort SL, Digles D, et
al: WikiPathways: A multifaceted pathway database bridging
metabolomics to other omics research. Nucleic Acids Res.
46(D1):D661–D667. 2018. View Article : Google Scholar
|
|
30
|
Gustavsen JA, Pai S, Isserlin R, Demchak B
and Pico AR: RCy3: Network biology using cytoscape from within R.
F1000Res. 8:17742019. View Article : Google Scholar : PubMed/NCBI
|
|
31
|
Shannon P, Markiel A, Ozier O, Baliga NS,
Wang JT, Ramage D, Amin N, Schwikowski B and Ideker T: Cytoscape: A
software environment for integrated models of biomolecular
interaction networks. Genome Res. 13:2498–2504. 2003. View Article : Google Scholar : PubMed/NCBI
|
|
32
|
Benjamini Y and Hochberg Y: Controlling
the false discovery rate: A practical and powerful approach to
multiple testing. J R Stat Soc B. 57:289–300. 1995.
|
|
33
|
Kutmon M, Lotia S, Evelo CT and Pico AR:
WikiPathways app for cytoscape: Making biological pathways amenable
to network analysis and visualization. F1000 Res. 3:1522014.
View Article : Google Scholar
|
|
34
|
Yu G, Wang LG, Han Y and He QY:
ClusterProfiler: An R package for comparing biological themes among
gene clusters. OMICS. 16:284–287. 2012. View Article : Google Scholar : PubMed/NCBI
|
|
35
|
Cerami E, Gao J, Dogrusoz U, Gross BE,
Sumer SO, Aksoy BA, Jacobsen A, Byrne CJ, Heuer ML, Larsson E, et
al: The cBio cancer genomics portal: An open platform for exploring
multidimensional cancer genomics data. Cancer Discov. 2:401–404.
2012. View Article : Google Scholar : PubMed/NCBI
|
|
36
|
Gao J, Aksoy BA, Dogrusoz U, Dresdner G,
Gross B, Sumer SO, Sun Y, Jacobsen A, Sinha R, Larsson E, et al:
Integrative analysis of complex cancer genomics and clinical
profiles using the cBioPortal. Sci Signal. 6:pl12013. View Article : Google Scholar : PubMed/NCBI
|
|
37
|
VanItallie TB and Nufert TH: Ketones:
Metabolism's ugly duckling. Nutr Rev. 61:327–341. 2003. View Article : Google Scholar : PubMed/NCBI
|
|
38
|
Katashima R, Iwahana H, Fujimura M,
Yamaoka T, Ishizuka T, Tatibana M and Itakura M: Molecular cloning
of a human cDNA for the 41-kDa phosphoribosylpyrophosphate
synthetase-associated protein. Biochim Biophys Acta. 1396:245–250.
1998. View Article : Google Scholar : PubMed/NCBI
|
|
39
|
Hanahan D and Weinberg RA: Hallmarks of
cancer: The next generation. Cell. 144:646–674. 2011. View Article : Google Scholar : PubMed/NCBI
|
|
40
|
Mathews EH, Visagie MH, Meyer AA, Joubert
AM and Mathews GE: In vitro quantification: Long-term effect of
glucose deprivation on various cancer cell lines. Nutrition.
74:1107482020. View Article : Google Scholar : PubMed/NCBI
|
|
41
|
Badouel C and McNeill H: SnapShot: The
hippo signaling pathway. Cell. 145:484–484.e1. 2011. View Article : Google Scholar : PubMed/NCBI
|
|
42
|
Araki N, Takeshima H and Saya H:
Neurofibromatosis type 2 (NF2). Gan To Kagaku Ryoho. 24:1427–1431.
1997.(In Japanese). PubMed/NCBI
|
|
43
|
Fossdal R, Jonasson F, Kristjansdottir GT,
Kong A, Stefansson H, Gosh S, Gulcher JR and Stefansson K: A novel
TEAD1 mutation is the causative allele in Sveinsson's chorioretinal
atrophy (helicoid peripapillary chorioretinal degeneration). Hum
Mol Genet. 13:975–981. 2004. View Article : Google Scholar : PubMed/NCBI
|
|
44
|
González-Alonso P, Zazo S, Martín-Aparicio
E, Luque M, Chamizo C, Sanz-Álvarez M, Minguez P, Gómez-López G,
Cristóbal I, Caramés C, et al: The hippo pathway transducers
YAP1/TEAD induce acquired resistance to trastuzumab in
HER2-positive breast cancer. Cancers (Basel). 12:11082020.
View Article : Google Scholar
|
|
45
|
Rigiracciolo DC, Nohata N, Lappano R,
Cirillo F, Talia M, Scordamaglia D, Gutkind JS and Maggiolini M:
IGF-1/IGF-1R/FAK/YAP transduction signaling prompts growth effects
in triple-negative breast cancer (TNBC) cells. Cells. 9:10102020.
View Article : Google Scholar
|
|
46
|
Enzo E, Santinon G, Pocaterra A, Aragona
M, Bresolin S, Forcato M, Grifoni D, Pession A, Zanconato F, Guzzo
G, et al: Aerobic glycolysis tunes YAP/TAZ transcriptional
activity. EMBO J. 34:1349–1370. 2015. View Article : Google Scholar : PubMed/NCBI
|
|
47
|
Lin C and Xu X: YAP1-TEAD1-Glut1 axis
dictates the oncogenic phenotypes of breast cancer cells by
modulating glycolysis. Biomed Pharmacother. 95:789–794. 2017.
View Article : Google Scholar : PubMed/NCBI
|
|
48
|
Zheng X, Han H, Liu GP, Ma YX, Pan RL,
Sang LJ, Li RH, Yang LJ, Marks JR, Wang W and Lin A: LncRNA wires
up Hippo and Hedgehog signaling to reprogramme glucose metabolism.
EMBO J. 36:3325–3335. 2017. View Article : Google Scholar : PubMed/NCBI
|
|
49
|
Han C, Liu Y, Dai R, Ismail N, Su W and Li
B: Ferroptosis and its potential role in human diseases. Front
Pharmacol. 11:2392020. View Article : Google Scholar : PubMed/NCBI
|
|
50
|
Li J, Cao F, Yin HL, Huang ZJ, Lin ZT, Mao
N, Sun B and Wang G: Ferroptosis: Past, present and future. Cell
Death Dis. 11:882020. View Article : Google Scholar : PubMed/NCBI
|
|
51
|
Yamaguchi Y, Kasukabe T and Kumakura S:
Piperlongumine rapidly induces the death of human pancreatic cancer
cells mainly through the induction of ferroptosis. Int J Oncol.
52:1011–1022. 2018.PubMed/NCBI
|
|
52
|
Ou W, Mulik RS, Anwar A, McDonald JG, He X
and Corbin IR: Low-density lipoprotein docosahexaenoic acid
nanoparticles induce ferroptotic cell death in hepatocellular
carcinoma. Free Radic Biol Med. 112:597–607. 2017. View Article : Google Scholar : PubMed/NCBI
|
|
53
|
Chen MS, Wang SF, Hsu CY, Yin PH, Yeh TS,
Lee HC and Tseng LM: CHAC1 degradation of glutathione enhances
cystine-starvation-induced necroptosis and ferroptosis in human
triple negative breast cancer cells via the GCN2-eIF2α-ATF4
pathway. Oncotarget. 8:114588–114602. 2017. View Article : Google Scholar : PubMed/NCBI
|
|
54
|
Walker A, Singh A, Tully E, Woo J, Le A,
Nguyen T, Biswal S, Sharma D and Gabrielson E: Nrf2 signaling and
autophagy are complementary in protecting breast cancer cells
during glucose deprivation. Free Radic Biol Med. 120:407–413. 2018.
View Article : Google Scholar : PubMed/NCBI
|
|
55
|
Johnstone AM, Horgan GW, Murison SD,
Bremner DM and Lobley GE: Effects of a high-protein ketogenic diet
on hunger, appetite, and weight loss in obese men feeding ad
libitum. Am J Clin Nutr. 87:44–55. 2008. View Article : Google Scholar : PubMed/NCBI
|
|
56
|
Gwangwa MV, Joubert AM and Visagie MH:
Effects of glutamine deprivation on oxidative stress and cell
survival in breast cell lines. Biol Res. 52:152019. View Article : Google Scholar : PubMed/NCBI
|
|
57
|
Ko YH, Lin Z, Flomenberg N, Pestell RG,
Howell A, Sotgia F, Lisanti MP and Martinez-Outschoorn UE:
Glutamine fuels a vicious cycle of autophagy in the tumor stroma
and oxidative mitochondrial metabolism in epithelial cancer cells:
Implications for preventing chemotherapy resistance. Cancer Biol
Ther. 12:1085–1097. 2011. View Article : Google Scholar : PubMed/NCBI
|
|
58
|
Newman JC and Verdin E: Ketone bodies as
signaling metabolites. Trends Endocrinol Metab. 25:42–52. 2014.
View Article : Google Scholar : PubMed/NCBI
|
|
59
|
Rojas-Morales P, Tapia E and
Pedraza-Chaverri J: β-Hydroxybutyrate: A signaling metabolite in
starvation response? Cell Signal. 28:917–923. 2016. View Article : Google Scholar : PubMed/NCBI
|