Introduction
Ovarian carcinomas are a group of malignant tumors,
whose mortality rate ranks second in gynecological tumors worldwide
(1). Ovarian tumors can be divided
into ovarian carcinomas, borderline tumors and benign tumors
according to their biological behavior and histological
differentiation (2). Ovarian
carcinomas can also be divided into five main histological types
(high grade serous, endometrioid, clear cell, mucinous and low
grade serous ovarian carcinomas) according to different
histological epithelia (3).
Currently, high-grade serous carcinomas (HGSC) and low-grade serous
carcinomas (LGSC) are considered to be two distinct tumors. HGSC
does not develop from well-differentiated LGSC and likely arises
from the fallopian tube epithelium, with an obvious mitotic
activity, nuclear atypia and common TP53 mutations (4–6).
Meanwhile, LGSC shows low mitotic activity, nuclear atypia and
frequent KRAS and BRAF mutations (7,8). Due to
its late detection, the survival rate of patients with ovarian
carcinomas is low. The 5-year survival rate is only ~29% for
patients with advanced stage (III and IV combined) but is >92%
for patients with stage I carcinoma (9,10).
Therefore, the early detection and accurate diagnosis of ovarian
carcinomas may improve the patient's survival rate and quality of
life. Unfortunately, due to a lack of effective imaging tools or
biomarkers for screening early ovarian carcinomas, it is difficult
to conduct a comprehensive imaging study for early ovarian
carcinomas (11). A good animal
model of ovarian precancerous lesions, borderline tumors and early
carcinomas will be helpful for investigating the occurrence,
development and imaging of ovarian carcinomas.
Chemically induced animal models of ovarian tumors
can exhibit oncogenesis, development, invasion, and metastasis
(12).
7,12-dimethylbenz[a]anthracene (DMBA), a frequently used carcinogen
to induce ovarian tumors, has been confirmed to have specificity
for inducing ovarian adenocarcinoma (13–16).
Studies have shown that DMBA-induced oncogenes in rat ovarian
adenocarcinomas were similar to those in human ovarian
adenocarcinomas (14,16). However, previous researchers used
non-absorbable materials to load chemical carcinogens (14). The induced tumors were accompanied by
inflammatory granulomas and were mostly advanced ovarian
carcinomas, which are not suitable for the investigation of
borderline ovarian tumors and early ovarian carcinomas. Therefore,
the present study aimed to optimize DMBA induction schemes for rat
borderline ovarian tumors and early ovarian carcinomas by comparing
different delivery methods, induction doses and times.
Materials and methods
Ethics
The study was approved by The Institutional Review
Board of Jinshan Hospital, Fudan University (Shanghai, China), and
all procedures involving animal studies were in accordance with the
Guide for the Care and Use of Laboratory Animals of the National
Science and Technology Committee of China. During the experimental
process, rats were euthanized when they developed cachexia or
abnormally dilated abdominal cavity.
Animal breeding
In total, 500 female Sprague-Dawley rats weighing
150–200 g, with ages ranging from 5 to 7 weeks [Shanghai
Experimental Animal Co., Ltd., SCXK(SH)2012-0006] were fed for one
week before surgery. The rats were maintained in a room under a
temperature of 22±2°C with a 12–12 h light/dark cycle. Food and
deionized water were available ad libitum.
Experimental grouping
The current study was performed by using three
experimental schemes of DMBA delivery and corresponding control
groups. Scheme one included 150 experimental rats divided into
three groups of 50 rats per group according to three different
doses (1.0, 2.0 and 3.0 mg). Scheme two included 159 rats divided
into 0.5, 1.0 and 1.5 mg groups, with 51, 53 and 55 rats in each
group, respectively. Scheme three included 161 rats divided into
1.0, 2.0 and 3.0 mg groups, with 50, 53 and 58 rats in each group,
respectively. Rats of different dose groups in each scheme were
subdivided into five groups according to the time of DMBA exposure
(60, 90, 120, 150 and 180 days). In total, 30 control rats were
divided into three groups according to the corresponding
experimental schemes, with 10 rats in each group.
DMBA preparation
For scheme one DMBA (99% purity; Sigma-Aldrich;
Merck KGaA) was dissolved in DMSO solvent (analytical pure;
Shanghai Shenggong Biology Engineering Technology Service, Ltd.) to
produce 1.0, 2.0 and 3.0 mg DMBA per 0.02 ml solution. A piece of
0.6×0.6 mm sterile absorbable gauze (Danatai; Yunnan Dehua
Biological Pharmaceutical Corporation) was folded twice to make its
length and width 0.3×0.3 mm. The prepared DMBA solution was
injected into absorbable gauze slowly with a microsyringe. For
scheme two DMBA was dissolved in DMSO solvent to produce a DMBA
content per 0.02 ml solution of 0.5, 1.0 and 1.5 mg. For scheme
three DMBA was heated to a melting point of 124°C. Absorbable
hemostatic gauze was immersed in melted DMBA and contained 1.0, 2.0
and 3.0 mg of carcinogen, as weighed on a microchemical
balance.
DMBA exposure to the ovary
Ovaries were exposed to DMBA as described in a
previous study (17). Rats were
anesthetized by intraperitoneal injection of 2% pentobarbital
sodium at 50 mg/kg. A transverse, 1.5-cm mid-lumbar incision was
made in the right flank of the animal, 5 mm ventral to the lumbar
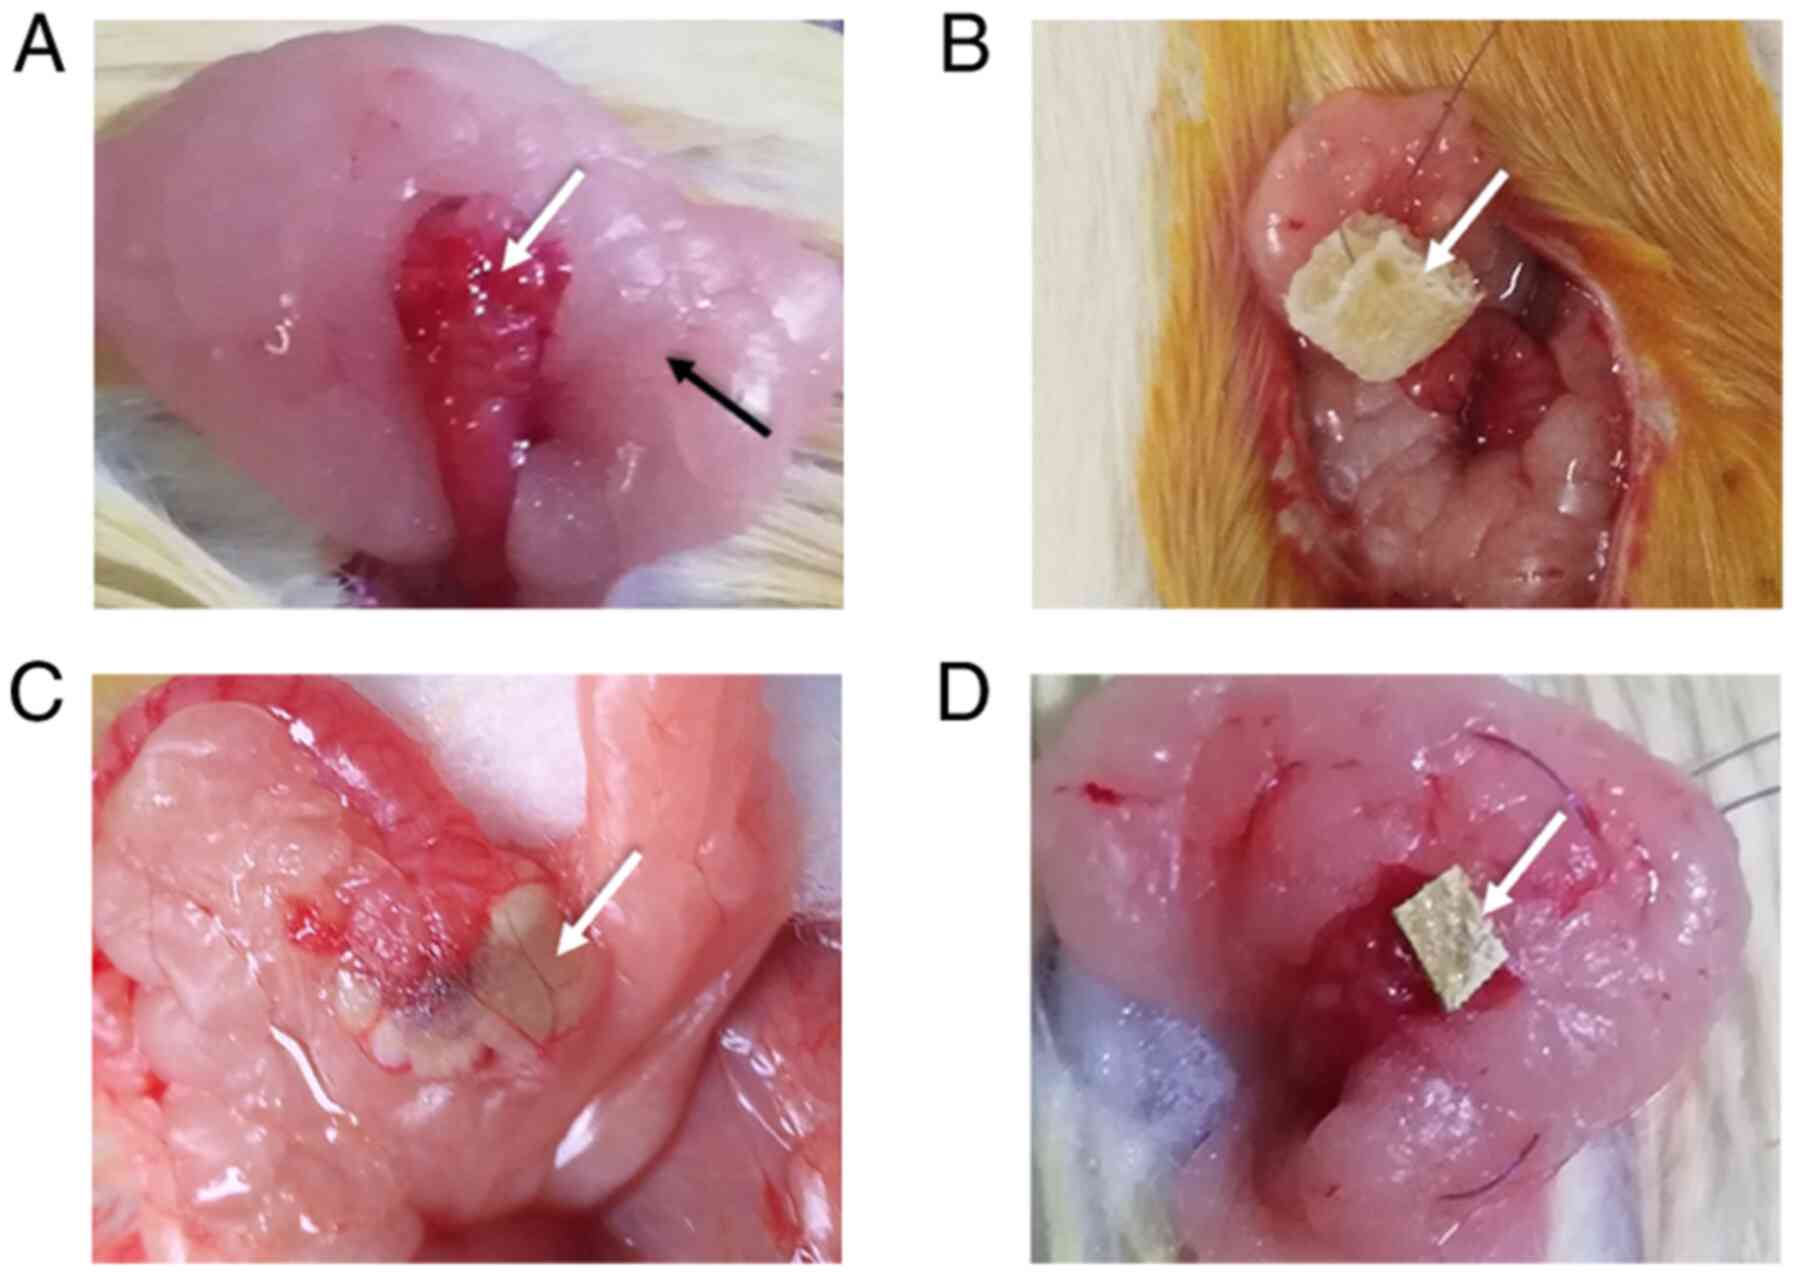
muscles. Ovaries and fat pads were surgically exposed. For scheme
one the ovary was covered with absorbable hemostatic gauze loaded
with a high concentration of liquid DMBA or DMSO (serving as the
control), wrapped with periovarian fat and sealed with human
absorbable fibrin glue (Hualan Biological Co., Ltd.) (Fig. 1). For scheme two DMBA solution or
DMSO (serving as the control) was injected under the ovarian
capsule, and the pinholes were sealed with absorbable fibrin glue
(Fig. 1). For scheme three the ovary
was covered with absorbable gauze loaded with a high concentration
of solid DMBA or absorbable gauze only (serving as the control) and
wrapped with periovarian fat (Fig.
1). An antibiotic (105 units of benzylpenicillin
potassium) was administered intraperitoneally for prophylaxis
against infection before the abdominal wall was closed.
MRI
After anesthesia with 2% pentobarbital sodium at 50
mg/kg, all rats underwent MRI, which was performed as described in
a previous study (18). On MR
images, the tumor configurations were classified into cystic,
cystic-solid and solid according to their gross morphology
(19). The maximum diameter (MMD) of
the tumors and solid components and the thickness of the wall and
septum were measured.
Histopathological analyses
Rats were anesthetized with a single intraperitoneal
injection of 2% sodium pentobarbital (50 mg/kg) and then euthanized
by cervical dislocation. Death was confirmed by checking breathing
and heartbeat. Verification of death was supplemented by
percutaneous cardiac puncture before tissues were collected.
Reproductive system organs and abnormal morphological tissues were
removed. The specimens were cut into 3-µm sections for hematoxylin
and eosin staining by a pathologist (LW, with 18 years of
experience in human and murine gynecological pathology). Staining
steps are as follows. Tissues were immersed in 10% (v/v) neutral
buffered formalin for 48 h at room temperature, then were embedded
in paraffin. Sections were dewaxed at 60°C for 20 min, following
washing with xylene twice, each for 15 min. Sections were hydrated
with 100% absolute ethanol for 2 min, 95% ethanol for 1 min, 80%
ethanol for 1 min, 75% ethanol for 1 min then washed with distilled
water for 2 min. Hematoxylin staining was performed at room
temperature for 5 min and then sections were washed with running
water. Eosin staining was performed at room temperature for 2 min.
The histopathological analysis was performed under a light
microscope with magnification ×200. According to the
histopathological characteristics of the cells, the ovarian tumors
were divided into benign, borderline and malignant (2).
Statistical analyses
Statistical analyses were performed with SPSS
version 22.0 (IBM Corp.). The mortality rate and tumor formation
rate of rats were compared using χ2 for multiple groups,
and the pairwise comparison used the partitions of the
χ2 method. Differences in the MMD of the tumors and
solid components and the thickness of the wall and septum between
the three groups were compared using one-way ANOVA followed by
Fisher's Least Significant Difference post hoc, or Kruskal-Wallis
followed by Dunn's post hoc were used as appropriate. Spearman's
rank correlation analysis was used to evaluate the correlation
between dose, time and tumor differentiation. P<0.05 was
considered to indicate a statistically significant difference.
Fisher's test was performed to compare differences in tumor
configurations between groups. All variables are expressed as the
mean value ± standard deviation, unless otherwise shown.
Results
Mortality rate of rats
The mortality rates of rats in different
experimental groups and the control group are summarized in
Tables I and II. In scheme one, the overall mortality
rate of rats was 72.7% (109/150) in the experimental group and it
was 46.0% (23/50) in the 1.0 mg group. Most dead rats had a
markedly dilated bowel, which was considered intestinal
obstruction. Ovarian and intestinal adhesions were visible in only
a few rats. In the corresponding control group, the mortality rate
was 10.0% (1/10). In scheme two, the overall mortality rate of rats
was 17.6% (28/159) in the experimental group and no rats died
(0/10) in the control group. In scheme three, 123 rats survived,
with a mortality rate of 23.6% (38/161) in the experimental group
(Table II). The mortality rate was
only 14.0% (7/50) for the 1.0 mg group, but it was 34.5% (20/58)
for the 3.0 mg group. Most of the rats died in the late stage of
the experiment. The tumor adhered to the surrounding tissues, and
bloody ascites was found in nine rats. Two rats died in the control
group in scheme three. All the dead rats in the control groups had
a markedly dilated bowel, indicative of intestinal obstruction. As
shown in Table I, the mortality
rates gradually increased in all three experimental groups with
increasing DMBA doses.
 | Table I.Mortality rate of rats in different
7,12-dimethylbenz(a)anthracene-induced schemes. |
Table I.
Mortality rate of rats in different
7,12-dimethylbenz(a)anthracene-induced schemes.
| Scheme 1 dose,
mg | Mortality rate,
n/total (%) | Scheme 2 dose,
mg | Mortality rate,
n/total (%) | Scheme 3 dose,
mg | Mortality rate,
n/total (%) |
|---|
| 1.0 | 23/50
(46.0) | 0.5 | 9/51
(17.6) | 1.0 | 7/50
(14.0) |
| 2.0 | 43/50
(86.0) | 1.0 | 8/53
(15.1) | 2.0 | 11/53 (20.8) |
| 3.0 | 43/50
(86.0) | 1.5 | 11/55 (20.0) | 3.0 | 20/58 (34.5) |
| Total | 109/150 (72.7) | Total | 28/159 (17.6) | Total | 38/161 (23.6) |
| 0a | 1/10
(10.0) | 0a | 0/10
(0.0) | 0 | 2/10
(20.0) |
| Table II.The mortality rate and tumor
formation rate of rats in three schemes. |
Table II.
The mortality rate and tumor
formation rate of rats in three schemes.
| Rate | Scheme one | Scheme Two | Scheme Three | P-value | P1 | P2 | P3 |
|---|
| Mortality rate,
% | 72.7 | 17.6 | 23.6 | <0.0001 | <0.05 | <0.05 | >0.05 |
| Formation rate,
% | 78.0 | 75.6 | 87.8 |
0.0400 | >0.05 | >0.05 | <0.05 |
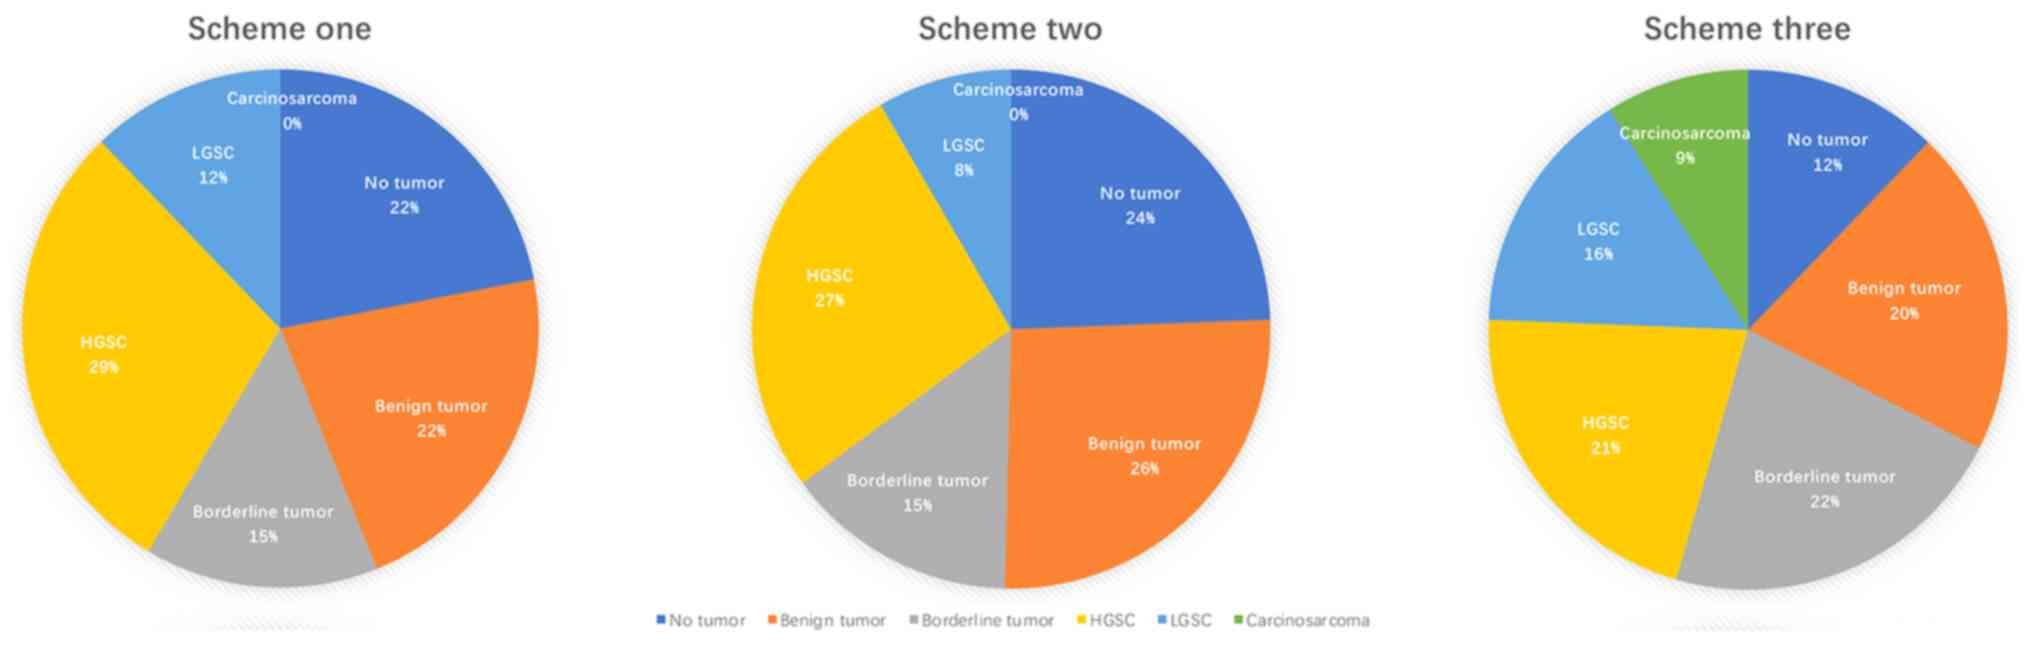
Incidence of ovarian neoplasia and
histopathology results
The incidence of ovarian neoplasia and
histopathology results are listed in Tables II–V.
As shown in scheme one of Tables II
and III, 32/41 rats developed
ovarian tumors, and the overall tumor formation rate was 78.0%
(32/41). There were nine cystadenomas, six borderline tumors and 17
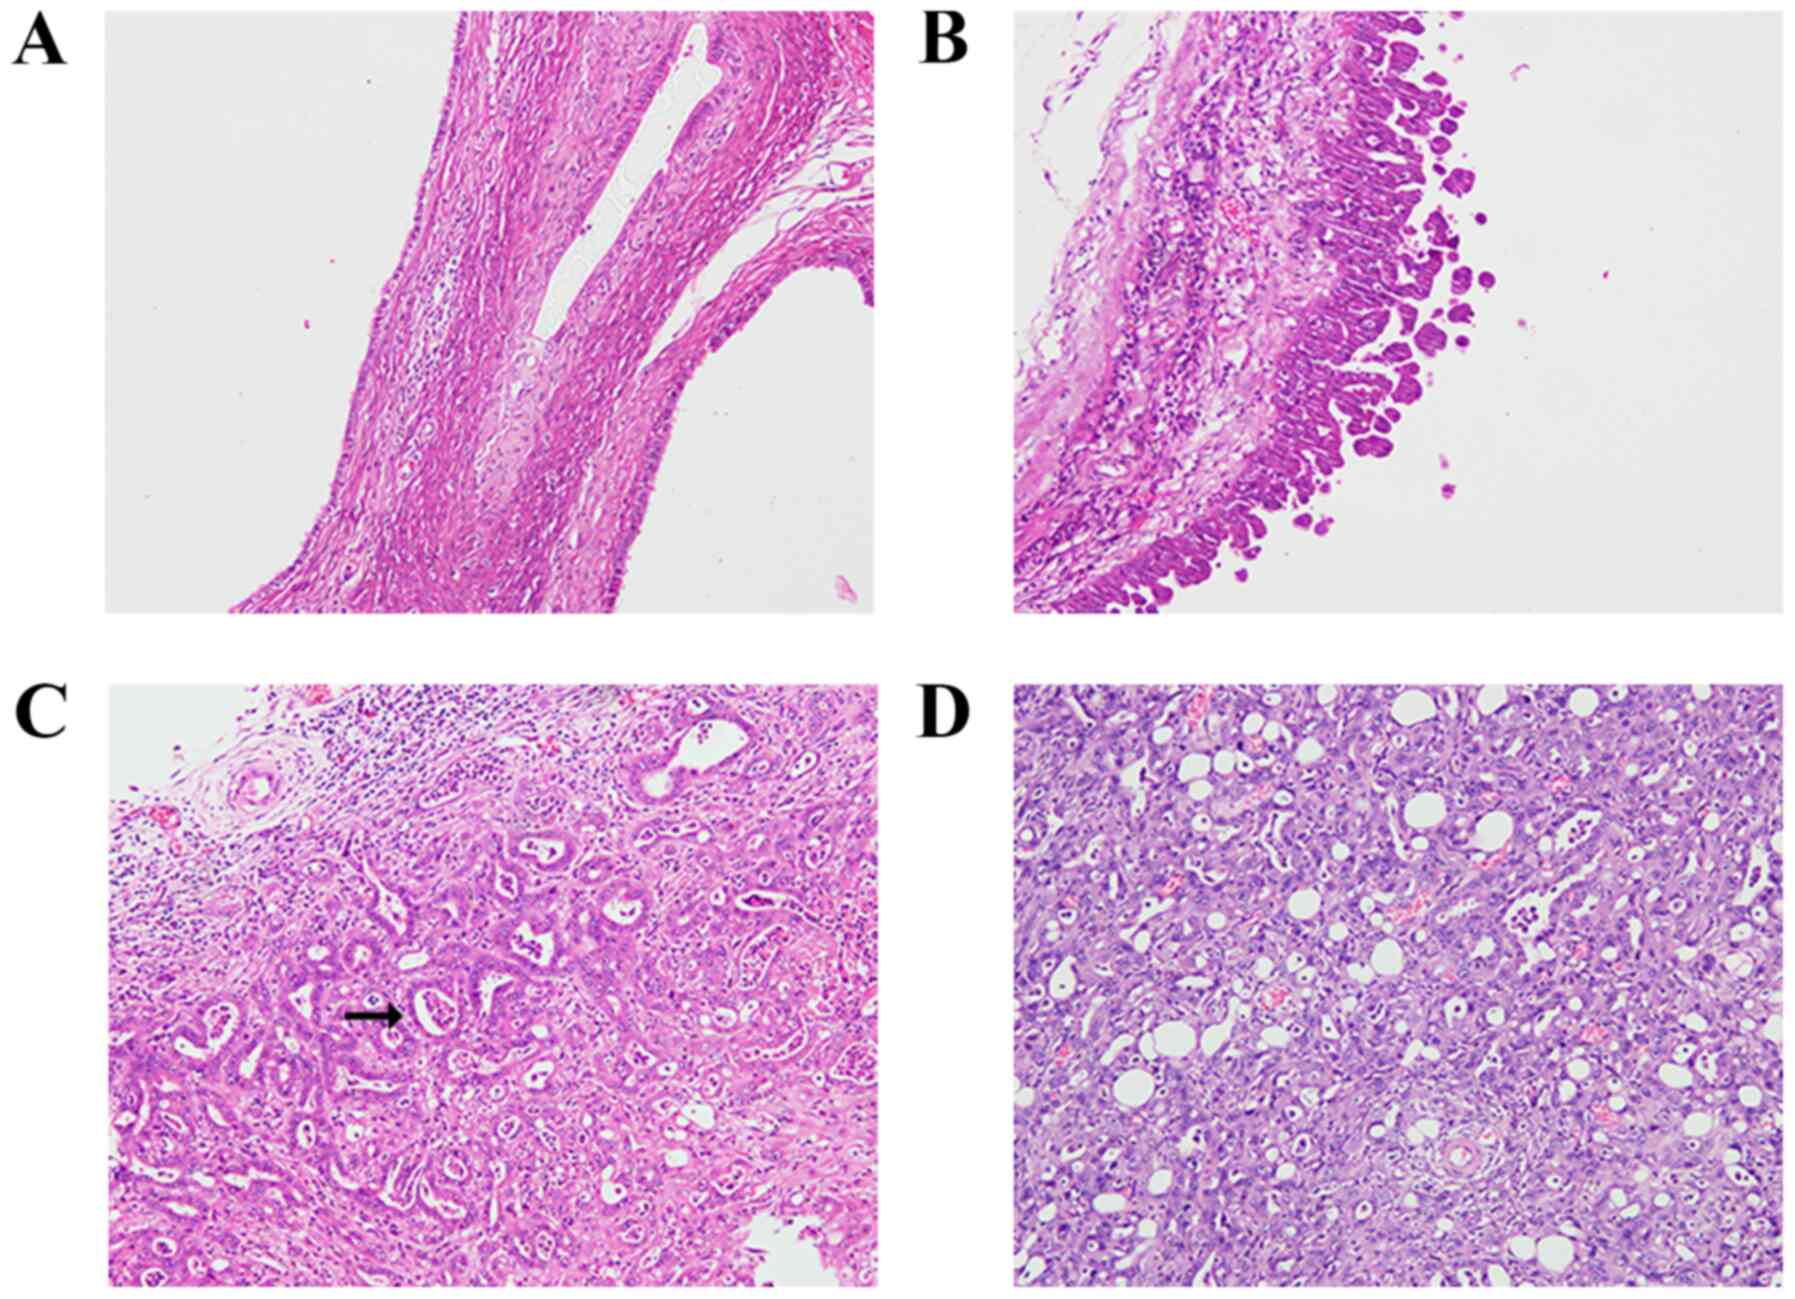
ovarian carcinomas (five LGSC and 12 HGSC) (Figs. 2 and 3), all of which were serous tumors. Both
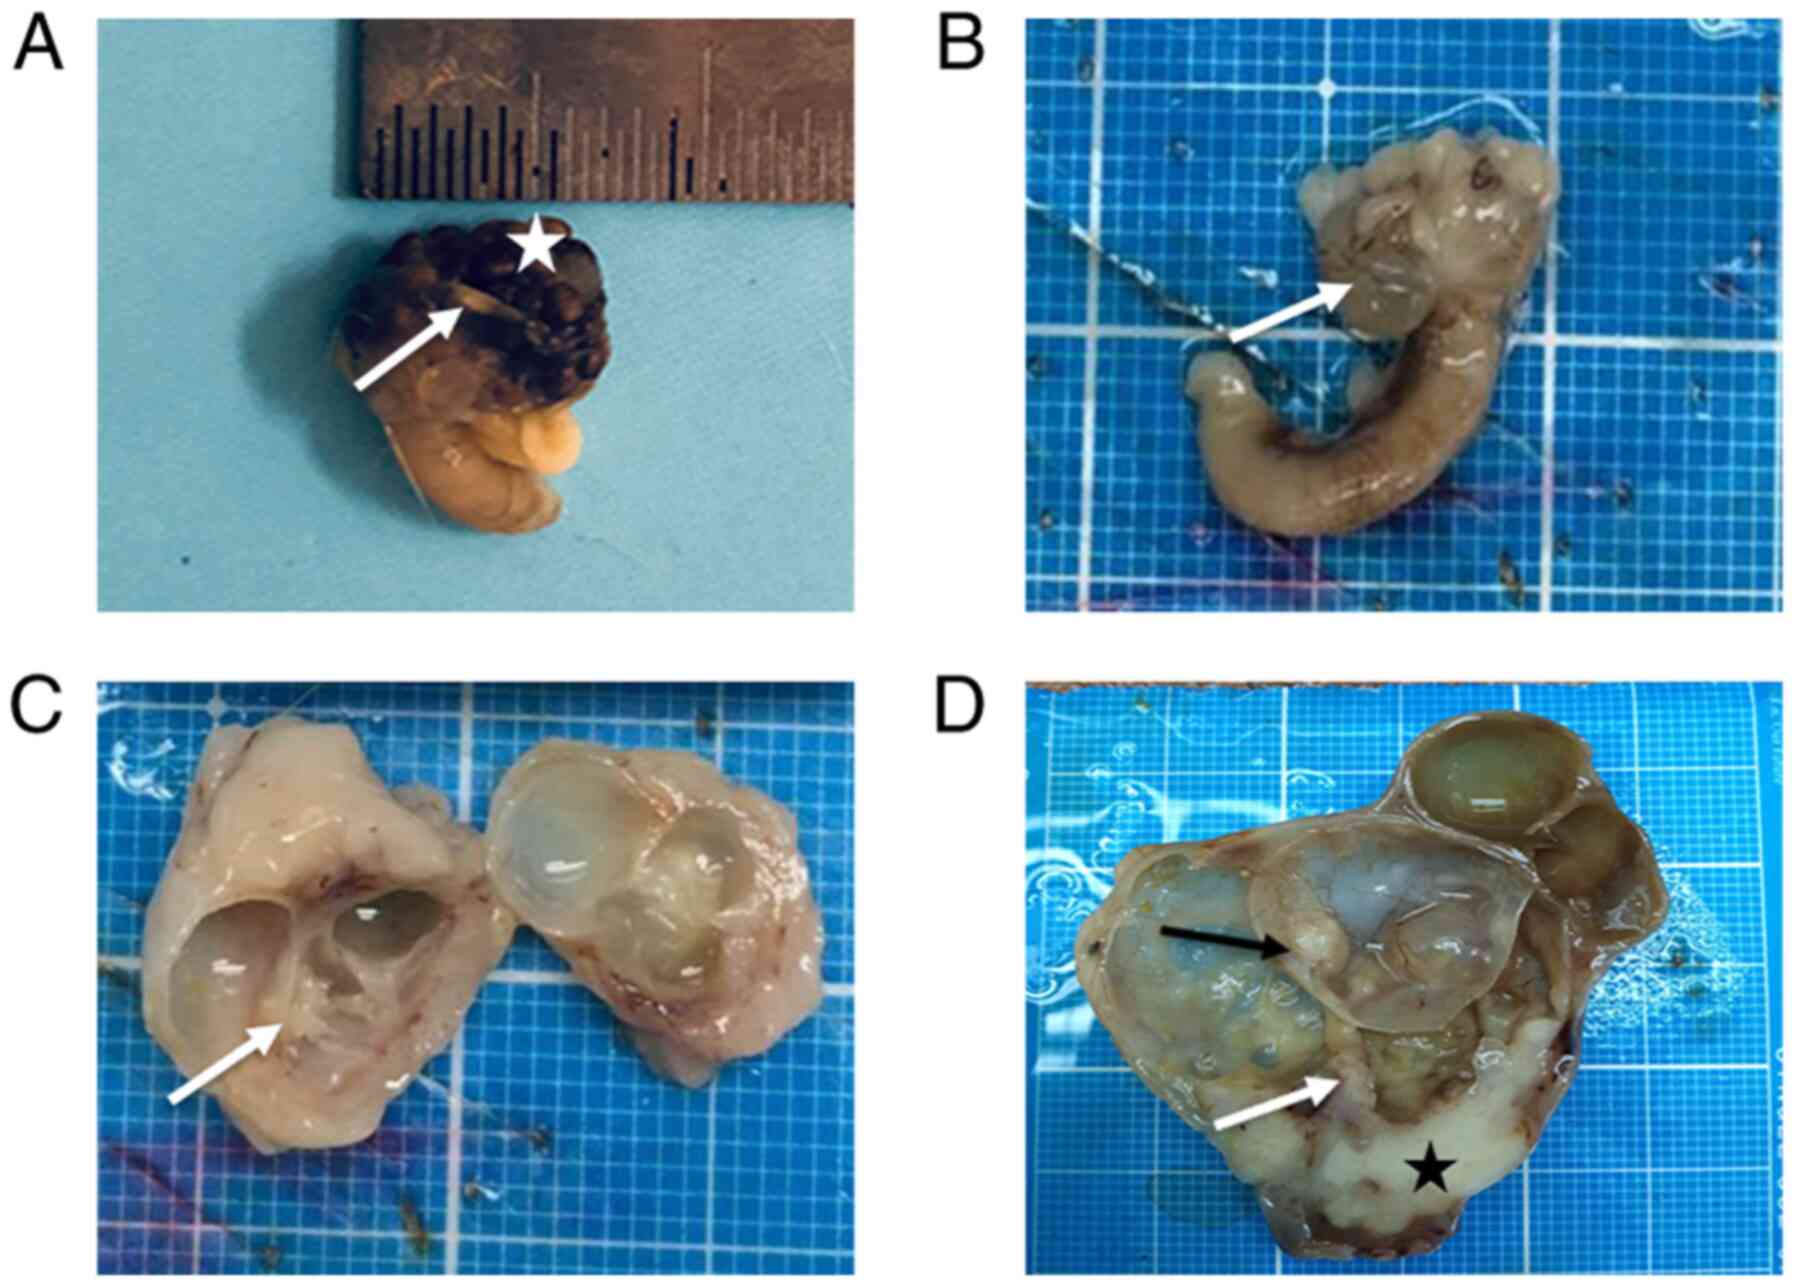
benign and borderline tumors were cystic, and ovarian carcinomas
were cystic (1/17, 5.9%), cystic-solid (14/17, 82.4%) and solid
(2/17, 11.8%) (Fig. 4).
| Table V.Tumor formation rate in different
dose and time groups in scheme three. |
Table V.
Tumor formation rate in different
dose and time groups in scheme three.
| A, 1.0 mg dose |
|---|
|
|---|
| Time, days | Total, n/total
(%) | BT, n/total
(%) | BOT, n/total
(%) | OCA, n/total
(%) | OCS, n/total
(%) |
|---|
| 60 | 3/6
(50.0) | 2/6
(33.3) | 1/6
(16.7) | 0/6
(0.0) | 0/6 (0.0) |
| 90 | 8/10
(80.0) | 3/10
(30.0) | 4/10
(40.0) | 1/10 (10.0) | 0/10 (0.0) |
| 120 | 8/8
(100.0) | 3/8
(37.5) | 3/8
(37.5) | 2/8
(25.0) | 0/8 (100.0) |
| 150 | 9/10
(90.0) | 2/10
(20.0) | 2/10
(20.0) | 5/10 (50.0) | 0/10 (0.0) |
| 180 | 9/9
(100.0) | 1/9
(11.1) | 0/9
(0.0) | 8/9
(88.9) | 0/9 (0.0) |
| Total | 37/43 (86.0) | 11/43 (25.6) | 10/43 (23.3) | 16/43 (37.2) | 0/43 (0.0) |
|
| B, 2.0 mg
dose |
|
| Time,
days | Total, n/total
(%) | BT, n/total
(%) | BOT, n/total
(%) | OCA, n/total
(%) | OCS, n/total
(%) |
|
| 60 | 5/6
(83.3) | 4/6
(66.7) | 0/6
(0.0) | 0/6
(0.0) | 1/6
(16.7) |
| 90 | 8/10
(80.0) | 2/10 (20.0) | 5/10 (50.0) | 1/10 (10.0) | 0/10 (0.0) |
| 120 | 10/10 (100.0) | 1/10 (10.0) | 1/10 (10.0) | 6/10 (60.0) | 2/10 (20.0) |
| 150 | 10/10 (100.0) | 1/10 (10.0) | 0/10 (0.0) | 7/10 (70.0) | 2/10 (20.0) |
| 180 | 6/6
(100.0) | 0/6
(0.0) | 1/6
(16.7) | 4/6
(66.7) | 1/6
(16.7) |
| Total | 39/42 (92.9) | 8/42 (19.0) | 7/42 (16.7) | 18/42 (42.9) | 6/42 (14.3) |
|
| C, 3.0 mg
dose |
|
| Time,
days | Total, n/total
(%) | BT, n/total
(%) | BOT, n/total
(%) | OCA, n/total
(%) | OCS, n/total
(%) |
|
| 60 | 6/6
(100.0) | 3/6
(50.0) | 3/6
(50.0) | 0/6
(0.0) | 0/6
(0.0) |
| 90 | 8/9
(88.9) | 1/9
(11.1) | 3/9
(33.3) | 2/9
(22.2) | 2/9
(22.2) |
| 120 | 6/10 (60.0) | 2/10 (20.0) | 2/10 (20.0) | 1/10 (10.0) | 1/10 (10.0) |
| 150 | 8/9
(88.9) | 0/9
(0.0) | 1/9
(11.1) | 5/9
(55.6) | 2/9
(22.2) |
| 180 | 4/4
(100.0) | 0/4
(0.0) | 1/4
(25.0) | 3/4
(75.0) | 0/4
(0.0) |
| Total | 32/38 (84.2) | 6/38 (15.8) | 10/38 (26.3) | 11/38 (28.9) | 5/38 (13.2) |
|
| D, 0 mg
dose |
|
| Time,
days | Total, n/total
(%) | BT, n/total
(%) | BOT, n/total
(%) | OCA, n/total
(%) | OCS, n/total
(%) |
|
| 180 | 0/8 (0.0) | 0/8 (0.0) | 0/8 (0.0) | 0/8 (0.0) | 0/8 (0.0) |
| Table III.Tumor formation rate in different
dose and time groups in scheme one. |
Table III.
Tumor formation rate in different
dose and time groups in scheme one.
| A, 1.0 mg dose |
|---|
|
|---|
| Time, days | Total, n/total
(%) | BT, n/total
(%) | BOT, n/total
(%) | OCA, n/total
(%) |
|---|
| 60 | 0/2
(0.0) | 0/2 (0.0) | 0/2 (0.0) | 0/2 (0.0) |
| 90 | 1/2
(50.0) | 1/2 (50.0) | 0/2 (0.0) | 0/2 (0.0) |
| 120 | 3/3
(100.0) | 2/3 (66.7) | 0/3 (0.0) | 1/3 (33.3) |
| 150 | 8/10
(80.0) | 2/10 (20.0) | 1/10 (10.0) | 5/10 (50.0) |
| 180 | 8/10
(80.0) | 0/10 (0.0) | 0/10 (0.0) | 8/10 (80.0) |
| Total | 20/27 (74.1) | 5/27 (18.5) | 1/27 (3.7) | 14/27 (51.9) |
|
| B, 2.0 mg
dose |
|
| Time,
days | Total, n/total
(%) | BT, n/total
(%) | BOT, n/total
(%) | OCA, n/total
(%) |
|
| 60 | 0/1 (0.0) | 0/1 (0.0) | 0/1 (0.0) | 0/1 (0.0) |
| 90 | 1/1 (100.0) | 1/1 (100.0) | 0/1 (0.0) | 0/1 (0.0) |
| 120 | 5/5 (100.0) | 1/5 (20.0) | 3/5 (60.0) | 1/5 (20.0) |
| 150 | 0/0 (0.0) | 0/0 (0.0) | 0/0 (0.0) | 0/0 (0.0) |
| 180 | 0/0 (0.0) | 0/0 (0.0) | 0/0 (0.0) | 0/0 (0.0) |
| Total | 6/7 (85.7) | 2/7 (28.6) | 3/7 (42.9) | 1/7 (14.3) |
|
| C, 3.0 mg
dose |
|
| Time,
days | Total, n/total
(%) | BT, n/total
(%) | BOT, n/total
(%) | OCA, n/total
(%) |
|
| 60 | 1/2 (50.0) | 1/2 (50.0) | 0/2 (0.0) | 0/2 (0.0) |
| 90 | 2/2 (100.0) | 1/2 (50.0) | 1/2 (50.0) | 0/2 (0.0) |
| 120 | 3/3 (100.0) | 0/3 (0.0) | 1/3 (33.3) | 2/3 (66.7) |
| 150 | 0/0 (0.0) | 0/0 (0.0) | 0/0 (0.0) | 0/0 (0.0) |
| 180 | 0/0 (0.0) | 0/0 (0.0) | 0/0 (0.0) | 0/0 (0.0) |
| Total | 6/7 (85.7) | 2/7 (28.6) | 2/7 (28.6) | 2/7 (28.6) |
|
| D, 0 mg
dose |
|
| Time,
days | Total, n/total
(%) | BT, n/total
(%) | BOT, n/total
(%) | OCA, n/total
(%) |
|
| 180 | 0/9 (0.0) | 0/9 (0.0) | 0/9 (0.0) | 0/9 (0.0) |
As seen in scheme two of Tables II and IV, the overall tumor formation rate was
75.6% (99/131), which is close to the 0.5 mg group in the
preliminary experiment (75%, 15/20). Of 99 tumors, 34 were benign,
19 were borderline and 46 were ovarian carcinomas (11 LGSC and 35
HGSC) (Figs. 2 and 3); 93 were serous tumors, four were
endometrioid tumors, one was a seromucinous tumor and one was a
mucinous tumor. All benign and borderline tumors were also cystic.
Ovarian carcinomas were cystic (8/46, 17.4%), cystic-solid (21/46,
45.7%) and solid (17/46, 37.0%) (data not shown).
| Table IV.Tumor formation rate in different
dose and time groups in scheme two. |
Table IV.
Tumor formation rate in different
dose and time groups in scheme two.
| A, 0.5 mg dose |
|---|
|
|---|
| Time, days | Total, n/total
(%) | BT, n/total
(%) | BOT, n/total
(%) | OCA, n/total
(%) |
|---|
| 60 | 1/6
(16.7) | 1/6
(16.7) | 0/6 (0.0) | 0/6
(0.0) |
| 90 | 8/10
(80.0) | 6/10
(60.0) | 2/10 (20.0) | 0/10
(0.0) |
| 120a | 4/6
(66.7) | 4/6
(66.7) | 0/6 (0.0) | 0/6
(0.0) |
| 150 | 8/10
(80.0) | 2/10
(20.0) | 1/10 (10.0) | 5/10
(50.0) |
| 180 | 7/10
(70.0) | 2/10
(20.0) | 0/10 (0.0) | 5/10
(50.0) |
| Total | 28/42 (66.7) | 15/42 (35.7) | 3/42 (7.1) | 10/42 (23.8) |
|
| B, 1.0 mg
dose |
|
| Time,
days | Total, n/total
(%) | BT, n/total
(%) | BOT, n/total
(%) | OCA, n/total
(%) |
|
| 60 | 2/7
(28.6) | 1/7
(14.3) | 1/7
(14.3) | 0/7
(0.0) |
| 90 | 8/10
(80.0) | 4/10
(40.0) | 3/10
(30.0) | 1/10
(10.0) |
| 120a | 5/10
(50.0) | 2/10 (20.0) | 1/10 (10.0) | 2/10
(20.0) |
| 150 | 8/8
(100.0) | 1/8
(12.5) | 1/8
(12.5) | 6/8
(75.0) |
| 180 | 10/10 (100.0) | 3/10
(30.0) | 0/10
(0.0) | 7/10
(70.0) |
| Total | 33/45
(73.3) | 11/45 (24.4) | 6/45
(13.3) | 16/45 (35.6) |
|
| C, 1.5 mg
doseb |
|
| Time,
days | Total, n/total
(%) | BT, n/total
(%) | BOT, n/total
(%) | OCA, n/total
(%) |
|
| 60 | 6/6
(100.0) | 2/6 (33.3) | 4/6
(66.7) | 0/6
(0.0) |
| 90 | 7/8
(87.5) | 2/8 (25.0) | 2/8
(25.0) | 3/8
(37.5) |
| 120a | 10/10 (100.0) | 2/10 (20.0) | 3/10
(30.0) | 5/10
(50.0) |
| 150 | 8/10
(80.0) | 2/10 (20.0) | 1/10
(10.0) | 5/10
(50.0) |
| 180 | 7/10
(70.0) | 0/10 (0.0) | 0/10
(0.0) | 7/10
(70.0) |
| Total | 38/44 (86.4) | 8/44 (18.2) | 10/44 (22.7) | 20/44 (45.5) |
|
| D, 0 mg
dose |
|
| Time,
days | Total, n/total
(%) | BT, n/total
(%) | BOT, n/total
(%) | OCA, n/total
(%) |
|
| 180 | 0/10 (0.0) | 0/10 (0.0) | 0/10 (0.0) | 0/10 (0.0) |
As seen in scheme three of Tables II and V, 108/123 rats developed ovarian tumors,
with an overall tumor formation rate of 87.8%. There were 25 benign
tumors, 27 borderline tumors, 45 ovarian carcinomas (19 LGSC and 26
HGSC) and 11 carcinosarcomas (Figs.
2 and 3); 96 were serous tumors,
one was a mucinous tumor and 11 were carcinosarcomas. No
carcinosarcomas were found in the 1 mg group, while six and five
carcinosarcomas were observed in the 2 and 3 mg groups,
respectively (Table V). All 25
benign tumors were cystic tumors; 27 borderline tumors were 20
cystic, one cystic-solid and 6 solid; and 56 malignant tumors were
22 cystic, 21 cystic-solid and 12 solid (data not shown).
As seen in each experimental group (Tables III–V), the tumor formation rate gradually
increased with prolonged DMBA exposure time. No tumor formation was
observed in the control group. This experiment showed that the
purse string suture and absorbable gauze affected the early
observation of rat ovary. The sutures and the absorbable gauze were
completely absorbed in two months and no inflammatory granuloma was
seen in the ovaries and tumors.
The histological grades of induced tumors at
different doses and time points are also shown in Tables III–V. Ovarian tumor differentiation positively
correlated with the dose and induction time in scheme two (ρ=0.523,
P=0.022; ρ=0.506, P=0.001, respectively). The tumor formation rate
and the proportion of malignant tumor gradually increased in all
three experimental groups with increasing DMBA doses and induction
time.
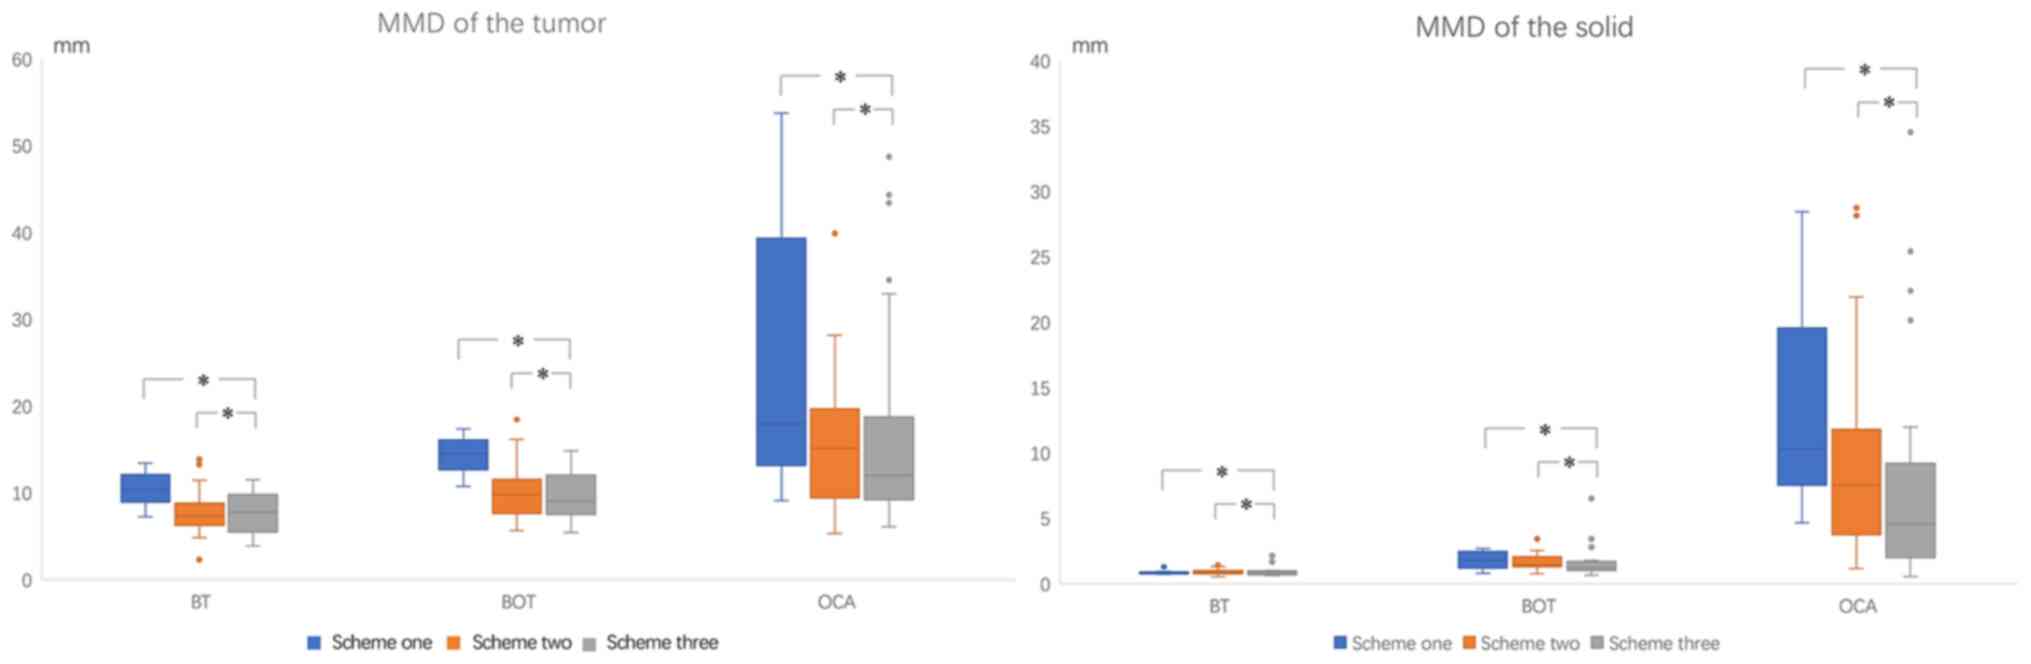
Sizes of tumors and solid components
on MR imaging
The MMD of the tumors and solid components are shown
in Tables VI and VII and Fig.
5. As seen in Table VI and
Fig. 5, the MMD of benign,
borderline and malignant tumors were 10.40±1.99, 14.35±2.29 and
24.98±14.80 mm, respectively, in scheme one (P=0.005 and 0.038 for
benign and borderline vs. malignant, respectively); 7.86±2.48,
10.29±3.41 and 15.19±7.10 mm, respectively, in scheme two
(P<0.0001 and P=0.001 for benign and borderline vs. malignant,
respectively); and 7.91±2.30, 9.50±2.59 and 15.67±10.10 mm,
respectively, in scheme three (P<0.0001 and P=0.002 for benign
and borderline vs. malignant, respectively).
| Table VI.MMD comparisons of different grade
tumors in the three schemes. |
Table VI.
MMD comparisons of different grade
tumors in the three schemes.
|
| MMD, mm |
|
|
|
|
|---|
|
|
|
|
|
|
|
|---|
| Scheme | BT | BOT | OCA | P-value | P1 | P2 | P3 |
|---|
| 1 | 10.40±1.99 | 14.35±2.29 | 24.98±14.80 |
0.0120 | 0.526 |
0.0050 | 0.038 |
| 2 |
7.86±2.48 | 10.29±3.41 | 15.19±7.10 | <0.0001 | 0.093 | <0.0001 | 0.001 |
| 3 |
7.91±2.30 |
9.50±2.59 | 15.67±10.10 | <0.0001 | 0.498 | <0.0001 | 0.002 |
| Table VII.MMD comparisons of the solid
components of different grade tumors in the three schemes. |
Table VII.
MMD comparisons of the solid
components of different grade tumors in the three schemes.
|
| MMD, mm |
|
|
|
|
|---|
|
|
|
|
|
|
|
|---|
| Scheme | BT | BOT | OCA | P-value | P1 | P2 | P3 |
|---|
| 1 | 0.88±0.18 | 1.81±0.75 | 13.02±7.66 | <0.0001 | 0.773 | <0.0001 | <0.0001 |
| 2 | 0.89±0.19 | 1.64±0.62 |
8.86±6.89 | <0.0001 | 0.557 | <0.0001 | <0.0001 |
| 3 | 0.92±0.36 | 1.73±1.33 |
7.14±7.71 | <0.0001 | 0.646 | <0.0001 | <0.0001 |
As shown in Table
VII and Fig. 5, the MMD of the
solid components in benign, borderline and malignant tumors were
0.88±0.18, 1.81±0.75 and 13.02±7.66 mm, respectively, in scheme
one; 0.89±0.19, 1.64±0.62 and 8.86±6.89 mm, respectively, in scheme
two; and 0.92±0.36, 1.73±1.33 and 7.14±7.71 mm, respectively, in
scheme three. All P<0.0001 for benign and borderline vs.
malignant in the three schemes. The ovarian tumors induced by this
experiment were larger, which are conducive to further research.
There was an association between the content of solid components
and the degree of malignancy.
Discussion
A previous study demonstrated that DMBA can induce
point mutations that alter the expression of oncogenes and tumor
suppressor genes to cause rat ovarian carcinomas (14), which destroy oocytes or early primary
follicles, causing pathological changes in the ovaries, and
gradually forming tumors (15).
Stewart et al (14) induced
ovarian tumor formation by encapsulating the ovarian surface with a
high concentration of solid DMBA, but the DMBA carrier was a
non-absorbable material, which can produce inflammatory granuloma
and affect the morphology of the tumors. Therefore, the present
study used absorbable gauze as a carrier or a subcapsular injection
of a carcinogen to eliminate a foreign body reaction. The
experiment showed that the absorbable gauze was completely absorbed
in two months, and no obvious inflammatory granuloma was
observed.
The mortality rate of the 1.0 mg group was 46.0%
(23/50), but the overall mortality rate was as high as 72.7%
(109/150) in scheme one. Most rats died of an intestinal
obstruction. The reason for this result might be due to the
penetrating ability of DMSO and the loose structure of fat.
Carcinogenic DMBA can permeate through the periovary fat, stimulate
the intestinal tract and cause intestinal dysfunction (20). In addition, when there is not much
fat around the ovary, the sealing effect is poor, and DMBA can leak
into the abdominal cavity.
Considering the high mortality rate and possible
DMBA leakage in scheme one, we chose to inject DMBA solution under
the ovarian capsule in scheme two. The relatively intact and dense
ovarian capsule prevented DMBA leakage. The overall mortality rate
of rats was only 17.6% (28/159), which was markedly improved
compared with that of scheme one.
A previous study used DMBA-loaded non-absorbable
cloth to induce ovarian tumors, and the mortality rate of rats was
low (14). To avoid inflammatory
granulomas, absorbable gauze was used to carry the
melted-to-congealed DMBA in scheme three. The overall mortality
rate of rats was 23.6% (38/161), which was lower compared with that
of scheme one but higher compared with that of scheme two. With
increasing doses, the mortality rates gradually increased. The
mortality rate was only 14.0% (7/50) for the 1.0 mg group and 34.5%
(20/58) for the 3.0 mg group. The rats died at the late stage of
the tumor. In this scheme, the tumor formation time was less, and
ovarian cancer was more common at three months after induction.
Among the three schemes, the overall tumor formation
rate was the highest (87.7%, 108/123) in scheme three, followed by
scheme one (78.0%, 32/41) and scheme two (75.6%, 99/131). The
higher DMBA content per unit area of absorbable gauze might explain
the different results. The explanation for the slightly lower
overall tumor formation rate in scheme two might be that the lower
DMBA dose and pinhole leakage led to an insufficient DMBA dose for
some rats to form an ovarian tumor. Ovarian carcinosarcomas were
induced in scheme three. The high concentration of DMBA might be
responsible for the formation of ovarian carcinosarcoma, which is a
type of rare ovarian cancer that has not been studied, to the best
of our knowledge. Therefore, this model induced by scheme three
could be used for investigating carcinosarcoma.
Oncogenesis was not observed in some rats regardless
of the scheme used, consistent with previous studies (13,14). At
present, there are a few explanations for this phenomenon of the
absence of oncogenesis. One theory considers that differences in
the times at which DMBA is applied during the ovarian cycle affects
the tumor formation rate, but the drug induction time is generally
much longer compared with the ovarian cycle time (21). Therefore, this theory has not been
widely accepted. Although the carcinogen used in the present
experimental model was in contact mainly with the ovary, it might
have leaked from pinhole, or been absorbed by the surrounding
tissues other than the ovary or carried away from the blood, which
resulted in no tumor formation.
Serous tumors accounted for 93.9 and 88.9% of
induced tumors in schemes two and three, respectively. Benign,
borderline and malignant tumors were observed in all three schemes,
and the main types of malignant tumors were LGSC and HGSC. Since
LGSC is a rare and understudied ovarian cancer type, this model
would be useful for studying LGSC. In our previous study,
DMBA-induced serous tumors were tested for P53 and cyclin D1 and
showed positive for P53 and cyclin D1 (18). Mutations in KRAS and BRAF genes cause
continuous expression of cyclin D1 protein that is mainly expressed
in serous borderline ovarian tumors and LGSC (22,23).
TP53 mutation is much more common in HGSC compared with in LGSC
(14).
All benign tumors were cystic tumors, and both
borderline and malignant tumors were cystic, cystic-solid and
solid. The more solid components the tumor had, the more likely the
tumor was to be malignant. A previous study reported that only a
small number of serous benign tumors (1.3%) could form a single
small papilla (24), while most
serous borderline ovarian tumors had papillae, solid components or
were completely solid (25). Li
et al (25) showed that the
MMD of the solid components was significantly smaller in borderline
tumors compared with in ovarian carcinomas. Similar results were
obtained in the current study.
Both the DMBA dose and exposure time were positively
correlated with ovarian tumor differentiation. Within a certain
range, over time and with an increasing dose, the incidence and
malignancy of ovarian tumors gradually increased. With an
increasing DMBA exposure time, ovarian tumors underwent a gradual
oncogenesis process, from benign to borderline to early ovarian
carcinomas and advanced ovarian carcinomas, consistent with the
occurrence and development of clinical ovarian tumors (26).
The MMD of the tumor and solid components were
significantly different between benign and malignant and between
borderline and malignant ovarian tumors but not between benign and
borderline tumors. The higher the degree of malignancy was, the
larger the tumor and solid components were, consistent with the
results of a former clinical study (25). The morphological manifestations of
the induced rat ovarian tumors, including shape, configuration,
thickened cyst wall and septal, wall nodule and solid component,
were similar to those of human ovarian tumors (25,27,28). The
MMD of borderline and malignant tumors were 10.29 and 15.19 mm in
scheme two and 9.50 and 15.67 mm in scheme three, respectively. The
tumors induced by these two schemes were larger compared with those
reported in the previous study (14), making the present model favorable for
an imaging investigation.
The rat ovarian tumors formed in the three schemes
were similar to human ovarian tumors in terms of gross morphology,
histological type, pathological appearance, configuration,
proportion of various tumors and tumor progression. Each scheme was
successful in reducing the foreign body reaction.
Since scheme one had a mortality rate of up to 72.7%
(109/150), it was not an optimal animal model. The overall
mortality rate and tumor formation rate of the rats were 17.6%
(28/159) and 75.6% (99/131) in scheme two and 23.6% (38/161) and
87.8% (108/123) in scheme three, respectively. Although the tumor
formation rate was higher in scheme three compared with in scheme
two, the purse string suture of the ovary and absorbable gauze
disturbed the early imaging display of the rat ovary. By
comparison, the ovarian subcapsular injection of DMBA in scheme two
did not affect the early imaging display of the ovary, and MRI
could serially demonstrate the gradual decrease in the ovarian
parenchyma, the formation of cystic foci and the progressive
increase in solid components. The tumor formation rate in the 0.5
mg group was 66.7% (28/42), which was relatively lower compared
with the expected rate (75%, 15/20). The mortality rate and tumor
formation rate were 15.1% (8/53) and 73.3% (33/45) in the 1.0 mg
group and 20.0% (11/55) and 86.4% (38/44) in the 1.5 mg group,
respectively. Considering the higher tumor formation rate and the
shorter time needed for tumor formation, the optimal dose of scheme
two was 1.5 mg. Tanaka et al (29,30)
performed subcapsular injection of 0.01 ml olive oil with 0.5%
dissolved DMBA and induced the adenocarcinoma in 35–45% rats after
51 weeks. Liu et al (31)
injected 0.05 ml DMBA (4 mg/ml) and reached an ovarian tumor
formation rate of 77.8% after 20 weeks. Therefore, the tumor
formation time of the 1.5 mg group in scheme two was significantly
shorter and tumor formation rate was significantly higher in our
scheme two model compared with that reported in previous studies
(29–31). Furthermore, borderline ovarian tumors
appeared in four out of six rats (66.7%) after 60 days of DMBA
exposure, ovarian carcinomas occurred in three out of eight rats
(37.5%) after 90 days and in seven out of 10 rats (70%) after 180
days, and no ovarian carcinosarcomas were found at any time point.
This optimal animal model showed the tumor's development process
from benign to borderline to malignant successfully in a relatively
short period of time. The tumor was relative larger and had similar
morphology as human ovarian tumors, suitable for imaging studies of
tumor's oncogenesis, development and early detection.
The present study had some limitations. First, the
small sample sizes of different time groups might have led to
deviations in the research results. Second, a dynamic observation
of the whole oncogenic process, such as tumor occurrence,
development and metastasis, was not performed. Third, the
corresponding gene changes in different histopathological subtypes
and differentiation stages were not investigated. In the future,
the sample size of different time groups should be increased. In
addition, the best time point for the formation of borderline
tumors, early and late malignant tumors should be explored.
Multi-omics studies on different histopathological subtypes may
improve our understanding of the mechanisms underlying the
formation and development mechanism of ovarian tumors.
Overall, the ovarian subcapsular injection of 1.5 mg
DMBA was the best scheme for the rat ovarian tumor model. This
model had a high tumor formation rate. The induced ovarian tumors
were large and similar to human ovarian tumors in terms of their
gross morphology, histological type, pathological appearance,
proportion of various tumors and tumor progression. Therefore, the
present rat model is ideal for investigating the occurrence,
development and imaging of ovarian tumors.
Acknowledgements
Not applicable.
Funding
This work was supported by The National Natural
Science Foundation of P.R. China (grant nos. 81471628 and
81971579), The Shanghai Municipal Commission of Science and
Technology (grant no. 19411972000) and The Shanghai Municipal
Health Commission (grant no. ZK2019B01).
Availability of data and materials
The datasets used and/or analyzed during the current
study are available from the corresponding author on reasonable
request.
Authors' contributions
XYY performed the majority of the experiments. YL
and SQC were responsible for experimental guidance. LW performed
pathological analysis. XYY performed the statistical analysis and
interpreted the results. XYY and JWQ wrote the manuscript with
helpful comments from SQC and YL. SQC, YL, LW and JWQ conceived and
designed the project and helped analyze and interpret the results.
All authors read and approved the final manuscript.
Ethics approval and consent to
participate
The study was approved by The Institutional Review
Board of Jinshan Hospital, Fudan University (Shanghai, China;
approval no. 2020-A019-01), and all procedures involving animal
studies were in accordance with the Guide for the Care and Use of
Laboratory Animals of the National Science and Technology Committee
of China.
Patient consent for publication
Not applicable.
Competing interests
The authors declare that they have no competing
interests.
References
|
1
|
Bray F, Ferlay J, Soerjomataram I, Siegel
RL, Torre LA and Jemal A: Global cancer statistics 2018: GLOBOCAN
estimates of incidence and mortality worldwide for 36 cancers in
185 countries. CA Cancer J Clini. 68:394–424. 2018. View Article : Google Scholar
|
|
2
|
Kurman RJ, Carcangiu ML, Herrington CS and
Yong RH: WHO Classification of Tumours of Female Reproductive
Organs. 6. 4th edition. Lyon: IARC Press, Lyon; pp. pp3072014
|
|
3
|
Prat J: Ovarian carcinomas: Five distinct
diseases with different origins, genetic alterations, and
clinicopathological features. Virchows Arch. 460:237–249. 2012.
View Article : Google Scholar : PubMed/NCBI
|
|
4
|
Malpica A, Deavers MT, Tornos C, Kurman
RJ, Soslow R, Seidman JD, Munsell MF, Gaertner E, Frishberg D and
Silva EG: Interobserver and intraobserver variability of a two-tier
system for grading ovarian serous carcinoma. Am J Surg Pathol.
31:1168–1174. 2007. View Article : Google Scholar : PubMed/NCBI
|
|
5
|
Shih IeM and Kurman RJ: Ovarian
tumorigenesis: A proposed model based on morphological and
molecular genetic analysis. Am J Pathol. 164:1511–1518. 2004.
View Article : Google Scholar : PubMed/NCBI
|
|
6
|
Marinaş MC, Mogoş G, Ciurea R and Mogoş
DG: EGFR, HER2/neu and Ki67 immunoexpression in serous ovarian
tumors. Rom J Morphol Embryol. 53:563–567. 2012.PubMed/NCBI
|
|
7
|
Sieben NL, Macropoulos P, Roemen GM,
Kolkman-Uljee SM, Jan Fleuren G, Houmadi R, Diss T, Warren B, Al
Adnani M, De Goeij AP, et al: In ovarian neoplasms, BRAF, but not
KRAS, mutations are restricted to low-grade serous tumors. J
Pathol. 202:336–340. 2004. View Article : Google Scholar : PubMed/NCBI
|
|
8
|
Singer G, Stohr R, Cope L, Dehari R,
Hartmann A, Cao DF, Wang TL, Kurman RJ and Shih IeM: Patterns of
p53 mutations separate ovarian serous borderline tumors and low-
and high-grade carcinomas and provide support for a new model of
ovarian carcinogenesis: A mutational analysis with
immunohistochemical correlation. Am J Surg Pathol. 29:218–224.
2005. View Article : Google Scholar : PubMed/NCBI
|
|
9
|
Siegel RL, Miller KD and Jemal A: Cancer
statistics, 2019. CA Cancer J Clin. 69:7–34. 2019. View Article : Google Scholar : PubMed/NCBI
|
|
10
|
Irodi A, Rye T, Herbert K, Churchman M,
Bartos C, Mackean M, Nussey F, Herrington CS, Gourley C and Hollis
RL: Patterns of clinicopathological features and outcome in
epithelial ovarian cancer patients: 35 years of prospectively
collected data. BJOG. 127:1409–1420. 2020. View Article : Google Scholar : PubMed/NCBI
|
|
11
|
Stewart C, Ralyea C and Lockwood S:
Ovarian cancer: An integrated review. Semin Oncol Nurs. 35:151–156.
2019. View Article : Google Scholar : PubMed/NCBI
|
|
12
|
Stakleff KD and Von Gruenigen VE: Rodent
models for ovarian cancer research. Int J Gynecol Cancer.
13:405–412. 2003. View Article : Google Scholar : PubMed/NCBI
|
|
13
|
Hoyer PB, Davis JR, Bedrnicek JB, Marion
SL, Christian PJ, Barton JK and Brewer MA: Ovarian neoplasm
development by 7,12-dimethylbenz(a)anthracene (DMBA) in a
chemically-induced rat model of ovarian failure. Gynecol Oncol.
112:610–615. 2009. View Article : Google Scholar : PubMed/NCBI
|
|
14
|
Stewart SL, Querec TD, Ochman AR, Gruver
BN, Bao R, Babb JS, Wong TS, Koutroukides T, Pinnola AD,
Klein-Szanto A, et al: Characterization of a carcinogenesis rat
model of ovarian preneoplasia and neoplasia. Cancer Res.
64:8177–8183. 2004. View Article : Google Scholar : PubMed/NCBI
|
|
15
|
Krarup T: Oocyte destruction and ovarian
tumorgenesis after direct application of a chemical carcinogen
(9:10-dimethyl-1:2-benzanthrene) to the mouse ovary. Int J Cancer.
4:61–75. 1969. View Article : Google Scholar : PubMed/NCBI
|
|
16
|
Kuwahara I: Experimental induction of
ovarian tumors in mice treated with single administration of
7,12-dimethylbenz(a)anthracene, and its histopathological
observation. Gan. 58:253–266. 1967.PubMed/NCBI
|
|
17
|
Huang Y, Jiang W, Wang Y, Zheng Y, Cong Q
and Xu C: Enhanced efficacy and specificity of epithelial ovarian
carcinogenesis by embedding a DMBA-coated cloth strip in the ovary
of rat. J Ovarian Res. 5:212012. View Article : Google Scholar : PubMed/NCBI
|
|
18
|
Cai SQ, Li Y, Li YA, Wang L, Zhu J, Zhao
SH, Li X and Qiang JW: A rat model of serous borderline ovarian
tumors induced by 7,12-dimethylbenz(a)anthracene. Exp Anim.
68:257–265. 2019. View Article : Google Scholar : PubMed/NCBI
|
|
19
|
Tanaka YO, Okada S, Satoh T, Matsumoto K,
Oki A, Saida T, Yoshikawa H and Minami M: Differentiation of
epithelial ovarian cancer subtypes by use of imaging and clinical
data: A detailed analysis. Cancer Imaging. 16:32016. View Article : Google Scholar : PubMed/NCBI
|
|
20
|
Xue M, Ji X, Liang H, Liu Y, Wang B, Sun L
and Li W: The effect of fucoidan on intestinal flora and intestinal
barrier function in rats with breast cancer. Food Funct.
9:1214–1223. 2018. View Article : Google Scholar : PubMed/NCBI
|
|
21
|
Nishida T, Sugiyama T, Kataoka A, Ushijima
K and Yakushiji M: Histologic characterization of rat ovarian
carcinoma induced by intraovarian insertion of a
7,12-dimethylbenz(a)anthracene-coated suture: Common epithelial
tumors of the ovary in rats? Cancer. 83:965–970. 1998. View Article : Google Scholar : PubMed/NCBI
|
|
22
|
Rosenkrantz AB, Sigmund EE, Winnick A,
Niver BE, Spieler B, Morgan GR and Hajdu CH: Assessment of
hepatocellular carcinoma using apparent diffusion coefficient and
diffusion kurtosis indices: Preliminary experience in fresh liver
explants. Magn Reson Imaging. 30:1534–1540. 2012. View Article : Google Scholar : PubMed/NCBI
|
|
23
|
Mori N, Ota H, Mugikura S, Takasawa C,
Ishida T, Watanabe G, Tada H, Watanabe M, Takase K and Takahashi S:
Luminal-type breast cancer: Correlation of apparent diffusion
coefficients with the Ki-67 labeling index. Radiology. 274:66–73.
2015. View Article : Google Scholar : PubMed/NCBI
|
|
24
|
Seidman JD and Mehrotra A: Benign ovarian
serous tumors: A re-evaluation and proposed reclassification of
serous ‘cystadenomas’ and ‘cystadenofibromas’. Gynecol Oncol.
96:395–401. 2005. View Article : Google Scholar : PubMed/NCBI
|
|
25
|
Li YA, Qiang JW, Ma FH, Li HM and Zhao SH:
MRI features and score for differentiating borderline from
malignant epithelial ovarian tumors. Eur J Radiol. 98:136–142.
2018. View Article : Google Scholar : PubMed/NCBI
|
|
26
|
Chui MH, Xing D, Zeppernick F, Wang ZQ,
Hannibal CG, Frederiksen K, Kjaer SK, Cope L, Kurman RJ, Shih IM,
et al: Clinicopathologic and molecular features of paired cases of
metachronous ovarian serous borderline tumor and subsequent serous
carcinoma. Am J Surg Pathol. 43:1462–1472. 2019. View Article : Google Scholar : PubMed/NCBI
|
|
27
|
Zhao SH, Qiang JW, Zhang GF, Boyko OB,
Wang SJ, Cai SQ and Wang L: MRI appearances of ovarian serous
borderline tumor: Pathological correlation. J Magn Reson Imaging.
40:151–156. 2014. View Article : Google Scholar : PubMed/NCBI
|
|
28
|
Zhao SH, Qiang JW, Zhang GF, Wang SJ, Qiu
HY and Wang L: MRI in differentiating ovarian borderline from
benign mucinous cystadenoma: Pathological correlation. J Magn Reson
Imaging. 39:162–166. 2014. View Article : Google Scholar : PubMed/NCBI
|
|
29
|
Tanaka T, Kohno H, Tanino M and Yanaida Y:
Inhibitory effects of estrogenic compounds, 4-nonylphenol and
genistein, on 7,12-dimethylbenz(a)anthracene-induced ovarian
carcinogenesis in rats. Ecotoxicol Environ Saf. 52:38–45. 2002.
View Article : Google Scholar : PubMed/NCBI
|
|
30
|
Tanaka T, Kohno H, Suzuki R and Sugie S:
Lack of modifying effects of an estrogenic compound atrazine on
7,12-dimethylbenz(a)anthracene-induced ovarian carcinogenesis in
rats. Cancer Lett. 210:129–137. 2004. View Article : Google Scholar : PubMed/NCBI
|
|
31
|
Liu L, Hu Z, Zhang H, Hou Y, Zhang Z, Zhou
G and Li B: Vitamin D postpones the progression of epithelial
ovarian cancer induced by 7, 12-dimethylbenz(a)anthracene both in
vitro and in vivo. Onco Targets Ther. 9:2365–2375. 2016. View Article : Google Scholar : PubMed/NCBI
|