Introduction
T cell acute lymphoblastic leukemia (T-ALL) is a
highly aggressive hematological cancer caused by the malignant
transformation of T cell progenitor cells. T-ALL accounts for
10–15% and 20–25% of pediatric and adult ALL cases, respectively
(1). Compared with B cell ALL, T-ALL
has lower event-free survival (EFS) and 5-year overall survival
(OS) rate (2), as well as a higher
recurrence rate, incidence of chemotherapeutic resistance and a
poorer prognosis (3). At present,
the therapeutic outcomes of T-ALL remain unsatisfactory, and ~20%
of patients experience recurrence after chemotherapy (4). Therefore, novel combination
chemotherapeutic or targeted drug regimens are required to improve
therapeutic effects and reduce the rates of drug resistance
(5).
The PI3K/AKT/mTOR pathway is closely associated with
the occurrence, proliferation and metastasis of blood cancer and
other malignant tumors (6,7). Abnormal activation of the PI3K/AKT/mTOR
pathway is a common feature of cancer, characterizing T-ALL
diseases and often leading to the malignant transformation of T
cells (8). Phosphate and tension
homology (PTEN) is a tumor suppressor gene that can prevent the
proliferation of cancer cells and promotes apoptosis by
dephosphorylating phosphatidylinositol (3–5)-trisphosphate (PIP3) to
phosphatidylinositol (4,5)-bisphosphate (PIP2). This thereby
inhibits the activation of the PI3K/AKT/mTOR pathway (9). The PTEN gene is deleted or weakly
expressed in leukemia, which was found to be associated with
promoter methylation (9).
Furthermore, downregulation of PTEN expression leads to continuous
activation of the PI3K/AKT signaling pathway (10,11).
In the epigenetic regulation of ALL cells, key
microRNAs (miRs), including miR-21, −22, −93-a and −221, activate
the PI3K/AKT/mTOR signaling pathway through PTEN inhibition, thus
affecting the migration activity of ALL cancer cells, drug
resistance, and adverse outcomes in pediatric patients (12). Another common epigenetic change that
mediates tumor occurrence is DNA methylation, which leads to the
silencing of tumor suppressor genes (TSGs), thereby inducing the
transformation of normal cells into cancer cells (13). Therefore, inhibiting DNA methylation
and activating silent TSGs could serve as a new approach for cancer
therapy (14). Decitabine is a
demethylation agent exerting antitumor effects that can reverse the
methylation of CpG sites and restore methylation patterns in the
silent TSGs (15).
Decitabine has been used for the treatment of
myelodysplastic syndrome and acute/chronic myeloid leukemia
(16–18). However, decitabine has not been used
for T-ALL treatment, and basic research demonstrating its
therapeutic effect for T-ALL is limited. The present study aimed to
investigate the inhibitory effects of decitabine on the T-ALL molt4
cell line. In addition, decitabine-mediated regulation of PTEN
expression, genes in the PI3K/AKT/mTOR pathway and downstream
oncogenes were analyzed.
Materials and methods
Cell lines and cell culture
Contaminant-free molt4 cell line with short tandem
repeat lineage certification was provided by Jiangsu KGI
Biotechnology Co., Ltd.. The culture medium contained 90% RPMI-1640
(Gibco; Thermo Fisher Scientific, Inc.) and 10% fetal bovine serum
(Shanghai ExCell Biology, Inc.). Cells were cultured at 37°C with
5% CO2 in a saturated humidity environment. Upon
reaching 80–90% confluence, cells were centrifuged at 220 × g for 5
min at room temperature and passaged at a 1:3 ratio. Further
experiments were carried out, when the cells reached the required
density.
Cell proliferation assay
Molt4 cells were cultured in 96-well culture plates
at a concentration of 5×10⁴ cells/ml and 100 µl cell
culture medium per well. After 24 h of incubation at 37°C, the
medium was discarded, and the cells were washed with phosphate
buffer saline (PBS). Culture medium containing varying
concentrations of decitabine (0.00625, 0.0125, 0.025, 0.05, 0.1,
0.5, 1.0, 5.0, 10.0, 50.0, and 100 µM) was added for the cell
proliferation assay. A negative control (without decitabine) was
also prepared and added to eight wells in each group. The 96-well
plate cells were cultured for 24, 48, 72 and 96 h and treated with
10 µl Cell Counting kit (CCK)-8 (Dojindo Molecular Technologies,
Inc.) for 3 h according to the manufacturer's protocol. After
blending, optical density (OD) was measured at λ=450 nm. The half
maximal inhibitory concentration (IC50) was calculated
using probability unit weighted regression (Bliss method), and the
drug inhibition rate was calculated utilizing the following formula
(19): Inhibition rate (%)=negative
control group-experimental group/negative group ×100. The data are
based on three independent experiments with four replicates per
sample in each experiment.
Apoptosis analysis
Annexin V-FITC/PI double staining kit (Jiangsu Kaiji
Biotechnology Co., Ltd.) was used to detect cell apoptosis, both
early (Annexin V-FITC+/PI-) and late stage (Annexin V-FITC+/PI+).
Logarithmic phase cells were inoculated into 6-well plates. After
cell adherence, the aforementioned culture medium was replaced with
medium containing different concentrations of decitabine (1, 10 and
50 µM). A negative control without decitabine was also prepared.
After 96 h of decitabine stimulation at 37°C, the cells were
collected, centrifuged at 300 × g at 37°C for 5 min and washed with
PBS. Next, the cell density was adjusted to 5×10⁵ cells
in 500 µl binding buffer (Jiangsu KGI Biotechnology Co., Ltd.)
using an Automated Cell Counter (Thermo Fisher Scientific, Inc.),
and subsequently 5 µl Annexin V-FITC and 5 µl propidium iodide were
added to the 500-µl cell suspension for incubation at 37°C for 10
min in dark. Apoptotic cells were detected using flow cytometry
with FACSCalibur (CellQuest Pro, version 6.0, BD Biosciences) after
5 to 15 min of reaction in the dark.
Cell cycle detection
Logarithmic growth phase cells were inoculated into
six-well plates, and the culture medium was replaced with medium
containing different concentrations of decitabine (1, 10 and 50 µM)
after adherence. After 96 h in culture at 37°C, cells were digested
with 0.25% pancreatin (without EDTA) and washed with PBS.
Subsequently, 5×10⁵ cells were collected and fixed with
70% ethanol overnight at 4°C. After washing with 70% PBS and
centrifugation at 220 × g for 5 min at room temperature, cells were
treated with 100 ml RNase A and incubated at 37°C for 30 min. Next,
cells were incubated with 400 µl PI dye (Jiangsu Kaiji
Biotechnology Co., Ltd.) and mixed at 4°C for 30 min in the dark.
Red fluorescence was measured (FACSCalibur; BD Biosciences) and
analyzed (FACScan software; version 6.0; BD Biosciences) at the
re-excitation wavelength of 488 nm. Three independent experiments
were carried out.
Transmission electron microscope (TEM)
analysis
Molt4 cells stimulated with varying concentrations
of decitabine (1, 10 and 50 µM) and the negative control were
analyzed after 96 h of incubation at 37°C. The cells were washed
with PBS, placed in fresh tubes, fixed with PBS containing 2.5%
glutaraldehyde for 2 h at 4°C, and washed with 0.1 M PBS. Next,
cells were post-fixed with 1% osmium acid solution for 3 h at 4°C,
dehydrated sequentially in 50, 70, 90 and 100% ethanol for 15 min
each (three times in 100% ethanol), embedded in epoxy resin and cut
into 50-nm thick sections. After 3% uranium citrate staining for 30
min at room temperature, samples were observed under a TEM
(magnification, ×50) and images were captured.
Reverse transcription-quantitative
(RT-q)PCR
Cells were collected after stimulation with varying
concentrations of decitabine (0, 1, 10 and 50 µM). Cells were
treated with 1 ml TRIzol® (Invitrogen; Thermo Fisher
Scientific, Inc.), incubated with chloroform for 3 min at room
temperature, and then centrifuged at 12,000 × g at 4°C for 15 min.
The supernatant was collected, mixed with 0.6 ml of isopropanol for
10 min, and centrifuged at 12,000 g at 4°C for 10 min. After
discarding the supernatant, 70% ethanol was added to the cells, and
they were centrifuged at 7,500 g at 4°C for 10 min. RNA
concentration was measured after discarding the supernatant and
suspending the pellet in DNase/RNase-free ultrapure water (Table SI). Reverse transcription was
performed to synthesize cDNA (catalog no. K1632; Fermentas; Thermo
Fisher Scientific, Inc.). After PCR amplification, the reaction
system contained 10 µl real-time PCR Master Mix (catalog no.
EP0702; Fermentas; Thermo Fisher Scientific, Inc.), 1 µl DNA
template, 2 µl each primer and 7 µl 0.1% DEPC water. The
thermocycling conditions were as follows: Pre-denaturation at 95°C
for 5 min; 40 cycles of 95°C for 15 sec, 60°C for 20 sec and 72°C
for 40 sec; extension at 95°C for 15 sec, 60°C for 1 min and 95°C
for 15 sec, the fluorophore (cat no. DA7600; Zhongshan Bio Tech
Co., Ltd.). The customized primers used for amplification are
listed in Table I and GAPDH was used
as the control (Jiangsu KeyGen Biotechnology Co., Ltd.). Three
independent experiments were carried out. The relative expressions
of the genes were calculated utilizing the 2−ΔΔCq method
(20).
 | Table I.Primers of target genes for reverse
transcription-quantitative PCR detection. |
Table I.
Primers of target genes for reverse
transcription-quantitative PCR detection.
| Target gene | Forward sequence,
5′-3′ | Reverse sequence,
5′-3′ |
|---|
| 4EBP1 |
CAAGGGATCTGCCCACCATT |
AACTGTGACTCTTCACCGCC |
| AKT |
GGCTATTGTGAAGGAGGGTTG |
TCCTTGTAGCCAATGAAGGTG |
| GAPDH |
TGTTGCCATCAATGACCCCTT |
CTCCACGACGTACTCAGCG |
| mTOR |
ATTTGATCAGGTGTGCCAGT |
GCTTAGGACATGGTTCATGG |
| P70S6 |
CGGGTACTTGGTAAAGGGGG |
TGCCTTTTTAAGCACCTTCATGG |
| PI3K |
ATGCAAATTCAGTGCAAAGG |
CGTGTAAACAGGTCAATGGC |
| PTEN |
CAAGATGATGTTTGAAACTATTCCAATG |
CCTTTAGCTGGCAGACCACAA |
Western blotting
Cells stimulated with varying concentrations of
decitabine (0, 1, 10 and 50 µM) were collected. Total proteins were
extracted after cell lysis (no. KGP701-100; Cell lysis buffer for
Western; Jiangsu KeyGen Biotechnology Co., Ltd.). The protein
concentration was determined using the bicinchoninic acid method.
The OD value was measured at the wavelength of 520 nm (Jiangsu
KeyGen Biotechnology Co., Ltd.).
Sodium dodecyl sulfate-polyacrylamide gel
electrophoresis (SDS-PAGE) was performed using a 12% separating gel
and 5% layering gel. For sample preparation, 15 µl protein lysate
was mixed with 5 µl SDS buffer and sampled. The membrane was
transferred after electrophoresis at the voltage of 60 to 90 V.
After cleaning and sealing the cellulose nitrate membrane
containing protein, the corresponding antibodies against eukaryotic
initiating factor 4E-binding protein (4EBP)1, AKT, MTOR, P70S6,
PI3K, PTEN and GAPDH were added, and the membranes were incubated
overnight at 4°C. After washing with 0.05% Tween-20 (catalog no.
TA-999-TT; Thermo Fisher Scientific, Inc.), goat anti-rabbit
secondary antibodies were added. Antibody details are presented
Table SII. An enhanced
chemiluminescence kit (Jiangsu KGI Biotechnology Co., Ltd.) was
used for coloration and to capture images for analysis. Signal
intensities were quantified utilizing the Gel-Pro32 analyzer
software (Media Cybernetics, Inc.). The relative expression ratio
of target proteins was calculated as follows: Relative expression
ratio of target protein integrated optical density (IOD)/GAPDH IOD.
Three independent experiments were carried out and Gel-Proanalyzer
version 4.0 software (Media Cybernetics) was used for
densitometry.
Statistical analysis
Data are presented as mean ± standard deviation.
Unpaired Student's t-tests and Mann-Whitney tests were used to
compare significant differences between groups. Normality and
homogeneity of variance were calculated. Then one-way ANOVA was
performed to compare differences among the groups with Tukey's post
hoc test. SPSS version 18 (SPSS Inc.) was used for statistical
analysis. P<0.05 was considered statistically significant.
Results
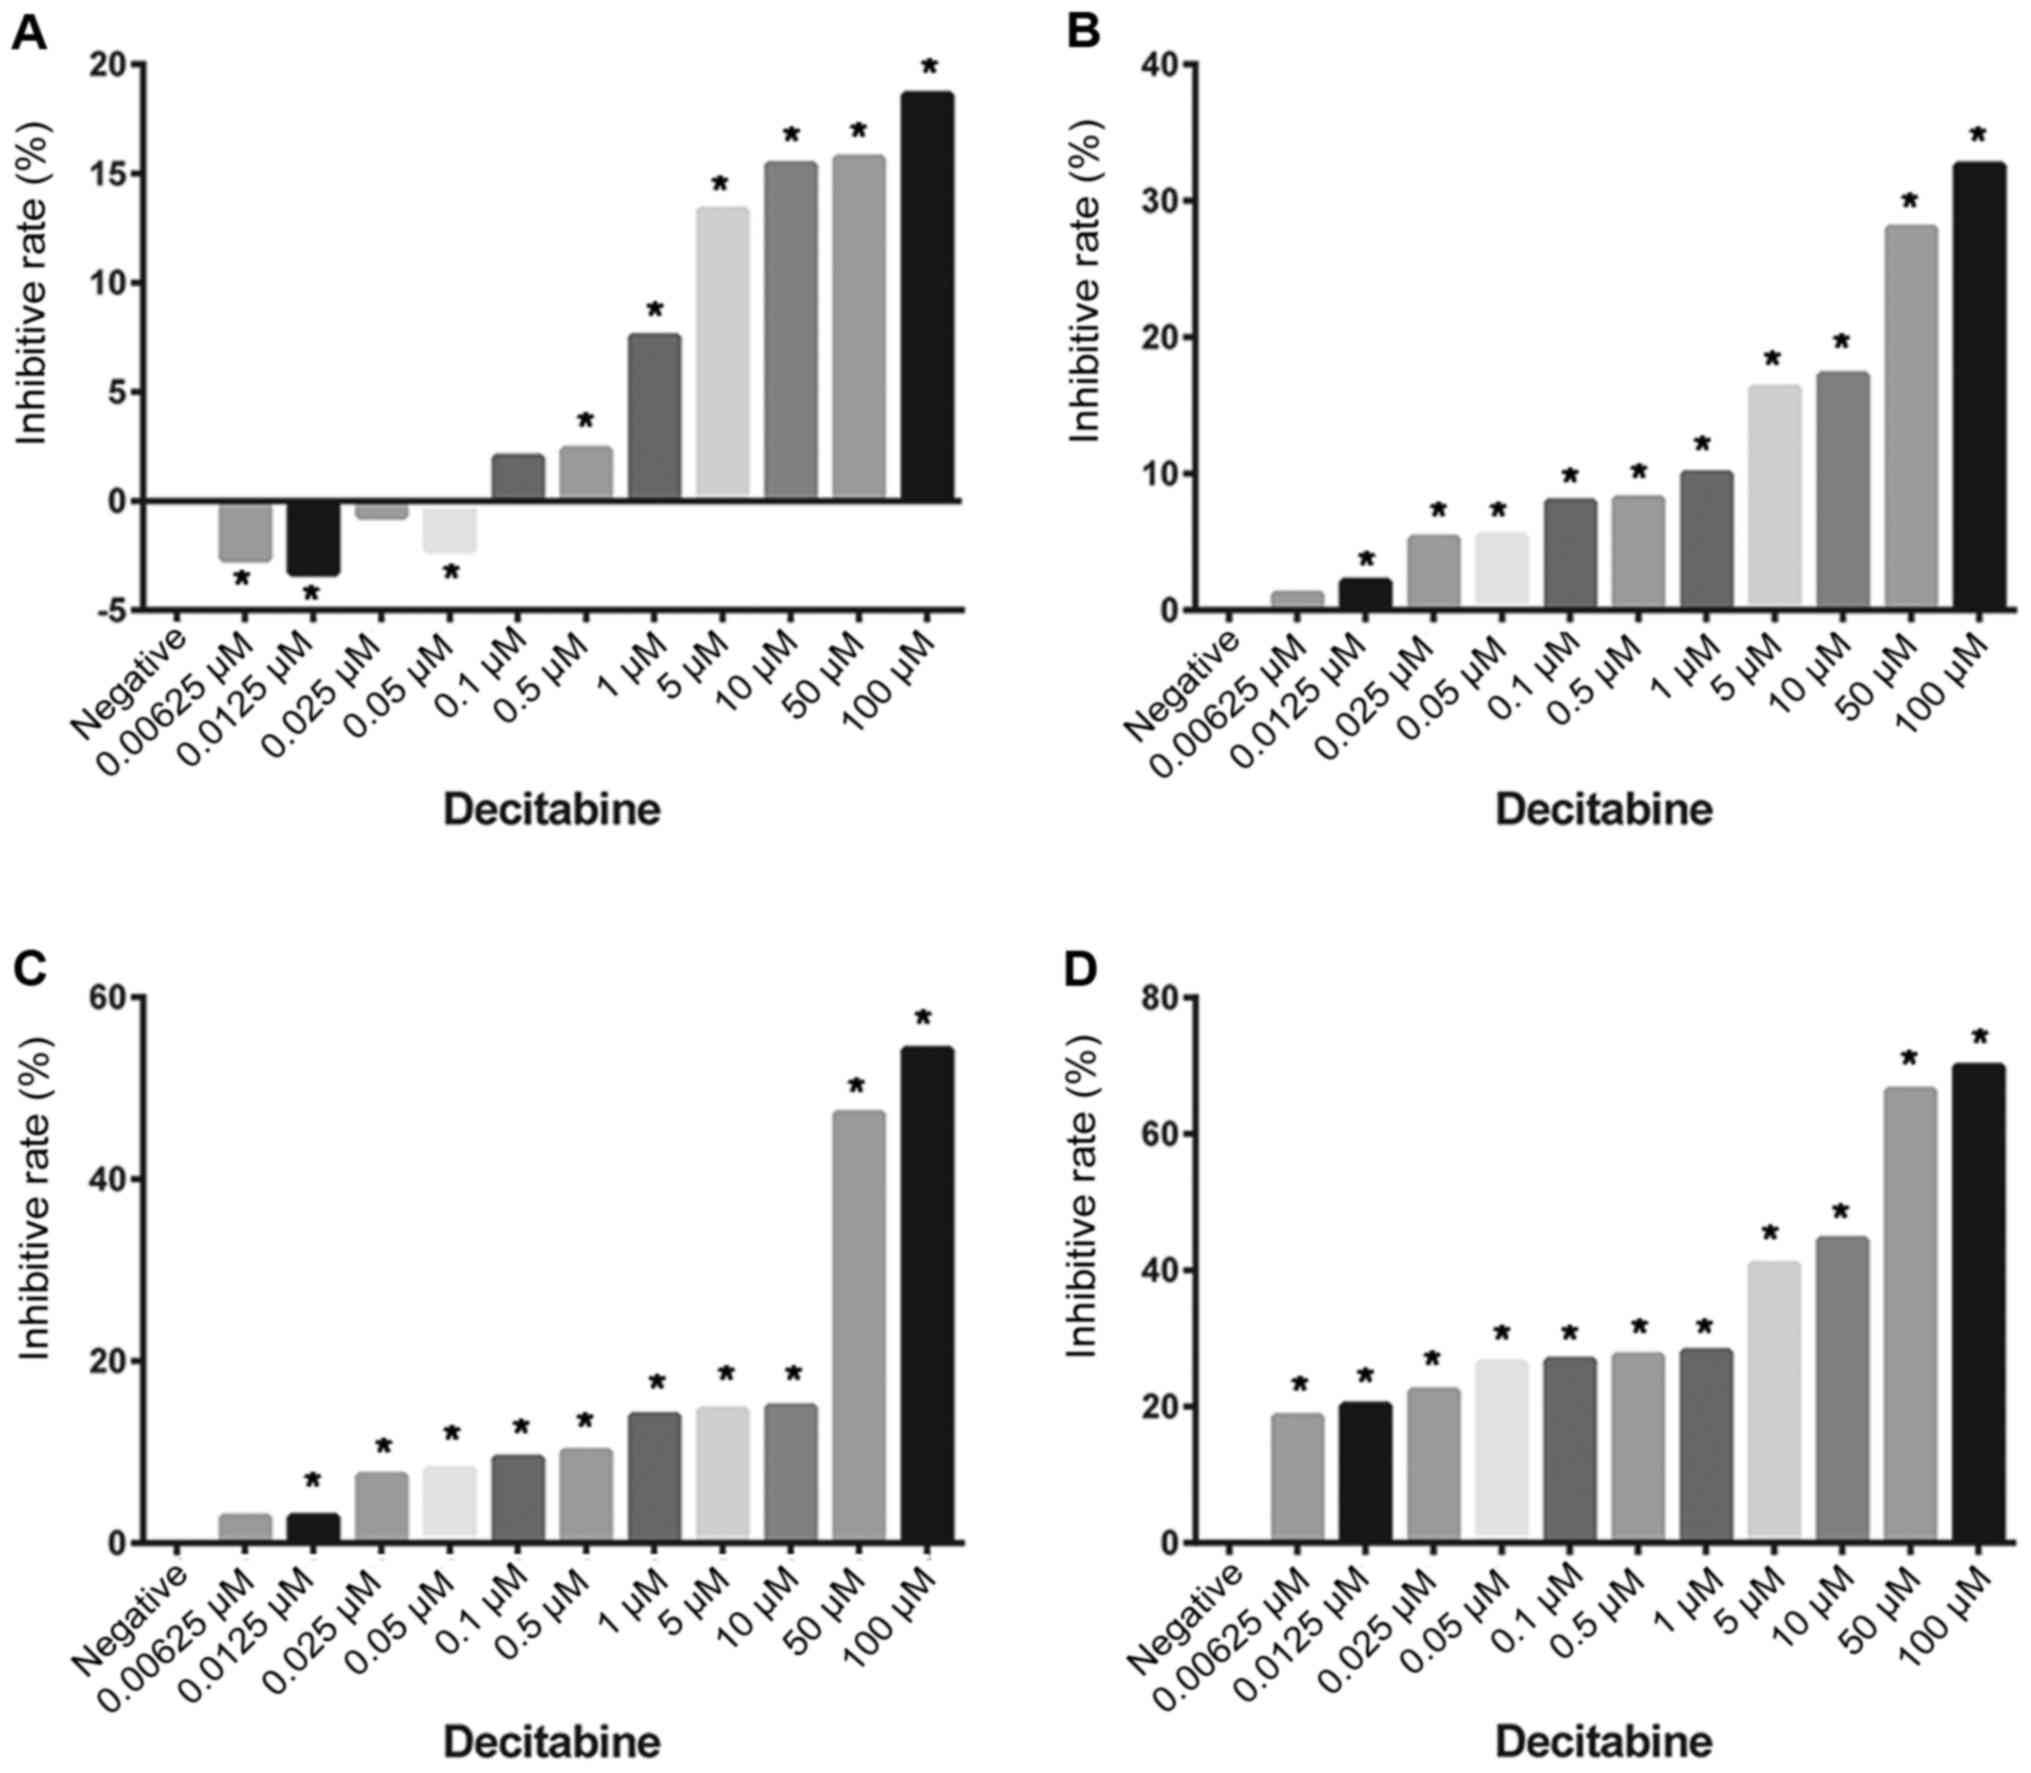
Decitabine inhibits the proliferation
of molt4 cells
The effects of different decitabine concentrations
on molt4 cell proliferation at various time points are presented in
Table II. Overall, after 24 h of
incubation with different concentrations of decitabine, it was
observed that 100 µM decitabine had the greatest inhibitory effect
on cell proliferation at 18.59% (P<0.01). The inhibitory rate
gradually decreased with decreasing decitabine concentrations,
reaching-2.62% at 0.00625 µM (P=0.035) (Fig. 1A). The inhibition rate of cell
proliferation was 32.56% at 100 µM decitabine after 48 h of
treatment (P<0.01). Lowering the decitabine concentration
decreased the inhibition rate to 1.15% at 0.00625 mM (P=0.286)
(Fig. 1B). Treatment with 100 µM
decitabine for 72 h led to an inhibition rate of 54.20%
(P<0.01). Treatment with lower concentrations of decitabine
reduced the inhibition rate to 2.81% at 0.00625 µM (P=0.179). In
addition, the IC50 was 84.461 µM after 72 h of treatment
(Fig. 1C). After 96 h of
stimulation, the inhibition rate was 69.85% at 100 µM decitabine.
Moreover, the inhibition rate gradually decreased to 18.48% at
0.00625 µM decitabine. Therefore, the IC50 was 10.113 µM
after 96 h of treatment (Fig. 1D).
These data demonstrated that decitabine inhibited the proliferation
of molt 4 cells in a dose and time-dependent manner.
| Table II.Effects of different concentrations
of decitabine on the inhibitive rate of molt4 cells proliferation
at various time points. |
Table II.
Effects of different concentrations
of decitabine on the inhibitive rate of molt4 cells proliferation
at various time points.
|
| Time after
intervention, h |
|---|
|
|
|
|---|
|
| 24 | 48 | 72 | 96 |
|---|
|
|
|
|
|
|
|---|
| Concentration,
µM | OD±SD | Inhibition rate,
% | OD±SD | Inhibition rate,
% | OD±SD | Inhibition rate,
% | OD±SD | Inhibition rate,
% |
|---|
| NC | 2.25±0.03 | – | 2.05±0.04 | – | 2.01±0.04 | – | 2.50±0.05 | – |
| 100 |
1.83±0.09b | 18.59 |
1.38±0.06b | 32.56 |
0.92±0.03b | 54.20 |
0.75±0.04b | 69.85 |
| 50 |
1.90±0.07b | 15.69 |
1.47±0.05b | 27.95 |
1.06±0.07b | 47.15 |
0.84±0.08b | 66.36 |
| 10 |
1.91±0.08b | 15.38 |
1.69±0.06b | 17.20 |
1.71±0.07b | 14.96 |
1.39±0.07b | 44.46 |
| 5 |
1.95±0.05b | 13.31 |
1.71±0.07b | 16.25 |
1.72±0.02b | 14.56 |
1.48±0.06b | 40.77 |
| 1 |
2.08±0.08b | 7.51 |
1.84±0.05b | 9.96 |
1.73±0.08b | 13.98 |
1.80±0.10b | 27.97 |
| 0.5 |
2.20±0.02a | 2.34 |
1.88±0.07b | 8.13 |
1.81±0.08b | 10.00 |
1.81±0.10b | 27.39 |
| 0.1 | 2.21±0.07 | 1.98 |
1.88±0.07b | 7.90 |
1.82±0.08b | 9.30 |
1.83±0.04b | 26.73 |
| 0.05 | 2.30±0.04 | −2.22 |
1.94±0.07a | 5.39 |
1.85±0.06b | 8.02 |
1.84±0.05b | 26.36 |
| 0.025 | 2.27±0.04 | −0.67 |
1.94±0.08a | 5.22 |
1.86±0.05b | 7.40 |
1.94±0.06b | 22.24 |
| 0.0125 | 2.33±0.07 | −3.27 | 2.00±0.03 | 2.08 | 1.95±0.04 | 2.85 |
2.00±0.10b | 20.12 |
| 0.00625 |
2.31±0.04a | −2.62 | 2.02±0.03 | 1.15% | 1.95±0.07 | 2.81 |
2.04±0.05b | 18.48 |
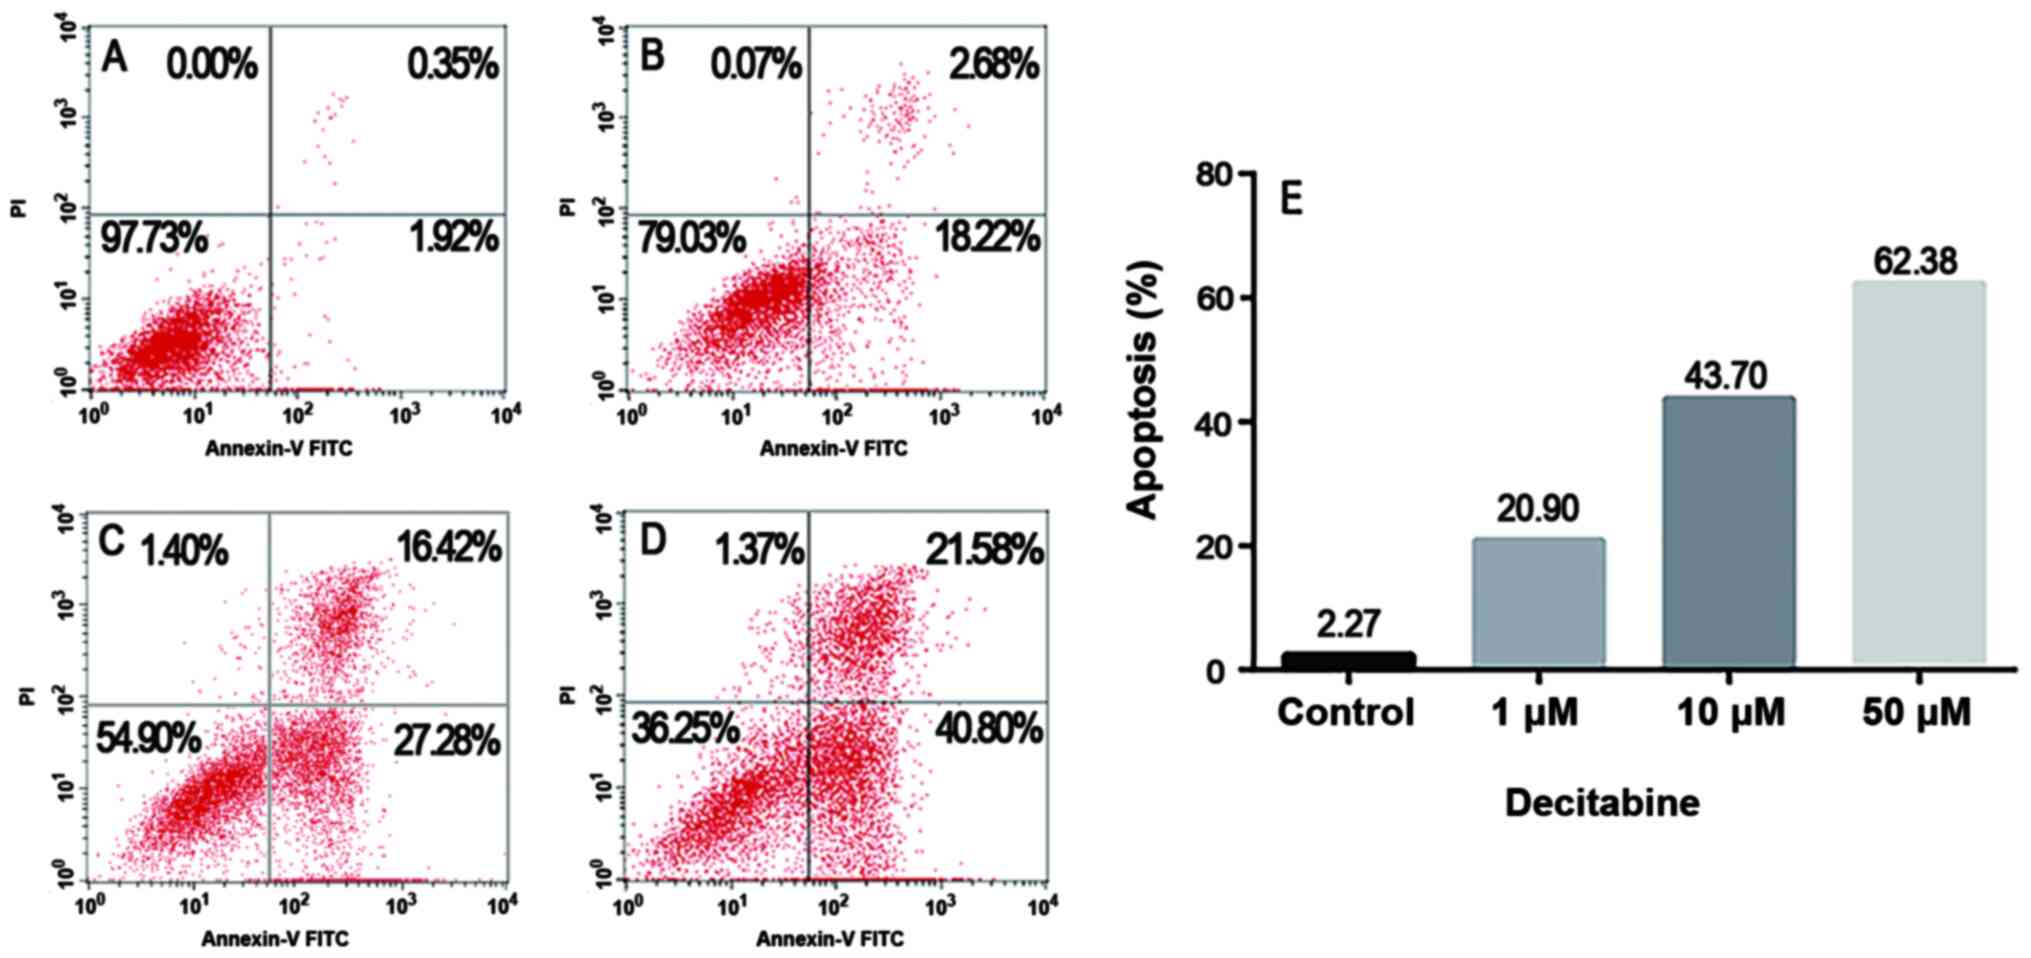
Decitabine induces molt4
apoptosis
Apoptosis was detected using Annexin V-FITC/PI
double staining. Flow cytometry analysis showed that the percentage
of apoptotic cells in the negative control group was 2.27%
(Fig. 2A). Cells treated with 1, 10
and 50 µM decitabine exhibited apoptosis rates of 20.9, 43.7 and
62.38%, respectively (Fig. 2B-E).
Decitabine induced molt4 cells apoptosis in a dose-dependent
manner.
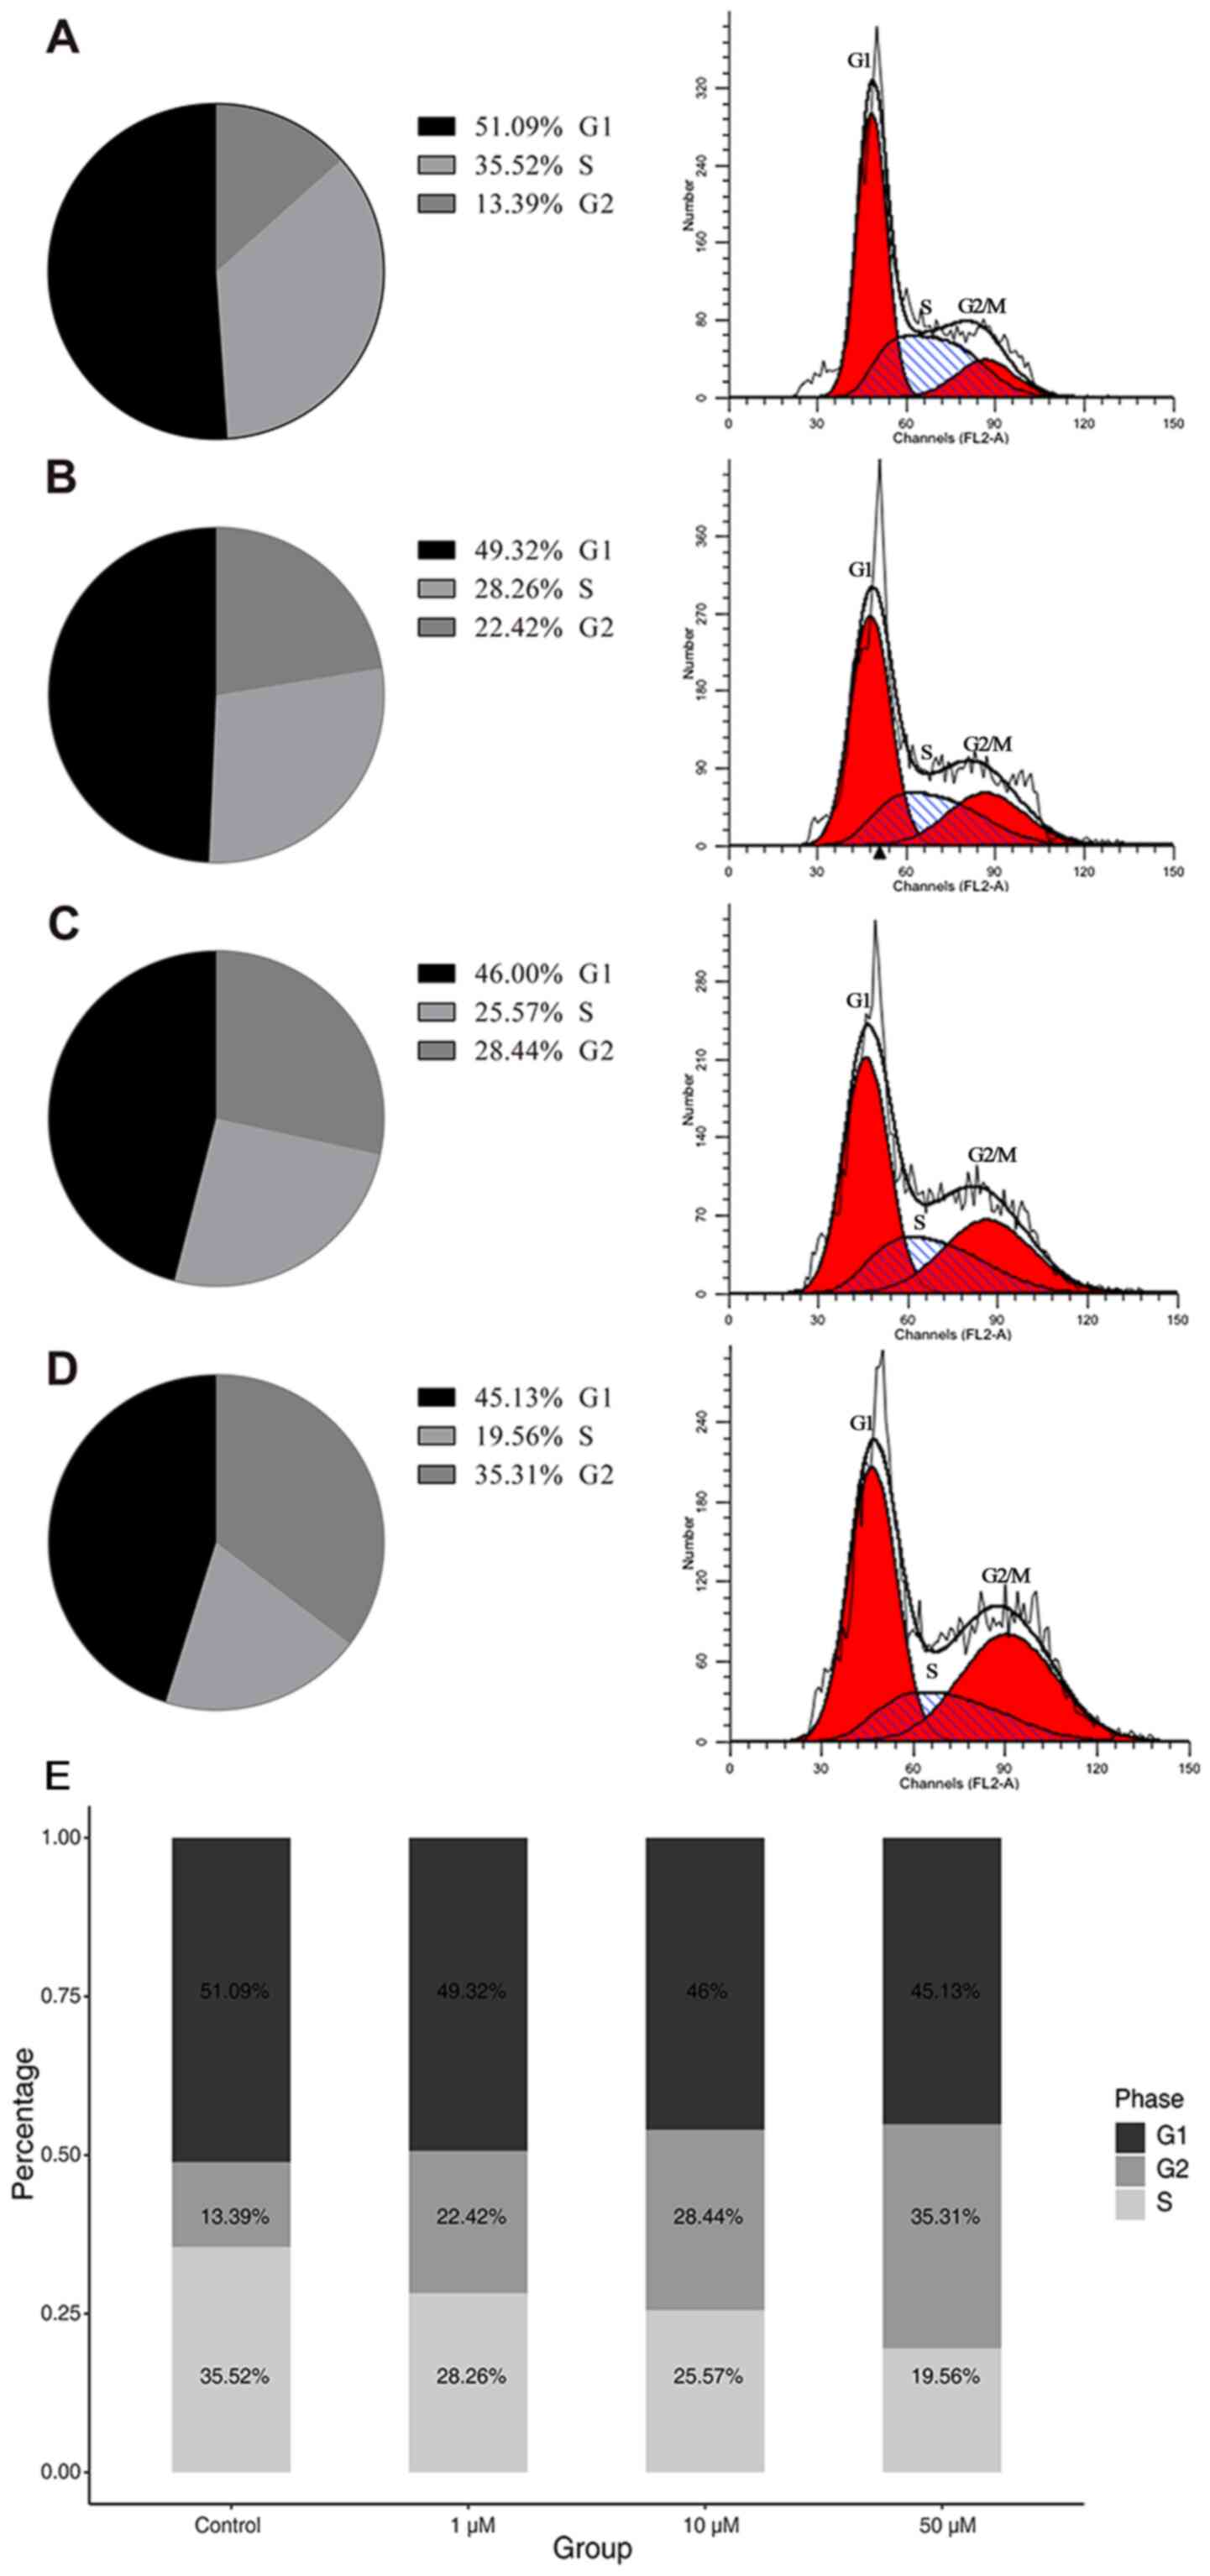
Effect of decitabine on the cell
cycle
In cells that were not treated with decitabine, the
percentage of cells in the G1, S and G2
phases were 51.09, 35.52 and 13.39%, respectively (Fig. 3A). The percentage of cells in the
G1, S and G2 phases were 49.32, 28.26 and
22.42%, respectively, after 48 h treatment with 50 µM decitabine
(Fig. 3B). After 72 h treatment with
50 µM decitabine, the percentage of cells in the G1, S
and G2 phases were 46.00, 25.57 and 28.44% (Fig. 3C). The percentage of cells in the
G1, S and G2 phases were 45.13, 19.56 and
35.31%, respectively, after 96 h treatment with 50 µM decitabine
(Fig. 3D). Increasing the decitabine
concentration decreased the proportion of cells in the S phase and
gradually increased the proportion of cells in the G2
phase (Fig. 3A-D). Three independent
experiments were carried out and provided very similar results.
These results indicated that the majority of molt4 cells were
arrested in the G2 phase after decitabine
stimulation.
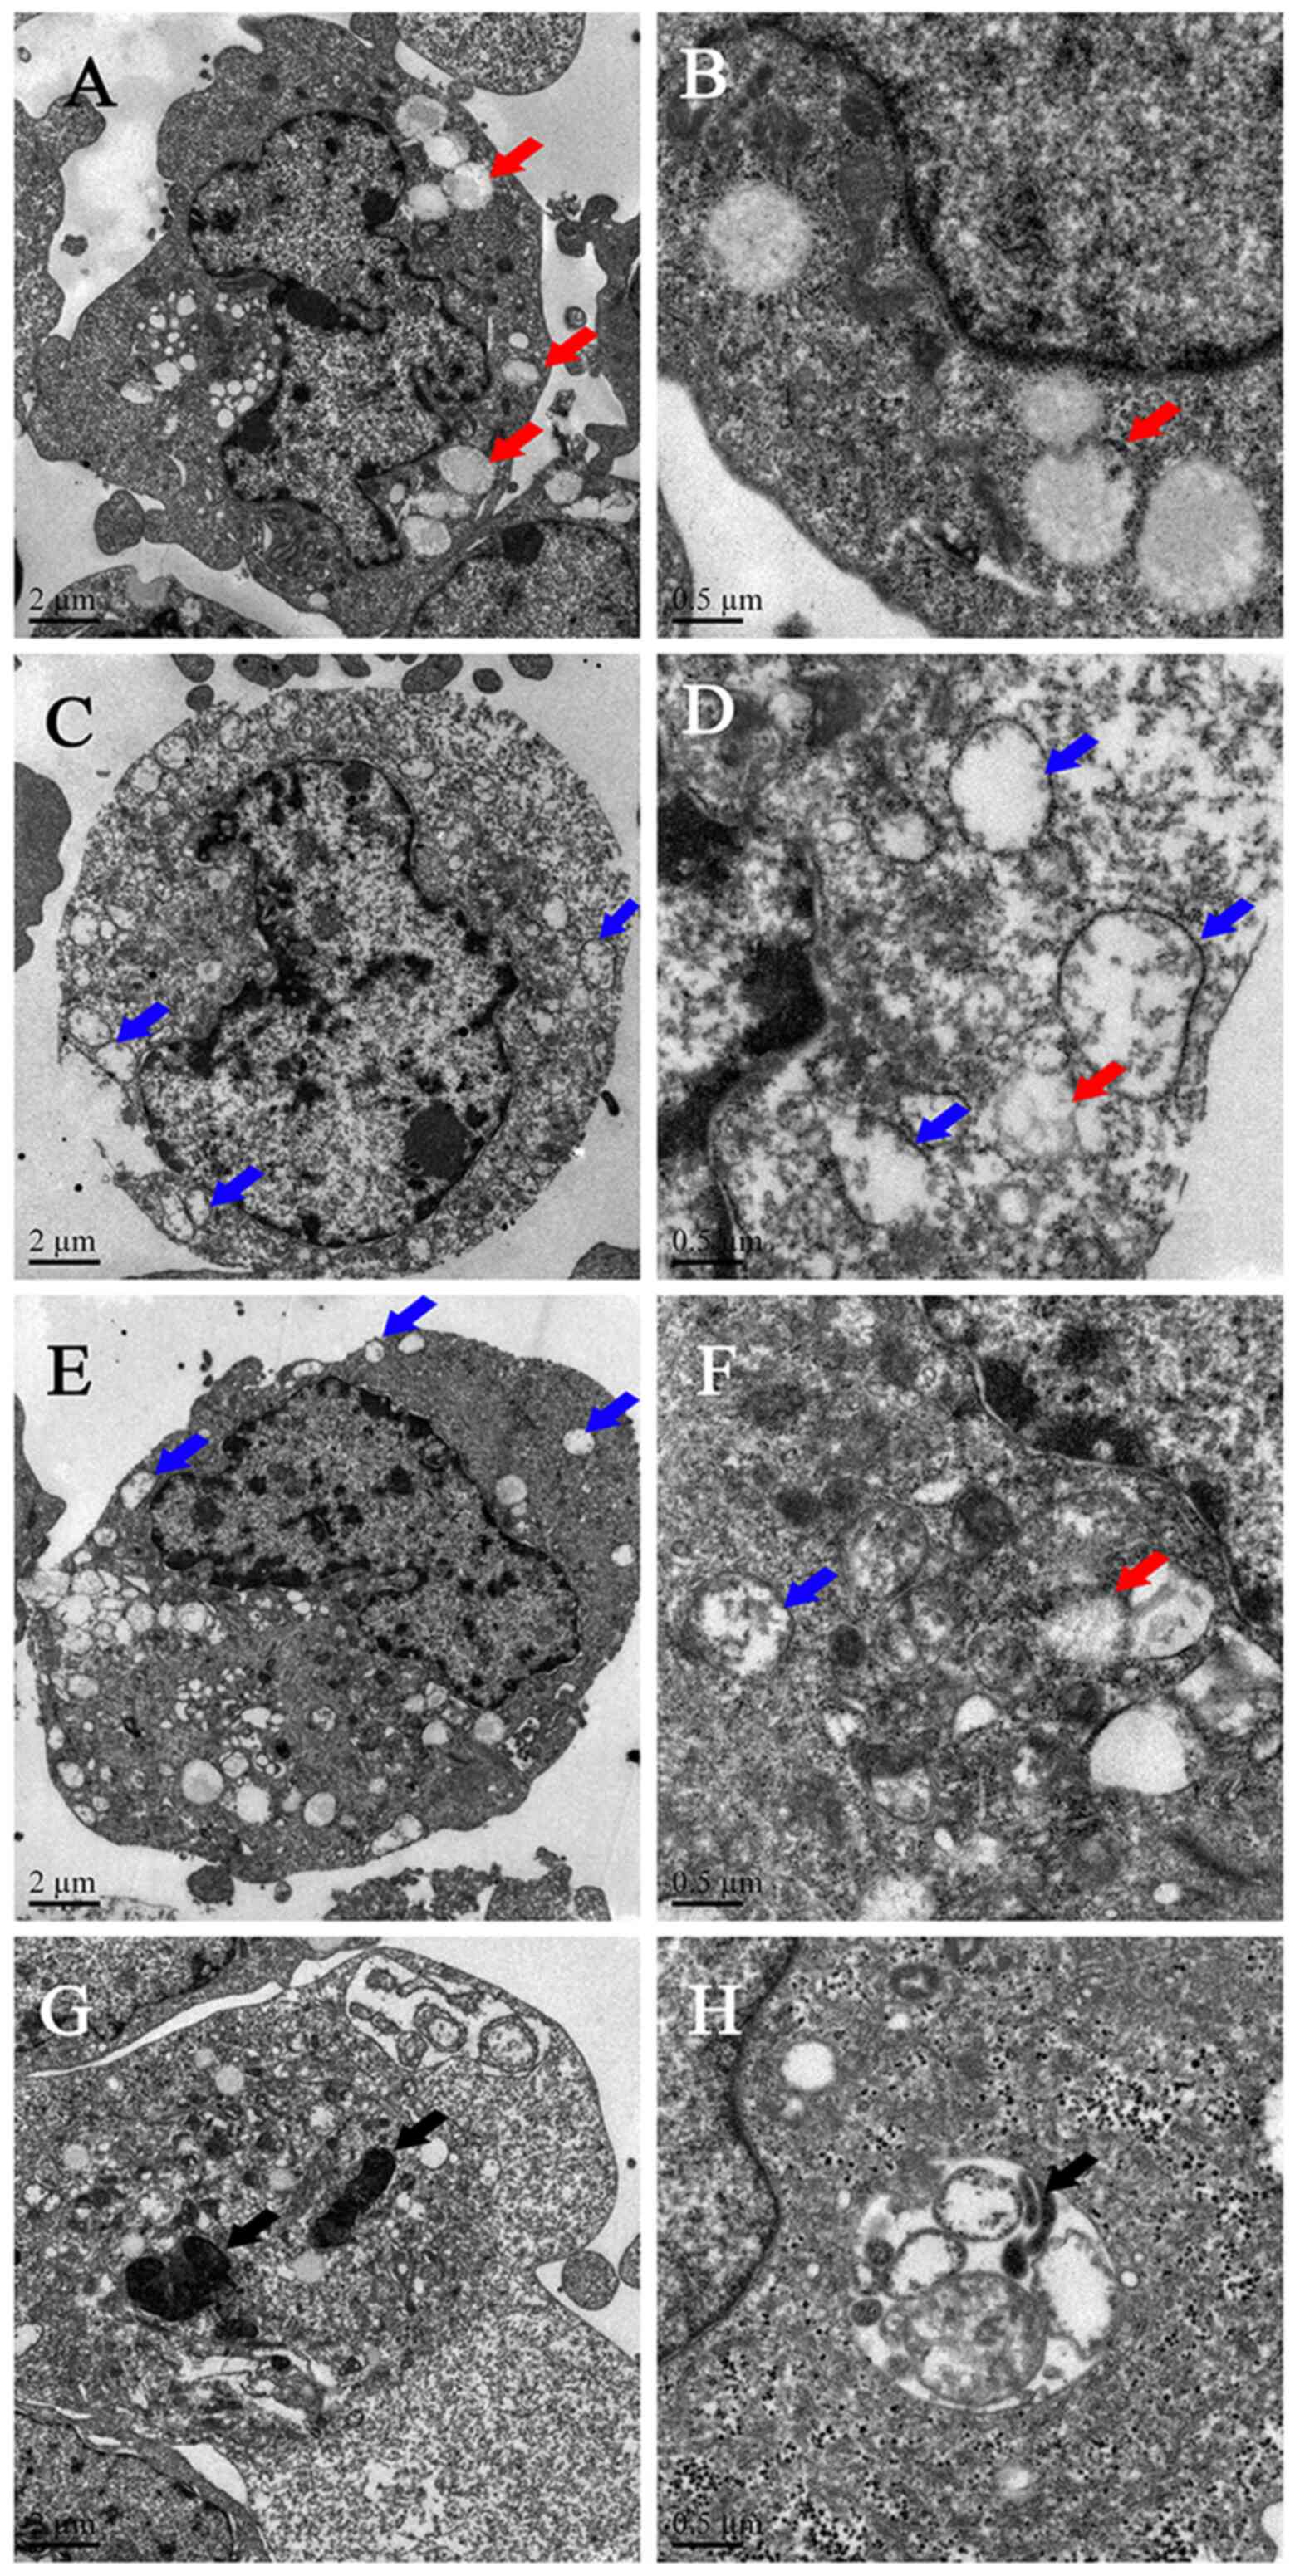
TEM detection
Molt4 cells that were not treated with decitabine
showed normal cell morphology, and lipid droplets were observed in
the cytoplasm of a subset of the cells (Fig. 4A and B). The number of lipid droplets
(Fig. 4C and D) and damaged
mitochondrial cells (Fig. 4C-H)
increased gradually with higher decitabine concentrations.
Autophagic body-like structures were observed in the cells after
treatment with 50 µM decitabine (Fig.
4H). The effect of decitabine on molt4 was mainly manifested as
mitochondrial damage and the autophagosomal-like structure
formation, and the degree of damage was
concentration-dependent.
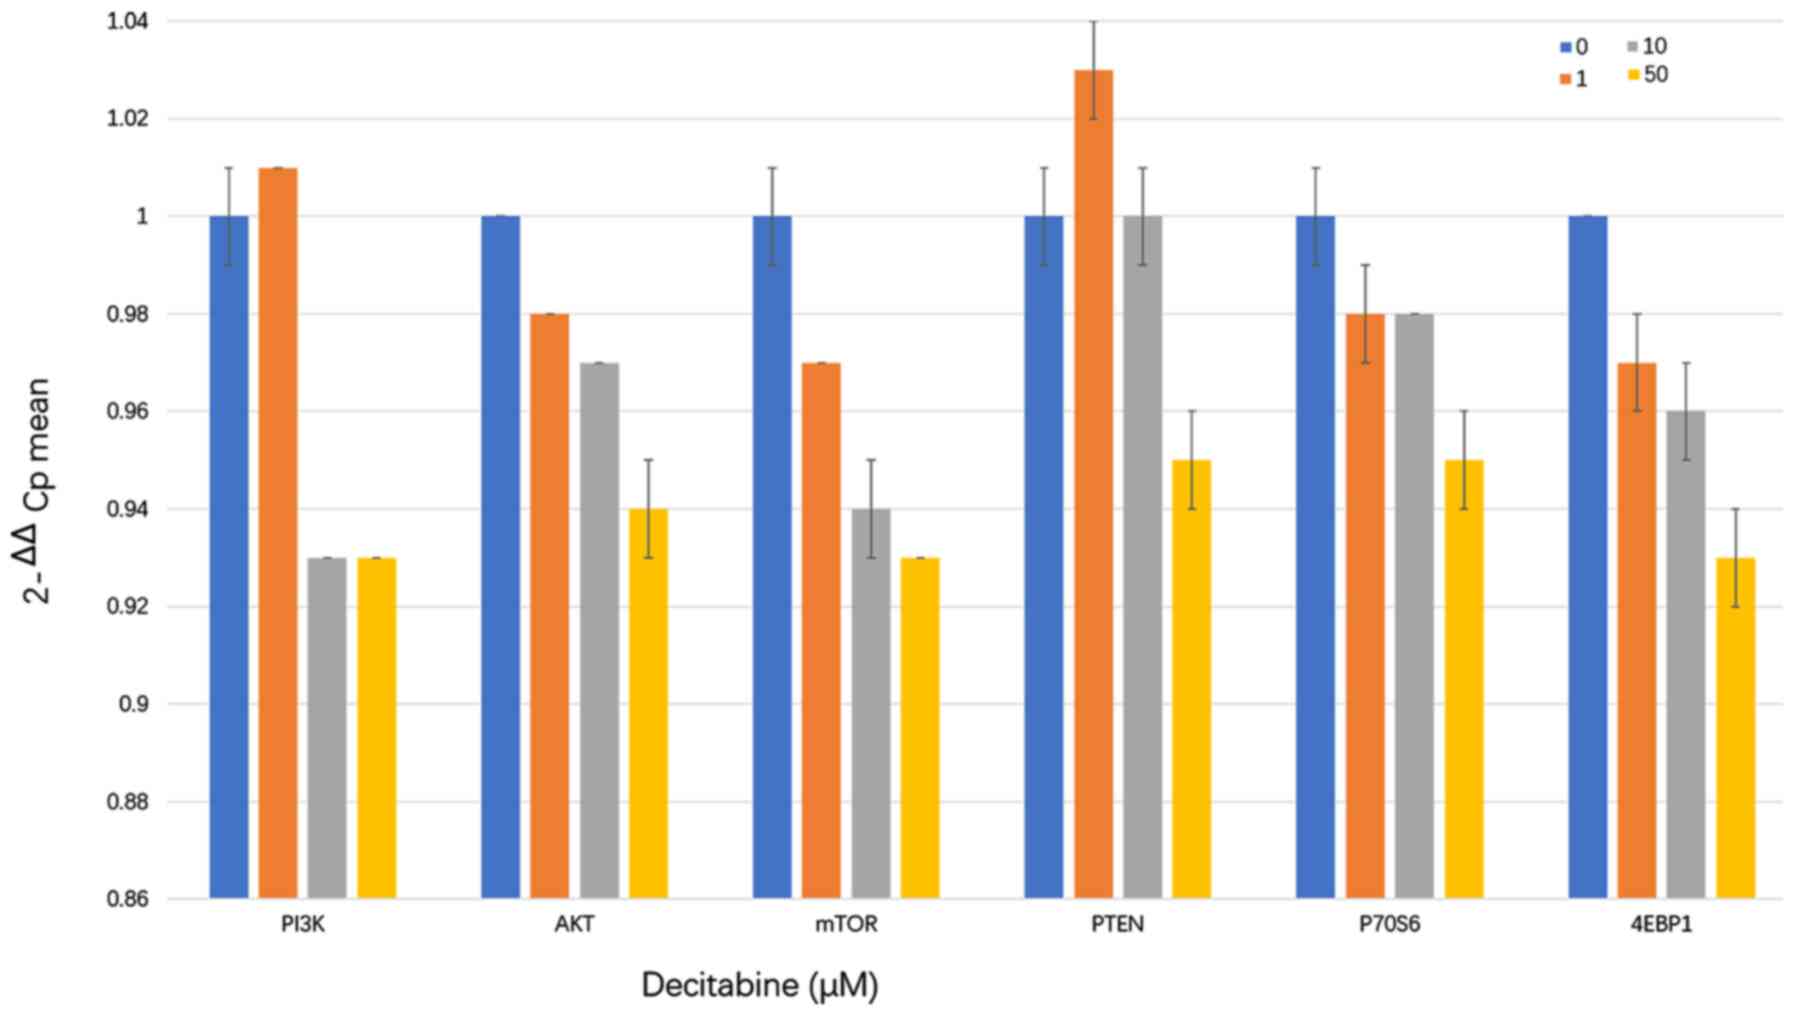
Decitabine downregulates mRNA levels
PI3K/AKT/mTOR pathway components partly by upregulating PTEN
expression
The RT-qPCR results showed that PI3K mRNA levels
gradually decreased at decitabine concentrations >10 µM compared
with those in the negative control group after 96 h of
intervention. In addition, the mRNA levels of AKT, mTOR, p70S6 and
4EBP1 significantly decreased, when the cells were treated with
decitabine concentrations >1 µM. PTEN mRNA expression was
upregulated in cells treated with 1 and 10 µM decitabine but was
downregulated after treatment with 50 µM decitabine (Fig. 5 and Table III). Decitabine could downregulate
mRNA levels PI3K/AKT/mTOR pathway with concentration
increasing.
| Table III.Reverse transcription-quantitative
PCR results for PI3K/AKT/mTOR pathway and related gene expression
in molt4 cells after treatment with different decitabine
concentrations. |
Table III.
Reverse transcription-quantitative
PCR results for PI3K/AKT/mTOR pathway and related gene expression
in molt4 cells after treatment with different decitabine
concentrations.
| Decitabine, µM | PI3K | AKT | mTOR | PTEN | p70s6 | 4EBP1 |
|---|
| 0 | 1.000±0.014 | 1.000±0.001 | 1.000±0.007 | 1.000±0.006 | 1.000±0.008 | 1.000±0.004 |
| 1 | 1.013±0.005 |
0.983±0.002b |
0.968±0.002a |
1.034±0.007b |
0.981±0.006a |
0.967±0.011a |
| 10 |
0.932±0.003a |
0.967±0.0004b |
0.943±0.006b | 1.001±0.007 |
0.979±0.003a |
0.958±0.007b |
| 50 |
0.929±0.001a |
0.937±0.014a |
0.928±0.001b |
0.952±0.009b |
0.952±0.010b |
0.931±0.006b |
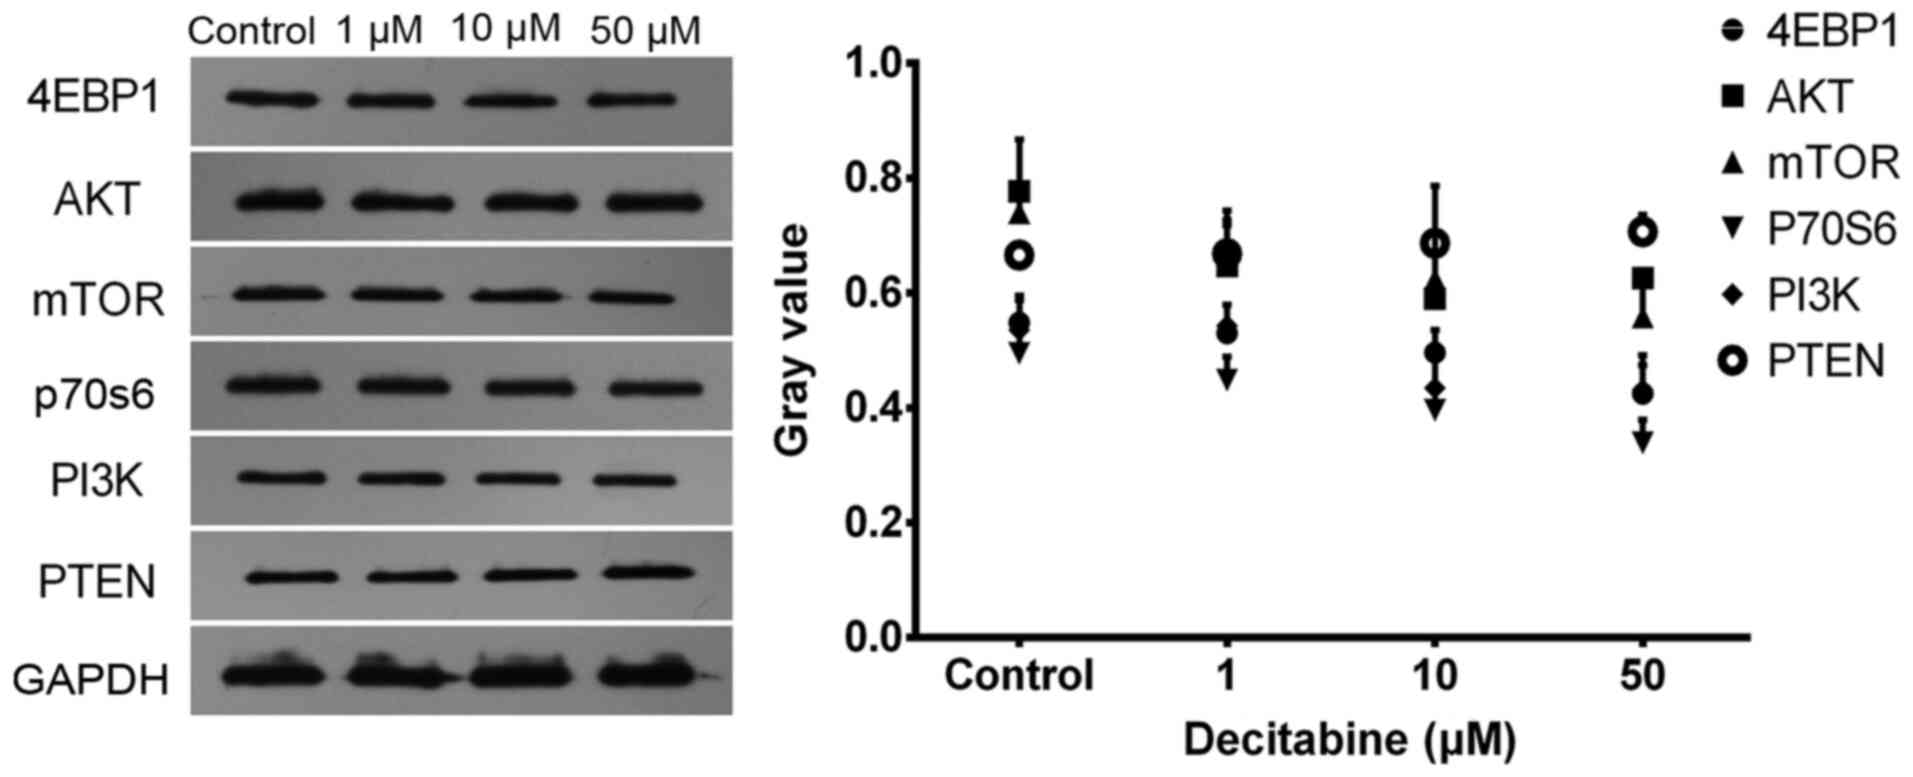
Decitabine downregulates levels of
proteins involved in the PI3K/AKT/mTOR pathway
Western blotting results indicated that PTEN protein
levels were slightly increased after 96 h of intervention with 1 to
50 µM decitabine. However, the protein expression of PI3K, AKT,
mTOR, total P70S6 and 4EBP1 was downregulated (Fig. 6 and Table
SIII). However, only at 50 µM decitabine intervention, protein
levels of mTOR, P70S6 and 4EBP1 had statistical difference compared
with 0 µM. No other statistical difference was found. So,
Decitabine downregulated levels of proteins involved in the
PI3K/AKT/mTOR pathway at 50 µM concentration.
Discussion
The present study demonstrated that decitabine can
induce apoptosis and inhibit proliferation in molt4 cells. Cell
cycle analysis showed that the majority of molt4 cells were
arrested in the G2 phase, indicating that the cells did
not enter the mitotic phase, since they needed to repair damaged
DNA after replication (21). In
terms of affected subcellular structures, decitabine increased the
production of lipid droplets and autophagosomes and promoted
mitochondrial damage.
In the PI3K/AKT/mTOR signaling pathway, PI3K can
phosphorylate PIP2 to PIP3. Moreover, PIP3 recruits and activates
AKT (Ser 308 phosphorylation) as a secondary messenger. Following
AKT activation, the mTOR complex is further activated to regulate
protein synthesis (22,23). The primary downstream effectors
include ribosomal p70S6 and 4EBP1, which further promote cell
proliferation, and invasion (24).
PTEN can block the phosphorylation of PIP2 to PIP3, thereby
preventing the activation of this pathway (25,26). In
the present study, analysis of PI3K/AKT/mTOR pathway showed that
decitabine downregulated the mRNA expression of components involved
in the pathway, including PI3K, AKT, mTOR, P70S6 and 4EBP1. In
addition, PTEN mRNA expression was upregulated in cells treated
with low decitabine concentrations of 1 and 10 µM. However, PTEN
mRNA expression was downregulated at high decitabine concentrations
of 50 µM. Higher decitabine concentrations caused a slight increase
in PTEN protein levels and significantly downregulated the mRNA
expression of PI3K, AKT and mTOR. Decreased 4EBP1 and P70S6
expression in mRNA and protein levels also indicated that
decitabine indirectly inhibited the PI3K/AKT/mTOR pathway.
Therefore, altered PTEN mRNA expression does not completely explain
the observed inhibitory effect of decitabine on the viability of
molt4 cells. Overall, low decitabine concentrations may have
upregulated PTEN mRNA expression by suppressing the methylation of
PTEN DNA to inhibit the activity of the PI3K/AKT/mTOR
pathway in molt4 cells, turn affecting cell proliferation and
promoting apoptosis. At high decitabine concentrations, other
mechanisms may exist that can regulate the PI3K/AKT/mTOR pathway
and further influence the proliferation of molt4 cells. However,
the biological effects of the slightly increased PTEN protein
levels should not be overlooked, although no significant expression
changes were observed.
In a previous study, 5 µM decitabine treatment for 4
days increased the sensitivity of drug-resistant molt4 cells to
daunorubicin and doxorubicin, and downregulated the expression of
ABCB1/P-glycoprotein (27). In
present results, it indicated that the proliferative inhibition
IC50 of decitabine was 84.461 µM at 72 h, and the
IC50 was 10.113 µM at 96 h of treatment, therefore
prolonged treatment with decitabine requires a lower drug
concentration to inhibit cell proliferation and promote apoptosis.
Prolonging the duration of drug action (>96 h) or increasing the
concentration of decitabine (>5 µM) could further inhibit cell
activity. These results suggested that treatment with 5–10 µM
decitabine for 4 days can inhibit the proliferation of molt4 cells
and increased the sensitivity of these cells to decitabine. These
effects are further enhanced with a prolonged treatment time and
higher drug concentration. However, in clinical applications,
toxicity still needs to be considered, and low concentrations
administered for long periods may potentially diminish the toxic
side effects in normal cells (28,29).
In another study, the proliferation inhibition rate
of 0.5 µM decitabine on molt4 cells was 69.76±2.2% and the
apoptotic rate was 37.75±3.87%. Under these conditions, the
percentage of G0/G1 cells was significantly
increased. The lactotransferrin (LTF) gene was analyzed after
screening for differentially expressed genes in the transcriptome.
The methylation rate of the CpG sites of LTF gene promoter
decreased from 72.3 to 45.0% after 72 h treatment with 0.5 µM
decitabine, which in turn upregulated LTF gene expression (30). The concentration of decitabine used
in the present report was low with a short treatment period, but it
effectively inhibited cell proliferation and promoted apoptosis. In
the present study, the inhibition rate was ~10% after 72 h of 0.5
µM decitabine intervention, and the apoptotic rate ranged only
between 2.27 and 20.90%. In addition, LTF acts as a tumor
suppressor protein that inhibits the proliferation and metastasis
of tumors and is known to exert antimicrobial, anti-viral and
immune regulatory effects (31–33). LTF
expression levels are low in molt4 cells without decitabine
intervention but were observed to significantly increase after
intervention (30). Therefore, these
results suggested that LTF expression plays a major role in the
inhibition of cancer cells under short-term treatment with low
concentrations of decitabine. The present results confirmed that 1
and 10 µM decitabine can inhibit proliferation, promote apoptosis
and induce G2 cycle arrest by increasing PTEN expression
and inhibiting the PI3K/AKT/mTOR pathway in molt4 cells. However,
the downregulation of PTEN expression decreased at 50 µM
decitabine, which suggested that the PI3K/AKT/mTOR pathway is not
regulated via DNA methylation inhibition of the PTEN gene at
relatively high decitabine concentrations. Other basic studies have
showed that not only PTEN, but also Notch 1 (3) and RAS (34), can regulate the PI3K/AKT/mTOR
pathway. Therefore, the upregulated expression of other TSGs could
also be involved in the decitabine-induced decrease in the
viability of tumor cells and regulation of the PI3K/AKT/mTOR
pathway.
Various studies have indicated that different
concentrations of decitabine are required to inhibit molt4
viability (27,30). Therefore, other potential factors may
affect the results, such as culture conditions, cell passage, cell
activity and gene expression levels. In addition, the findings of
the aforementioned studies and the present report indicate that
decitabine exerts inhibitory effects on molt4 cells in a time- and
dose-dependent manner (30). The
effect of decitabine on cells progresses over time and with
increased concentrations. At low concentrations and short treatment
times, decitabine preferentially acts on the more active DNA
methylation genes that usually induce TSGs. At higher
concentrations and prolonged treatment times, decitabine can
inhibit a higher number of DNA methylation genes and consequently
affect tumor cell viability (30).
Therefore, analyses based on epigenomics and transcriptome studies
with a single concentration and at a single time point do not
completely reflect the inhibitory mechanism of decitabine on tumor
cells (30,35,36).
Previous findings demonstrated that decitabine
exerts its effects on molt4 cells in a dose- and time-dependent
manner (27,30). The present study only analyzed
changes in the gene expression of PTEN and genes involved in the
PI3K/AKT/mTOR pathway, and did not detect the methylation levels of
CpG sites and the phosphorylation levels of AKT and mTOR.
Furthermore, epigenomics and transcriptome analyses were not
conducted. Decitabine can markedly inhibit DNA methyltransferase
(27). In further studies,
transcriptome analyses will be performed to investigate gene
expression in molt4 cells at different concentrations of decitabine
and at different time points. The dynamic inhibitory effects of
decitabine should be evaluated to elucidate the underlying
mechanisms of function in molt4 cells and other T-ALL cell
lines.
In conclusion, decitabine can inhibit cell
proliferation, induce cell cycle arrest in the G2 phase
and induce apoptosis in molt4 cells. Additionally, on the
subcellular morphological level, decitabine can increase the
production of lipid droplets and autophagosomes and induce
mitochondrial damage. Decitabine intervention inhibited the
activity of the PI3K/AKT/mTOR pathway, whereas PTEN levels were
upregulated upon treatment with and 10 µM decitabine. However, PTEN
levels were downregulated after treatment with 50 µM decitabine,
which suggested the PI3K/AKT/mTOR pathway is not regulated via DNA
methylation inhibition of the PTEN gene this concentration. The
present results provided evidence to highlight the importance of
investigating the dose and time-dependent effects of decitabine on
molt4 cells.
Supplementary Material
Supporting Data
Acknowledgements
The authors would like to thank Mr. Pang Shiwei for
their comments and suggestions during the revision of the
manuscript.
Funding
The study was funded by the Medical and Health
Science and Technology Plan Project of Zhejiang Province (grant no.
2019KY693), the Jiaxing Key Discipline Fund (grant no. SY18-Z-06)
and Hospital-Level Fund of the First Affiliated Hospital of Jiaxing
University (grant no. 2016-YA-08).
Availability of data and materials
All data generated or analyzed during this study are
included in this published article.
Authors' contributions
GZ and XJG designed the study and wrote the
manuscript. GZ, XHG and XZ collected the data and performed the
experiments. HW, MY and YL analyzed the data. HZ and ZJ analyzed
and interpreted the data. All authors read and approved the final
manuscript.
Ethics approval and consent to
participate
Not applicable.
Patient consent for publication
Not applicable.
Competing interests
The authors declare that they have no competing
interests.
References
|
1
|
Akkapeddi P, Fragoso R, Hixon JA, Ramalho
AS, Oliveira ML, Carvalho T, Gloger A, Matasci M, Corzana F, Durum
SK, et al: A fully human anti-IL-7Rα antibody promotes antitumor
activity against T-cell acute lymphoblastic leukemia. Leukemia.
33:2155–2168. 2019. View Article : Google Scholar : PubMed/NCBI
|
|
2
|
Teachey DT and Pui CH: Comparative
features and outcomes between paediatric T-cell and B-cell acute
lymphoblastic leukaemia. Lancet Oncol. 20:e142–e154. 2019.
View Article : Google Scholar : PubMed/NCBI
|
|
3
|
Hales EC, Taub JW and Matherly LH: New
insights into Notch1 regulation of the PI3K-AKT-mTOR1 signaling
axis: Targeted therapy of γ-secretase inhibitor resistant T-cell
acute lymphoblastic leukemia. Cell Signal. 26:149–161. 2014.
View Article : Google Scholar : PubMed/NCBI
|
|
4
|
Karrman K and Johansson B: Pediatric
T-cell acute lymphoblastic leukemia. Genes Chromosomes Cancer.
56:89–116. 2017. View Article : Google Scholar : PubMed/NCBI
|
|
5
|
Rahmat LT, Nguyen A, Abdulhaq H, Prakash
S, Logan AC and Mannis GN: Venetoclax in combination with
decitabine for relapsed T-cell acute lymphoblastic leukemia after
allogeneic hematopoietic cell transplant. Case Rep Hematol.
2018:60926462018.PubMed/NCBI
|
|
6
|
Fu JH, Yang S, Nan CJ, Zhou CC, Lu DQ, Li
S and Mu HQ: MiR-182 affects renal cancer cell proliferation,
apoptosis, and invasion by regulating PI3K/AKT/mTOR signaling
pathway. Eur Rev Med Pharmacol Sci. 22:351–357. 2018.PubMed/NCBI
|
|
7
|
Wang X, Han L, Zhang J and Xia Q:
Down-regulated NRSN2 promotes cell proliferation and survival
through PI3K/Akt/mTOR pathway in hepatocellular carcinoma. Dig Dis
Sci. 60:3011–3018. 2015. View Article : Google Scholar : PubMed/NCBI
|
|
8
|
Silva A, Girio A, Cebola I, Santos CI,
Antunes F and Barata JT: Intracellular reactive oxygen species are
essential for PI3K/Akt/mTOR-dependent IL-7-mediated viability of
T-cell acute lymphoblastic leukemia cells. Leukemia. 25:960–967.
2011. View Article : Google Scholar : PubMed/NCBI
|
|
9
|
Carnero A and Paramio JM: The
PTEN/PI3K/AKT pathway in vivo, cancer mouse models. Front Oncol.
4:2522014. View Article : Google Scholar : PubMed/NCBI
|
|
10
|
Palomero T, Sulis ML, Cortina M, Real PJ,
Barnes K, Ciofani M, Caparros E, Buteau J, Brown K, Perkins SL, et
al: Mutational loss of PTEN induces resistance to NOTCH1 inhibition
in T-cell leukemia. Nat Med. 13:1203–1210. 2007. View Article : Google Scholar : PubMed/NCBI
|
|
11
|
Medyouf H, Gao X, Armstrong F, Gusscott S,
Liu Q, Gedman AL, Matherly LH, Schultz KR, Pflumio F, You MJ and
Weng AP: Acute T-cell leukemias remain dependent on Notch signaling
despite PTEN and INK4A/ARF loss. Blood. 115:1175–1184. 2010.
View Article : Google Scholar : PubMed/NCBI
|
|
12
|
Ultimo S, Martelli AM, Zauli G, Vitale M,
Calin GA and Neri LM: Roles and clinical implications of microRNAs
in acute lymphoblastic leukemia. J Cell Physiol. 233:5642–5654.
2018. View Article : Google Scholar : PubMed/NCBI
|
|
13
|
Pan Y, Liu G, Zhou F, Su B and Li Y: DNA
methylation profiles in cancer diagnosis and therapeutics. Clin Exp
Med. 18:1–14. 2018. View Article : Google Scholar : PubMed/NCBI
|
|
14
|
Yang Y, Zhao L, Huang B, Hou G, Zhou B,
Qian J, Yuan S, Xiao H, Li M and Zhou W: A new approach to
evaluating aberrant DNA methylation profiles in hepatocellular
carcinoma as potential biomarkers. Sci Rep. 7:465332017. View Article : Google Scholar : PubMed/NCBI
|
|
15
|
Momparler RL, Côté S, Momparler LF and
Idaghdour Y: Inhibition of DNA and histone methylation by
5-Aza-2′-deoxycytidine (Decitabine) and 3-deazaneplanocin-A on
antineoplastic action and gene expression in myeloid leukemic
cells. Front Oncol. 7:192017. View Article : Google Scholar : PubMed/NCBI
|
|
16
|
Almasri J, Alkhateeb HB, Firwana B, Sonbol
MB, Damlaj M, Wang Z, Murad MH and Al-Kali A: A systematic review
and network meta-analysis comparing azacitidine and decitabine for
the treatment of myelodysplastic syndrome. Syst Rev. 7:1442018.
View Article : Google Scholar : PubMed/NCBI
|
|
17
|
He PF, Zhou JD, Yao DM, Ma JC, Wen XM,
Zhang ZH, Lian XY, Xu ZJ, Qian J and Lin J: Efficacy and safety of
decitabine in treatment of elderly patients with acute myeloid
leukemia: A systematic review and meta-analysis. Oncotarget.
8:41498–41507. 2017. View Article : Google Scholar : PubMed/NCBI
|
|
18
|
Xie M, Jiang Q and Xie Y: Comparison
between decitabine and azacitidine for the treatment of
myelodysplastic syndrome: A meta-analysis with 1,392 participants.
Clin Lymphoma Myeloma Leuk. 15:22–28. 2015. View Article : Google Scholar : PubMed/NCBI
|
|
19
|
Uitdehaag JC, de Roos JA, van Doornmalen
AM, Prinsen MB, Spijkers-Hagelstein JA, de Vetter JR, de Man J,
Buijsman RC and Zaman GJ: Selective targeting of CTNBB1-, KRAS- or
MYC-driven cell growth by combinations of existing drugs. PLoS One.
10:e01250212015. View Article : Google Scholar : PubMed/NCBI
|
|
20
|
Livak KJ and Schmittgen TD: Analysis of
relative gene expression data using real-time quantitative PCR and
the 2(-Delta Delta C(T)) method. Methods. 25:402–408. 2001.
View Article : Google Scholar : PubMed/NCBI
|
|
21
|
Shi P, Zhang L, Chen K, Jiang Z, Deng M,
Zha J, Guo X, Li P and Xu B: Low-dose decitabine enhances
chidamide-induced apoptosis in adult acute lymphoblast leukemia,
especially for p16-deleted patients through DNA damage.
Pharmacogenomics. 18:1259–1270. 2017. View Article : Google Scholar : PubMed/NCBI
|
|
22
|
Simioni C, Martelli AM, Zauli G, Melloni E
and Neri LM: Targeting mTOR in acute lymphoblastic leukemia. Cells.
8:1902019. View Article : Google Scholar
|
|
23
|
Bertacchini J, Heidari N, Mediani L,
Capitani S, Shahjahani M, Ahmadzadeh A and Saki N: Targeting
PI3K/AKT/mTOR network for treatment of leukemia. Cell Mol Life Sci.
72:2337–2347. 2015. View Article : Google Scholar : PubMed/NCBI
|
|
24
|
Fransecky L, Mochmann LH and Baldus CD:
Outlook on PI3K/AKT/mTOR inhibition in acute leukemia. Mol Cell
Ther. 3:22015. View Article : Google Scholar : PubMed/NCBI
|
|
25
|
Wang X, Huang H and Young KH: The PTEN
tumor suppressor gene and its role in lymphoma pathogenesis. Aging
(Albany NY). 7:1032–1049. 2015. View Article : Google Scholar : PubMed/NCBI
|
|
26
|
Pulido R: PTEN inhibition in human disease
therapy. Molecules. 23:2852018. View Article : Google Scholar
|
|
27
|
Onda K, Suzuki R, Tanaka S, Oga H, Oka K
and Hirano T: Decitabine, a DNA methyltransferase inhibitor,
reduces P-glycoprotein mRNA and protein expressions and increases
drug sensitivity in drug-resistant MOLT4 and Jurkat cell lines.
Anticancer Res. 32:4439–4444. 2012.PubMed/NCBI
|
|
28
|
Atallah E, Kantarjian H and Garcia-Manero
G: The role of decitabine in the treatment of myelodysplastic
syndromes. Expert Opin Pharmacother. 8:65–73. 2007. View Article : Google Scholar : PubMed/NCBI
|
|
29
|
Bohl SR, Bullinger L and Rücker FG:
Epigenetic therapy: Azacytidine and decitabine in acute myeloid
leukemia. Expert Rev Hematol. 11:361–371. 2018. View Article : Google Scholar : PubMed/NCBI
|
|
30
|
Liu J, Huang C, Cheng H, Tang G, Hu X,
Zhou H, Wang J and Yang J: Effects of decitabine against acute T
lymphoblastic leukemia cell line Molt4. Zhonghua Xue Ye Xue Za Zhi.
36:230–234. 2015.(In Chinese). PubMed/NCBI
|
|
31
|
Deng M, Zhang W, Tang H, Ye Q, Liao Q,
Zhou Y, Wu M, Xiong W, Zheng Y, Guo X, et al: Lactotransferrin acts
as a tumor suppressor in nasopharyngeal carcinoma by repressing AKT
through multiple mechanisms. Oncogene. 32:4273–4283. 2013.
View Article : Google Scholar : PubMed/NCBI
|
|
32
|
Giansanti F, Panella G, Leboffe L and
Antonini G: Lactoferrin from milk: Nutraceutical and
pharmacological properties. Pharmaceuticals (Basel). 9:612016.
View Article : Google Scholar
|
|
33
|
Drago-Serrano ME, Campos-Rodriguez R,
Carrero JC and de la Garza M: Lactoferrin: Balancing ups and downs
of inflammation due to microbial infections. Int J Mol Sci.
18:5012017. View Article : Google Scholar
|
|
34
|
Ksionda O, Melton AA, Bache J, Tenhagen M,
Bakker J, Harvey R, Winter SS, Rubio I and Roose JP: RasGRP1
overexpression in T-ALL increases basal nucleotide exchange on Ras
rendering the Ras/PI3K/Akt pathway responsive to protumorigenic
cytokines. Oncogene. 35:3658–3668. 2016. View Article : Google Scholar : PubMed/NCBI
|
|
35
|
Kim YI, Park SW, Kwon HS, Yang HS, Cho SY,
Kim YJ and Lee HJ: Inhibin-α gene mutations and mRNA levels in
human lymphoid and myeloid leukemia cells. Int J Oncol.
50:1403–1412. 2017. View Article : Google Scholar : PubMed/NCBI
|
|
36
|
Davies C, Hogarth LA, Dietrich PA,
Bachmann PS, Mackenzie KL, Hall AG and Lock RB: p53-independent
epigenetic repression of the p21(WAF1) gene in T-cell acute
lymphoblastic leukemia. J Biol Chem. 286:37639–37650. 2011.
View Article : Google Scholar : PubMed/NCBI
|