Introduction
Osteosarcoma is the most common malignant bone tumor
that occurs predominantly in adolescents and young adults (1,2). Despite
significant progress in the management of osteosarcoma, no
significant improvement in the survival rate has been achieved over
the past three decades (3). Despite
the continuous improvement of surgical techniques and the
application of neoadjuvant chemotherapy, the 5-year non-invasive
survival rate has remained <70% for decades (4,5).
Patients with metastatic or recurrent osteosarcoma have a poor
prognosis, with a 5-year event-free survival of <30% (6–8). Hence,
more effective treatment strategies are needed to improve the
prognosis of these patients.
Recently, a number of studies have aimed to
elucidate the interaction between the immune system and tumors, and
to identify potential targets within this interaction as
therapeutic interventions (9–11). In
numerous malignant tumors, the composition of the tumor
microenvironment (TME) requires the participation of innate and
adaptive immune cells, which interact with lymphocytes, natural
killer cells (NK) and antigen-presenting cells, such as dendritic
cells (DC) and macrophages, to effectively control the tumor
(12). Abnormal immune cell function
can result in poor tumor monitoring and clearance, can exacerbate
local inflammation, and can establish a conducive environment for
tumor growth, thus facilitating tumor progression (13,14).
Although previous studies have indicated that immune cells may act
on osteosarcoma (15,16), the precise mechanisms underlying the
function of the immune microenvironment in osteosarcoma are not
well known. Therefore, it is important to elucidate the
immunophenotype of the interaction between tumors and immune cells,
and to identify novel immune-related therapeutic targets for
osteosarcoma.
Bone morphogenetic protein receptor 2 (BMPR2) is a
member of the TGF-β superfamily, which is reported to play a dual
role in regulating tumor growth. In some tumors, BMPR2 acts as a
tumor suppressor gene. For example, a lack of BMPR2 expression in
the colonic matrix has been found to lead to colonic epithelial
hyperplasia and polyps (17). In
addition, deficient BMPR2 expression is more likely in bladder
transitional cell carcinoma tissues compared with in normal tissues
(18). Meanwhile, in some other
tumors, BMPR2 functions as an oncogene. For example, in colorectal
cancer where Smad4 is absent, BMPR2 can bind to LIM domain kinase 1
to activate the Rho/Rho-associated protein kinase (ROCK) pathway,
thereby promoting tumor invasion and metastasis (19). In addition, BMPR2-overexpression is
associated with poor prognosis in patients with resected
osteosarcoma (20). Notably, a
recent study revealed that BMP4 secreted by bladder cancer cells
induced M2 macrophage polarization in a tumor-promoting immune
environment, favoring tumor progression (21). However, the potential role of BMPR2
in tumor progression and its exact mechanism in osteosarcoma is not
clear.
The present study comprehensively analyzed BMPR2
expression levels and their relationship with the prognosis of
patients with osteosarcoma in databases such as Gene Expression
Omnibus (GEO), Oncomine and R2. Furthermore, the relationship
between BMPR2 and immune tumor-infiltrating cells in the
osteosarcoma microenvironment was investigated using the Tumor
Immune Estimation Resource (TIMER) and CIBERSORT. The study
demonstrated the important role of BMPR2 in osteosarcoma and showed
latent mechanisms in the BMPR2 and tumor-immune interactions. These
findings will improve our knowledge about the of tumor
immuno-microenvironment in osteosarcoma.
Materials and methods
Oncomine database analysis
Data for the expression level of the BMPR2 gene in
different types of tumors was gathered from the Oncomine cancer
database (https://www.oncomine.org/resource/login.html)
(22). The thresholds for
significance were P<0.05, fold-change of 2.0.
R2 database analysis
The difference in the BMPR2 expression level between
sarcoma and normal tissue, as well as the relationship between
BMPR2 expression and survival in osteosarcoma, was calculated using
the R2 database (https://hgserver1.amc.nl/cgi-bin/r2/main.cgi). Since
the sample size of the sarcoma dataset in the Oncomine database was
small, the expression level of BMPR2 was further analyzed in
osteosarcoma and rhabdomyosarcoma using the R2 platform. R2
searches a large number of publicly available cancer microarray
datasets (23–26) (for relationships between gene
expression and patient prognosis, such as the time period for
overall survival (OS) and metastasis-free survival. The threshold
was set to a Cox P<0.05. The correlation coefficient was
calculated by Spearman's method. Unpaired t-tests were applied to
identify the differences of two groups, and P<0.05 was
considered to indicate a statistically significant difference.
Sample information
The normalized expression data for patients with
osteosarcoma were obtained from the GEO database (GSE33382).
GSE33382 is one of the osteosarcoma datasets of the R2 platform
(24). The clinical information
including age, sex, tumor site, metastasis within 5 years,
histological subtype and Huvos classification (27) was also extracted. Information from a
total of 83 cases of osteosarcoma was obtained, including
expression data and clinical data.
The Cancer Genome Atlas (TCGA)
database analysis
The gene expression quantification data of 88
osteosarcoma samples were downloaded from TCGA (cancer.gov/tcga) on May 22, 2020. Updated clinical
data about these osteosarcoma samples, such as age, sex, overall
survival time and vital status, were also downloaded from the
TARGET database (https://ocg.cancer.gov/programs/target) on May 22,
2020. Finally, information on a total of 85 cases of osteosarcoma
was obtained, including expression data and clinical data.
TIMER database analysis
The TIMER Database (https://cistrome.shinyapps.io/timer/), a comprehensive
database for the systematic analysis of immune invasion, was used
to investigate the infiltrating pattern of immune cells in
osteosarcoma (28). The links
between BMPR2 expression and the proportions of infiltrated immune
cells, including CD4+ T, CD8+ T and B cells, macrophages,
neutrophils and dendritic cells, were investigated using gene
modules. Furthermore, the relationship between the expression level
of BMPR2 and tumor infiltrating immune cell gene markers was
investigated through correlation modules. Genetic markers for tumor
infiltrating lymphocytes included markers of B cells, CD8+ T cells,
T cells (general), monocytes, tumor-associated macrophages (TAMs),
M1 macrophages, M2 macrophages, dendritic cells (DCs), neutrophils,
natural killer (NK), follicular helper T (Tfh), regulatory T
(Tregs), T helper 1 (Th1), Th2, Th17 and exhausted T cells. These
genetic markers were taken from previous studies (29–31). The
correlation module analyzed and generated a scatter plot of
expression between a pair of user-defined genes in a certain cancer
type, as well as Spearman's correlation and estimated statistical
significance. BMPR2 was used for the y-axis with gene symbols, and
related marker genes are represented on the x-axis as gene symbols.
The gene expression level was displayed with log2 RNA-Seq by
Expectation-Maximization.
CIBERSORT analysis
CIBERSORT (https://cibersort.stanford.edu/index.php) uses a
deconvolution algorithm to evaluate the pattern of tumor
infiltrating lymphocytes in the TME. According to the standardized
expression data in the tumor, the abundance of 22 types of
infiltrating immune cells was analyzed by the CIBERSORT method
(32). The immune cell profiles of
all osteosarcoma samples were analyzed using CIBERSORT, and the
number of permutations was set to 100. Samples of osteosarcoma with
a P<0.05 were included.
Gene set enrichment analysis
(GSEA)
To identify the potential biological mechanisms
between two biological states, GSEA was performed (33). The gene sets were collected from the
Molecular Signatures Database (33)
(‘c5.bp.v7.0.symbols.gmtb (Gene Ontology)’). GSEA (3.0) was used to
analyze the potential biological processes and signaling pathways
associated with BMPR2 that affect the prognosis of osteosarcoma.
The normalized enrichment score was obtained by performing gene set
permutations with 1,000 times. The nominal (NOM) P<0.05 was used
to quantify statistically significant enrichment. GSEA was
performed (false discovery rate <0.25, nominal P<0.05) in the
enrichment of ‘c5.bp.v7.0.symbols.gmtb (Gene Ontology)’.
Statistical analysis
Kaplan-Meier analysis with log-rank was used. The
results from the Oncomine database analysis are displayed as
P-values, fold-changes and ranks. Survival curves were generated by
the R2 Platform. Spearman's correlation was used to assess the
correlation of gene expression, P<0.05 was considered to
indicate a statistically significant difference. The strength of
the correlation was also determined by rs-value
correlation with rs-value >0.3 or <-0.3 was
considered as significant and between −0.3 to 0.3 was considered as
weak or negligible correlation. The relationships between BMPR2
expression and tumor-infiltrating immune cells were analyzed using
SPSS software (version 20). The correlations between BMPR2
expression and the clinicopathological features of osteosarcoma
were evaluated by logistic regression analysis. The matrix data of
gene expression levels were normalized with the limma package of R
software (version 3.5.2) (34) and R
studio (version 1.2.5001) (35). The
specificity and sensitivity of survival prediction according to
BMPR2 expression levels were analyzed by time-dependent receiver
operating characteristic (ROC) curves, whose area under the curve
(AUC) values quantified with the pROC package (https://cran.rstudio.com/bin/macosx/contrib/4.0/pROC_1.16.2.tgz).
Results
BMPR2 mRNA expression levels in
different types of human cancer
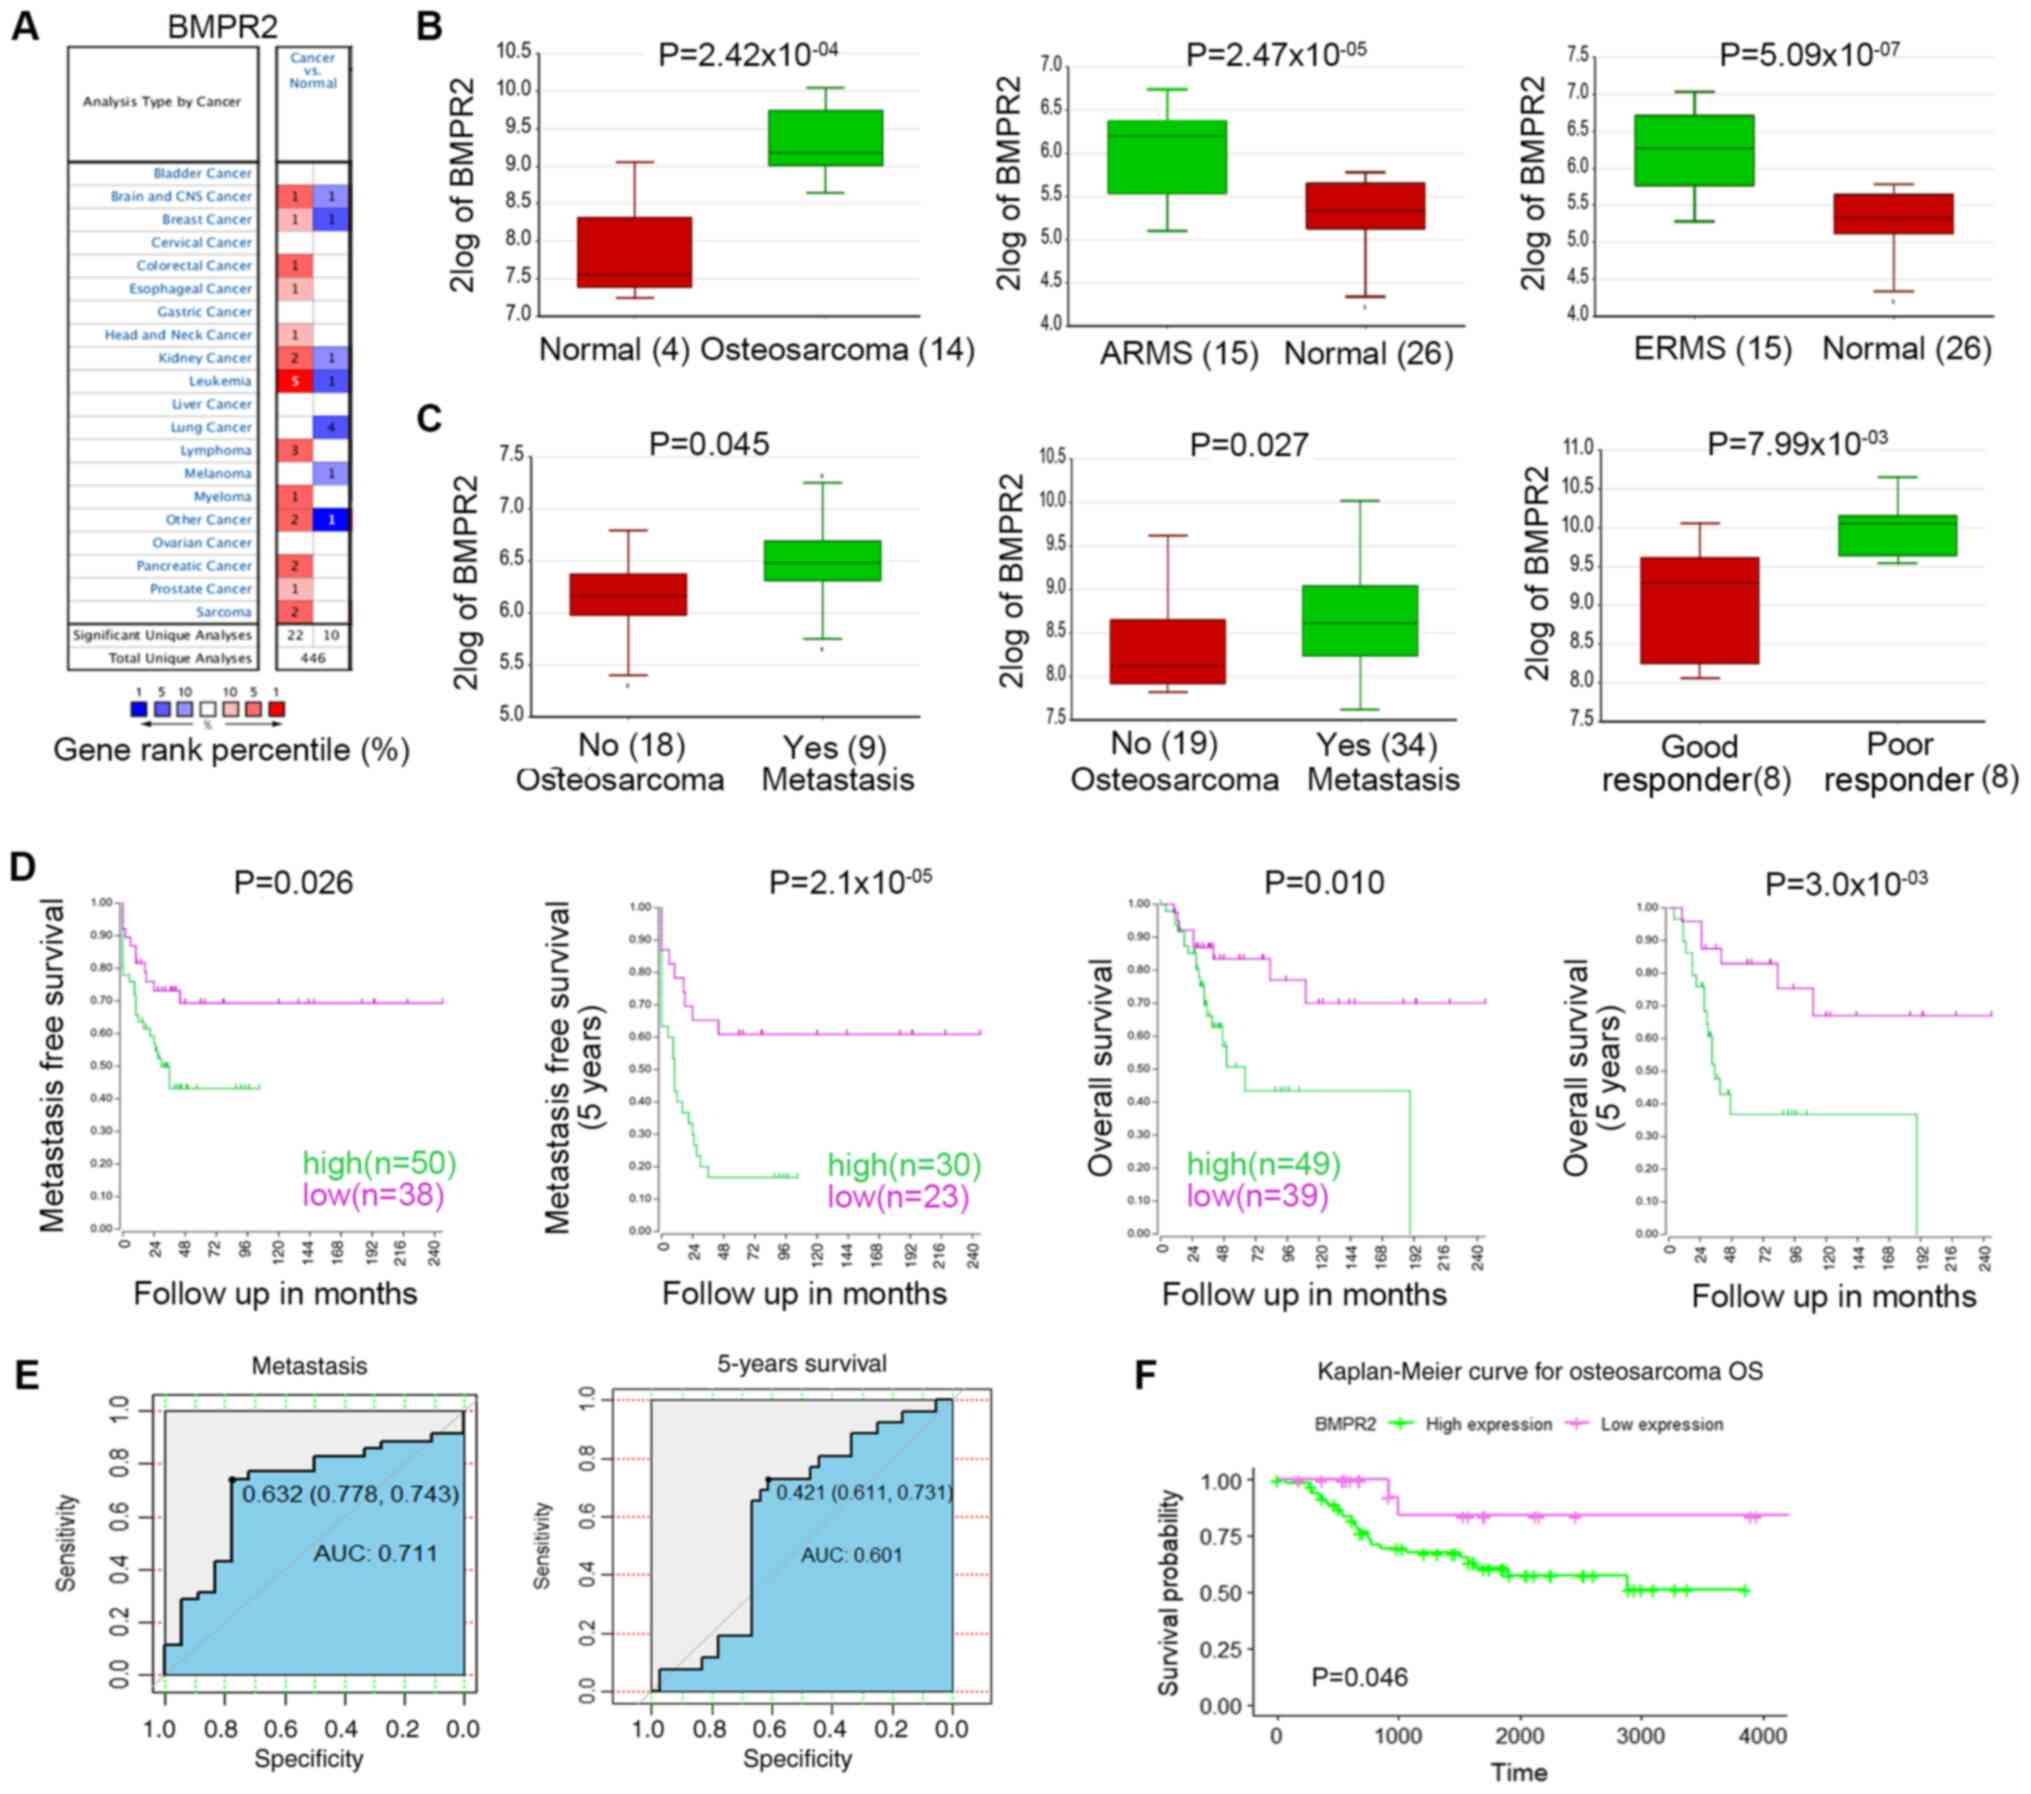
To verify the difference in the BMPR2 expression
level between tumors and normal tissues, the Oncomine database was
used to analyze the levels of BMPR2 mRNA in different types of
tumors and the corresponding normal tissues. The results showed
that BMPR2 expression was higher in brain and CNS
(oligodendroglioma), breast (invasive ductal breast carcinoma),
colorectal (rectal mucinous adenocarcinoma), esophageal (esophageal
adenocarcinoma) and kidney cancer (clear cell sarcoma of the kidney
and renal oncocytoma), leukemia (chronic lymphocytic leukemia),
head and neck cancer (floor of the mouth carcinoma), lymphoma
tumors (follicular lymphoma and germinal center B-cell-like diffuse
large B-cell lymphoma), pancreatic (pancreatic ductal
adenocarcinoma) and prostate cancer (prostate carcinoma), sarcomas
(clear cell sarcoma of the kidney) and others, including skin basal
cell carcinoma and teratoma, compared with in normal tissues
(Fig. 1A; Table I). Meanwhile, BMPR2 expression was
lower in glioblastoma, lung cancer (large cell lung carcinoma, lung
adenocarcinoma and squamous cell lung carcinoma), invasive lobular
breast carcinoma, chromophobe renal cell carcinoma, T cell
prolymphocytic leukemia, skin basal cell carcinoma and myeloma
compared with in normal tissues. Detailed results of BMPR2
expression in various types of cancer are listed in Table I.
 | Table I.BMPR2 expression in cancer vs. normal
tissue in the Oncomine database. |
Table I.
BMPR2 expression in cancer vs. normal
tissue in the Oncomine database.
| Cancer | P-value | Fold-change | Rank, % | Sample size | (Refs.) |
|---|
| Brain and CNS
cancer |
|
|
|
|
|
|
Oligodendroglioma |
5.19×10⁻⁸ | 2.132 | 5 | 73 | Sun et al
(70) |
|
Glioblastoma |
6.73×10⁻⁴ | −3.216 | 7 | 15 | TCGAa |
| Breast cancer |
|
|
|
|
|
|
Invasive ductal breast
carcinoma |
1.60×10⁻² | 2.896 | 6 | 25 | Turashvili et
al (71) |
|
Invasive lobular breast
carcinoma |
1.40×10⁻² | −2.075 | 3 | 25 | Turashvili et
al (71) |
| Colorectal
cancer |
|
|
|
|
|
| Rectal
mucinous adenocarcinoma |
2.10×10⁻⁴ | 2.171 | 5 | 9 | Kaiser et al
(72) |
| Esophagus
cancer |
|
|
|
|
|
|
Esophageal adenocarcinoma |
6.11×10⁻⁴ | 2.529 | 9 | 5 | Hao et al
(73) |
| Head and neck
cancer |
|
|
|
|
|
| Floor
of the mouth carcinoma |
1.61×10⁻⁴ | 3.473 | 7 | 5 | Pyeon et al
(74) |
| Kidney cancer |
|
|
|
|
|
| Clear
cell sarcoma |
4.44×10⁻⁴ | 2.479 | 4 | 17 | Cutcliffe et
al (75) |
| Renal
oncocytoma |
1.00×10⁻³ | 2.37 | 6 | 9 | Yusenko et
al (76) |
|
Chromophobe renal cell
carcinoma |
7.00×10⁻³ | −2.961 | 6 | 9 | Yusenko et
al (76) |
| Leukemia |
|
|
|
|
|
| Chronic
lymphocytic leukemia |
2.96×10⁻¹³ | 3.465 | 1 | 12 | Alizadeh et
al (77) |
| Chronic
lymphocytic leukemia |
1.69×10⁻¹⁰ | 2.589 | 1 | 39 | Rosenwald et
al (78) |
| Chronic
lymphocytic leukemia |
1.23×10−92 | 3.446 | 1 | 448 | Haferlach et
al (79) |
| Chronic
lymphocytic leukemia |
1.00×10⁻³ | 2.188 | 7 | 3 | Rosenwald et
al (80) |
| Chronic
lymphocytic leukemia |
1.50×10⁻⁶ | 3.205 | 5 | 34 | Basso et al
(81) |
| T cell
prolymphocytic leukemia |
6.04×10⁻⁴ | −2.972 | 3 | 6 | Dürig et al
(82) |
| Lung cancer |
|
|
|
|
|
| Lung
adenocarcinoma |
5.66×10⁻¹⁷ | −2.281 | 3 | 43 | Hou et al
(83) |
| Large
cell lung carcinoma |
1.08×10⁻¹² | −2.775 | 3 | 19 | Hou et al
(83) |
|
Squamous cell lung
carcinoma |
6.86×10⁻¹⁷ | −3.47 | 3 | 27 | Hou et al
(83) |
| Lymphoma |
|
|
|
|
|
|
Follicular lymphoma |
7.00×10⁻³ | 2.425 | 5 | 6 | Basso et al
(81) |
|
Germinal center B cell-like
diffuse large |
3.31×10⁻⁶ | 2.934 | 3 | 9 | Compagno et
al (84) |
| B cell
lymphoma |
|
|
|
|
|
|
Follicular lymphoma |
3.99×10⁻⁹ | 3.239 | 9 | 38 | Compagno et
al (84) |
| Myeloma |
|
|
|
|
|
|
Non-neoplastic nevus |
4.00×10⁻³ | −2.388 | 7 | 9 | Haqq et al
(85) |
| Pancreatic
cancer |
|
|
|
|
|
|
Pancreatic ductal
adenocarcinoma |
1.82×10⁻¹² | 2.055 | 2 | 39 | Badea et al
(86) |
|
Pancreatic adenocarcinoma |
1.82×10⁻¹² | 3.078 | 6 | 12 | Iacobuzio-Donahue
et al (87) |
| Prostate
cancer |
|
|
|
|
|
|
Prostate carcinoma |
2.70×10⁻² | 4.768 | 8 | 15 | Luo et al
(88) |
| Sarcoma |
|
|
|
|
|
| Clear
cell sarcoma of the kidney |
4.44×10⁻⁴ | 2.479 | 4 | 14 | Cutcliffe et
al (75) |
|
Gastrointestinal stromal
tumor |
3.69×10⁻⁴ | 2.62 | 7 | 6 | Cho et al
(89) |
| Other |
|
|
|
|
|
| Skin
basal cell carcinoma |
2.51×10⁻⁵ | 2.144 | 3 | 15 | Riker et al
(90) |
|
Teratoma, NOS |
2.48×10−08 | 2.606 | 4 | 14 | Korkola et
al (91) |
| Skin
basal cell carcinoma |
5.08×10−06 | −2.996 | 1 | 15 | Riker et al
(90) |
The results revealed that BMPR2 expression was
higher in osteosarcoma, acinar rhabdomyosarcoma (ARMS) and
embryonal rhabdomyosarcoma (ERMS) compared with in normal tissues
(Fig. 1B). BMPR2 expression was
significantly higher in metastatic osteosarcomas compared with in
non-metastatic osteosarcomas. Its expression was also significantly
higher in sarcomas that did not respond well to chemotherapy
compared with in those that did (Fig.
1C). These data suggested that BMPR2 is a protumor gene in
osteosarcoma and rhabdomyosarcoma.
High BMPR2 expression impacts the
prognosis of patients with osteosarcoma
To improve our understanding of the role and
underlying mechanism of BMPR2 expression in osteosarcoma, the
relationship between BMPR2 expression and the clinicopathological
features of patients with osteosarcoma was examined in the R2
database. High expression levels of BMPR2 indicated worse OS and
metastasis-free survival (Fig. 1D).
In addition, patients with osteosarcoma with high BMPR2 expression
had a 2.794 times greater risk of metastasis within 5 years
compared with those without metastasis (Table II). The specificity and sensitivity
of metastatic and survival prediction according to the expression
level of BMPR2, as shown by time-dependent ROC curves, were
analyzed to evaluate its ability to predict metastasis and survival
in patients. The results suggested that the AUC for the expression
level of BMPR2 in predicting metastatic and 5-year survival were
0.711 and 0.601, respectively (Fig.
1E). The relationship between BMPR2 expression level and the
prognosis of osteosarcoma was also analyzed using TCGA database.
The results showed that patients with high expression levels of
BMPR2 had worse OS (Fig. 1F). These
data indicated that a high BMPR2 expression level serves as an
adverse factor in the prognosis of osteosarcoma.
| Table II.Association between high bone
morphogenetic protein receptor 2 expression with
clinicopathological characteristics of osteosarcoma. |
Table II.
Association between high bone
morphogenetic protein receptor 2 expression with
clinicopathological characteristics of osteosarcoma.
| Factors | OR | CI | P-value | Value, n |
|---|
| Sex, female vs.
male | 0.908 | 0.638–1.291 | 0.629 | 71 |
| Age, <16 vs. ≥16
years | 1.047 | 0.743–1.473 | 0.825 | 83 |
| Tumor site, femur
vs. tibia/fibula | 0.856 | 0.577–1.268 | 0.466 | 68 |
| Metastasis within 5
years, yes vs. no | 2.794 | 1.282–6.089 | 0.001 | 53 |
| Histological
subtype |
|
|
|
|
|
Osteolastic vs.
chondroblastic | 0.985 | 0.637–1.523 | 1.000 | 68 |
|
Osteolastic vs.
fibroblastic | 1.436 | 0.594–3.469 | 0.427 | 59 |
| Huvos
grade, 1 and 2 vs. 3 and 4 | 0.908 | 0.638–1.291 | 0.629 | 71 |
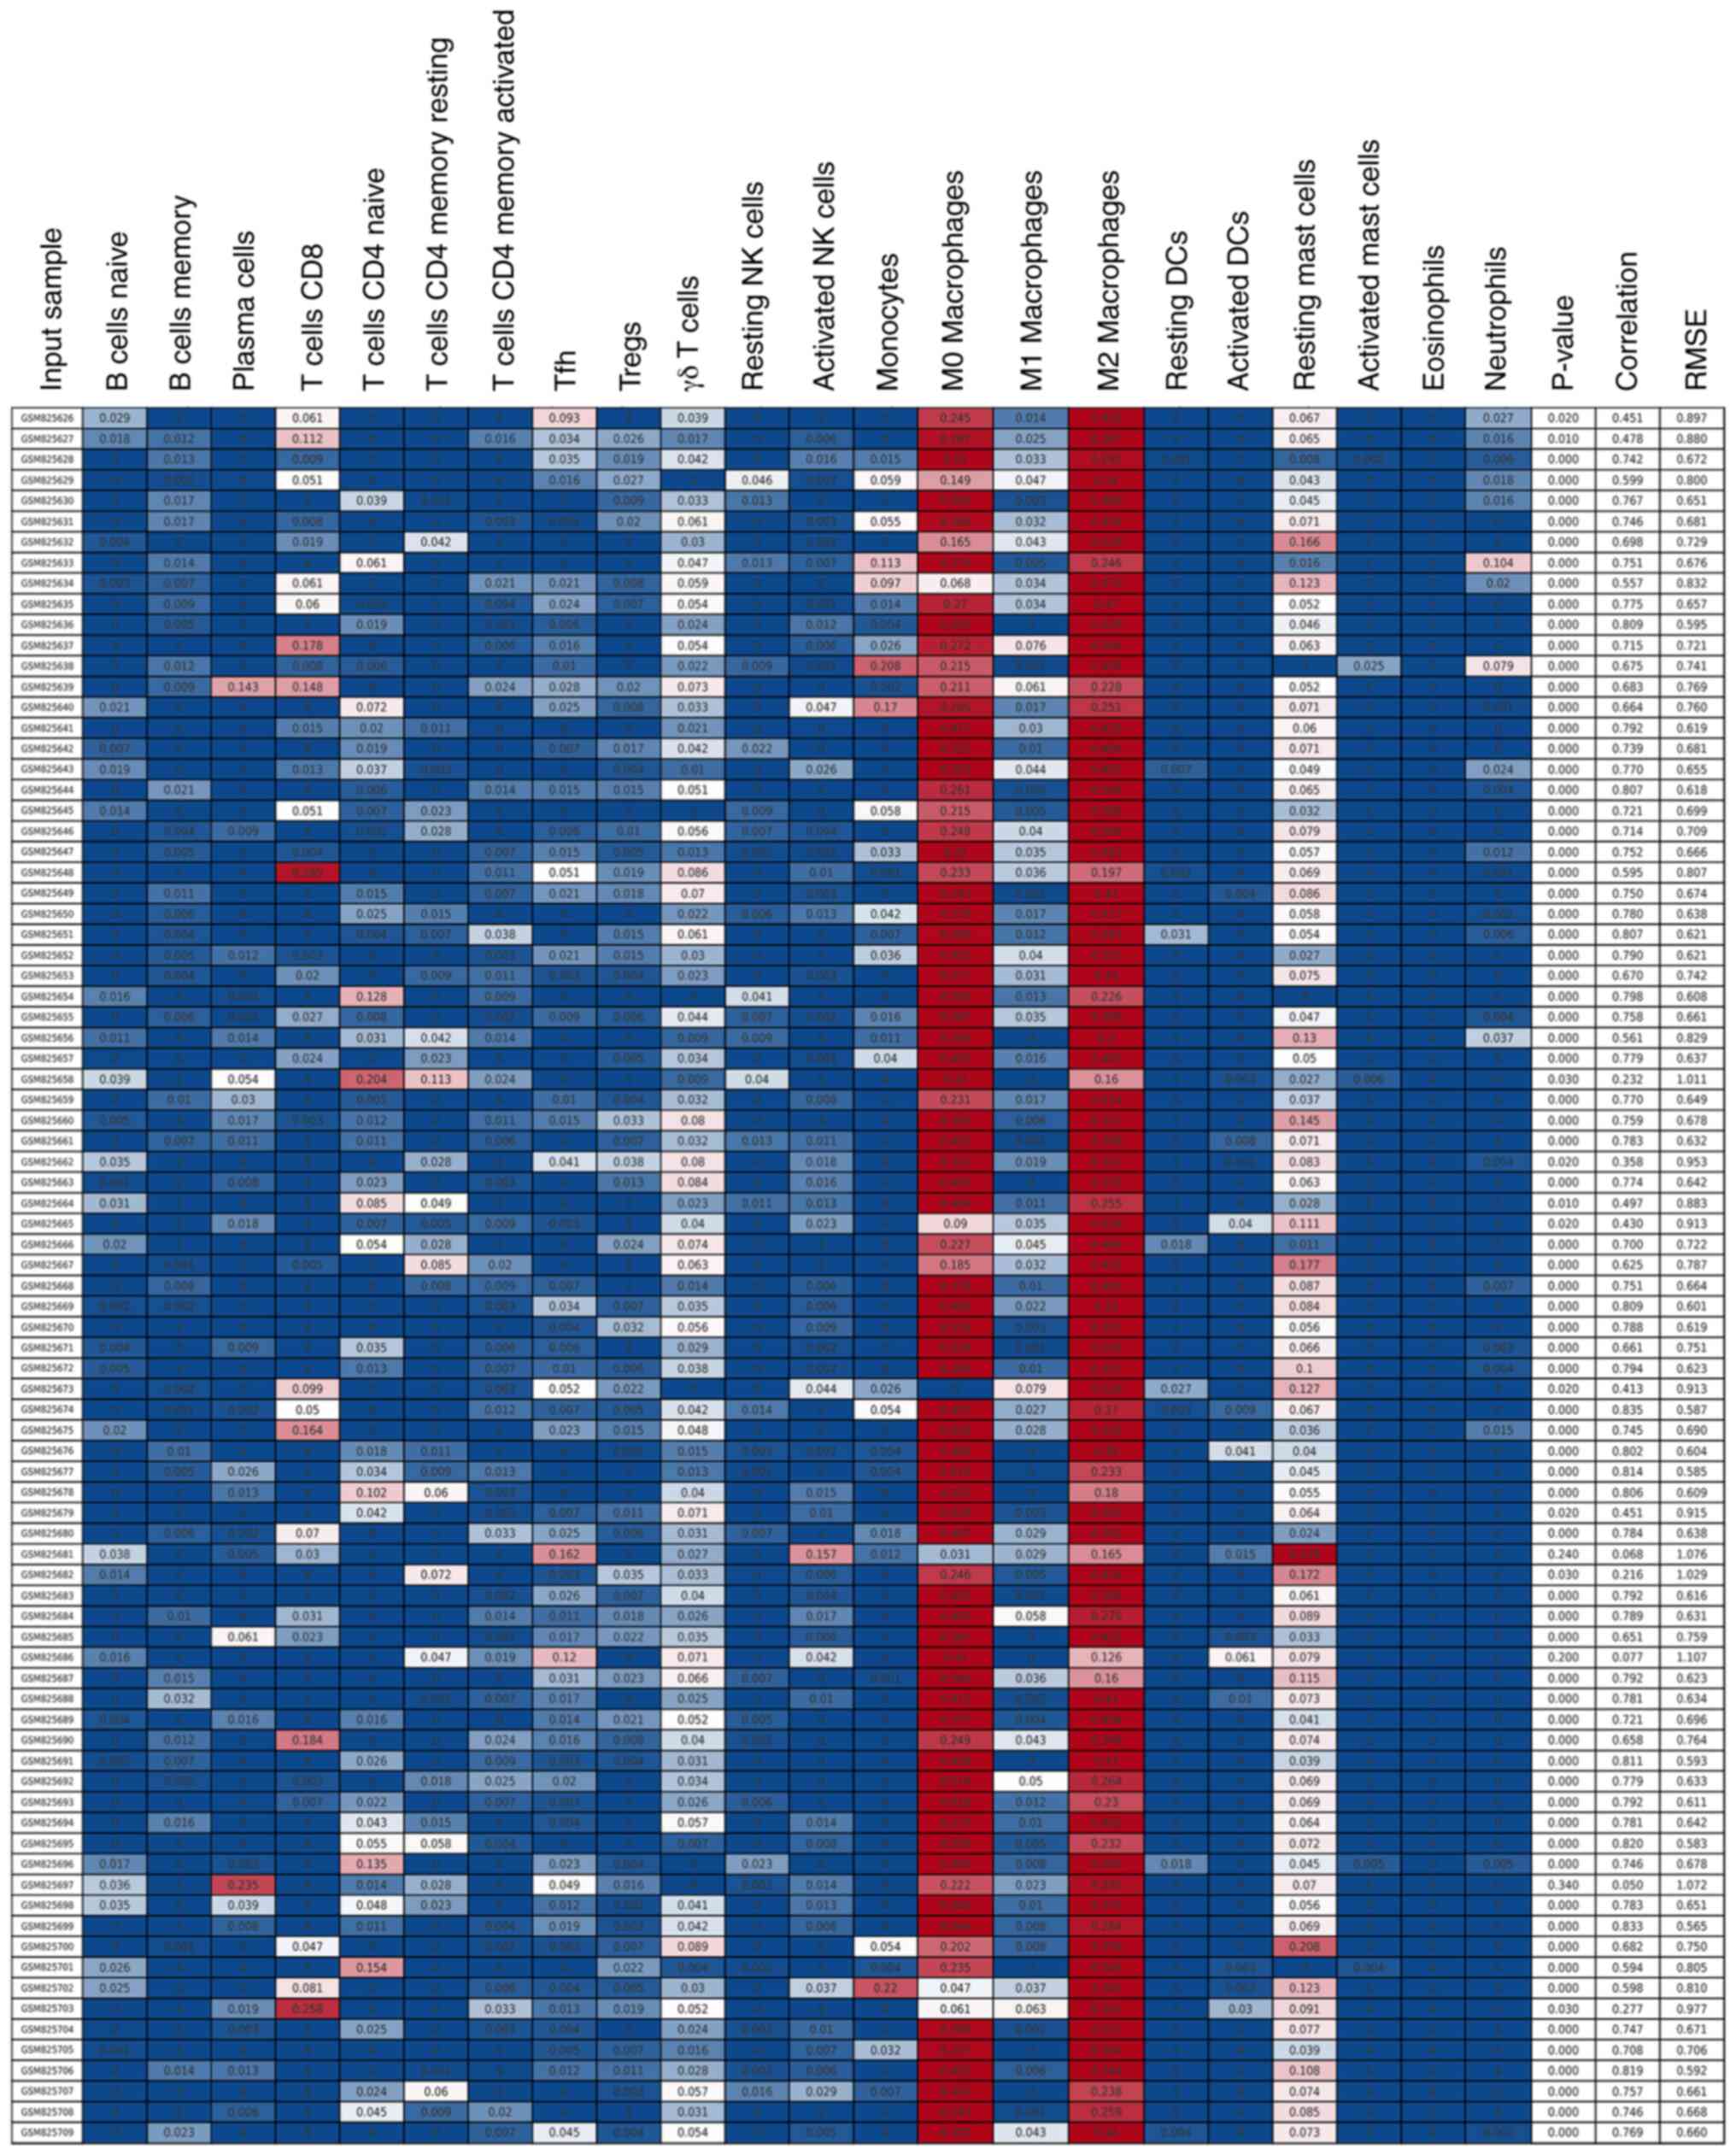
Infiltrating immune cells in
osteosarcoma
It has been reported that malignant tumors tend to
construct an immunosuppressive microenvironment by interacting with
their stromal contents, including infiltrating immune cells
(35). However, the function and
mechanism of infiltrating immune cells in regulating the
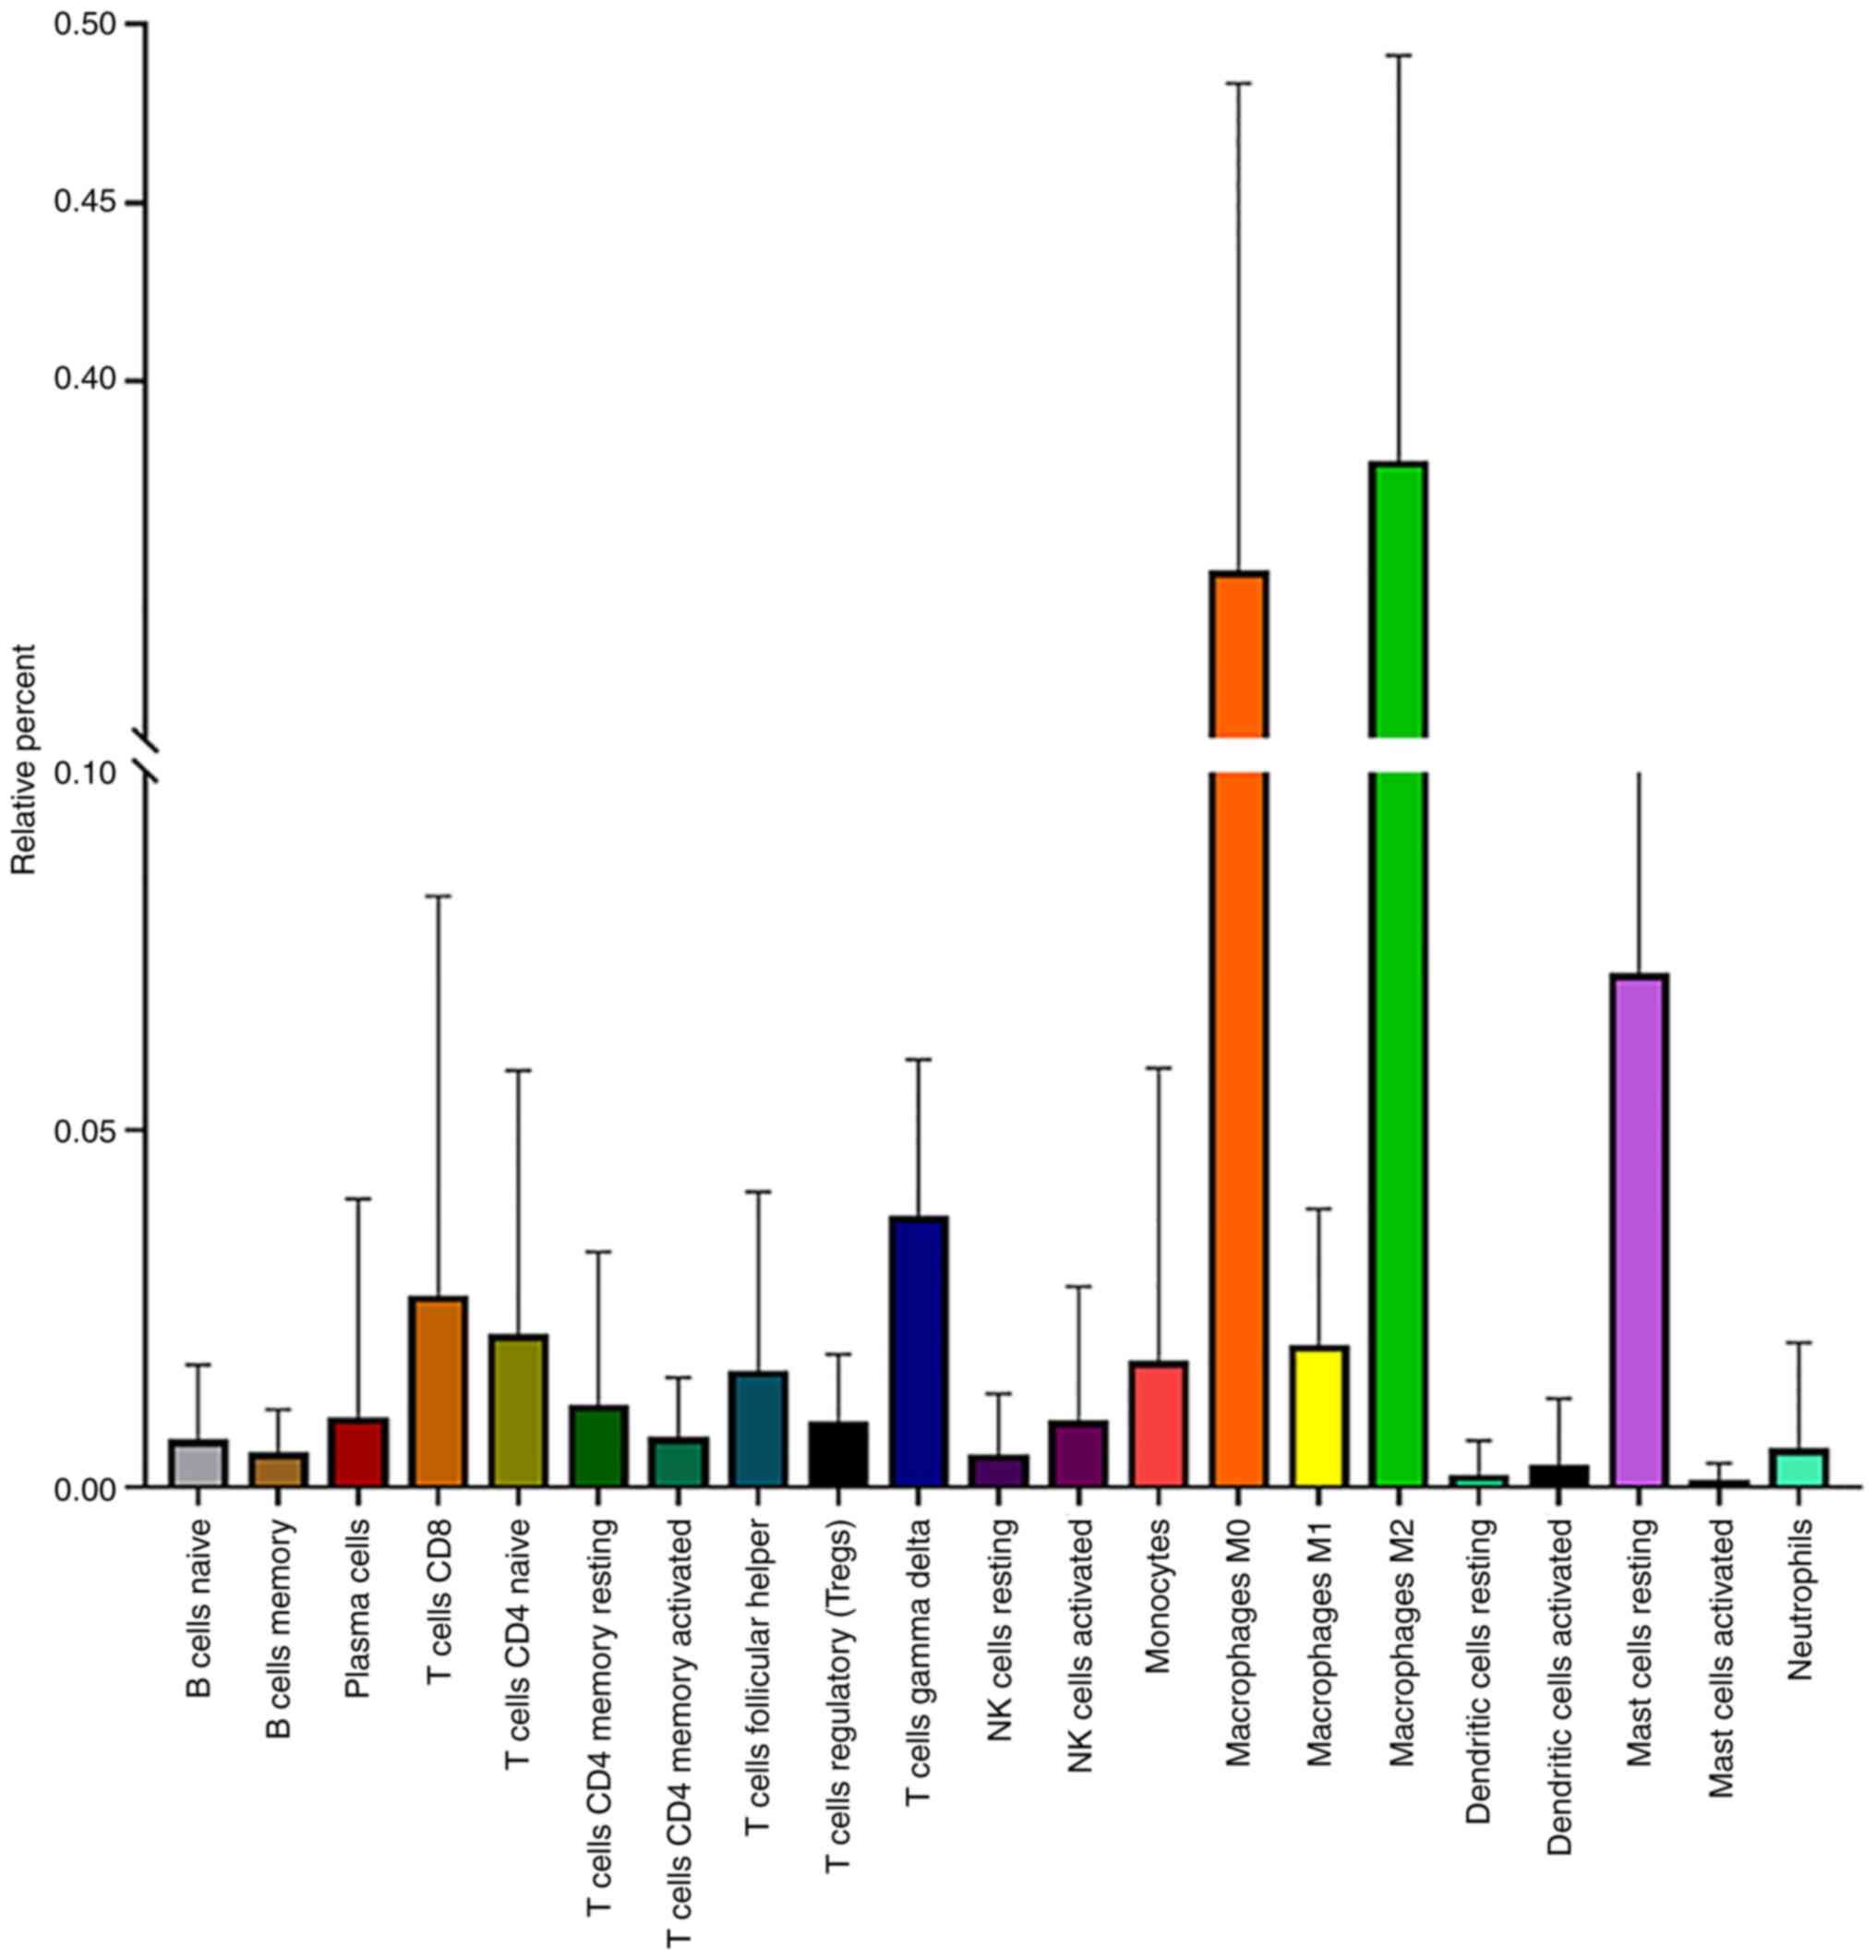
microenvironment of osteosarcoma remain unclear. Therefore, 81
osteosarcoma samples with a P<0.05 were obtained by the
CIBERSORT method (Fig. 2). Among 22
immune cell types, M2 macrophages, M0 macrophages, resting mast, γ
δ T and CD8+ T cells were the top five immune cells with the
highest degree of infiltration in osteosarcoma (Fig. 3). These results indicated that these
five immune cells play important roles in maintaining the immune
microenvironment of osteosarcoma.
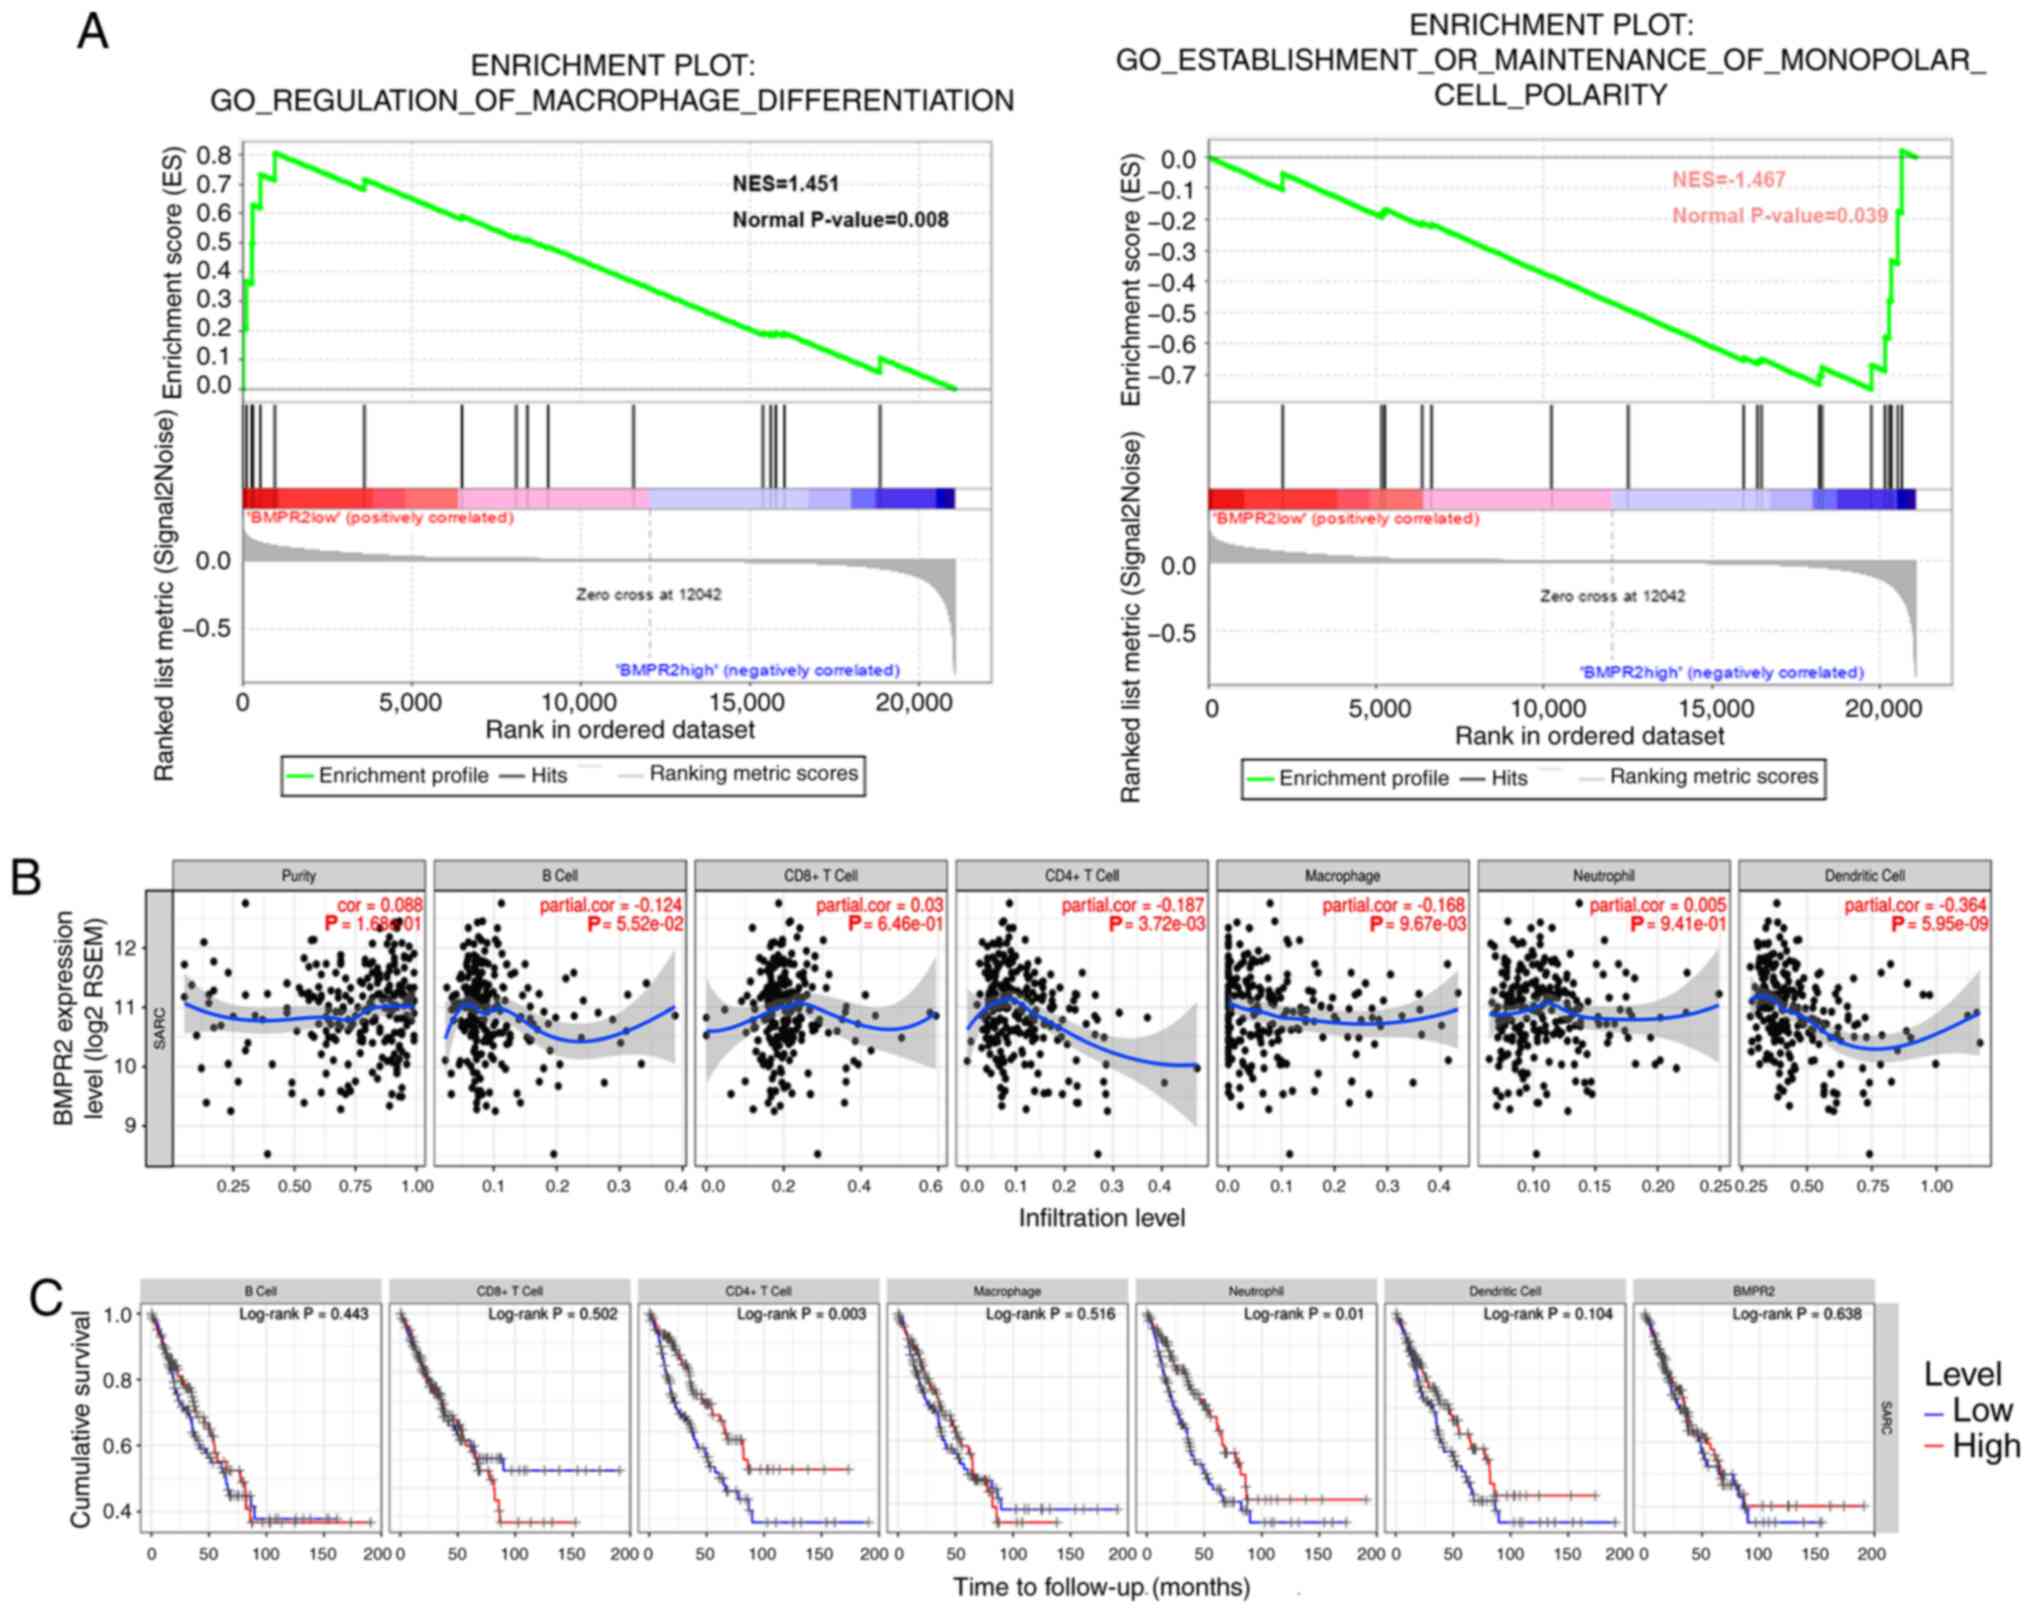
Correlation analysis between BMPR2
expression and immune marker sets
To investigate the signaling pathways activated by
BMPR2 in osteosarcoma cells, GSEA was performed. The significant
results are displayed in Figs. S1,
S2A and B (NOM P<0.05) in the
enrichment of ‘c5.bp.v7.0.symbols.gmtb (Gene Ontology)’. Notably,
the data showed that the ‘regulation of the macrophage
differentiation pathway’ and ‘establishment or maintenance of the
monopolar cell polarity pathway’ were modulated by BMPR2 (Fig. 4A).
Additionally, the correlation between BMPR2
expression and immune cell infiltration in sarcoma was studied in
the TIMER database. The results suggested that the BMPR2 expression
level was inversely correlated with the concentrations of DCs. CD4+
T cells (P=3.72×10⁻³) and macrophages
(P=9.67×10⁻³) was statistically significant with
P-values, while the strength of the correlation was weak or
negligibly according to the aforementioned cut-offs (Fig. 4B). In addition, low infiltration of
CD4+ T cells and neutrophils were associated with worse survival
(Fig. 4C).
To further explore the correlations between the
expression level of BMPR2 and the degrees of infiltration of
different types of immune cells, the relationship between the
expression of BMPR2 and the marker genes of various lymphocytes in
sarcomas was investigated using the TIMER database. The detailed
results about the relationships between BMPR2 expression and immune
marker sets of various types of immune cells, including T
(general), B and CD8+ T cells, monocytes, TAMs, M1 and M2
macrophages, NKs, DCs, neutrophils, Th1, Th2, Th17 and Tfh cells,
Tregs and exhausted T cells in sarcoma, are shown (Table III, Figs. 4, 5A
and S3). Notably, the data reported
that the majority of marker sets of the immune cells, including
gene markers of T (general), B and CD8+ T cells, monocytes, TAMs,
M1 and M2 macrophages, DCs, neutrophils, Th1, Th2 and Th17 cells,
Tregs and exhausted T cells, had significant negative correlations
with BMPR2 expression in sarcoma (Table III).
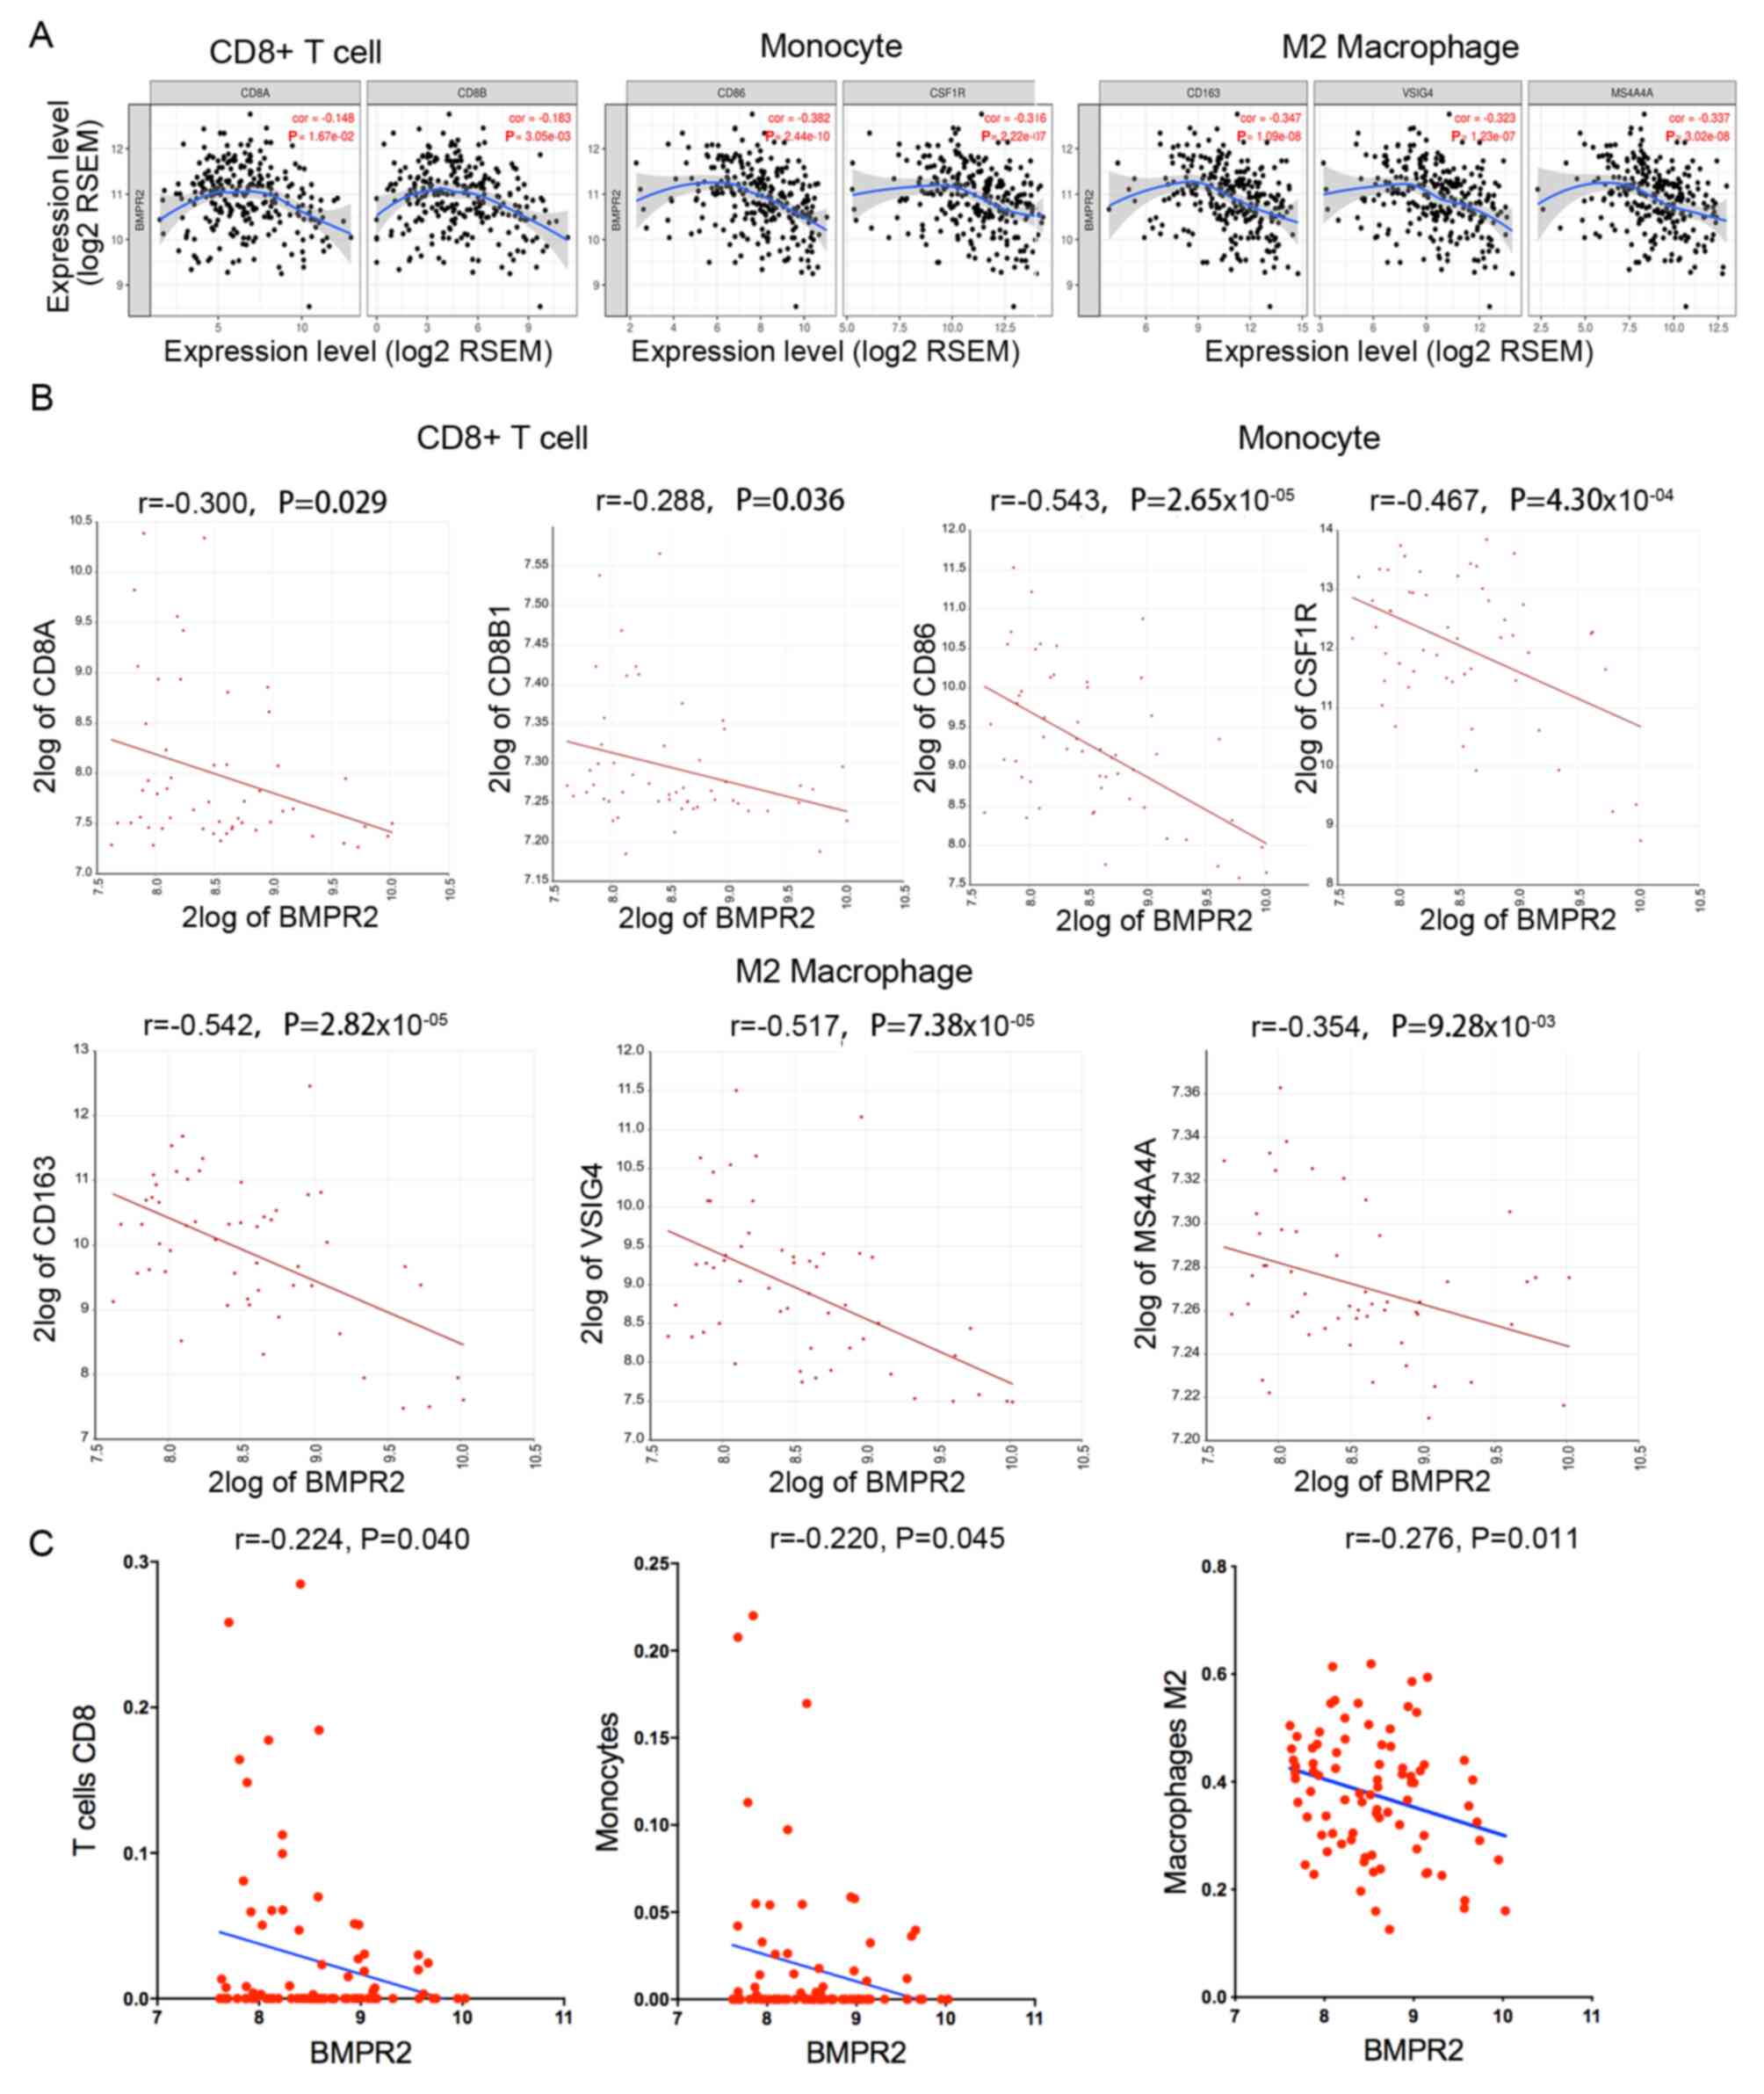 | Figure 5.Association of BMPR2 expression and
immune marker sets in sarcoma and osteosarcoma. (A) BMPR2
expression in sarcoma was correlated with CD8+ T cell, monocyte and
M2 macrophage markers, such as CD8A, CD8B, CD86, CD115, CD163,
VSIG4 and MS4A4A. (B) BMPR2 expression in osteosarcoma was
correlated with CD8+ T cell, monocyte and M2 macrophage markers,
such as CD8A, CD8B, CD86, CD115, CD163, VSIG4 and MS4A4A. (C) High
expression of BMPR2 in osteosarcoma was correlated with low
infiltration of CD8+ T cells, monocytes and M2 macrophages. BMPR2,
bone morphogenetic protein receptor 2; RSEM, RNA-Seq by
Expectation-Maximization. |
| Table III.Correlation analysis between bone
morphogenetic protein receptor 2 and related genes and markers of
immune cells in R2 and Tumor Immune Estimation Resource
databases. |
Table III.
Correlation analysis between bone
morphogenetic protein receptor 2 and related genes and markers of
immune cells in R2 and Tumor Immune Estimation Resource
databases.
|
| OS | SARC |
|---|
|
|
|
|
|---|
| Gene markers | Cor | P-value | Cor | P-value |
|---|
| CD8+ T cell |
|
|
|
|
|
CD8A | −0.300 | 0.029 | −0.148 | 0.017 |
|
CD8B | −0.288 | 0.036 | −0.183 | 0.003 |
| T cell
(general) |
|
|
|
|
|
CD3D | −0.109 | 0.437 | −0.267 | 0.001a |
|
CD3E | −0.355 | 0.009 | −0.196 | 0.001 |
|
CD2 | −0.273 | 0.048 | −0.200 | 0.001 |
| B cell |
|
|
|
|
|
CD19 | −0.133 | 0.342 | −0.288 | 0.001a |
|
CD79A | −0.099 | 0.479 | −0.162 | 0.009 |
| Monocyte |
|
|
|
|
|
CD86 | −0.543 | 0.001a | −0.382 | 0.001a |
| CD115
(CSF1R) | −0.467 | 0.001a | −0.316 | 0.001 |
| TAM |
|
|
|
|
|
CCL2 | −0.099 | 0.48 | −0.197 | 0.001 |
|
CD68 | 0.312 | 0.023 | −0.453 | 0.001a |
|
IL10 | 0.012 | 0.933 | −0.345 | 0.001a |
| M1 Macrophage |
|
|
|
|
| INOS
(NOS2) | −0.043 | 0.761 | 0.129 | 0.037 |
|
IRF5 | −0.385 | 0.004 | −0.325 | 0.001a |
| COX2
(PTGS2) | 0.248 | 0.073 | 0.149 | 0.016 |
| M2 Macrophage |
|
|
|
|
|
CD163 | −0.542 | 0.001a | −0.347 | 0.001a |
|
VSIG4 | −0.517 | 0.001a | −0.323 | 0.001a |
|
MS4A4A | −0.354 | 0.009 | −0.337 | 0.001a |
| Neutrophils |
|
|
|
|
| CD66b
(CEACAM8) | −0.183 | 0.190 | −0.126 | 0.043 |
| CD11b
(ITGAM) | −0.224 | 0.106 | −0.327 | 0.001a |
|
CCR7 | −0.228 | 0.101 | −0.082 | 0.185 |
| Natural killer
cell |
|
|
|
|
|
KIR2DL1 | −0.131 | 0.349 | −0.155 | 0.012 |
|
KIR2DL3 | −0.169 | 0.228 | −0.142 | 0.022 |
|
KIR2DL4 | 0.014 | 0.921 | −0.312 | 0.001a |
|
KIR3DL1 | −0.365 | 0.007 | −0.066 | 0.289 |
|
KIR3DL2 | −0.167 | 0.233 | −0.041 | 0.507 |
|
KIR3DL3 | −0.258 | 0.062 | −0.119 | 0.055 |
|
KIR2DS4 | 0.219 | 0.115 | −0.140 | 0.024 |
| Dendritic cell |
|
|
|
|
|
HLA-DPB1 | −0.201 | 0.150 | −0.294 | 0.001a |
|
HLA-DQB1 | −0.259 | 0.061 | −0.274 | 0.001a |
|
HLA-DRA | −0.484 | 0.001a | −0.265 | 0.001a |
|
HLA-DPA1 | −0.451 | 0.001a | −0.238 | 0.001a |
| BDCA-1
(CD1C) | 0.235 | 0.090 | 0.020 | 0.752 |
| BDCA-4
(NRP1) | 0.183 | 0.189 | 0.167 | 0.007 |
| CD11c
(ITGAX) | −0.331 | 0.015 | −0.325 | 0.001a |
| Th1 |
|
|
|
|
| T-bet
(TBX21) | 0.197 | 0.157 | −0.204 | 0.001a |
|
STAT4 | −0.031 | 0.827 | −0.181 | 0.003 |
|
STAT1 | −0.166 | 0.234 | 0.064 | 0.303 |
| IFN-γ
(IFNG) | −0.216 | 0.120 | −0.216 | 0.001a |
| TNF-α
(TNF) | −0.314 | 0.022 | −0.203 | 0.001 |
| Th2 |
|
|
|
|
|
GATA3 | −0.181 | 0.195 | −0.162 | 0.009 |
|
STAT6 | 0.092 | 0.514 | 0.253 | 0.001a |
|
STAT5A | −0.483 | 0.001a | −0.183 | 0.003 |
|
IL13 | −0.320 | 0.019 | −0.030 | 0.632 |
| Tfh |
|
|
|
|
|
BCL6 | 0.099 | 0.479 | 0.018 | 0.771 |
|
IL21 | 0.031 | 0.825 | −0.113 | 0.070 |
| Th17 |
|
|
|
|
|
STAT3 | −0.545 | 0.001a | 0.448 | 0.001a |
|
IL17A | −0.529 | 0.001a | 0.003 | 0.961 |
| Treg |
|
|
|
|
|
FOXP3 | −0.171 | 0.221 | −0.126 | 0.042 |
|
CCR8 | −0.072 | 0.608 | −0.025 | 0.689 |
|
STAT5B | 0.158 | 0.257 | 0.365 | 0.001a |
| TGFβ
(TGFB1) | −0.045 | 0.751 | −0.4 | 0.001a |
| T cell
exhaustion |
|
|
|
|
| PD-1
(PDCD1) | −0.133 | 0.341 | −0.237 | 0.001a |
|
CTLA4 | −0.112 | 0.424 | −0.2 | 0.001 |
|
LAG3 | −0.209 | 0.133 | −0.357 | 0.001a |
| TIM-3
(HAVCR2) | −0.599 | 0.001a | −0.407 | 0.001a |
|
GZMB | −0.324 | 0.018 | −0.409 | 0.001a |
In addition, the relationship between BMPR2
expression and marker genes of various immune cells in osteosarcoma
was examined using the R2 database (Table III and Figs. S5 and 6). The results revealed that CD8+ T cell,
monocyte and M2 macrophage markers, such as CD8A, CD8B, CD86, CD115
(CSF1R), CD163, VSIG4 and MS4A4A, showed statistical significance
with BMPR2 expression (Table III
and Fig. 5B).
Next, whether BMPR2 expression is associated with
the immune infiltration pattern was investigated by assessing the
abundance of 22 types of immune cells in 81 osteosarcoma samples.
As displayed in Table IV and
Fig. 5C, BMPR2 expression was
statistical negatively correlated with CD8+ T, γ δ T cells,
monocytes, M2 macrophages and neutrophil cells. Meanwhile, BMPR2
was statistically positively correlated with the concentrations of
naïve B cells, naïve CD4+T, memory resting CD4+T and M0
macrophages. Taken considering of the rs-values, the
correlation was defined as weak or negligible correlation according
to the aforementioned cut-offs.
| Table IV.Relationship between bone
morphogenetic protein receptor 2 and infiltration of immune cells
according to CIBERSORT analysis. |
Table IV.
Relationship between bone
morphogenetic protein receptor 2 and infiltration of immune cells
according to CIBERSORT analysis.
| Cell type | Cor | P-value |
|---|
| B cells naive | 0.237 | 0.030 |
| B cells memory | −0.196 | 0.074 |
| Plasma cells | 0.169 | 0.124 |
| T cells CD8 | −0.224 | 0.040 |
| T cells CD4
naive | 0.260 | 0.017 |
| T cells CD4 memory
resting | 0.487 | 0.001 |
| T cells CD4 memory
activated | −0.059 | 0.593 |
| T cells follicular
helper | 0.023 | 0.836 |
| T cells
regulatory | −0.165 | 0.133 |
| T cells γ δ | −0.254 | 0.020 |
| NK cells
resting | 0.212 | 0.053 |
| NK cells
activated | 0.150 | 0.174 |
| Monocytes | −0.220 | 0.045 |
| Macrophages M0 | 0.233 | 0.033 |
| Macrophages M1 | −0.138 | 0.212 |
| Macrophages M2 | −0.276 | 0.011 |
| Dendritic cells
resting | −0.156 | 0.157 |
| Dendritic cells
activated | 0.010 | 0.930 |
| Mast cells
resting | 0.091 | 0.411 |
| Mast cells
activated | −0.103 | 0.352 |
| Neutrophils | −0.251 | 0.021 |
Taken together, the aforementioned results indicated
that high expression of BMPR2 was correlated with low infiltration
of CD8+ T cells, monocytes and M2 macrophages in osteosarcoma.
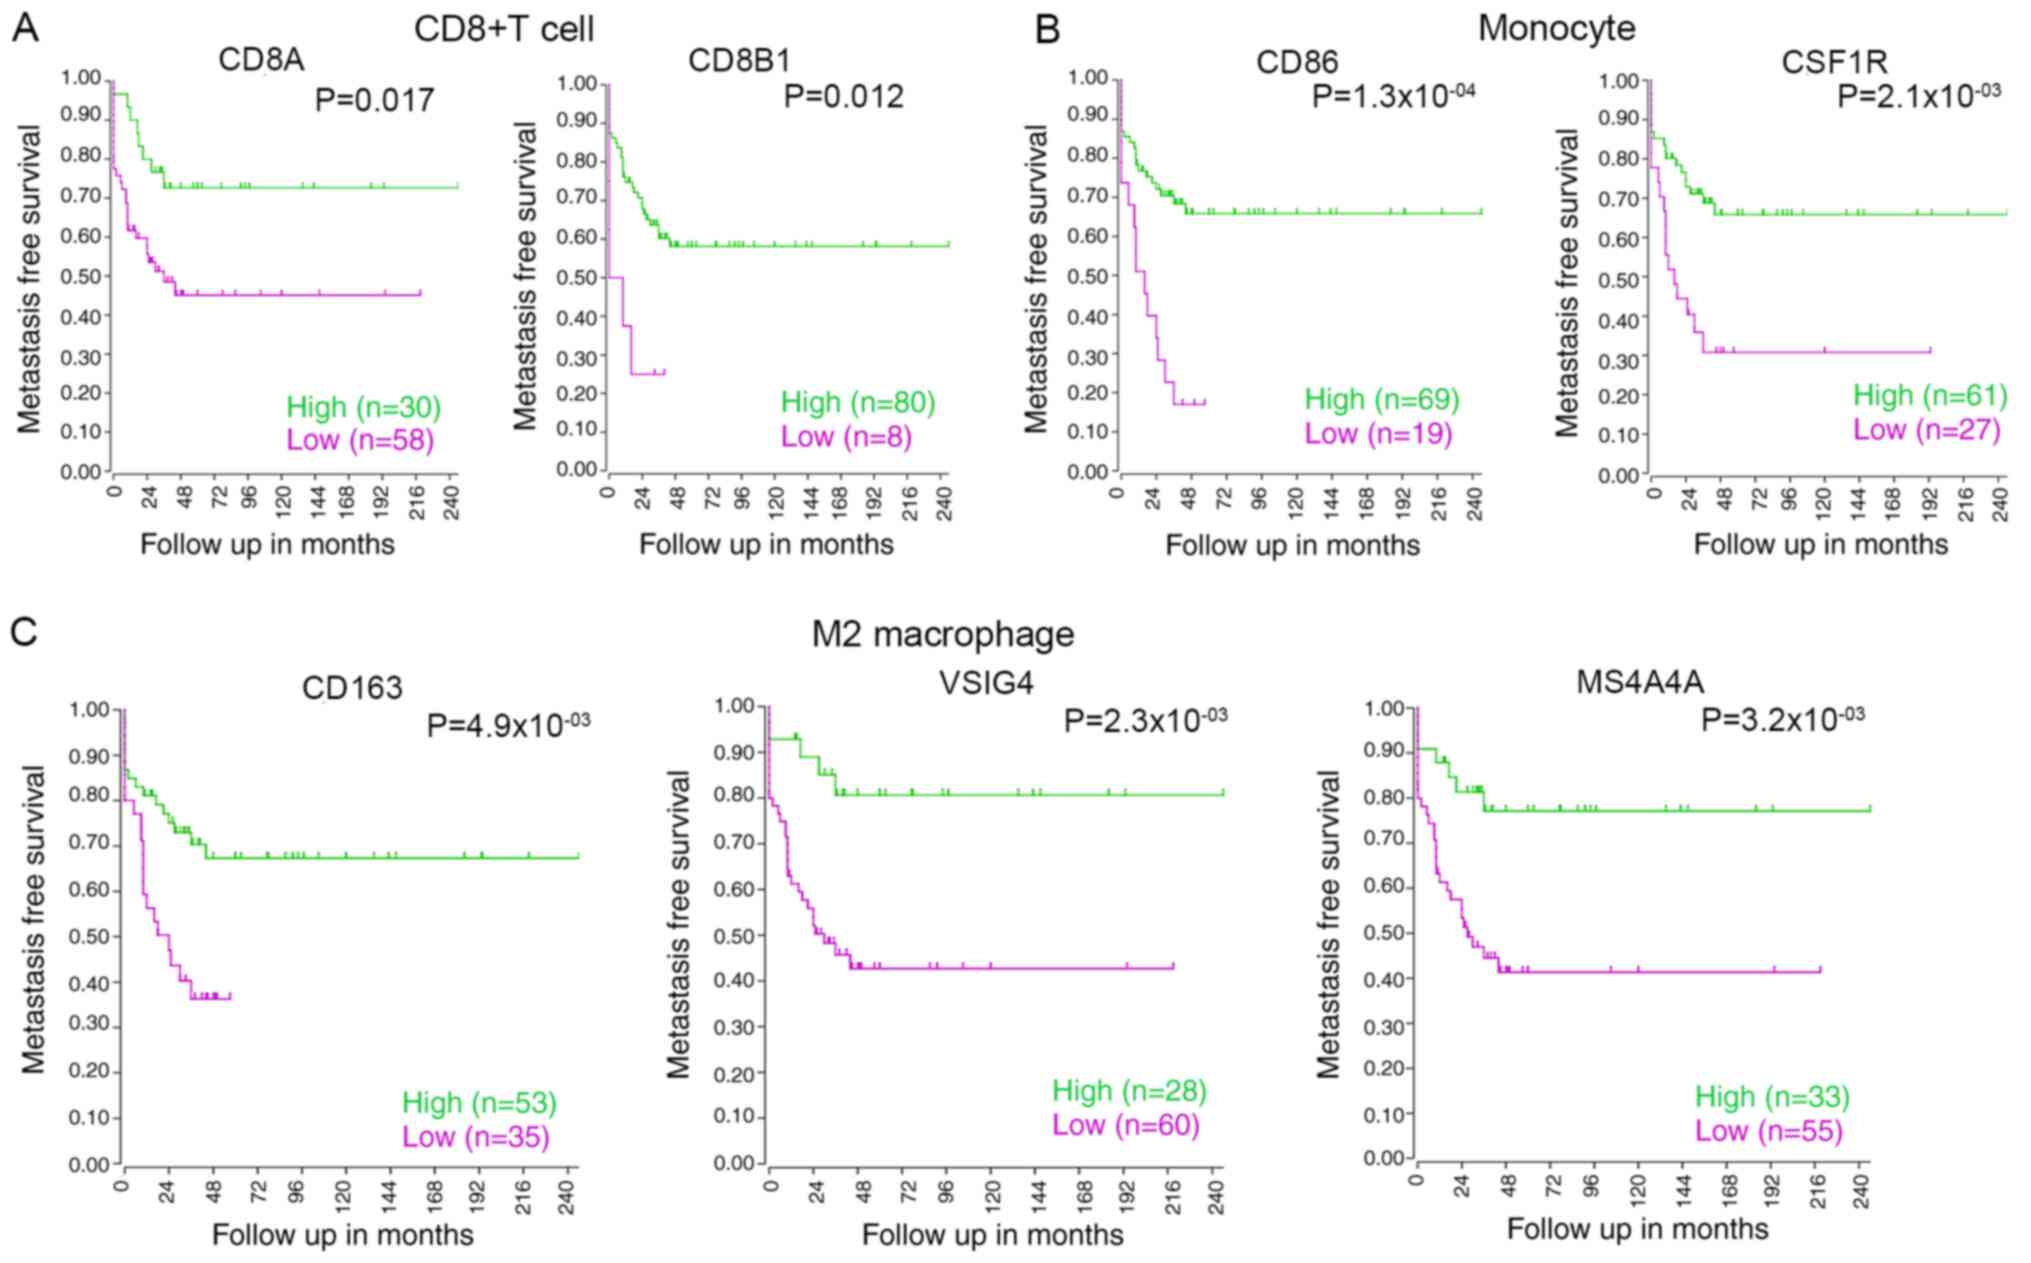
The relationship between the survival of patients
with osteosarcoma and the markers of CD8+ T cells, monocytes and M2
macrophages, such as CD8A, CD8B, CD86, CD115, CD163, VSIG4 and
MS4A4A, were analyzed using the R2 database. The results showed
that low expression levels of CD8A, CD8B1, CD86, CSF1R, CD163,
VSIG4 or MS4A4A were correlated with poor survival in osteosarcoma
(Fig. 6A-C). Hence, these data
indicated that low infiltration of CD8+ T cells, monocytes or M2
macrophages in osteosarcoma is significantly associated with poor
prognosis.
Discussion
BMPs and receptors (BMPR1 and BMPR2) are members of
the TGF-β superfamily. BMPR2 patriciates in numerous cellular
functions, including cell adhesion, proliferation and invasion,
inflammation, apoptosis and metastatic spread (36,37). In
recent years, studies have reported the expression and roles of
BMPR2 in various types of cancer malignant tumors, such as
colorectal cancer, prostate cancer and osteosarcoma (17,19,20,38).
However, the function of BMPR2 in cancer immunology is unclear. The
present study reported the differential expression of BMPR2 in
different types of cancer. A high level of BMPR2 expression was
associated with metastasis and poor prognosis in osteosarcoma,
indicating the predictive value of BMPR2 for risk of metastasis in
osteosarcoma. In addition, the results showed that the level of
BMPR2 expression in sarcomas and osteosarcomas was negligibly
correlated with different sets of gene markers of immune cells. Low
infiltration of CD8+ T cells, monocytes and M2 macrophages was
associated with poor survival in osteosarcoma. Consequently, the
results indicated the influential role of BMPR2 in tumor immunology
and its potential application as a tumor biomarker. As
aforementioned, correlation with a rs -value between
−0.3 to 0.3 was considered as weak or negligible correlation.
Therefore, the current results do not present powerful statistical
evidence to demonstrate the correlation between the gene markers of
T (general) and B cells, TAMs, M1 macrophages, DCs, neutrophils,
Th1, Th2 and Th17 cells, Tregs and exhausted T cells (Table III) and CD8+ T, γ δ T cells,
monocytes, M2 macrophages, neutrophils, naïve B, naïve CD4+T, and
memory resting CD4+T cells and M0 macrophages (Table IV) with BMPR2 expression. Further
basic experiments and clinical studies focused on tumor
infiltration immune cells and tumor microenvironment are needed to
identify whether this statistical difference is true or negligible
correlation.
Over the past few decades, immunosuppression in TME
has received increasing attention in cancer research. Myeloid cells
(macrophages, monocytes and DCs) and T lymphocytes act as key
members of the immune microenvironment in osteosarcoma (39). Osteosarcoma cells can regulate the
recruitment and induce the differentiation of infiltrating immune
cells by secreting cytokines, such as CCL2, CCL4 or IFN-γ, thus
establishing an immune-tolerant or immune-resistant local
microenvironment (39). The TME
causes CD8+ T cell dysfunction or exhaustion, removing the
cytotoxic effect of CD8+ T cells towards tumor cells (40,41).
Previous studies have shown that functional damage to CD8+ T cells
is present in a variety of malignancies, including lung cancer
(42), melanoma (43), prostate cancer (44) and osteosarcoma (45). The CD8+/forkhead box protein P3+/-
ratio has been reported to be a powerful prognostic indicator for
patients with osteosarcoma (46). It
was also found that TAMs are correlated with a positive prognosis
(47,48). The current study demonstrated that M2
and M0 macrophages, resting mast, γ δ T and CD8+ T cells were the
top five immune cells with the highest degrees of infiltration in
osteosarcoma. Zhang et al (49) analyzed the immune infiltration of
osteosarcoma samples in TCGA database. Their results showed that
the two most common types of immune cells in osteosarcoma tissue
are macrophages and T lymphocytes, in line with the present
findings. According to the current understanding of the TME, low
infiltration levels of CD8+ T cells, monocytes and M2 macrophages
in osteosarcoma are associated with poor prognosis. It can be
concluded that CD8+ T cells, monocytes and M2 macrophages play
critical roles in regulating the immune microenvironment of
osteosarcoma.
In the adult immune system, the BMP signaling
pathway actively participates in dominating the fate of the immune
lineage and the development of immune cells (50). BMP ligands secreted by tumor cells
into the extracellular matrix act on immune cells, thereby
regulating the functions of immune cells (21,51,52).
Studies have suggested that activated Bone Morphogenic Protein
Receptor 1α (BMPR1α)-deficient CD4+ T cells produce a large amount
of IFN-γ and enhance tumor proliferation, indicating the adverse
effect of BMP signaling on the adaptive immune response (53). Abrogation of BMPR1α signaling during
CD4+ T cell activation induced inflammatory effector cells to
express various of cytokines such as IL-17, IFN-γ, and TNF family
and transcription factors defining the Th17 cell lineage (54). BMPs and BMPRs also serve an important
role during the process of B cell activation (55). The current data revealed that the
expression levels of BMPR2 in chronic lymphocytic leukemia,
follicular lymphoma and germinal center B cell-like diffuse large B
cell lymphoma were significantly higher compared with those in
normal tissues. These results suggested that BMPR2 plays a pivotal
role in the progression of some cancer types. Moreover, CD8+ T
cell, monocyte and M2 macrophage markers, such as CD8A, CD8B, CD86,
CSF1R, CD163, VSIG4 or MS4A4A, were negatively correlated with
BMPR2 expression. These results indicated the importance of BMPR2
in the suppression and regulation of infiltrating immune cells in
the osteosarcoma microenvironment. However, the detailed mechanism
by which BMPR2 inhibits the infiltration of CD8+T cells, monocytes
and M2 macrophages remains unclear. Activated BMPR2 can
sequentially activate the downstream p38 MAPK/ERK, RHO/ROCK/LIMK
and JNK signaling pathways through a non-classical pathway
(56). The p38 MAPKs proteins are
key therapeutic targets in Rheumatoid arthritis, Crohn's disease
and other inflammatory diseases (57). It has been revealed that p38 MAPKs
can inhibit expression of pro-inflammatory cytokines, such as IL-6,
TNF-α, MCP-1 and IL-1β, and promote expression of anti-inflammatory
cytokines, such as IL-10 and TGF-β (58). This signaling pathway has been shown
to be important to the immune microenvironment of numerous tumor
types (59,60). Zhang et al demonstrated the
mechanisms of crosstalk between myeloid cells and tumor cells
through EGFR/MAPK signaling pathway to restore CD8+ mediated
anti-tumor immunity in pancreatic cancer (59). MAPK-mutant tumors are the only CD8+ T
cell-inflamed tumors with high immunoreactivity and a
constitutively cytolytic tumor microenvironment. The MAPK-mutant
head and neck squamous-cell carcinoma model with immune function
shows active cell death and extensive CD8+ T cell recruitment
(61,62). We infer that BMPR2 regulates the
immune microenvironment of osteosarcoma tissue through the MAPK/ERK
pathway. In the future, more clinical and experimental studies are
expected to future clarify the role of BMPR2 in regulating the
infiltration of immune cells in osteosarcoma.
Several studies have shown that BMPR2 mutation and
methylation affect BMPR2 expression levels in disease such as
pulmonary hypertension disease (63–66) and
tumor (67). Kodach et al
(67) demonstrated that BMPR2 was
mutated in the microsatellite-unstable of colorectal cancer cells,
which decreased the BMPR2 expression level. In addition, the
mutation of the BMPR2 gene has been positively correlated with the
abundance of CD8+ T cells and neutrophils, suggesting that the
mutation of the BMPR2 gene can promote the infiltration of
lymphocytes in colon adenocarcinoma (68). Previous studies have shown that
patients with osteosarcoma with high expression levels of BMPR2
have a worse prognosis compared with patients expressing low levels
of BMPR2 (20,69). This is in line with the current
results. However, the present results revealed that AUC for the
expression level of BMPR2 in predicting 5-year survival was 0.601,
suggesting that BMPR2 was not a good indicator of 5-year survival.
This may be because the GEO dataset that was analyzed only
collected gene expression data from high-grade osteosarcoma
diagnostic biopsies. In addition, our previous study demonstrated
that the depletion of BMPR2 in osteosarcoma cells markedly reduced
the invasive capacity in vitro and metastatic potential
in vivo. Mechanistically, it was revealed that BMPR2 could
active LIMK2 through the RhoA/ROCK pathway and could also interact
with LIMK2 directly in osteosarcoma cells (20,69).
Similarly, the present study reported that the AUC for the
expression level of BMPR2 in predicting metastatic was 0.711,
indicating that BMPR2 was a good indicator to predict metastasis.
However, whether BMPR2 is mutated before the development of
osteosarcoma and its role in lymphocyte infiltration is
unknown.
Above all, the present study demonstrated that CD8+
T cells, monocytes and M2 macrophages play critical roles in
constructing the immune microenvironment of osteosarcoma. Increased
BMPR2 expression was associated with decreased infiltration of
osteosarcoma tissues by CD8+ T cells, monocytes and M2 macrophages,
and was also correlated with poor prognosis in patients with
osteosarcoma. Therefore, BMPR2 has potential as a prognostic
biomarker for immune infiltration, metastasis and prognosis in
osteosarcoma.
Supplementary Material
Supporting Data
Acknowledgements
Not applicable.
Funding
This study was supported by The National Natural
Science Foundation of China (grant nos. 81602361 and 81702261), and
The China Postdoctoral Science Foundation (grant no. 205425).
Availability of data and materials
The datasets generated and/or analyzed during the
current study are available in the Oncomine repository (https://www.oncomine.org/resource/main.html), R2
repository, (https://hgserver1.amc.nl/cgi-bin/r2/main.cgi), TARGET
repository, (https://ocg.cancer.gov/programs/target); The Cancer
Genome Atlas repository (http://tcga-data.nci.nih.gov/tcga/) and TIMER
repository, (https://cistrome.shinyapps.io/timer/).
Authors' contributions
HC participated in the analysis of the data and was
a major contributor in writing the manuscript. SQ and LZ helped
collect and interpretate the data. YC participated in designing the
study. GJ analyzed the data and revised the manuscript. All authors
read and approved the final manuscript.
Ethics approval and consent to
participate
Not applicable.
Patient consent for publication
Not applicable.
Competing interests
The authors declare that they have no competing
interests.
Glossary
Abbreviations
Abbreviations:
|
BMPR2
|
bone morphogenetic protein receptor
2
|
|
TIMER
|
Tumor Immune Estimation Resource
|
|
OS
|
overall survival
|
|
NK
|
natural killer cells
|
|
DC
|
dendritic cells
|
|
ARMS
|
acinar rhabdomyosarcoma
|
|
ERMS
|
embryonal rhabdomyosarcoma
|
|
TAMs
|
tumor-associated macrophages
|
References
|
1
|
Hameed M and Mandelker D: Tumor syndromes
predisposing to osteosarcoma. Adv Anat Pathol. 25:217–222. 2018.
View Article : Google Scholar : PubMed/NCBI
|
|
2
|
Otoukesh B, Boddouhi B, Moghtadaei M,
Kaghazian P and Kaghazian M: Novel molecular insights and new
therapeutic strategies in osteosarcoma. Cancer Cell Int.
18:1582018. View Article : Google Scholar : PubMed/NCBI
|
|
3
|
Harrison DJ, Geller DS, Gill JD, Lewis VO
and Gorlick R: Current and future therapeutic approaches for
osteosarcoma. Expert Rev Anticancer Ther. 18:39–50. 2018.
View Article : Google Scholar : PubMed/NCBI
|
|
4
|
Harting MT and Blakely ML: Management of
osteosarcoma pulmonary metastases. Semin Pediatr Surg. 15:25–29.
2006. View Article : Google Scholar : PubMed/NCBI
|
|
5
|
Carrle D and Bielack S: Osteosarcoma lung
metastases detection and principles of multimodal therapy. Cancer
Treat Res. 152:165–184. 2009. View Article : Google Scholar : PubMed/NCBI
|
|
6
|
Link MP, Goorin AM, Miser AW, Green AA,
Pratt CB, Belasco JB, Pritchard J, Malpas JS, Baker AR, Kirkpatrick
JA, et al: The effect of adjuvant chemotherapy on relapse-free
survival in patients with osteosarcoma of the extremity. N Engl J
Med. 314:1600–1606. 1986. View Article : Google Scholar : PubMed/NCBI
|
|
7
|
Meyers PA, Healey JH, Chou AJ, Wexler LH,
Merola PR, Morris CD, Laquaglia MP, Kellick MG, Abramson SJ and
Gorlick R: Addition of pamidronate to chemotherapy for the
treatment of osteosarcoma. Cancer. 117:2011. View Article : Google Scholar
|
|
8
|
Mirabello L, Troisi RJ and Savage SA:
Osteosarcoma incidence and survival rates from 1973 to 2004: Data
from the surveillance, Epidemiology, and end results program.
Cancer. 115:1531–1543. 2009. View Article : Google Scholar : PubMed/NCBI
|
|
9
|
Locy H, de Mey S, de Mey W, De Ridder M,
Thielemans K and Maenhout SK: Maenhout, Immunomodulation of the
tumor microenvironment: Turn Foe into friend. Front Immunol.
9:29092018. View Article : Google Scholar : PubMed/NCBI
|
|
10
|
Dumauthioz N, Labiano S and Romero P:
Tumor resident memory T cells: New players in immune surveillance
and therapy. Front Immunol. 9:20762018. View Article : Google Scholar : PubMed/NCBI
|
|
11
|
Blanc C, Hans S, Tran T, Granier C,
Saldman A, Anson M, Oudard S and Tartour E: Targeting resident
memory T cells for cancer immunotherapy. Front Immunol. 9:17222018.
View Article : Google Scholar : PubMed/NCBI
|
|
12
|
Gajewski TF, Schreiber H and Fu YX: Innate
and adaptive immune cells in the tumor microenvironment. Nat
Immunol. 14:1014–1022. 2013. View
Article : Google Scholar : PubMed/NCBI
|
|
13
|
Grivennikov SI, Greten FR and Karin M:
Immunity, inflammation, and cancer. Cell. 140:883–899. 2010.
View Article : Google Scholar : PubMed/NCBI
|
|
14
|
Schreiber RD, Old LJ and Smyth MJ: Cancer
immunoediting: Integrating immunity's roles in cancer suppression
and promotion. Science. 331:1565–1570. 2011. View Article : Google Scholar : PubMed/NCBI
|
|
15
|
Lussier DM, O'Neill L, Nieves LM, McAfee
MS, Holechek SA, Collins AW, Dickman P, Jacobsen J, Hingorani P and
Blattman JN: Enhanced T-cell immunity to osteosarcoma through
antibody blockade of PD-1/PD-L1 interactions. J Immunother.
38:96–106. 2015. View Article : Google Scholar : PubMed/NCBI
|
|
16
|
Shen JK, Cote GM, Choy E, Yang P, Harmon
D, Schwab J, Nielsen GP, Chebib I, Ferrone S, Wang X, et al:
Programmed cell death ligand 1 expression in osteosarcoma. Cancer
Immunol Res. 2:690–698. 2014. View Article : Google Scholar : PubMed/NCBI
|
|
17
|
Beppu H, Mwizerwa ON, Beppu Y, Dattwyler
MP, Lauwers GY, Bloch KD and Goldstein AM: Stromal inactivation of
BMPRII leads to colorectal epithelial overgrowth and polyp
formation. Oncogene. 27:1063–1070. 2008. View Article : Google Scholar : PubMed/NCBI
|
|
18
|
Kim IY, Lee DH, Lee DK, Kim WJ, Kim MM,
Morton RA, Lerner SP and Kim SJ: Restoration of bone morphogenetic
protein receptor type II expression leads to a decreased rate of
tumor growth in bladder transitional cell carcinoma cell line
TSU-Pr1. Cancer Res. 64:7355–7360. 2004. View Article : Google Scholar : PubMed/NCBI
|
|
19
|
Voorneveld PW, Kodach LL, Jacobs RJ, Liv
N, Zonnevylle AC, Hoogenboom JP, Biemond I, Verspaget HW, Hommes
DW, de Rooij K, et al: Loss of SMAD4 alters BMP signaling to
promote colorectal cancer cell metastasis via activation of Rho and
ROCK. Gastroenterology. 147:196–208 e113. 2014. View Article : Google Scholar : PubMed/NCBI
|
|
20
|
Wang S, Ren T, Huang Y, Bao X, Sun K, Shen
D and Guo W: BMPR2 and HIF1-α overexpression in resected
osteosarcoma correlates with distant metastasis and patient
survival. Chin J Cancer Res. 29:447–454. 2017. View Article : Google Scholar : PubMed/NCBI
|
|
21
|
Martínez VG, Rubio C, Martínez-Fernández
M, Segovia C, López-Calderón F, Garín MI, Teijeira A,
Munera-Maravilla E, Varas A, Sacedón R, et al: BMP4 induces M2
macrophage polarization and favors tumor progression in bladder
cancer. Clin Cancer Res. 23:7388–7399. 2017. View Article : Google Scholar : PubMed/NCBI
|
|
22
|
Rhodes DR, Kalyana-Sundaram S, Mahavisno
V, Varambally R, Yu J, Briggs BB, Barrette TR, Anstet MJ,
Kincead-Beal C, Kulkarni P, et al: Oncomine 3.0: Genes, pathways,
and networks in a collection of 18,000 cancer gene expression
profiles. Neoplasia. 9:166–180. 2007. View Article : Google Scholar : PubMed/NCBI
|
|
23
|
Jones KB, Salah Z, Del Mare S, Galasso M,
Gaudio E, Nuovo GJ, Lovat F, LeBlanc K, Palatini J, Randall RL, et
al: miRNA signatures associate with pathogenesis and progression of
osteosarcoma. Cancer Res. 72:1865–1877. 2012. View Article : Google Scholar : PubMed/NCBI
|
|
24
|
Kuijjer ML, Rydbeck H, Kresse SH, Buddingh
EP, Lid AB, Roelofs H, Bürger H, Myklebost O, Hogendoorn PC,
Meza-Zepeda LA and Cleton-Jansen AM: Identification of osteosarcoma
driver genes by integrative analysis of copy number and gene
expression data. Genes Chromosomes Cancer. 51:696–706. 2012.
View Article : Google Scholar : PubMed/NCBI
|
|
25
|
Kobayashi E, Masuda M, Nakayama R,
Ichikawa H, Satow R, Shitashige M, Honda K, Yamaguchi U, Shoji A,
Tochigi N, et al: Reduced argininosuccinate synthetase is a
predictive biomarker for the development of pulmonary metastasis in
patients with osteosarcoma. Mol Cancer Ther. 9:535–544. 2010.
View Article : Google Scholar : PubMed/NCBI
|
|
26
|
Schafer W: Rhabdomyosarcoma vs normal
muscle. R2 database. 2000-01-01 ed., 2000. p. Available on R2
since: 2000-01-01.
|
|
27
|
Huvos AG, Rosen G and Marcove RC: Primary
osteogenic sarcoma: Pathologic aspects in 20 patients after
treatment with chemotherapy en bloc resection, and prosthetic bone
replacement. Arch Pathol Lab Med. 101:14–18. 1977.PubMed/NCBI
|
|
28
|
Li T, Fan J, Wang B, Traugh N, Chen Q, Liu
JS, Li B and Liu XS: TIMER: A web server for comprehensive analysis
of tumor-infiltrating immune cells. Cancer Res. 77:e108–e110. 2017.
View Article : Google Scholar : PubMed/NCBI
|
|
29
|
Siemers NO, Holloway JL, Chang H, Chasalow
SD, Ross-MacDonald PB, Voliva CF and Szustakowski JD: Genome-wide
association analysis identifies genetic correlates of immune
infiltrates in solid tumors. PLoS One. 12:e01797262017. View Article : Google Scholar : PubMed/NCBI
|
|
30
|
Danaher P, Warren S, Dennis L, D'Amico L,
White A, Disis ML, Geller MA, Odunsi K, Beechem J and Fling SP:
Gene expression markers of tumor Infiltrating leukocytes. J
Immunother Cancer. 5:182017. View Article : Google Scholar : PubMed/NCBI
|
|
31
|
Sousa S and Maatta J: The role of
tumour-associated macrophages in bone metastasis. J Bone Oncol.
5:135–138. 2016. View Article : Google Scholar : PubMed/NCBI
|
|
32
|
Gentles AJ, Newman AM, Liu CL, Bratman SV,
Feng W, Kim D, Nair VS, Xu Y, Khuong A, Hoang CD, et al: The
prognostic landscape of genes and infiltrating immune cells across
human cancers. Nat Med. 21:938–945. 2015. View Article : Google Scholar : PubMed/NCBI
|
|
33
|
Subramanian A, Tamayo P, Mootha VK,
Mukherjee S, Ebert BL, Gillette MA, Paulovich A, Pomeroy SL, Golub
TR, Lander ES and Mesirov JP: Gene set enrichment analysis: A
knowledge-based approach for interpreting genome-wide expression
profiles. Proc Natl Acad Sci USA. 102:15545–15550. 2005. View Article : Google Scholar : PubMed/NCBI
|
|
34
|
R Core Team, . R: A language and
environment for statistical computing. R Foundation for Statistical
Computing; Vienna, Austria: 2012, ISBN 3-900051-07-0, URL.
http://www.R-project.org/
|
|
35
|
Binnewies M, Roberts EW, Kersten K, Chan
V, Fearon DF, Merad M, Coussens LM, Gabrilovich DI,
Ostrand-Rosenberg S, Hedrick CC, et al: Understanding the tumor
immune microenvironment (TIME) for effective therapy. Nat Med.
24:541–550. 2018. View Article : Google Scholar : PubMed/NCBI
|
|
36
|
Bami M, Mavrogenis AF, Angelini A,
Milonaki M, Mitsiokapa E, Stamoulis D and Soucacos PN: Bone
morphogenetic protein signaling in musculoskeletal cancer. J Cancer
Res Clin Oncol. 142:2061–2072. 2016. View Article : Google Scholar : PubMed/NCBI
|
|
37
|
Siegel PM and Massague J: Cytostatic and
apoptotic actions of TGF-beta in homeostasis and cancer. Nat Rev
Cancer. 3:807–821. 2003. View Article : Google Scholar : PubMed/NCBI
|
|
38
|
Kim IY, Lee DH, Lee DK, Ahn HJ, Kim MM,
Kim S and Morton RA: Morton: Loss of expression of bone
morphogenetic protein receptor type II in human prostate cancer
cells. Oncogene. 23:7651–7659. 2004. View Article : Google Scholar : PubMed/NCBI
|
|
39
|
Heymann MF, Lézot F and Heymann D: The
contribution of immune infiltrates and the local microenvironment
in the pathogenesis of osteosarcoma. Cell Immunol. 343:1037112019.
View Article : Google Scholar : PubMed/NCBI
|
|
40
|
Apetoh L, Smyth MJ, Drake CG, Abastado JP,
Apte RN, Ayyoub M, Blay JY, Bonneville M, Butterfield LH, Caignard
A, et al: Consensus nomenclature for CD8(+) T cell phenotypes in
cancer. Oncoimmunology. 4:e9985382015. View Article : Google Scholar : PubMed/NCBI
|
|
41
|
Speiser DE, Utzschneider DT, Oberle SG,
Münz C, Romero P and Zehn D: T cell differentiation in chronic
infection and cancer: Functional adaptation or exhaustion? Nat Rev
Immunol. 14:768–774. 2014. View Article : Google Scholar : PubMed/NCBI
|
|
42
|
Mittal R, Chen CW, Lyons JD, Margoles LM,
Liang Z, Coopersmith CM and Ford ML: Murine lung cancer induces
generalized T-cell exhaustion. J Surg Res. 195:541–549. 2015.
View Article : Google Scholar : PubMed/NCBI
|
|
43
|
Baitsch L, Baumgaertner P, Devêvre E,
Raghav SK, Legat A, Barba L, Wieckowski S, Bouzourene H, Deplancke
B, Romero P, et al: Exhaustion of tumor-specific CD8(+) T cells in
metastases from melanoma patients. J Clin Invest. 121:2350–2360.
2011. View Article : Google Scholar : PubMed/NCBI
|
|
44
|
Japp AS, Kursunel MA, Meier S, Mälzer JN,
Li X, Rahman NA, Jekabsons W, Krause H, Magheli A, Klopf C, et al:
Dysfunction of PSA-specific CD8+ T cells in prostate cancer
patients correlates with CD38 and Tim-3 expression. Cancer Immunol
Immunother. 64:1487–1494. 2015. View Article : Google Scholar : PubMed/NCBI
|
|
45
|
Zheng W, Xiao H, Liu H and Zhou Y:
Expression of programmed death 1 is correlated with progression of
osteosarcoma. APMIS. 123:102–107. 2015. View Article : Google Scholar : PubMed/NCBI
|
|
46
|
Fritzsching B, Fellenberg J, Moskovszky L,
Sápi Z, Krenacs T, Machado I, Poeschl J, Lehner B, Szendrõi M,
Bosch AL, et al: CD8+/FOXP3+-ratio in
osteosarcoma microenvironment separates survivors from
non-survivors: A multicenter validated retrospective study.
Oncoimmunology. 4:e9908002015. View Article : Google Scholar : PubMed/NCBI
|
|
47
|
Qian BZ and Pollard JW: Macrophage
diversity enhances tumor progression and metastasis. Cell.
141:39–51. 2010. View Article : Google Scholar : PubMed/NCBI
|
|
48
|
Dumars C, Ngyuen JM, Gaultier A, Lanel R,
Corradini N, Gouin F, Heymann D and Heymann MF: Dysregulation of
macrophage polarization is associated with the metastatic process
in osteosarcoma. Oncotarget. 7:78343–78354. 2016. View Article : Google Scholar : PubMed/NCBI
|
|
49
|
Zhang C, Zheng JH, Lin ZH, Lv HY, Ye ZM,
Chen YP and Zhang XY: Profiles of immune cell infiltration and
immune-related genes in the tumor microenvironment of osteosarcoma.
Aging (Albany NY). 12:3486–3501. 2020. View Article : Google Scholar : PubMed/NCBI
|
|
50
|
Eixarch H, Calvo-Barreiro L, Montalban X
and Espejo C: Bone morphogenetic proteins in multiple sclerosis:
Role in neuroinflammation. Brain Behav Immun. 68:1–10. 2018.
View Article : Google Scholar : PubMed/NCBI
|
|
51
|
Singla DK, Singla R and Wang J: BMP-7
treatment increases M2 macrophage differentiation and reduces
inflammation and plaque formation in Apo E-/- mice. PLoS One.
11:e01478972016. View Article : Google Scholar : PubMed/NCBI
|
|
52
|
Limmer A and Wirtz DC: Osteoimmunology:
Influence of the immune system on bone regeneration and
consumption. Z Orthop Unfall. 155:273–280. 2017. View Article : Google Scholar : PubMed/NCBI
|
|
53
|
Kuczma M, Kurczewska A and Kraj P:
Modulation of bone morphogenic protein signaling in T-cells for
cancer immunotherapy. J Immunotoxicol. 11:319–327. 2014. View Article : Google Scholar : PubMed/NCBI
|
|
54
|
Browning LM, Pietrzak M, Kuczma M, Simms
CP, Kurczewska A, Refugia JM, Lowery DJ, Rempala G, Gutkin D,
Ignatowicz L, et al: TGF-β-mediated enhancement of TH17
cell generation is inhibited by bone morphogenetic protein receptor
1α signaling. Sci Signal. 11:eaar21252018. View Article : Google Scholar : PubMed/NCBI
|
|
55
|
Huse K, Bakkebø M, Oksvold MP, Forfang L,
Hilden VI, Stokke T, Smeland EB and Myklebust JH: Bone
morphogenetic proteins inhibit CD40L/IL-21-induced Ig production in
human B cells: Differential effects of BMP-6 and BMP-7. Eur J
Immunol. 41:3135–3145. 2011. View Article : Google Scholar : PubMed/NCBI
|
|
56
|
Gámez B, Rodriguez-Carballo E and Ventura
F: BMP signaling in telencephalic neural cell specification and
maturation. Front Cell Neurosci. 7:872013. View Article : Google Scholar : PubMed/NCBI
|
|
57
|
Kumar S, Boehm J and Lee JC: p38 MAP
kinases: Key signalling molecules as therapeutic targets for
inflammatory diseases. Nat Rev Drug Discov. 2:717–726. 2003.
View Article : Google Scholar : PubMed/NCBI
|
|
58
|
Liang X, Wang L, Wang M, Liu Z, Liu X,
Zhang B, Liu E and Li G: MicroRNA-124 inhibits macrophage cell
apoptosis via targeting p38/MAPK signaling pathway in
atherosclerosis development. Aging (Albany NY). 12:13005–13022.
2020. View Article : Google Scholar : PubMed/NCBI
|
|
59
|
Zhang Y, Velez-Delgado A, Mathew E, Li D,
Mendez FM, Flannagan K, Rhim AD, Simeone DM, Beatty GL and Pasca di
Magliano M: Myeloid cells are required for PD-1/PD-L1 checkpoint
activation and the establishment of an immunosuppressive
environment in pancreatic cancer. Gut. 66:124–136. 2017. View Article : Google Scholar : PubMed/NCBI
|
|
60
|
Wu M, Chen X, Lou J, Zhang S, Zhang X,
Huang L, Sun R, Huang P, Wang F and Pan S: TGF-β1 contributes to
CD8+ Treg induction through p38 MAPK signaling in ovarian cancer
microenvironment. Oncotarget. 7:44534–44544. 2016. View Article : Google Scholar : PubMed/NCBI
|
|
61
|
Liao P, Song K, Zhu Z, Liu Z, Zhang W, Li
W, Hu J, Hu Q, Chen C, Chen B, et al: Propranolol suppresses the
growth of colorectal cancer through simultaneously activating
autologous CD8(+) T cells and inhibiting tumor AKT/MAPK pathway.
Clin Pharmacol Ther. 108:606–615. 2020. View Article : Google Scholar : PubMed/NCBI
|
|
62
|
Ngan HL, Liu Y, Fong AY, Poon PHY, Yeung
CK, Chan SSM, Lau A, Piao W, Li H, Tse JSW, et al: MAPK pathway
mutations in head and neck cancer affect immune microenvironments
and ErbB3 signaling. Life Sci Alliance. 3:e2019005452020.
View Article : Google Scholar : PubMed/NCBI
|
|
63
|
Pousada G, Baloira A and Valverde D:
Methylation analysis of the BMPR2 gene promoter region in patients
with pulmonary arterial hypertension. Arch Bronconeumol.
52:293–298. 2016.(In English, Spanish). View Article : Google Scholar : PubMed/NCBI
|
|
64
|
Liu D, Yan Y, Chen JW, Yuan P, Wang XJ,
Jiang R, Wang L, Zhao QH, Wu WH, Simonneau G, et al:
Hypermethylation of BMPR2 promoter occurs in patients with
heritable pulmonary arterial hypertension and inhibits BMPR2
expression. Am J Respir Crit Care Med. 196:925–928. 2017.
View Article : Google Scholar : PubMed/NCBI
|
|
65
|
Gräf S, Haimel M, Bleda M, Hadinnapola C,
Southgate L, Li W, Hodgson J, Liu B, Salmon RM, Southwood M, et al:
Identification of rare sequence variation underlying heritable
pulmonary arterial hypertension. Nat Commun. 9:14162018. View Article : Google Scholar : PubMed/NCBI
|
|
66
|
Zhu N, Pauciulo MW, Welch CL, Lutz KA,
Coleman AW, Gonzaga-Jauregui C, Wang J, Grimes JM, Martin LJ, He H,
et al: Novel risk genes and mechanisms implicated by exome
sequencing of 2572 individuals with pulmonary arterial
hypertension. Genome Med. 11:692019. View Article : Google Scholar : PubMed/NCBI
|
|
67
|
Kodach LL, Wiercinska E, de Miranda NF,
Bleuming SA, Musler AR, Peppelenbosch MP, Dekker E, van den Brink
GR, van Noesel CJ, Morreau H, et al: The bone morphogenetic protein
pathway is inactivated in the majority of sporadic colorectal
cancers. Gastroenterology. 134:1332–1341. 2008. View Article : Google Scholar : PubMed/NCBI
|
|
68
|
Shi J, Jiang D, Yang S, Sun Y, Wang J,
Zhang X, Liu Y, Lu Y and Yang K: Molecular profile reveals
immune-associated markers of lymphatic invasion in human colon
adenocarcinoma. Int Immunopharmacol. 83:1064022020. View Article : Google Scholar : PubMed/NCBI
|
|
69
|
Wang S, Ren T, Jiao G, Huang Y, Bao X,
Zhang F, Liu K, Zheng B, Sun K and Guo W: BMPR2 promotes invasion
and metastasis via the RhoA-ROCK-LIMK2 pathway in human
osteosarcoma cells. Oncotarget. 8:58625–58641. 2017. View Article : Google Scholar : PubMed/NCBI
|
|
70
|
Sun L, Hui AM, Su Q, Vortmeyer A,
Kotliarov Y, Pastorino S, Passaniti A, Menon J, Walling J, Bailey
R, et al: Neuronal and glioma-derived stem cell factor induces
angiogenesis within the brain. Cancer Cell. 9:287–300. 2006.
View Article : Google Scholar : PubMed/NCBI
|
|
71
|
Turashvili G, Bouchal J, Baumforth K, Wei
W, Dziechciarkova M, Ehrmann J, Klein J, Fridman E, Skarda J,
Srovnal J, et al: Novel markers for differentiation of lobular and
ductal invasive breast carcinomas by laser microdissection and
microarray analysis. BMC Cancer. 7:552007. View Article : Google Scholar : PubMed/NCBI
|
|
72
|
Kaiser S, Park YK, Franklin JL, Halberg
RB, Yu M, Jessen WJ, Freudenberg J, Chen X, Haigis K, Jegga AG, et
al: Transcriptional recapitulation and subversion of embryonic
colon development by mouse colon tumor models and human colon
cancer. Genome Biol. 8:R1312007. View Article : Google Scholar : PubMed/NCBI
|
|
73
|
Hao Y, Triadafilopoulos G, Sahbaie P,
Young HS, Omary MB and Lowe AW: Gene expression profiling reveals
stromal genes expressed in common between Barrett's esophagus and
adenocarcinoma. Gastroenterology. 131:925–933. 2006. View Article : Google Scholar : PubMed/NCBI
|
|
74
|
Pyeon D, Newton MA, Lambert PF, den Boon
JA, Sengupta S, Marsit CJ, Woodworth CD, Connor JP, Haugen TH,
Smith EM, et al: Fundamental differences in cell cycle deregulation
in human papillomavirus-positive and human papillomavirus-negative
head/neck and cervical cancers. Cancer Res. 67:4605–4619. 2007.
View Article : Google Scholar : PubMed/NCBI
|
|
75
|
Cutcliffe C, Kersey D, Huang CC, Zeng Y,
Walterhouse D and Perlman EJ; Renal Tumor Committee of the
Children's Oncology Group, : Clear cell sarcoma of the kidney:
Up-regulation of neural markers with activation of the sonic
hedgehog and Akt pathways. Clin Cancer Res. 11:7986–7994. 2005.
View Article : Google Scholar : PubMed/NCBI
|
|
76
|
Yusenko MV, Kuiper RP, Boethe T, Ljungberg
B, van Kessel AG and Kovacs G: High-resolution DNA copy number and
gene expression analyses distinguish chromophobe renal cell
carcinomas and renal oncocytomas. BMC Cancer. 9:1522009. View Article : Google Scholar : PubMed/NCBI
|
|
77
|
Alizadeh AA, Eisen MB, Davis RE, Ma C,
Lossos IS, Rosenwald A, Boldrick JC, Sabet H, Tran T, Yu X, et al:
Distinct types of diffuse large B-cell lymphoma identified by gene
expression profiling. Nature. 403:503–511. 2000. View Article : Google Scholar : PubMed/NCBI
|
|
78
|
Rosenwald A, Alizadeh AA, Widhopf G, Simon
R, Davis RE, Yu X, Yang L, Pickeral OK, Rassenti LZ, Powell J, et
al: Relation of gene expression phenotype to immunoglobulin
mutation genotype in B cell chronic lymphocytic leukemia. J Exp
Med. 194:1639–1647. 2001. View Article : Google Scholar : PubMed/NCBI
|
|
79
|
Haferlach T, Kohlmann A, Wieczorek L,
Basso G, Kronnie GT, Béné MC, De Vos J, Hernández JM, Hofmann WK,
Mills KI, et al: Clinical utility of microarray-based gene
expression profiling in the diagnosis and subclassification of
leukemia: Report from the International Microarray Innovations in
Leukemia Study Group. J Clin Oncol. 28:2529–2537. 2010. View Article : Google Scholar : PubMed/NCBI
|
|
80
|
Rosenwald A, Wright G, Chan WC, Connors
JM, Campo E, Fisher RI, Gascoyne RD, Muller-Hermelink HK, Smeland
EB, Giltnane JM, et al: The use of molecular profiling to predict
survival after chemotherapy for diffuse large-B-cell lymphoma. N
Engl J Med. 346:1937–1947. 2002. View Article : Google Scholar : PubMed/NCBI
|
|
81
|
Basso K, Margolin AA, Stolovitzky G, Klein
U, Dalla-Favera R and Califano A: Reverse engineering of regulatory
networks in human B cells. Nat Genet. 37:382–390. 2005. View Article : Google Scholar : PubMed/NCBI
|
|
82
|
Dürig J, Bug S, Klein-Hitpass L, Boes T,
Jöns T, Martin-Subero JI, Harder L, Baudis M, Dührsen U and Siebert
R: Combined single nucleotide polymorphism-based genomic mapping
and global gene expression profiling identifies novel chromosomal
imbalances, mechanisms and candidate genes important in the
pathogenesis of T-cell prolymphocytic leukemia with
inv(14)(q11q32). Leukemia. 21:2153–2163. 2007. View Article : Google Scholar : PubMed/NCBI
|
|
83
|
Hou J, Aerts J, den Hamer B, van Ijcken W,
den Bakker M, Riegman P, van der Leest C, van der Spek P, Foekens
JA, Hoogsteden HC, et al: Gene expression-based classification of
non-small cell lung carcinomas and survival prediction. PLoS One.
5:e103122010. View Article : Google Scholar : PubMed/NCBI
|
|
84
|
Compagno M, Lim WK, Grunn A, Nandula SV,
Brahmachary M, Shen Q, Bertoni F, Ponzoni M, Scandurra M, Califano
A, et al: Mutations of multiple genes cause deregulation of
NF-kappaB in diffuse large B-cell lymphoma. Nature. 459:717–721.
2009. View Article : Google Scholar : PubMed/NCBI
|
|
85
|
Haqq C, Nosrati M, Sudilovsky D, Crothers
J, Khodabakhsh D, Pulliam BL, Federman S, Miller JR III, Allen RE,
Singer MI, et al: The gene expression signatures of melanoma
progression. Proc Natl Acad Sci USA. 102:6092–6097. 2005.
View Article : Google Scholar : PubMed/NCBI
|
|
86
|
Badea L, Herlea V, Dima SO, Dumitrascu T
and Popescu I: Combined gene expression analysis of whole-tissue
and microdissected pancreatic ductal adenocarcinoma identifies
genes specifically overexpressed in tumor epithelia.
Hepatogastroenterology. 55:2016–2027. 2008.PubMed/NCBI
|
|
87
|
Iacobuzio-Donahue CA, Maitra A, Olsen M,
Lowe AW, van Heek NT, Rosty C, Walter K, Sato N, Parker A, Ashfaq
R, et al: Exploration of global gene expression patterns in
pancreatic adenocarcinoma using cDNA microarrays. Am J Pathol.
162:1151–1162. 2003. View Article : Google Scholar : PubMed/NCBI
|
|
88
|
Luo JH, Yu YP, Cieply K, Lin F, Deflavia
P, Dhir R, Finkelstein S, Michalopoulos G and Becich M: Gene
expression analysis of prostate cancers. Mol Carcinog. 33:25–35.
2002. View Article : Google Scholar : PubMed/NCBI
|
|
89
|
Cho JY, Lim JY, Cheong JH, Park YY, Yoon
SL, Kim SM, Kim SB, Kim H, Hong SW, Park YN, et al: Gene expression
signature-based prognostic risk score in gastric cancer. Clin
Cancer Res. 17:1850–1857. 2011. View Article : Google Scholar : PubMed/NCBI
|
|
90
|
Riker AI, Enkemann SA, Fodstad O, Liu S,
Ren S, Morris C, Xi Y, Howell P, Metge B, Samant RS, et al: The
gene expression profiles of primary and metastatic melanoma yields
a transition point of tumor progression and metastasis. BMC Med
Genomics. 1:132008. View Article : Google Scholar : PubMed/NCBI
|
|
91
|
Korkola JE, Houldsworth J, Chadalavada RS,
Olshen AB, Dobrzynski D, Reuter VE, Bosl GJ and Chaganti RS:
Down-regulation of stem cell genes, including those in a 200-kb
gene cluster at 12p13.31, is associated with in vivo
differentiation of human male germ cell tumors. Cancer Res.
66:820–827. 2006. View Article : Google Scholar : PubMed/NCBI
|