Introduction
Breast cancer is the most common cancer among women
worldwide, with 2.1 million newly diagnosed cases in 2018 according
to the World Health Organization (1). In the United States of America, 249,260
patients were diagnosed with breast cancer in 2016 (2). According to data released by the Cancer
Center of China in 2014, the total incidence of breast cancer in
China was 42.55 per 100,000 individuals, making breast cancer the
most common malignant tumor in women (3).
The aim of chemotherapy is to interfere with the
process of cell proliferation; therefore, most chemotherapeutic
drugs exert major effects on proliferating cells, including cancer
cells, which are characterized by abnormal and uncontrolled
proliferation (4). Chemotherapy is
currently the most effective method for systemic treatment of
patients with breast cancer and prevents the division and
proliferation of cancer cells by destroying cancer cell DNA and
disrupting the intracellular components involved in mitosis
(5). In addition, certain
chemotherapeutic drugs kill cancer cells by inducing apoptosis
(6).
Centromere proteins (CENPs) serve important roles in
centromere function and mitosis; for example, CENPA encodes
centromere protein A, which contains a variant of histone H3 that
is specifically expressed on the centromere and kinetochore of the
chromosome and is targeted by microfilaments during mitosis,
resulting in the separation of centromeres during mitosis (7). CENPB supports kinetochore formation and
contributes to the maintenance of chromosome segregation fidelity
(8). CENPC serves as a scaffold for
the specific recruitment of essential kinetochore proteins and
links centromeres and kinetochores in mitosis (9). Thus, CENPs are important components of
chromosomes during mitosis and can regulate the proliferation of
tumor cells. Therefore, we hypothesized that the expression of
CENP genes may be associated with the responses of breast
tumor cells to chemotherapy and may affect patient survival.
The aim of the present study was to systematically
explore the associations between 13 CENP genes and
chemotherapy responses in patients with breast cancer and to
identify genes that were most relevant to the patient
prognosis.
Materials and methods
Gene datasets
Five breast cancer mRNA expression profiles, namely
GSE20194 (10,11), GSE20271 (12), GSE22093 (13), GSE23988 (13) and GSE25066 (14,15),
were extracted from the Gene Expression Omnibus (GEO; http://www.ncbi.nlm.nih.gov/geo/) database using
the key words ‘breast cancer’, ‘neoadjuvant chemotherapy’ and
‘pre-operative chemotherapy’. Studies in which gene expression
levels were analyzed in genome profiling data using pretreatment
biopsies from patients who underwent neoadjuvant chemotherapy were
included. The first four datasets (GSE20194, GSE20271, GSE22093 and
GSE23988) were used as the training dataset (n=620 patients), and
the fifth dataset (GSE25066) was used as the validation dataset
(n=508 patients). The mRNA expression profiles of breast cancer
from The Cancer Genome Atlas (TCGA; http://portal.gdc.cancer.gov/) database were used for
validation. In the GEO database, the result of pathological
response was classified into pathological complete response (PCR)
and residual disease (RD). In TCGA database used for validation,
the result of pathological response was classified into clinical
complete response (CCR) and RD.
Immunohistochemistry and molecular
classification
Immunohistochemistry and molecular classification
results were extracted from the GEO database. The hormone receptor
status of a tumor was defined as positive when the
immunohistochemistry results were positive for either estrogen
receptor (ER) or progesterone receptor (PR) in ≥1% of cells and as
negative when both ER and PR were negative. According to global
consensus (16), HER2 expression
status was defined as negative when the immunohistochemistry
results were negative or 1+, and as positive when the results were
3+. HER2 positivity was evaluated according to the results of
fluorescent in situ hybridization if the
immunohistochemistry results were 2+. Tumor stage was re-evaluated
in accordance with the 8th edition of the American Joint Committee
on Cancer system (17). Tumors were
classified according to histological grade as well differentiated
(G1), moderately differentiated (G2), poorly differentiated and
undifferentiated (G3) or unknown.
PAM50 subtype classification by
‘genefu’
Data were extracted from the GEO database and,
according to the PAM50 algorithm (18) using the ‘genefu’ package (19) of R software (version 3.5) (20), tumors were classified into
basal-like, HER2-enriched, luminal A, luminal B, or normal
breast-like molecular subtypes.
Weighted correlation network analysis
(WGCNA)
Data of this part were extracted from the GEO
database publicly mentioned above. The ‘WGCNA’ package in the R
software (21) was used to perform
scale-free network topology analysis of microarray expression data
of breast cancer samples. Standard WGCNA parameters were used for
analysis. Using WGCNA, a co-expression module of genes associated
with patient clinicopathological characteristics was extracted from
the breast cancer data for subsequent analysis.
Kyoto Encyclopedia of Genes and
Genomes (KEGG) enrichment analysis of co-expression modules
KEGG pathway analyses were performed to determine
the biological functions of the genes in the green module
identified by WGCNA to be highly correlated with CENPA using
the DAVID Bioinformatics Tool (version 6.8; http://david.ncifcrf.gov/home.jsp). P<0.05 was
considered to indicate a statistically significant result. A total
of 12 records were extracted. Graphs were generated using the
‘ggplot2’ R package (22).
Statistical analysis
Data are presented as the mean, range, standard
deviation or proportion. Statistical analyses were performed using
R software (version 3.5). Univariate and multivariate survival
analyses were performed using Cox regression models. The
χ2 test was used to analyze the associations between
CENP expression levels and patient clinicopathological
characteristics. Kaplan-Meier curves were used for survival
analysis, and the Cramér-von Mises and log-rank tests were used for
the curves with and without crossovers, respectively. Comparisons
of correlations were performed using the ‘correlation coefficients’
module in MedCalc software (Version 19.6.4; MedCalc Software,
Ltd.). For comparisons of means, continuous variables between
groups were analyzed using the independent-samples Student's t-test
or one-way ANOVA. Comparisons of rates were performed using the
χ2 test. P<0.05 was considered to indicate a
statistically significant difference.
Results
Basic characteristics of the study
population
In the present study, five datasets including a
total of 1,128 patients were evaluated. The specific
characteristics of each study are presented in Table I. The cancer grades were primarily II
and III, and the nuclear grades were mainly G2 and G3. All patients
in the present study received neoadjuvant chemotherapy, and the PCR
rate was ~22.4% for all datasets combined. Data of 1,025 patients
were extracted from TCGA; all of these patients were evaluated for
overall survival rate, and 175 patients in this cohort with
chemotherapeutic response were evaluated for the gene expression
levels of PI3K, AKT and MTOR.
 | Table I.Basic characteristics of the study
population. |
Table I.
Basic characteristics of the study
population.
| Characteristic | GSE20194 | GSE20271 | GSE22093 | GSE23988 | GSE25066 |
|---|
| Total, n | 278 | 178 | 103 | 61 | 508 |
| Age, years (mean ±
SD) | 52.0±10.8 | 51.0±10.7 | 49.0±11.1 | 48.7±9.1 | 49.8±10.5 |
| Ethnicity |
|
|
|
|
|
|
White | 176 | 81 | 0 | 0 | 0 |
|
Black | 29 | 13 | 0 | 0 | 0 |
|
Asian | 18 | 1 | 0 | 0 | 0 |
|
Hispanic | 42 | 83 | 0 | 0 | 0 |
|
Mixed | 3 | 0 | 0 | 0 | 0 |
|
Unknown | 10 | 0 | 103 | 61 | 508 |
| T stage, n |
|
|
|
|
|
| T0 | 3 | 2 | 1 | 0 | 3 |
| T1 | 23 | 11 | 2 | 1 | 30 |
| T2 | 147 | 76 | 51 | 20 | 255 |
| T3 | 50 | 37 | 26 | 40 | 145 |
| T4 | 53 | 51 | 18 | 0 | 75 |
|
Unknown | 2 | 1 | 5 | 0 | 0 |
| N stage, n |
|
|
|
|
|
| N0 | 79 | 59 | 21 | 21 | 157 |
| N1 | 125 | 71 | 16 | 32 | 244 |
| N2 | 31 | 38 | 10 | 5 | 66 |
| N3 | 42 | 9 | 4 | 3 | 41 |
|
Unknown | 1 | 1 | 52 | 0 | 0 |
| Clinical AJCC
stage, n |
|
|
|
|
|
| I | 6 | 2 | 0 | 0 | 8 |
| II | 145 | 82 | 26 | 34 | 272 |
|
III | 126 | 92 | 28 | 27 | 228 |
|
Unknown | 1 | 2 | 49 | 0 | 0 |
| ER IMH, n |
|
|
|
|
|
|
Negative | 114 | 80 | 56 | 29 | 205 |
|
Positive | 164 | 98 | 42 | 32 | 297 |
|
Unknown | 0 | 0 | 0 | 5 | 6 |
| PR IMH, n |
|
|
|
|
|
|
Negative | 157 | 95 | 0 | 0 | 258 |
|
Positive | 121 | 83 | 0 | 0 | 243 |
|
Unknown | 0 | 0 | 103 | 61 | 7 |
| HER2, n |
|
|
|
|
|
|
Negative | 219 | 152 | 0 | 0 | 489 |
|
Positive | 59 | 26 | 0 | 0 | 6 |
|
Unknown | 0 | 0 | 103 | 61 | 13 |
| Nuclear grade,
n |
|
|
|
|
|
| G1 | 13 | 15 | 3 | 1 | 32 |
| G2 | 104 | 61 | 29 | 19 | 180 |
| G3 | 150 | 72 | 47 | 37 | 259 |
|
Unknown | 11 | 30 | 24 | 4 | 37 |
| PAM50 subtype,
n |
|
|
|
|
|
|
LumA | 73 | 41 | 25 | 10 | 143 |
|
LumB | 89 | 61 | 28 | 17 | 147 |
|
HER2-enriched | 35 | 21 | 3 | 2 | 41 |
|
Basal | 69 | 42 | 44 | 30 | 160 |
|
Normal | 12 | 13 | 3 | 2 | 17 |
|
Unknown | 0 | 0 | 0 | 0 | 0 |
| Pathologic
response, n |
|
|
|
|
|
| RD | 222 | 152 | 69 | 41 | 389 |
|
PCR | 56 | 26 | 28 | 20 | 99 |
|
Unknown | 0 | 0 | 0 | 6 | 20 |
Associations between CENP gene
expression levels and the clinicopathological characteristics of
patients with breast cancer
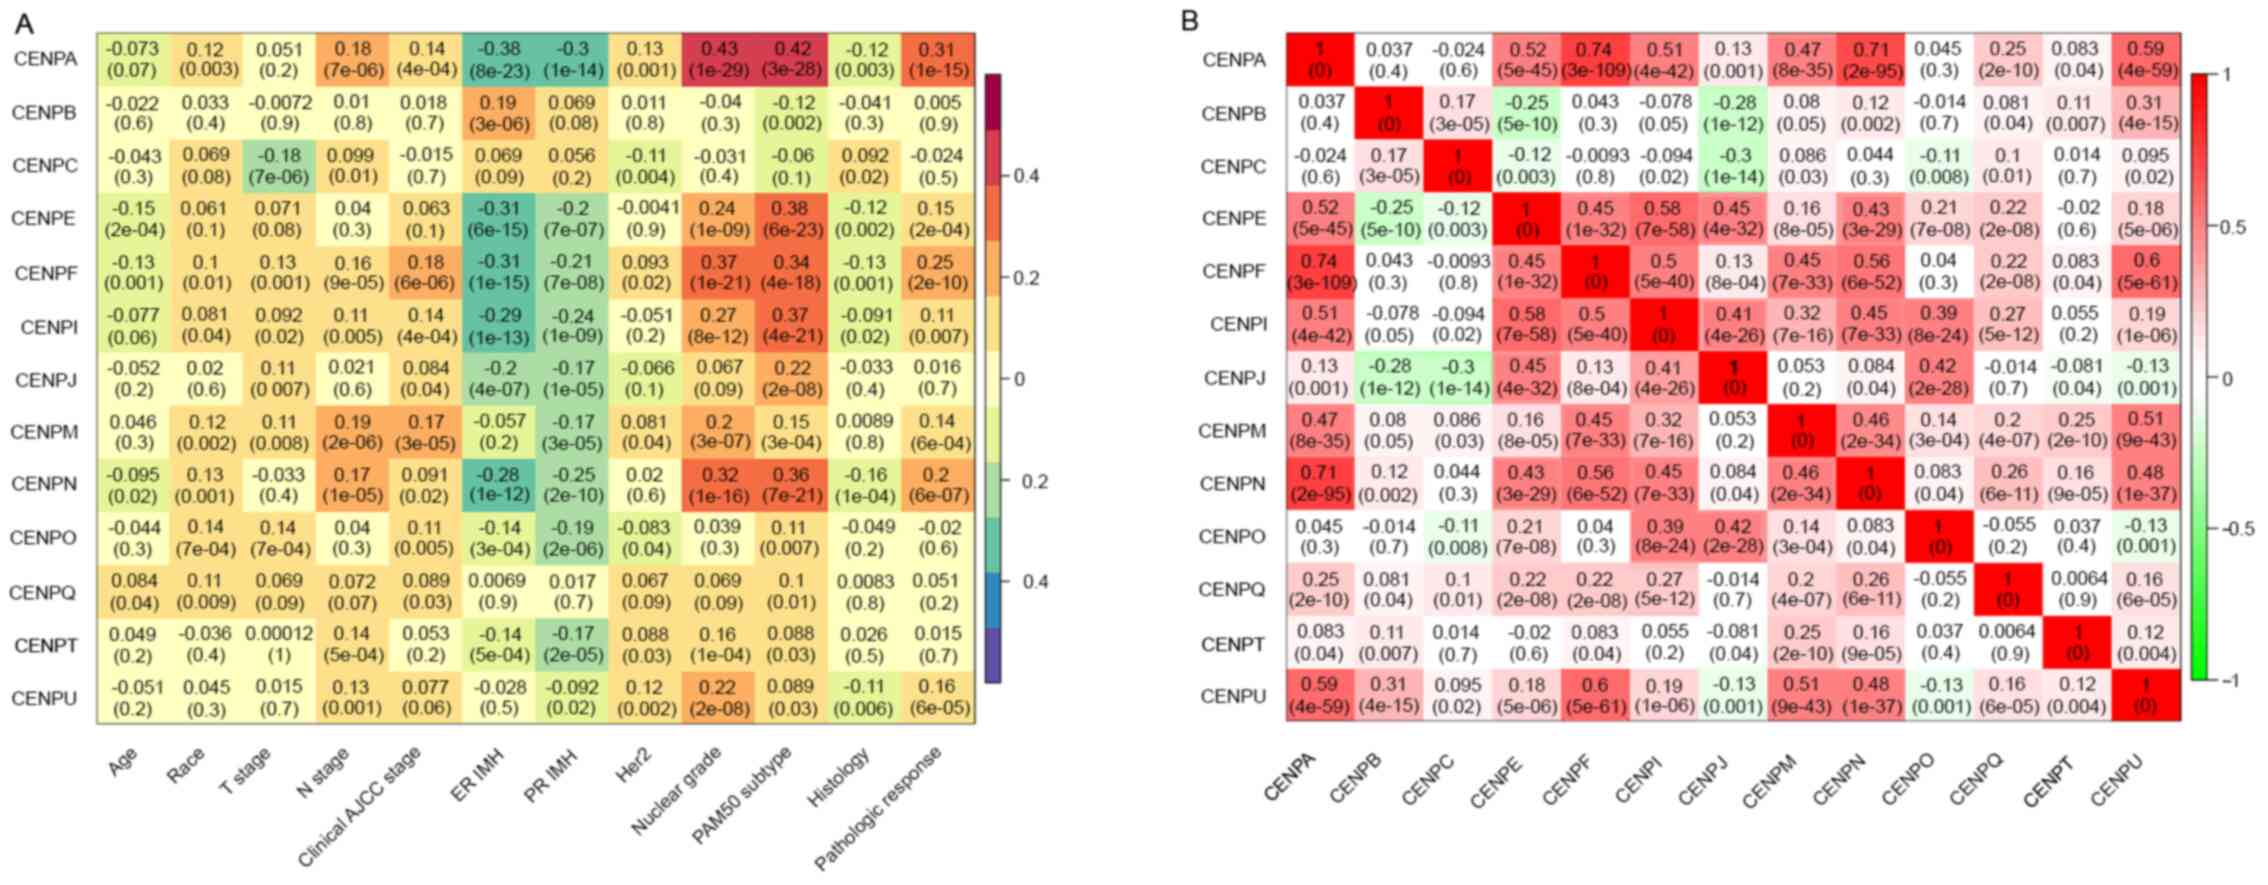
In the training dataset, the associations between 13
CENP genes and patient clinicopathological characteristics
related to breast cancer were analyzed (Fig. 1A). The results demonstrated that
CENPA was significantly associated with pathological
response, nuclear grade and PAM50 subtype. In addition, high
CENPA expression levels were associated with low levels of
ER and PR expression. Similar results were observed for CENPE,
CENPF, CENPI, CENPJ and CENPN. Therefore, we
hypothesized that CENPA, CENPE, CENPF, CENPI, CENPJ and
CENPN were likely to be co-expressed. By contrast, the
associations between CENPB, CENPC, CENPM, CENPO, CENPQ,
CENPT and CENPU and patient clinicopathological
characteristics were less notable.
Co-expression analysis of CENPs
To assess the potential co-expression relationships
among the 13 CENP genes, the co-expression of 13 CENP genes
was analyzed (Fig. 1B). The results
demonstrated that CENPA expression levels were positively
correlated with those of CENPE, CENPF, CENPI, CENPN and
CENPU. Additionally, a rectangular positive correlation
cluster was observed from CENPE to CENPQ. Significant
positive correlations were also identified among the expression
levels of CENPU, CENPF and CENPM.
Univariate and multivariate analyses
of CENP gene expression levels
Univariate and multivariate analyses of all
CENP genes associated with survival were next performed in
the validation dataset (Table II).
In the univariate analysis, with the exception of CENPM, CENPQ,
CENPT and CENPU, the expression levels of CENP
genes significantly affected patient survival. However, in the
multivariate analysis, only CENPA, CENPB, CENPC and
CENPO were independent prognostic factors for survival. In
addition, compared with the low CENP gene expression groups, the
DRFS rates were decreased when the expression levels of
CENPA and CENPO were high, and increased when the
levels of CENPB and CENPC were high (Fig. 2A and C), suggesting that CENPB
and CENPC may serve protective roles in breast cancer.
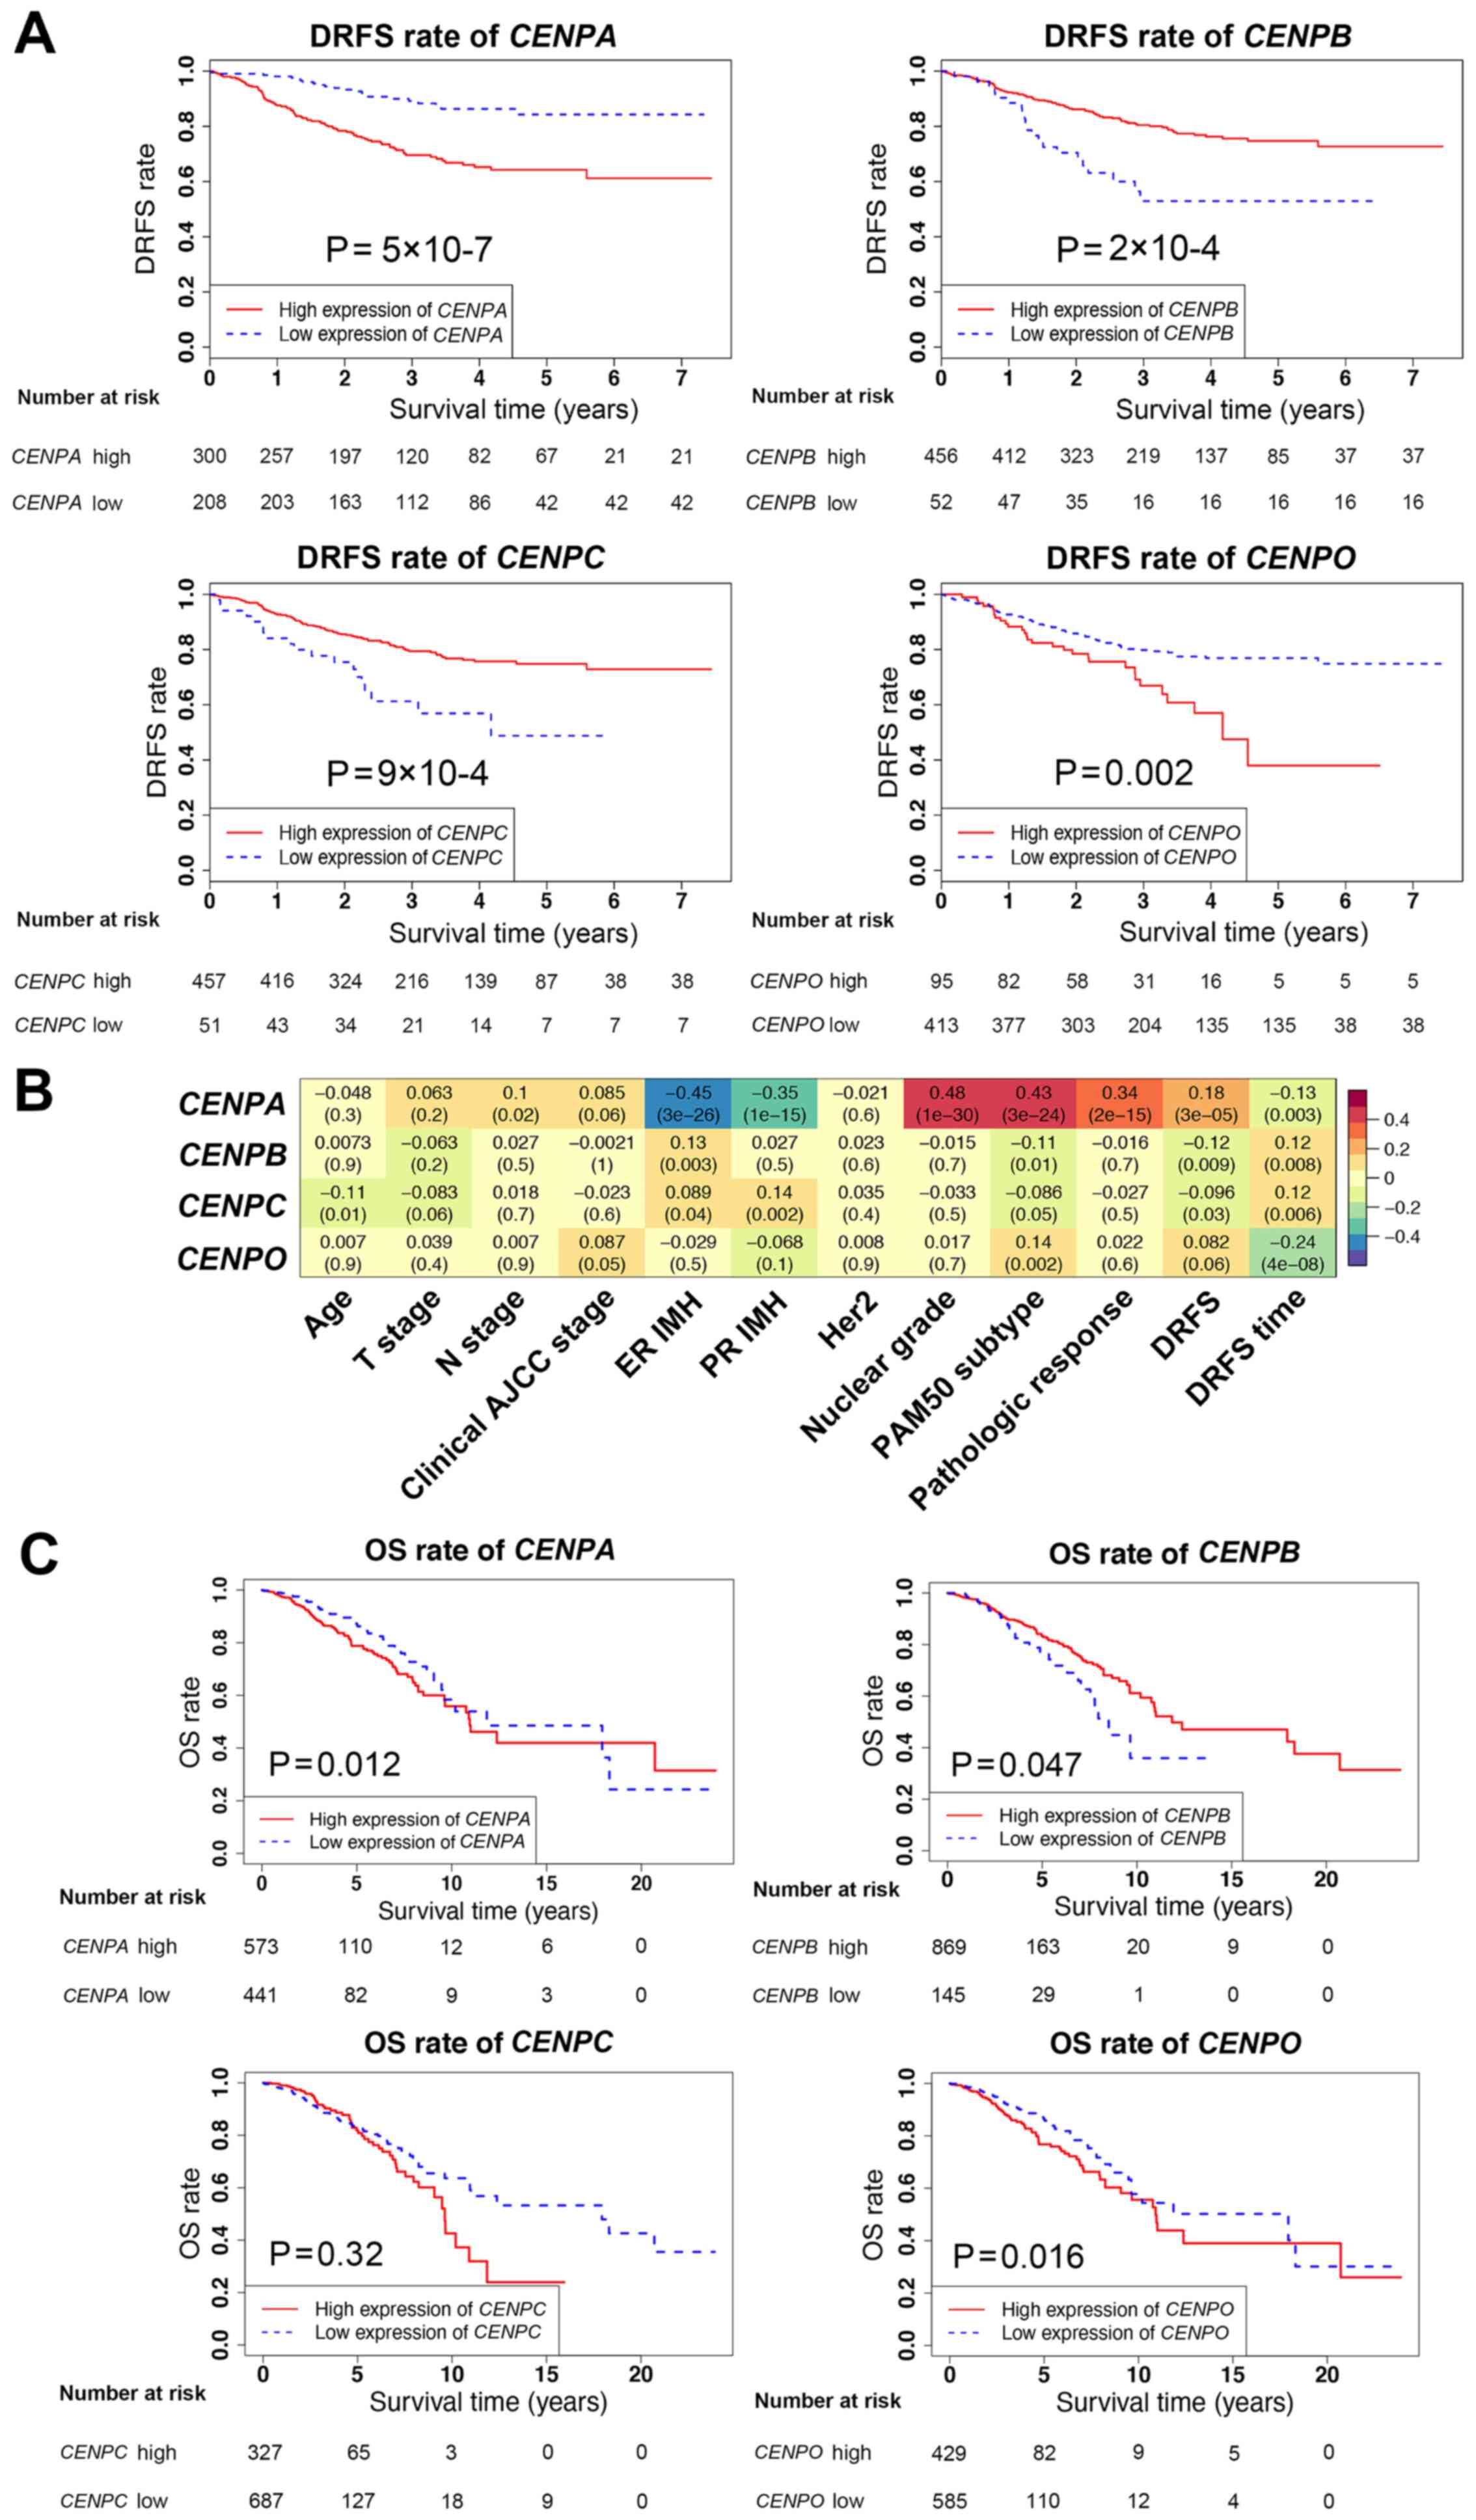 | Figure 2.Survival analysis and associations
between CENPA, CENPB, CENPC and CENPO expression
levels and patient clinicopathological characteristics. (A) DRFS
rates in patients with high or low expression of CENPA, CENPB,
CENPC and CENPO using Kaplan-Meier analysis in the
validation dataset. (B) Associations between CENPA, CENPB,
CENPC and CENPO expression levels and
clinicopathological characteristics in the validation dataset. (C)
OS rates in patients with high or low expression levels of
CENPA, CENPB, CENPC and CENPO using Kaplan-Meier
analysis in The Cancer Genome Atlas database. DRFS, distant
relapse-free survival; CENP, centromere protein; OS, overall
survival. |
| Table II.Univariate and multivariate analysis
of the association between patient survival and CENP gene
expression in the validation dataset. |
Table II.
Univariate and multivariate analysis
of the association between patient survival and CENP gene
expression in the validation dataset.
|
| Univariate
analysis | Multivariate
analysis |
|---|
|
|
|
|
|---|
| Gene | OR (95% CI) | P-value | OR (95% CI) | P-value |
|---|
| CENPA | 1.926
(1.426–2.600) | <0.001 | 2.041
(1.494–2.788) | <0.001 |
| CENPB | 0.470
(0.277–0.796) | 0.005 | 0.459
(0.272–0.773) | 0.003 |
| CENPC | 0.317
(0.131–0.762) | 0.010 | 0.347
(0.143–0.842) | 0.019 |
| CENPE | 1.975
(1.373–2.839) | <0.001 |
|
|
| CENPF | 2.094
(1.396–3.140) | <0.001 |
|
|
| CENPI | 3.917
(1.943–7.896) | <0.001 |
|
|
| CENPJ | 3.694
(1.851–7.373) | <0.001 |
|
|
| CENPM | 1.432
(0.942–2.175) | 0.093 |
|
|
| CENPN | 2.031
(1.327–3.111) | 0.001 |
|
|
| CENPO | 3.321
(1.343–8.212) | 0.009 | 3.363
(1.307–8.653) | 0.012 |
| CENPQ | 1.118
(0.377–3.322) | 0.840 |
|
|
| CENPT | 0.902
(0.560–1.453) | 0.671 |
|
|
| CENPU | 1.099
(0.925–1.307) | 0.284 |
|
|
To further determine the associations between the
CENPA, CENPB, CENPC and CENPO gene expression levels
and the clinicopathological characteristics of patients in the
training and validation datasets, correlation analysis was
performed (Fig. 2B). The results
demonstrated that the associations between the CENPA, CENPB,
CENPC and CENPO gene expression levels and patient
clinicopathological characteristics were similar in the training
and validation datasets. Although survival data in the training
dataset were lacking, based on these findings, the effects of
CENPA, CENPB, CENPC and CENPO on survival were
estimated to be similar between the training and validation
datasets, since the survival data in the validation dataset were
clear. The survival analysis was further validated using TCGA
database, which revealed that CENPA, CENPB and CENPO exerted the
same effects on patient survival rates as those observed in the GEO
validation dataset (Fig. 2C).
Notably, in TCGA database, the results for CENPC did not match
those in the GEO data; however, this difference was not
statistically significant.
Univariate and multivariate analysis
of CENP gene expression levels and patient clinicopathological
characteristics
As a number of CENP genes were significantly
associated with patient clinicopathological characteristics, these
characteristics were included in the univariate and multivariate
analyses in order to elucidate whether they may replace the
indicative function of CENP genes and affect patient
survival, and to confirm whether the identified CENP genes
were independent predictors of survival. First, patient
clinicopathological characteristics were analyzed (Table III), and multivariate analysis
these characteristics and CENP gene expression levels was
subsequently performed (Table IV).
The results demonstrated that only the node (N) stage, PAM50
subtype, pathological response and CENPA expression levels
were independent factors affecting the survival of patients with
breast cancer.
| Table III.Univariate analysis of the
association between patient clinicopathological characteristics and
survival in the validation dataset. |
Table III.
Univariate analysis of the
association between patient clinicopathological characteristics and
survival in the validation dataset.
| Characteristic | OR (95% CI) | P-value |
|---|
| Age | 0.998
(0.981–1.016) | 0.860 |
| T stage |
|
|
| T0 | 1 (ref) | <0.001 |
| T1 | 0.139
(0.027–0.723) | 0.019 |
| T2 | 0.149
(0.036–0.617) | 0.009 |
| T3 | 0.204
(0.049–0.856) | 0.030 |
| T4 | 0.440
(0.105–1.850) | 0.263 |
| N stage |
|
|
| N0 | 1 (ref) | <0.001 |
| N1 | 2.378
(1.381–4.095) | 0.002 |
| N2 | 4.432
(2.364–8.311) | <0.001 |
| N3 | 4.548
(2.265–9.133) | <0.001 |
| Clinical AJCC
stage |
|
|
| I | 1 (ref) | <0.001 |
| II | 0.643
(0.155–2.669) | 0.544 |
|
III | 1.562
(0.381–6.405) | 0.536 |
| ER IMH | 0.344
(0.234–0.507) | <0.001 |
| PR IMH | 0.380
(0.252–0.571) | <0.001 |
| HER2 | 1.752
(0.432–7.107) | 0.433 |
| Nuclear grade |
|
|
| G1 | 1 (ref) | 0.038 |
| G2 | 7.018
(0.961–51.232) | 0.055 |
| G3 | 9.466
(1.313–68.249) | 0.026 |
| PAM50 subtype |
|
|
|
LumA | 1 (ref) | <0.001 |
|
LumB | 1.434
(0.691–2.977) | 0.333 |
|
HER2-enriched | 3.280
(1.579–6.812) | 0.001 |
|
Basal | 3.975
(2.356–6.706) | <0.001 |
|
Normal | 0.828
(0.280–2.449) | 0.734 |
| Pathologic
response | 0.257
(0.120–0.554) | 0.001 |
| Table IV.Multivariate analysis of patient
clinicopathological characteristics and CENPA expression
levels in the validation dataset. |
Table IV.
Multivariate analysis of patient
clinicopathological characteristics and CENPA expression
levels in the validation dataset.
| Characteristic | OR (95% CI) | P-value |
|---|
| N stage |
|
|
| N0 | 1 (ref) | <0.001 |
| N1 | 2.848
(1.550–5.236) | 0.001 |
| N2 | 4.995
(2.508–9.948) | <0.001 |
| N3 | 4.016
(1.868–8.636) | <0.001 |
| PAM50 subtype |
|
|
|
LumA | 1 (ref) | <0.001 |
|
LumB | 1.169
(0.525–2.603) | 0.703 |
|
HER2-enriched | 2.105
(0.880–5.038) | 0.095 |
|
Basal | 3.665
(1.884–7.128) | <0.001 |
|
Normal | 0.968
(0.322–2.907) | 0.094 |
| Pathologic
response | 0.094
(0.037–0.237) | <0.001 |
| CENPA | 1.605
(1.000–2.576) | 0.050 |
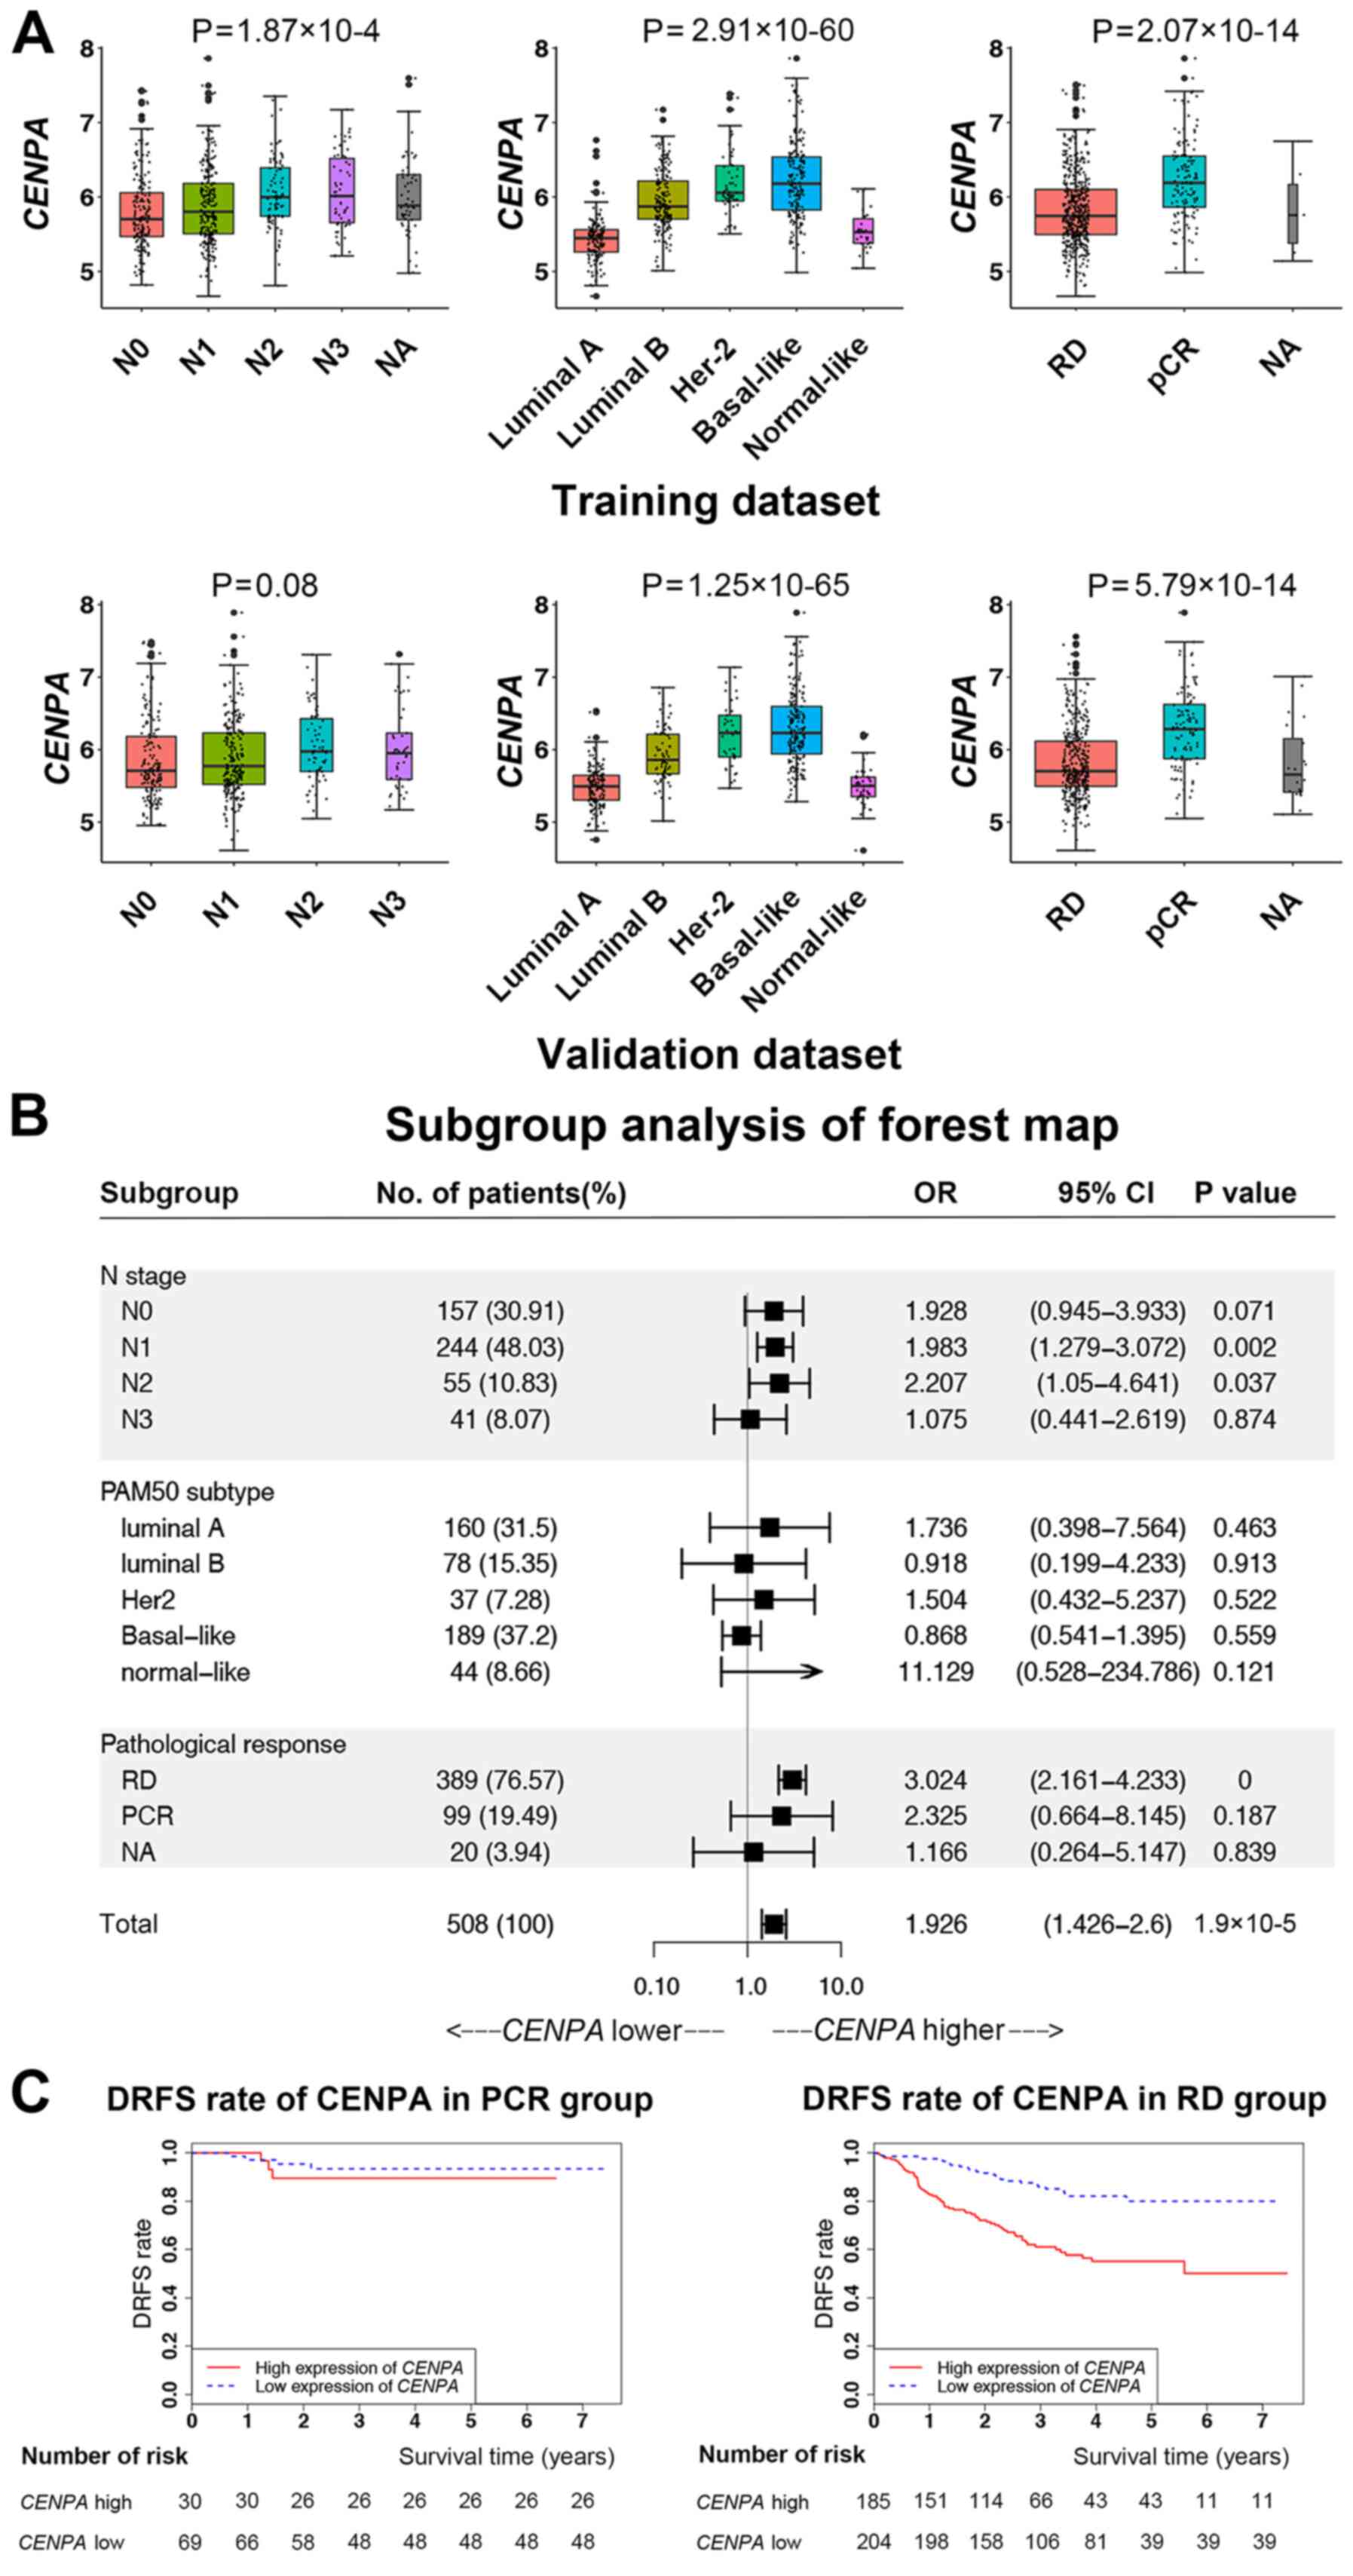
Subgroup analysis
Since CENPA was identified as an independent
factor for patient survival, further analysis of its expression
levels was performed in patient subgroups categorized by the other
three independent factors (Fig. 3A).
Similar results were obtained in the training and validation
datasets. As the N stage increased, CENPA expression levels
significantly increased. Among the PAM50 subtypes, the CENPA
expression levels in luminal B, HER2-enriched and basal-like
subtypes were significantly higher compared with those in luminal A
and normal breast-like subtypes. In the pathological response
subgroups, the expression levels of CENPA in the PCR group
were higher compared with those in the RD group.
The specific subgroups that affected the survival of
patients with breast cancer according to CENPA expression
levels were determined by performing additional subgroup analysis
(Fig. 3B). The results demonstrated
that CENPA expression levels significantly affected the
survival of patients with chemotherapy responses in the RD group,
but not in the PCR group (Fig.
3C).
Co-expression analysis of CENPA
To determine how CENPA affected the survival
of patients with RD after chemotherapy, co-expression analysis of
CENPA was performed using WGCNA (Fig. 4). The results demonstrated that the
brown module in the PCR and RD groups was positively correlated
with CENPA expression levels. However, no significant
differences were observed in the correlations between the brown
module and CENPA expression levels in the two groups
(Table V). By contrast, the green
module (Supplementary data) was significantly negatively correlated
with CENPA levels in the PCR group and slightly negatively
correlated with those in the RD group; the correlation between the
two groups was significant (P=0.0001; Table V). In addition, the green-yellow,
pink and red modules also exhibited significant differences between
the two groups (P<0.01; Table
V).
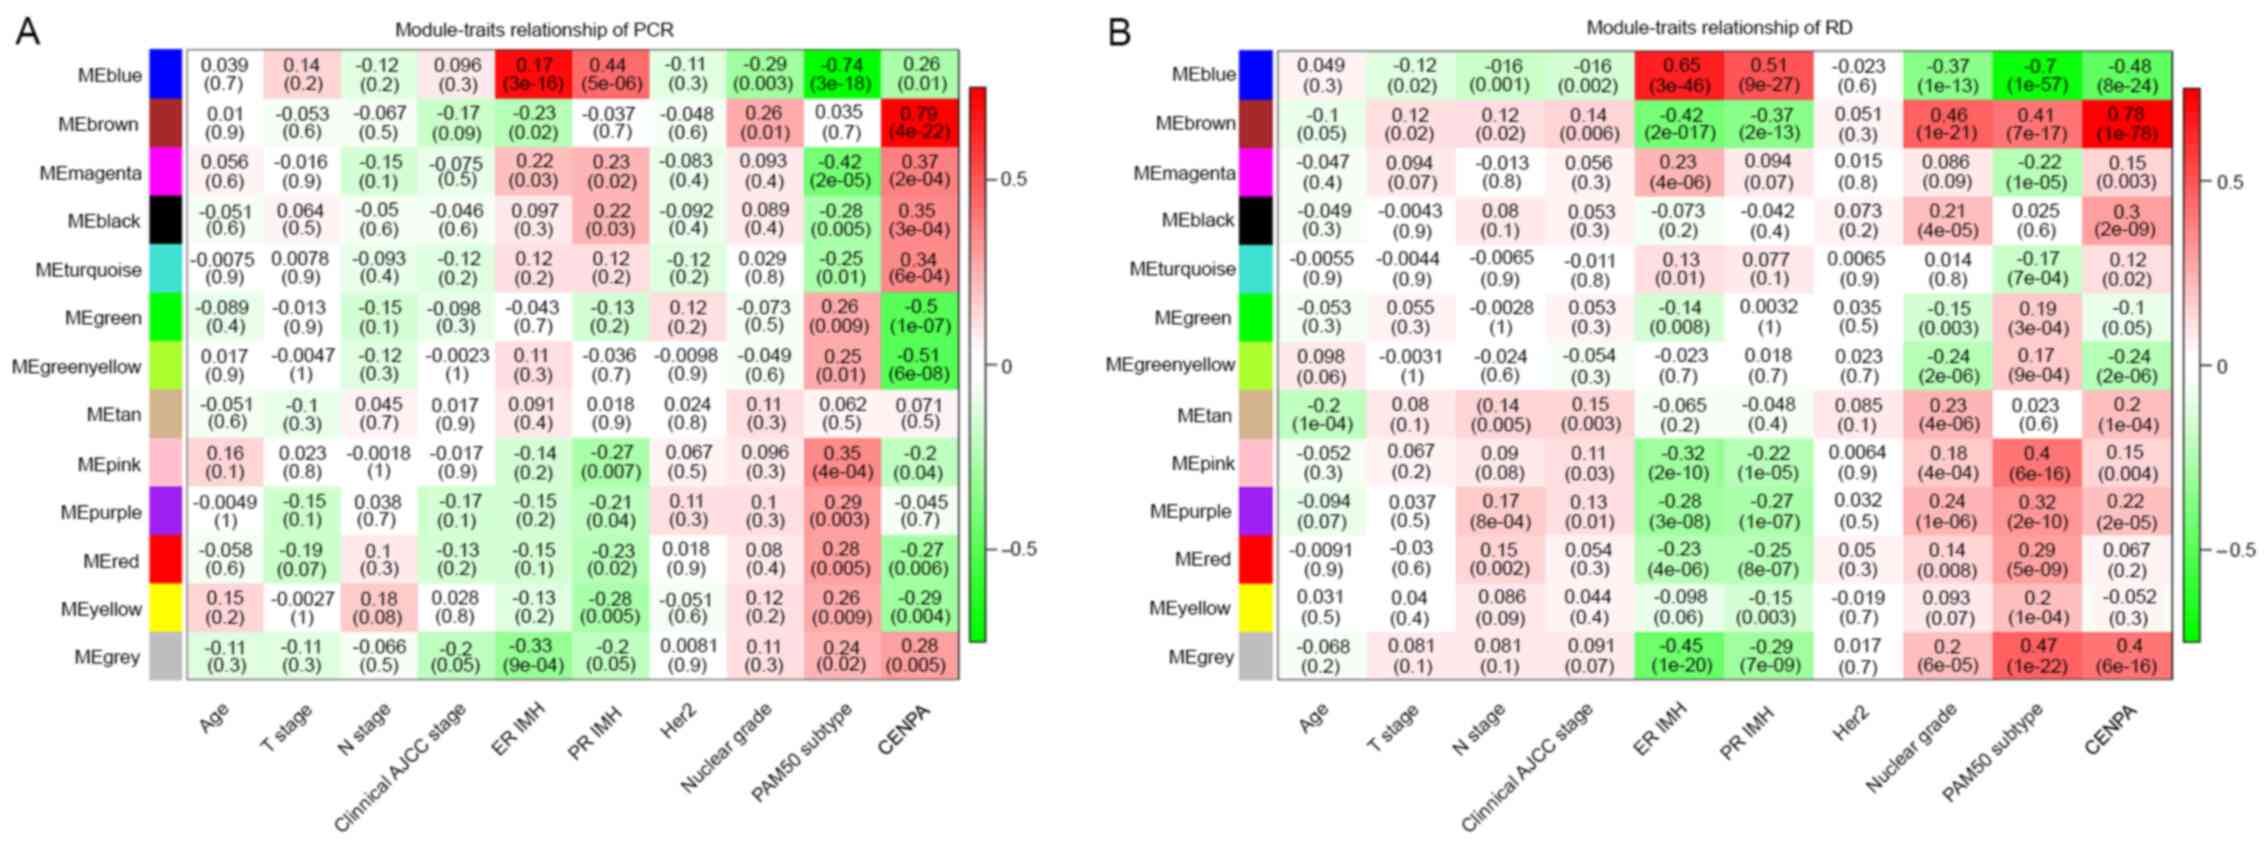 | Figure 4.Weighted correlation network analysis
plot. (A) Associations between gene modules and clinicopathological
characteristics of patients in the PCR group. (B) Associations
between gene modules and clinicopathological characteristics of
patients in the RD group. CENP, centromere protein; RD, PCR,
pathological complete response; RD, residual disease; T, tumor; N,
node; AJCC, American Joint Committee on Cancer; ER, estrogen
receptor; PR, progesterone receptor; IMH, immunohistochemistry. |
| Table V.Comparative analysis of the
correlation between each module and expression of centromere
protein A in the pathological complete response and residual
disease groups in the training and validation datasets. |
Table V.
Comparative analysis of the
correlation between each module and expression of centromere
protein A in the pathological complete response and residual
disease groups in the training and validation datasets.
| Module | Z statistic | P-value |
|---|
| Blue | −2.2523 | 0.0243 |
| Brown | −0.2285 | 0.8193 |
| Magenta | −2.0805 | 0.0375 |
| Black | −0.4904 | 0.6239 |
| Turquoise | −2.0475 | 0.0406 |
| Green | 3.9366 | 0.0001 |
| Green-yellow | 2.7879 | 0.0053 |
| Tan | 1.1540 | 0.2485 |
| Pink | 3.1028 | 0.0019 |
| Purple | 2.3559 | 0.0185 |
| Red | 3.0159 | 0.0026 |
| Yellow | 2.1615 | 0.0307 |
| Gray | 1.1922 | 0.2332 |
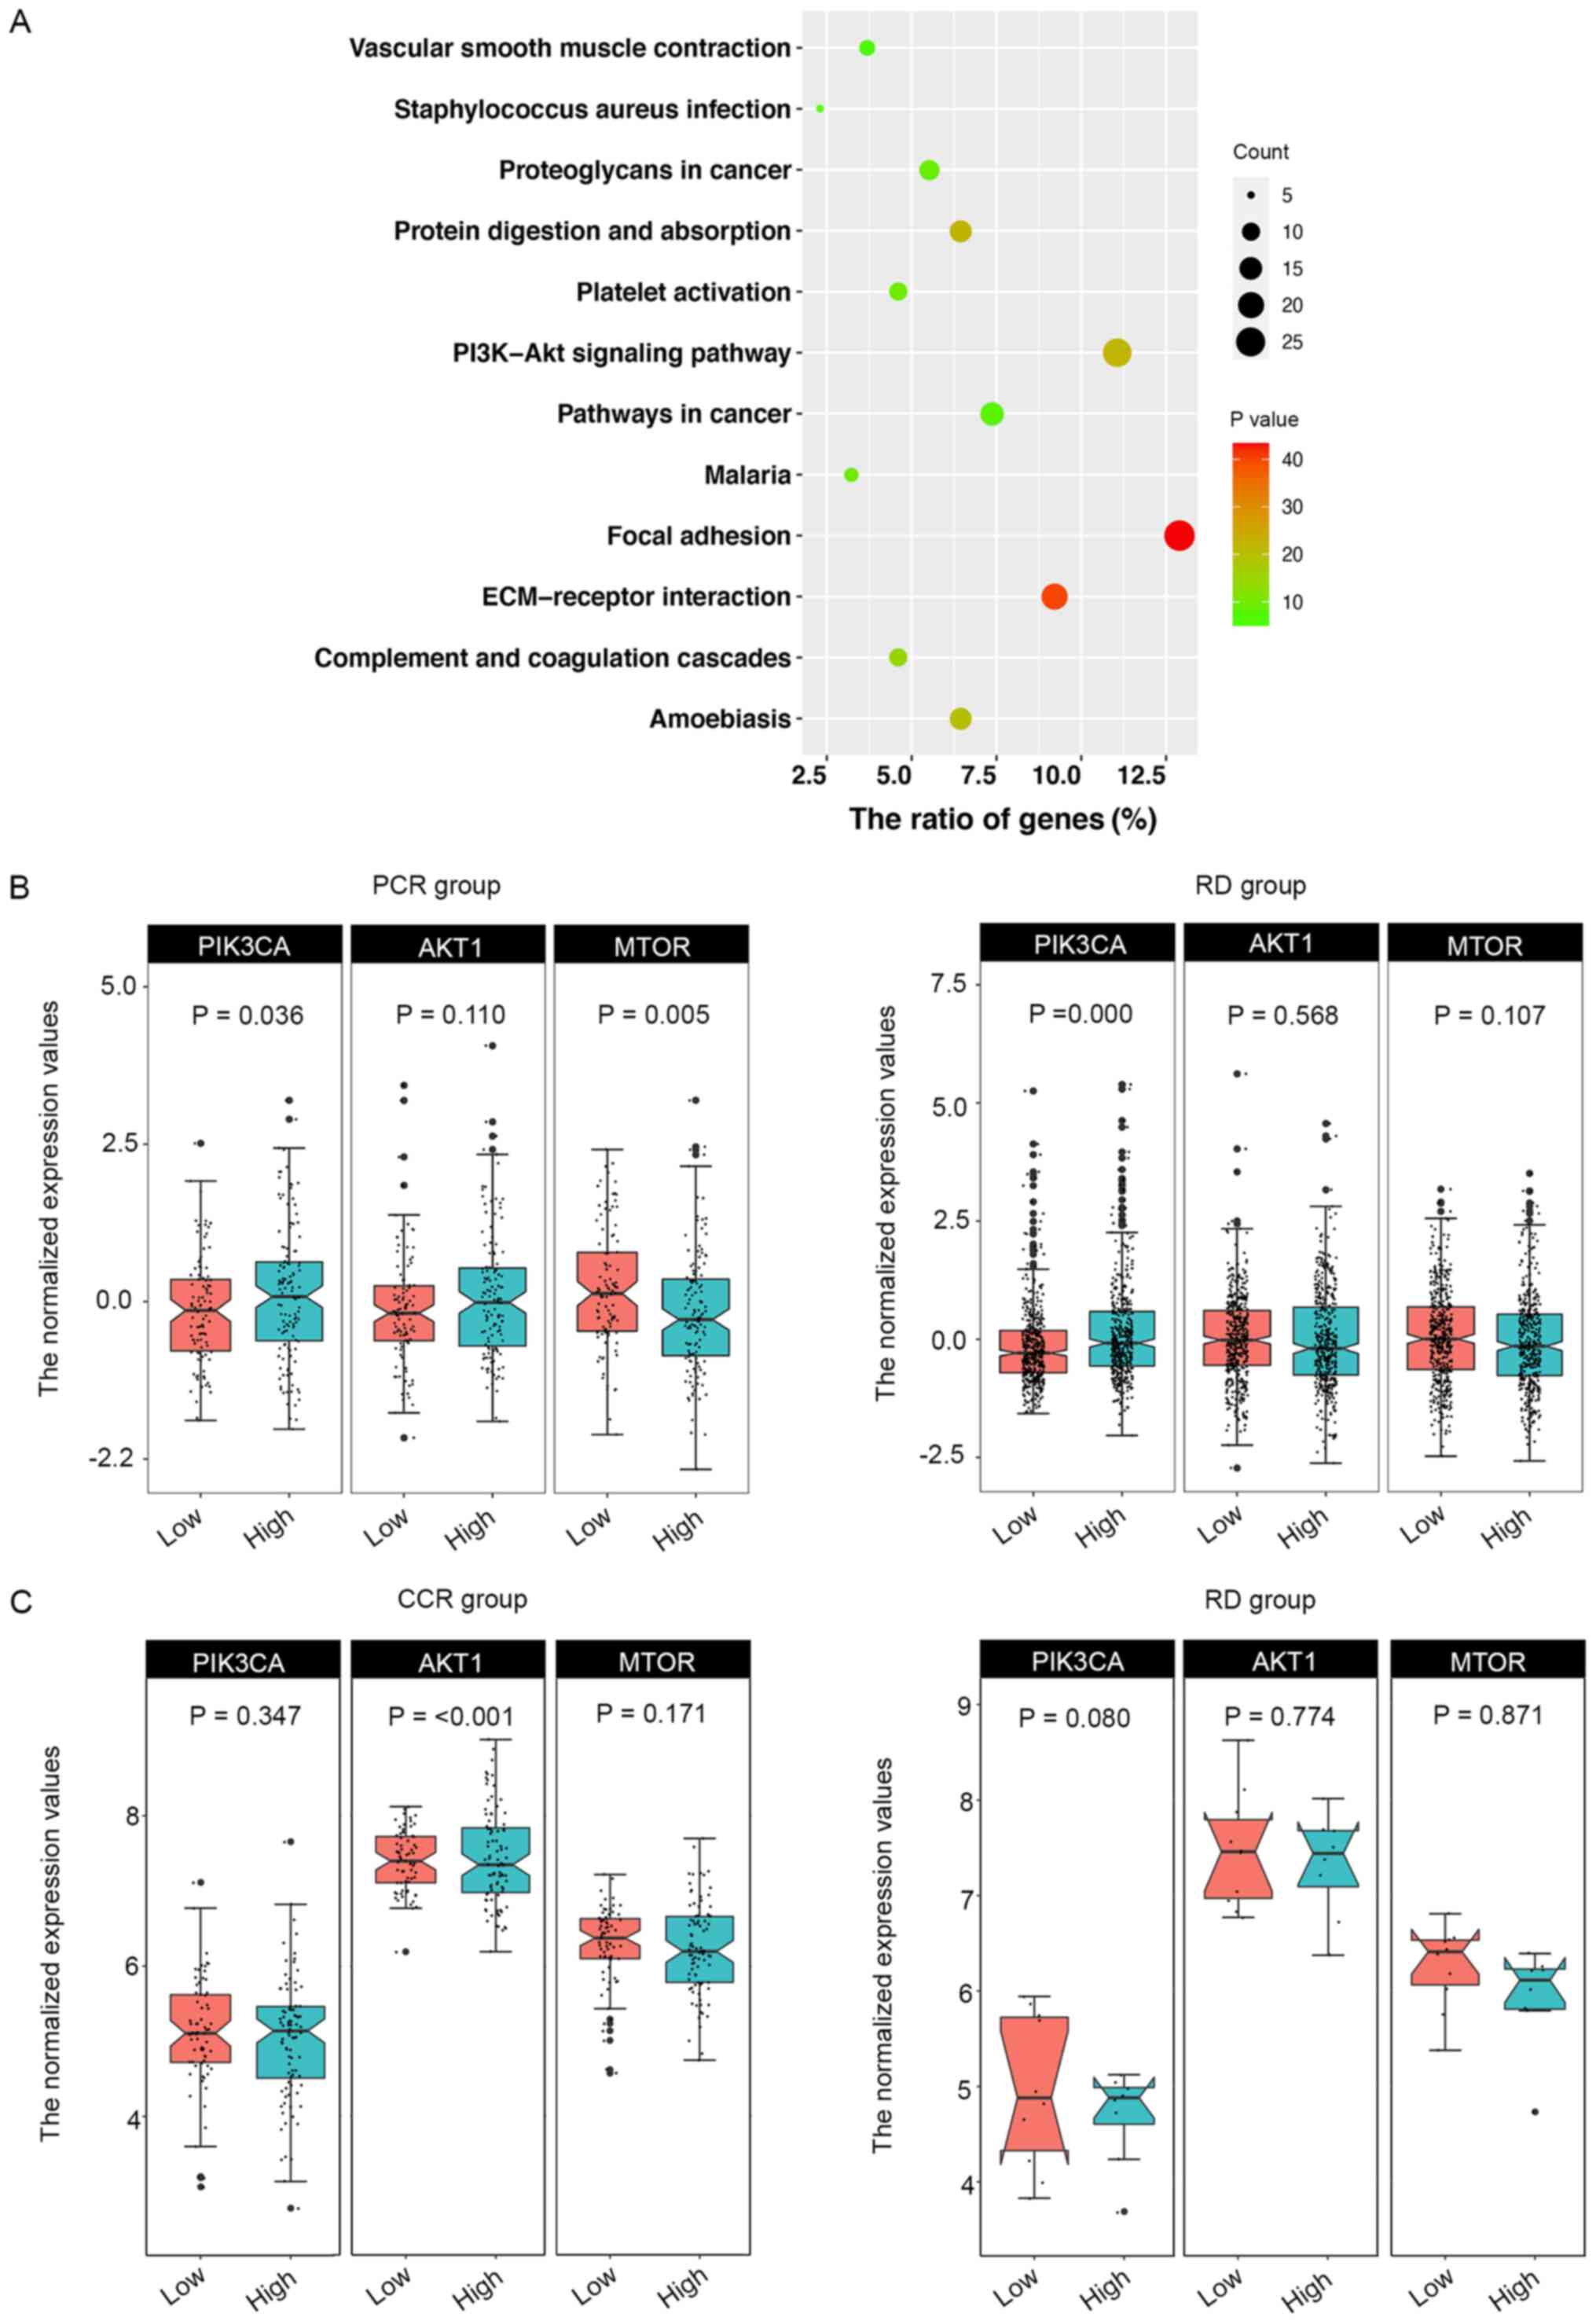
Enrichment analysis
To further explain how CENPA affected the
survival of patients who underwent chemotherapy, enrichment
analysis of signaling pathways was performed using the green module
(Fig. 5A). The results revealed that
the green module was mainly enriched in three pathways:
‘ECM-receptor interaction’, ‘focal adhesion’ and ‘PI3K-Akt
signaling pathway’. Therefore, the present study focused on three
key genes in this pathway: PI3K catalytic subunit α
(PIK3CA), AKT1 and MTOR (23) (Fig.
5B). In the PCR and RD groups, the median CENPA expression
levels were used to define whether CENPA was highly or lowly
expressed. The results demonstrated that when CENPA was
highly expressed, the expression levels of PIK3CA were also
high in the PCR and RD groups. However, compared with the low CENPA
expression group, MTOR expression levels were significantly
decreased in the PCR group but not altered in the RD group when
CENPA was highly expressed; this result was also validated using
TCGA data (Fig. 5C). Since the CCR
group in TCGA validation dataset included not only patients with
PCR but also with RD, the difference was not statistically
significant. In the RD group in TCGA data, due to the limited
number of patient samples (n=18), the results did not exhibit
accordance with those in the GEO datasets; however, a similar trend
was observed.
Discussion
The crucial factor affecting the success of breast
cancer treatment is systemic therapy, particularly chemotherapy.
CENPs are proteins that facilitate centromere formation during
mitosis; the majority of chemotherapeutic drugs kill cancer cells
by affecting or disrupting mitosis (24). Therefore, the expression of specific
CENP genes may affect the chemotherapy responses and patient
prognosis. Among patients with ER-positive breast cancer who
received no systemic therapy or tamoxifen, high levels of CENPA
were associated with low 5-year survival rates and were positively
correlated with Ki-67 expression levels (25). In addition, CENPO is required for
bipolar mitotic spindle assembly and segregation of chromosome
during mitosis; CENPO expression regulates gastric cancer cell
proliferation and is associated with poor patient prognosis
(26,27). By contrast, certain genes in the
CENP family encode proteins associated with mitosis
stabilization and may therefore improve patient prognosis. CENPB
supports kinetochore formation and contributes to the maintenance
of chromosome segregation fidelity (8). In mitosis, CENPC serves as a scaffold
for the specific recruitment of essential kinetochore proteins and
links centromeres and kinetochores (9). The results of the present study
demonstrated that high expression levels of CENPB and
CENPC were associated with a favorable prognosis in patients
with breast cancer.
In the present study, high PCR rates of patients
with breast cancer were observed when the majority of CENP
genes were highly expressed. In addition, CENPA was
identified as an independent factor affecting survival,
particularly in patients presenting with RD following chemotherapy.
Notably, genes co-expressed with CENPA were mainly
associated with cell division. However, in the PCR and RD groups,
no significant differences were observed in the correlation between
CENPA expression levels and the cell division pathway,
suggesting that CENPA affected survival through a different
pathway. Furthermore, the correlations between the green module and
CENPA expression levels in the PCR and RD groups were
significantly different. Additionally, since the ‘PI3K-Akt
signaling pathway’ was among the main enriched pathways in the
green module, we hypothesized that the chemotherapy response and
prognosis may be associated with the combination of CENPA
expression and the PI3K/Akt/mTOR pathway.
Enhanced centromere function and mitosis are
associated with high expression levels of CENPA, which is
particularly notable in human cancer cells (7). Studies using RNA sequence data from the
Oncomine database have revealed a significant positive correlation
between high CENPA expression and chemotherapy response
(using taxane as the main drug) (28). In addition, a previous study has
demonstrated a strong correlation between high levels of CENPA
expression and a positive oncolytic response to chemotherapy using
Oncomine, which indicates that high CENPA expression levels may be
used as a predictive biomarker for a positive outcome of
taxane-based chemotherapy for breast cancer (29). The results of the present study also
demonstrated that when CENPA was highly expressed, the PCR
rates increased, suggesting that the response to chemotherapy may
have been enhanced. Thus, we hypothesized that high levels of
mitotic activity in response to high CENPA expression levels
may lead to active cell proliferation, which may enhance the
chemotherapy response of tumors.
Since chemotherapy functions by inhibiting mitosis
(3), in which CENPA serves a crucial
role, we hypothesized that tumors may be highly sensitive to
chemotherapy when CENPA is expressed at high levels, and the
survival rate of patients with high CENPA expression levels
may also be higher compared with that of patients with low
CENPA levels. A previous study has demonstrated that high
CENPA expression levels in colon cancer is associated with a
favorable relapse-free survival rate (29). By contrast, the results of the
present study demonstrated that the survival rates were lower in
patients with high CENPA expression levels compared with
those in patients with low CENPA levels. Similar results
have been observed in other types of cancers, including
osteosarcoma (30,31), lung adenocarcinoma (32) and ovarian cancer (33). Specifically, the survival times of
patients in the high CENPA expression group were
significantly lower compared with those in patients in the low
CENPA expression group in patients with osteosarcoma.
Additionally, the survival time of patients with lung
adenocarcinoma in the high CENPA expression group was
<120 months (32). Another study
demonstrated that CENPA was highly expressed in ovarian
epithelial cancer and was associated with poor survival (33). In addition, in a study of breast
cancer, high expression levels of CENPA were also associated
with poor survival in patients with triple-negative breast cancer
(34). To further validate these
results, the present study divided the patients into groups based
on RD or PCR following chemotherapy. The results of this analysis
demonstrated that in the RD group, the DRFS rate was low when
CENPA was highly expressed; by contrast, CENPA
expression levels exerted no significant effects on the survival of
patients in the PCR group. Therefore, other mechanisms may mediate
the decreased survival when CENPA is highly expressed in
patients whose tumors present with PCR following chemotherapy.
In the present study, WGCNA was performed to analyze
the genes associated with CENPA expression in the PCR and RD
groups. The KEGG results demonstrated that genes co-expressed with
CENPA were mainly enriched in cell cycle-associated
pathways, including cell division cycle, nuclear division cycle,
and cell cycle phase transition (35). These results suggested that the
mitosis pathway may be the key to determining the effects of
CENPA on survival. There were no significant differences in
the correlations between the mitosis pathways and the RD group,
which indicated that CENPA did not affect survival by
synergizing with the hub genes in this module. The green module and
CENPA were significantly negatively correlated in the PCR
group, and there was a statistically significant difference between
the PCR and RD groups, suggesting that genes in the green module
may be associated with tumor progression.
Further analysis in the present study revealed that
the main pathways enriched in the green module genes were ‘focal
adhesion’, ‘ECM-receptor interaction’ and ‘PI3K-Akt signaling
pathway’. The focal adhesion pathway is primarily associated with
cancer cell migration (36). Focal
adhesion kinase is a cytoplasmic tyrosine kinase and a key
regulator of the focal adhesion complex, which mediates various
intracellular processes, such as cell motility, invasiveness,
proliferation and viability (36,37).
Signals of the extracellular matrix (ECM) modulate cell behavior,
cell interactions in forming tissues and homeostasis (38). Various components of the ECM provide
cells with a scaffold that controls and determines cell shape,
mobility, proliferation, viability and differentiation (38). Previous studies have demonstrated
that dysregulation of the ECM components causes cancer cell
invasion and progression (39–41).
The PI3K/Akt/mTOR pathway serves important roles in
the development and treatment of breast cancer (42). It is associated with the cell cycle
and affects cell proliferation, viability, differentiation and
proliferation (43). Upregulation of
the PI3K/Akt/mTOR signaling pathway promotes cell proliferation,
migration, survival and angiogenesis (44). In addition, in response to a variety
of intracellular and extracellular stimuli, such as metabolic
molecules, growth factors and hypoxia, the PI3K/Akt/mTOR pathway
regulates intracellular metabolism, cell cycle progression,
angiogenesis and tumor aggressiveness (45). Therefore, a large number of breast
cancer cases are associated with the activation of the
PI3K/Akt/mTOR pathway, which promotes stable survival and invasion
of breast cancer cells, leading to metastasis (46). Currently, inhibitors of the
PI3K/Akt/mTOR pathway, such as sirolimus, temsirolimus and
everolimus, demonstrate promising preclinical activity for the
treatment of breast cancer (47,48).
Therefore, we hypothesize that in patients presenting with RD,
tumor cell mitosis may be activated when CENPA is expressed
at high levels, and upregulation of the PI3K/Akt/mTOR pathway may
promote stable survival in activated tumor cells without being
affected by chemotherapy drugs, leading to poor survival.
Additionally, the results of the present study demonstrated that in
the PCR group, despite the high expression levels of CENPA,
the PI3K/Akt/mTOR pathway was not significantly activated,
resulting in sufficient sensitivity to chemotherapy.
One limitation of the present study was that the
chemotherapy response or resistance were not evaluated in cultured
cells in order to verify that the effects of CENPA
synergized with the PI3K/Akt/mTOR pathway. However, the present
study used multiple databases for validation and demonstrated that
the CENPA levels and chemotherapy responses may be promising
indicators to predict the survival of patients with breast
cancer.
In summary, the results of the present study
demonstrated that CENPA affected the chemotherapy responses
and prognosis of patients with breast cancer. In patients whose
tumors presented with RD following chemotherapy, the DRFS rate was
significantly decreased when CENPA was expressed at high
levels. These effects may be associated with the upregulation of
the PI3K/Akt/mTOR pathway in these patients.
Supplementary Material
Supporting Data
Acknowledgements
Not applicable.
Funding
This study was supported by The Science and
Technology Department (Sichuan, China; grant nos. 2019YFH0146 and
2020YFS0199) and The Health Commission of Sichuan Province (Grant
Research Project on Healthcare in Sichuan Province, grant no.
2019-107).
Availability of data and materials
Not applicable.
Authors' contributions
ZD and QL proposed the study concept and design. SZ
and YX performed the experiments and acquired the data. SZ and NW
analyzed and interpreted the data. SZ wrote the first draft of the
manuscript and critically revised it for important intellectual
content. YZ, JQ, QY, TT and LX analyzed the data and produced the
figures. SZ supervised the study. All authors read and approved the
final manuscript.
Ethics approval and consent to
participate
Not applicable.
Patient consent for publication
Not applicable.
Competing interests
The authors declare that they have no competing
interests.
References
|
1
|
Bray F, Ferlay J, Soerjomataram I, Siegel
RL, Torre LA and Jemal A: Global cancer statistics 2018: GLOBOCAN
estimates of incidence and mortality worldwide for 36 cancers in
185 countries. CA Cancer J Clin. 68:394–424. 2018. View Article : Google Scholar : PubMed/NCBI
|
|
2
|
Owrang M, Copeland RL Jr, Ricks-Santi LJ,
Gaskins M, Beyene D, Dewitty RL Jr and Kanaan YM: Breast cancer
prognosis for young patients. In Vivo. 31:661–668. 2017. View Article : Google Scholar : PubMed/NCBI
|
|
3
|
Fan L, Strasser-Weippl K, Li JJ, St Louis
J, Finkelstein DM, Yu KD, Chen WQ, Shao ZM and Goss PE: Breast
cancer in China. Lancet Oncol. 15:e279–e289. 2014. View Article : Google Scholar : PubMed/NCBI
|
|
4
|
Anderson MK and Matey L: Overview of
cancer and cancer treatment. Chemotherapy and Immunotherapy
Guidelines and Recommendations for Practice. Olsen MM, LeFebvre KB
and Brassil KJ: Oncology Nursing Society; Pittsburgh, PA: pp.
25–50. 2019
|
|
5
|
Liu LY, Wang F, Yu LX, Ma ZB, Zhang Q, Gao
DZ, Li YY, Li L, Zhao ZT and Yu ZG: Breast cancer awareness among
women in Eastern China: A cross-sectional study. BMC Public Health.
14:10042014. View Article : Google Scholar : PubMed/NCBI
|
|
6
|
Kaufmann SH and Earnshaw WC: Induction of
apoptosis by cancer chemotherapy. Exp Cell Res. 256:42–49. 2000.
View Article : Google Scholar : PubMed/NCBI
|
|
7
|
Yoda K, Ando S, Morishita S, Houmura K,
Hashimoto K, Takeyasu K and Okazaki T: Human centromere protein A
(CENP-A) can replace histone H3 in nucleosome reconstitution in
vitro. Proc Natl Acad Sci USA. 97:7266–7271. 2000. View Article : Google Scholar : PubMed/NCBI
|
|
8
|
Fachinetti D, Han JS, McMahon MA, Ly P,
Abdullah A, Wong AJ and Cleveland DW: DNA Sequence-specific binding
of CENP-B enhances the fidelity of human centromere function. Dev
Cell. 33:314–327. 2015. View Article : Google Scholar : PubMed/NCBI
|
|
9
|
Tanaka K, Chang HL, Kagami A and Watanabe
Y: CENP-C functions as a scaffold for effectors with essential
kinetochore functions in mitosis and meiosis. Dev Cell. 17:334–343.
2009. View Article : Google Scholar : PubMed/NCBI
|
|
10
|
Popovici V, Chen W, Gallas BG, Hatzis C,
Shi W, Samuelson FW, Nikolsky Y, Tsyganova M, Ishkin A, Nikolskaya
T, et al: Effect of training-sample size and classification
difficulty on the accuracy of genomic predictors. Breast Cancer
Res. 12:R52010. View Article : Google Scholar : PubMed/NCBI
|
|
11
|
Shi L, Campbell G, Jones WD, Campagne F,
Wen Z, Walker SJ, Su Z, Chu TM, Goodsaid FM, Pusztai L, et al: The
MicroArray quality control (MAQC)-II study of common practices for
the development and validation of microarray-based predictive
models. Nat Biotechnol. 28:827–838. 2010. View Article : Google Scholar : PubMed/NCBI
|
|
12
|
Tabchy A, Valero V, Vidaurre T, Lluch A,
Gomez H, Martin M, Qi Y, Barajas-Figueroa LJ, Souchon E, Coutant C,
et al: Evaluation of a 30-gene paclitaxel, fluorouracil,
doxorubicin, and cyclophosphamide chemotherapy response predictor
in a multicenter randomized trial in breast cancer. Clin Cancer
Res. 16:5351–5361. 2010. View Article : Google Scholar : PubMed/NCBI
|
|
13
|
Iwamoto T, Bianchini G, Booser D, Qi Y,
Coutant C, Shiang CY, Santarpia L, Matsuoka J, Hortobagyi GN,
Symmans WF, et al: Gene pathways associated with prognosis and
chemotherapy sensitivity in molecular subtypes of breast cancer. J
Natl Cancer Inst. 103:264–272. 2011. View Article : Google Scholar : PubMed/NCBI
|
|
14
|
Itoh M, Iwamoto T, Matsuoka J, Nogami T,
Motoki T, Shien T, Taira N, Niikura N, Hayashi N, Ohtani S, et al:
Estrogen receptor (ER) mRNA expression and molecular subtype
distribution in ER-negative/progesterone receptor-positive breast
cancers. Breast Cancer Res Treat. 143:403–409. 2014. View Article : Google Scholar : PubMed/NCBI
|
|
15
|
Hatzis C, Pusztai L, Valero V, Booser DJ,
Esserman L, Lluch A, Vidaurre T, Holmes F, Souchon E, Wang H, et
al: A genomic predictor of response and survival following
taxane-anthracycline chemotherapy for invasive breast cancer. JAMA.
305:1873–1881. 2011. View Article : Google Scholar : PubMed/NCBI
|
|
16
|
Colomer R, Aranda-Lopez I, Albanell J,
García-Caballero T, Ciruelos E, López-García MÁ, Cortés J, Rojo F,
Martín M and Palacios-Calvo J: Biomarkers in breast cancer: A
consensus statement by the Spanish Society of Medical Oncology and
the Spanish Society of Pathology. Clin Transl Oncol. 20:815–826.
2018. View Article : Google Scholar : PubMed/NCBI
|
|
17
|
Kim JY, Lim JE, Jung HH, Cho SY, Cho EY,
Lee SK, Yu JH, Lee JE, Kim SW, Nam SJ, et al: Validation of the new
AJCC eighth edition of the TNM classification for breast cancer
with a single-center breast cancer cohort. Breast Cancer Res Treat.
171:737–745. 2018. View Article : Google Scholar : PubMed/NCBI
|
|
18
|
Parker JS, Mullins M, Cheang MC, Leung S,
Voduc D, Vickery T, Davies S, Fauron C, He X, Hu Z, et al:
Supervised risk predictor of breast cancer based on intrinsic
subtypes. J Clin Oncol. 27:1160–1167. 2009. View Article : Google Scholar : PubMed/NCBI
|
|
19
|
Gendoo DM, Ratanasirigulchai N, Schroder
MS, Paré L, Parker JS, Prat A and Haibe-Kains B: Genefu: An
R/Bioconductor package for computation of gene expression-based
signatures in breast cancer. Bioinformatics. 32:1097–1099. 2016.
View Article : Google Scholar : PubMed/NCBI
|
|
20
|
R Core Team (2014), . R: A language and
environment for statistical computing. R Foundation for Statistical
Computing; Vienna: Available from:. http://www.R-project.org/
|
|
21
|
Langfelder P and Horvath S: WGCNA: An R
package for weighted correlation network analysis. BMC
Bioinformatics. 9:5592008. View Article : Google Scholar : PubMed/NCBI
|
|
22
|
Maag JL: gganatogram: An R package for
modular visualisation of anatograms and tissues based on ggplot2.
F1000Res. 7:15762018. View Article : Google Scholar : PubMed/NCBI
|
|
23
|
Godone RL, Leitao GM, Araujo NB,
Castelletti CH, Lima-Filho JL and Martins DB: Clinical and
molecular aspects of breast cancer: Targets and therapies. Biomed
Pharmacother. 106:14–34. 2018. View Article : Google Scholar : PubMed/NCBI
|
|
24
|
Bloom K and Costanzo V: Centromere
Structure and Function. Prog Mol Subcell Biol. 56:515–539. 2017.
View Article : Google Scholar : PubMed/NCBI
|
|
25
|
McGovern SL, Qi Y, Pusztai L, Symmans WF
and Buchholz TA: Centromere protein-A, an essential centromere
protein, is a prognostic marker for relapse in estrogen
receptor-positive breast cancer. Breast Cancer Res. 14:R722012.
View Article : Google Scholar : PubMed/NCBI
|
|
26
|
Cao Y, Xiong J, Li Z, Zhang G, Tu Y, Wang
L and Jie Z: CENPO expression regulates gastric cancer cell
proliferation and is associated with poor patient prognosis. Mol
Med Rep. 20:3661–3670. 2019.PubMed/NCBI
|
|
27
|
Xu C, Guo Z, Zhao C, Zhang X and Wang Z:
Potential mechanism and drug candidates for sepsis-induced acute
lung injury. Exp Ther Med. 15:4689–4696. 2018.PubMed/NCBI
|
|
28
|
Athwal RK, Walkiewicz MP, Baek S, Fu S,
Bui M, Camps J, Ried T, Sung MH and Dalal Y: CENP-A nucleosomes
localize to transcription factor hotspots and subtelomeric sites in
human cancer cells. Epigenetics Chromatin. 8:22015. View Article : Google Scholar : PubMed/NCBI
|
|
29
|
Sun X, Clermont PL, Jiao W, Helgason CD,
Gout PW, Wang Y and Qu S: Elevated expression of the centromere
protein-A(CENP-A)-encoding gene as a prognostic and predictive
biomarker in human cancers. Int J Cancer. 139:899–907. 2016.
View Article : Google Scholar : PubMed/NCBI
|
|
30
|
Liu R, Zhang W, Liu ZQ and Zhou HH:
Associating transcriptional modules with colon cancer survival
through weighted gene co-expression network analysis. BMC Genomics.
18:3612017. View Article : Google Scholar : PubMed/NCBI
|
|
31
|
Gu XM, Fu J, Feng XJ, Huang X, Wang SM,
Chen XF, Zhu MH and Zhang SH: Expression and prognostic relevance
of centromere protein A in primary osteosarcoma. Pathol Res Pract.
210:228–233. 2014. View Article : Google Scholar : PubMed/NCBI
|
|
32
|
Yang XR, Xiong Y, Duan H and Gong RR:
Identification of genes associated with methotrexate resistance in
methotrexate-resistant osteosarcoma cell lines. J Orthop Surg Res.
10:1362015. View Article : Google Scholar : PubMed/NCBI
|
|
33
|
Liu WT, Wang Y, Zhang J, Ye F, Huang XH,
Li B and He QY: A novel strategy of integrated microarray analysis
identifies CENPA, CDK1 and CDC20 as a cluster of diagnostic
biomarkers in lung adenocarcinoma. Cancer Lett. 425:43–53. 2018.
View Article : Google Scholar : PubMed/NCBI
|
|
34
|
Qiu JJ, Guo JJ, Lv TJ, Jin HY, Ding JX,
Feng WW, Zhang Y and Hua KQ: Prognostic value of centromere
protein-A expression in patients with epithelial ovarian cancer.
Tumour Biol. 34:2971–2975. 2013. View Article : Google Scholar : PubMed/NCBI
|
|
35
|
Zhang C, Han Y, Huang H, Min L, Qu L and
Shou C: Integrated analysis of expression profiling data identifies
three genes in correlation with poor prognosis of triple-negative
breast cancer. Int J Oncol. 44:2025–2033. 2014. View Article : Google Scholar : PubMed/NCBI
|
|
36
|
Zhao X and Guan JL: Focal adhesion kinase
and its signaling pathways in cell migration and angiogenesis. Adv
Drug Deliv Rev. 63:610–615. 2011. View Article : Google Scholar : PubMed/NCBI
|
|
37
|
Alfieri R, Giovannetti E, Bonelli M and
Cavazzoni A: New treatment opportunities in phosphatase and tensin
homolog (PTEN)-deficient tumors: Focus on PTEN/Focal adhesion
kinase pathway. Front Oncol. 7:1702017. View Article : Google Scholar : PubMed/NCBI
|
|
38
|
Lukashev ME and Werb Z: ECM signalling:
Orchestrating cell behaviour and misbehaviour. Trends Cell Biol.
8:437–441. 1998. View Article : Google Scholar : PubMed/NCBI
|
|
39
|
Huan JL, Gao X, Xing L, Qin XJ, Qian HX,
Zhou Q and Zhu L: Screening for key genes associated with invasive
ductal carcinoma of the breast via microarray data analysis. Genet
Mol Res. 13:7919–7925. 2014. View Article : Google Scholar : PubMed/NCBI
|
|
40
|
Schwertfeger KL, Cowman MK, Telmer PG,
Turley EA and McCarthy JB: Hyaluronan, inflammation, and breast
cancer progression. Front Immunol. 6:2362015. View Article : Google Scholar : PubMed/NCBI
|
|
41
|
Tolg C, McCarthy JB, Yazdani A and Turley
EA: Hyaluronan and RHAMM in wound repair and the ‘cancerization’ of
stromal tissues. Biomed Res Int. 2014:1039232014. View Article : Google Scholar : PubMed/NCBI
|
|
42
|
Paplomata E and O'Regan R: The
PI3K/AKT/mTOR pathway in breast cancer: Targets, trials and
biomarkers. Ther Adv Med Oncol. 6:154–166. 2014. View Article : Google Scholar : PubMed/NCBI
|
|
43
|
Ersahin T, Tuncbag N and Cetin-Atalay R:
The PI3K/AKT/mTOR interactive pathway. Mol Biosyst. 11:1946–1954.
2015. View Article : Google Scholar : PubMed/NCBI
|
|
44
|
McKenna M, McGarrigle S and Pidgeon GP:
The next generation of PI3K-Akt-mTOR pathway inhibitors in breast
cancer cohorts. Biochim Biophys Acta Rev Cancer. 1870:185–197.
2018. View Article : Google Scholar : PubMed/NCBI
|
|
45
|
Corti F, Nichetti F, Raimondi A, Niger M,
Prinzi N, Torchio M, Tamborini E, Perrone F, Pruneri G, Di
Bartolomeo M, et al: Targeting the PI3K/AKT/mTOR pathway in biliary
tract cancers: A review of current evidences and future
perspectives. Cancer Treat Rev. 72:45–55. 2019. View Article : Google Scholar : PubMed/NCBI
|
|
46
|
McAuliffe PF, Meric-Bernstam F, Mills GB
and Gonzalez-Angulo AM: Deciphering the role of PI3K/Akt/mTOR
pathway in breast cancer biology and pathogenesis. Clin Breast
Cancer. 10 (Suppl 3):S59–S65. 2010. View Article : Google Scholar : PubMed/NCBI
|
|
47
|
LoRusso PM: Inhibition of the
PI3K/AKT/mTOR Pathway in Solid Tumors. J Clin Oncol. 34:3803–3815.
2016. View Article : Google Scholar : PubMed/NCBI
|
|
48
|
Lee JJ, Loh K and Yap YS: PI3K/Akt/mTOR
inhibitors in breast cancer. Cancer Biol Med. 12:342–354.
2015.PubMed/NCBI
|