Introduction
Thyroid cancer (TC) originates from parafollicular
or follicular thyroid cells, and it includes papillary TC (PTC),
anaplastic TC, medullary TC, poorly differentiated TC and
follicular TC (1). According to the
Cancer Statistics report in 2019, 52,070 new cases were diagnosed
and 2,170 deaths were recorded in the United States (2). A similar situation exists in China,
where the incidence of TC was 1,700 per 100,000 people between 1981
and 2001 (3). PTC is the major
histological type of TC that accounts for 80–85% of all TC cases,
but this disease is highly curable (4,5). The
prognosis of patients with PTC after total thyroidectomy with
cervical node dissection is good, with a 10-year survival rate
>90% (6). However, PTC still
displays aggressive behaviors, such as metastasis and recurrence.
Lymph node metastasis (LNM) occurs in 50% of patients with PTC, and
the recurrence rate is up to 10% (7,8).
Therefore, to avoid the loss of quality of life of patients, a new
diagnostic or treatment method is essential for patients with
TC.
Although numerous studies have been conducted on TC
over the past decades (9,10), its underlying mechanisms remain
unclear. With the development of RNA sequencing (RNA-seq), studies
have revealed that the major mechanisms of genome alteration that
underlie cancer pathogenesis are copy number gain/loss, chromosomal
rearrangements and genetic mutations (11–13).
Several vital genome alterations have been discovered (14,15). The
mutations of B-type Raf kinase are the most well-known and
important genome alterations that promote PTC tumorigenesis and
progression by influencing the MAPK signaling pathway (16). Despite the numerous reported
mechanisms of TC, the primary ones remain to be further elucidated
(17,18).
LEM domain containing 1 (LEMD1) is a member of the
cancer/testis gene family located on human chromosome 1q32.1, a
member of the cancer/testis antigen (CTA) family. CTAs are commonly
expressed in normal testis tissues and malignant tissues (19). Therefore, the cancer/testis gene
LEMD1 may be a reasonable candidate target for the diagnosis and
treatment of carcinoma. A previous study has reported that LEMD1
expression is widely upregulated in gastric cancer, prostate
cancer, oral squamous cell carcinoma, anaplastic large cell
lymphoma and colorectal cancer (20). In addition, the overexpression of
LEMD1 promotes gastric cancer cell proliferation by activating the
PI3K/AKT signaling pathway (20).
Another study has suggested that LEMD1 promotes the tumorigenesis
of anaplastic large-cell lymphoma, and that it is a target gene of
microRNA-135b (21). Additionally,
LEMD1 has a role in the maintenance of colorectal cancer stem-like
cells (22).
To the best of our knowledge, the function of LEMD1
in PTC has not been investigated. Therefore, the present study
aimed to investigate the function and the underlying mechanism of
LEMD1 in the proliferation and migration of TC cells.
Materials and methods
Patients and tissue collection
Fresh tissue samples (47 paired PTC and non-tumor
thyroid tissues) were provided by the First Affiliated Hospital of
Wenzhou Medical University (Wenzhou, China) between May 2018 and
April 2019 as a local validated cohort. These samples were obtained
from patients who were not undergoing chemotherapy nor
radiotherapy. All of the samples were frozen in liquid nitrogen and
stored at −80°C until processing. Tumor histological review was
performed by two pathologists, and two senior pathologists
confirmed the results. The patients were informed before the
operation, and they provided written informed consent in accordance
with the guidelines of the Ethics Committee of the First Affiliated
Hospital of Wenzhou Medical University (approval no. 2012-57). The
TC expression data and corresponding clinical information were
obtained from The Cancer Genome Atlas (TCGA) portal (https://tcgadata.nci.nih.gov/tcga/). The TCGA
gene expression data of 502 PTC samples and 58 normal samples were
available.
RNA-seq
The next-generation sequencing data (79 paired PTC
and non-tumor thyroid tissues) was from our unpublished study (Wang
et al, unpublished data). Total RNA was extracted from 79
pairs of PTC and normal tissues using TRIzol® reagent
(Invitrogen; Thermo Fisher Scientific, Inc.). Total RNA
concentration was measured using a DS-11 Spectrophotometer
(DeNovix). After RNA quality was evaluated (Agilent 2100
Bioanalyzer; Agilent Technologies, Inc.; RNA integrity number
>8.0), 1,000 ng of total RNA was used to construct cDNA
libraries with the Ion Total RNA-Seq kit-v2 (Thermo Fisher
Scientific, Inc.). Next-generation sequencing was conducted on
Illumina Hiseq 2500 platform (125 bp paired end reads). Clean data
(clean reads) were obtained by removing reads containing adapter,
ploy-N and low quality reads from raw data. The clean data were
then aligned to the human reference genome version (GRCh37) using
the MapSplice program v2.1.6 (http://www.netlab.uky.edu/p/bioinfo/MapSplice/)
(23).
Gene set enrichment analysis
(GSEA)
GSEA v.4.0.3 software (http://www.broadinstitute.org/gsea) was used to
analyze various potential biological gene sets that were associated
with LEMD1 expression in TCGA dataset. The 502 PTC samples were
divided into two groups based on the median LEMD1 expression
(fragments per kilobase per million, 7.5610005855) in patients
(high- and low-expression groups). The Kyoto Encyclopedia of Genes
and Genomes subset of Canonical pathways (186 gene sets) was used
for GSEA obtained from the Molecular Signature Database v7.1
(https://www.gsea-msigdb.org/gsea/msigdb/index.jsp).
Cell lines and cell culture
TPC-1 (RRID, CVCL_6298; human PTC cell line), BCPAP
(RRID, CVCL_0153; human TC cell line), KTC-1 (RRID, CVCL_6300;
human PTC cell line) and HTORI-3 (RRID, CVCL_4W02; normal human
thyroid cell line) were used in the present study (24). KTC-1 and HTORI-3 cell lines were
provided by The Cell Bank of Type Culture Collection of The Chinese
Academy of Sciences. TPC-1 and BCPAP cell lines were obtained from
Professor Mingzhao Xing (Johns Hopkins University School of
Medicine, Baltimore, MA, USA). TPC-1, BCPAP and KTC-1 were cultured
in RPMI 1640 medium (Gibco; Thermo Fisher Scientific, Inc.)
containing 10% FBS (Invitrogen; Thermo Fisher Scientific, Inc.) and
100 U/ml penicillin-streptomycin. HTORI-3 cells were cultured in
DMEM (Gibco; Thermo Fisher Scientific, Inc.) containing 10% FBS and
100 U/ml penicillin-streptomycin. The cells were cultured at a
constant temperature of 37°C in a humidified incubator with 5%
CO2.
RNA isolation and reverse
transcription-quantitative PCR (RT-qPCR) analysis
Total RNA was extracted from the 47 pairs of PTC and
normal tissues or cells using TRIzol reagent in accordance with the
manufacturer's protocol (Invitrogen; Thermo Fisher Scientific,
Inc.). The samples with A260/A280 of 1.8–2.0 were considered for
further analysis. Subsequently, RT was performed using the ReverTra
Ace qPCR RT kit (cat. no. FSQ-101; Toyobo Life Science) according
to the manufacturer's protocol. qPCR was performed using
Thunderbird SYBR qPCR Mix (cat. no. QPS-201; Toyobo Life Science)
on Applied Biosystems 7500 (Thermo Fisher Scientific, Inc.). The
thermocycling conditions of qPCR were as follows: 40 cycles of
denaturation at 95°C for 15 sec, annealing at 60°C for 15 sec and
extension at 72°C for 45 sec. The relative LEMD1 expression was
normalized to GADPH. The 2−∆∆Cq method was used to
calculate the quantification of mRNA expression (25). The primer sequences for PCR were as
follows: LEMD1 forward, 5′-GCAAGAGCACCAAGCACCAG-3′ and reverse,
5′-TCAAGCCCACTGGGAAACCT-3′; GAPDH forward,
5′-GGTCGGAGTCAACGGATTTG-3′ and reverse,
5′-ATGAGCCCCAGCCTTCTCCAT-3′. All samples were run in
triplicate.
Cell transfection
The negative control small interfering RNA (siRNA),
the LEMD1-specific siRNA used for LEMD1-knockdown, the empty
control vector [pEX-3 (PGCMV/MCS/Neo)] and the LEMD1 overexpression
vector [pEX-3 (EcoRI/BamHI)-LEMD1] were purchased from Shanghai
GenePharma Co., Ltd. The siRNA (20 µM/µl) was transfected into TC
cell lines using Lipofectamine RNAiMAX (cat. no. 13778075; Thermo
Fisher Scientific, Inc.) in accordance with the manufacturer's
protocol for 8 h at 37°C. The vectors (1 µg/µl) were transfected
into TC cell lines using Lipofectamine 3,000 (cat. no. L3000008;
Thermo Fisher Scientific, Inc.) for 6 h at 37°C. The TC cells were
seeded into 6-well plates and incubated at 37°C for 24 h before
transfection (TPC-1, 4.0×10⁴/well; BCPAP and KTC-1,
8.0×10⁴/well). Subsequently, the transfected TC cells
were incubated at 37°C for 48 h before being harvested for
subsequent experimentation. The siRNA sequences were as follows:
siRNA-LEMD1 sense, 5′-GCCCAAUACUACCUUCCACTT-3′ and antisense,
5′-GUGGAAGGUAGUAUUGGGCTT-3′; and the non-targeting negative control
siRNA sense, 5′-UUCUCCGAACGUGUCACGUTT-3′ and antisense,
5′-ACGUGACACGUUCGGAGAATT-3′. The transfection efficiency was tested
using RT-qPCR, as aforementioned. All experiments were performed in
triplicate with three independent samples.
Cell Counting Kit-8 (CCK-8)
proliferation assay
For the CCK-8 assay (cat. no. C0040; Beyotime
Institute of Biotechnology), TPC-1 (1.25×10³
cells/well), BCPAP-1 (1.25×10³ cells/well) and KTC-1
(1.5×10³ cells/well) cells transfected with siRNA or
overexpression vector were plated into 96-well plates with the
corresponding medium. After 24, 48, 72 and 96 h, the cellular
viability of the transfected cells was tested by adding the CCK-8
solution (10 µl/well) and incubated for 3 h at 37°C. Subsequently,
the absorbance was determined at a wavelength of 450 nm with
SpectraMax M5 (Molecular Devices LLC).
Colony formation assay
The transfected cells were counted and seeded
(1.25×10³ cells/well for TPC-1 and BCPAP-1 cells, and
1.5×10³ cells/well for KTC-1 cells) in 6-well plates.
After the cells were incubated for 7–14 days at 37°C with 5%
CO2, they were washed three times with PBS and fixed
with 4% paraformaldehyde (Sigma-Aldrich; Merck KGaA) at room
temperature for 30 min. Subsequently, all plates were washed with
PBS and stained with 0.01% crystal violet staining solution at room
temperature for 20 min.
Migration and invasion assays
The cell capacity of migration was detected using
wound-healing and Transwell migration assays. Wound-healing assay
was performed on 24-well plates. Cells (2×10⁵) were
plated into wells and cultured until 100% confluency was reached. A
sterile 200-µl pipette tip was used to scratch wounds, and cells
were incubated in serum-free RPMI 1640 medium at 37°C for 24 h. The
results of the wound-healing assay were observed under a light
microscope (DMi1; Leica Microsystems GmbH) using a fixed
magnification of ×200. The migration rate was calculated as
follows: (0 h wound area-24 h wound area)/0 h wound area × 100%.
Transwell migration assay was conducted using 8-µm pore-size
Transwell chambers (cat. no. 3422; Corning, Inc.) without Matrigel
to evaluate the migratory ability. The transfected cells
(3.5×10⁴ cells/well for TPC-1, KTC-1 and BCPAP) were
seeded in the upper chamber of each insert with 200 µl serum-free
RPMI 1640 medium. Subsequently, the lower chambers were filled with
600 µl RPMI 1640 medium containing 10% FBS. After the cells were
incubated for 24 h at 37°C, those that migrated were fixed with 4%
paraformaldehyde and stained with 0.01% crystal violet staining
solution both at room temperature for 15 min each.
Cell invasion was measured using 8-µm pore-size
invasion chambers pre-coated with Matrigel® (cat. no.
354480; Corning, Inc.). The transfected tumor cell suspensions
(4×10⁴ cells/well for TPC1, BCPAP and KTC-1) in 200 µl
serum-free RPMI-1640 medium were placed in the upper chamber, while
the lower chamber was filled with 600 µl RPMI-1640 medium with 10%
FBS. The same steps used for migration assays were used to fix and
stain the cells on the bottom surface of the upper chamber. The
results of the migration and invasion assays were observed under a
light microscope (DMi1; Leica Microsystems GmbH) using a fixed
magnification of ×200.
Apoptotic analysis
Apoptosis was measured using an Annexin-V-FITC/PI
Apoptosis Detection kit (cat. no. 556547; BD Biosciences). The
tumor cells were collected after transfection for 48 h.
Subsequently, they were centrifuged at 1,000 × g for 3 min at 4°C,
and the supernatant was removed. The cells were resuspended in PBS.
These steps were repeated three times. Subsequently, 5 µl Annexin
V-FITC and 5 µl PI were added to the solution to stain the cells
for 15 min in the dark at room temperature in accordance with the
manufacturer's protocol. The cells were analyzed using a BD
FACScantoII flow cytometer (BD Biosciences) and FlowJo v10.0
software (FlowJo LLC). Apoptosis included early (Q3) and late
apoptosis (Q2). Percentage of apoptosis=Q2 + Q3.
Protein extraction and western blot
(WB) analysis
The cells were lysed in cell lysis buffer (cat. no.
P0033; Beyotime Institute of Biotechnology) to extract the total
cell protein. Lysate protein concentrations were measured using
bicinchoninic acid assay. The protein samples (20 µg protein/lane)
were separated via 10% SDS-PAGE and then were electro-transferred
onto PVDF membranes. Subsequently, the membranes were blocked with
5% skimmed milk (cat. no. 232100; BD Biosciences) in TBS-Tween
(TBST; 0.1% Tween-20) for 2 h at room temperature and then
incubated with primary antibodies for 12 h at 4°C. Finally, after
the membranes were rinsed three times in TBST, they were incubated
with goat anti-mouse IgG/HRP (cat. no. SE131; 1:5,000; Beijing
Solarbio Science & Technology Co., Ltd.) or goat anti-rabbit
IgG/HRP secondary antibodies (cat. no. SE134; 1:5,000; Beijing
Solarbio Science & Technology Co., Ltd.) for 2 h at room
temperature. The target bands were detected using BeyoECL Plus
(cat. no. P0018M; Beyotime Institute of Biotechnology) and analyzed
using ImageJ v1.50b (National Institutes of Health). The primary
antibodies were as follows: LEMD1 (1:500; cat. no. ab201206;
Abcam), N-cadherin (1:1,000; cat. no. 22018-1-AP; ProteinTech
Group, Inc.), E-cadherin (1:1,000; cat. no. 20874-1-AP; ProteinTech
Group, Inc.), β-catenin (1:5,000; cat. no. 51067-2-AP; ProteinTech
Group, Inc.), vimentin (1:8,000; cat. no. 60330-1-LG; ProteinTech
Group, Inc.), Caspase 3/Cleaved caspase 3 (1:500; cat. no.
19677-1-AP; ProteinTech Group, Inc.) and β-actin (1:2,000; cat. no.
60008-1-Ig, ProteinTech Group, Inc.).
Statistical analysis
Statistical analyses were performed using SPSS
software (v23.0; IBM Corp.). The χ2 test or Fisher's
exact test were used to assess the association between
clinicopathological characteristics and LEMD1 expression. The
association between LEMD1 and LNM was analyzed using univariate and
multivariate Cox regression analysis. Statistical significance was
evaluated using Wilcoxon test, Mann-Whitney test, one-way ANOVA
followed by Tukey's post-hoc test or Student's unpaired t-test. The
diagnosis potential of LEMD1 was evaluated by receiver operating
characteristic (ROC) curve using SPSS software. The optimal cut-off
value of LEMD1 expression was determined by maximizing the Youden
index value. Youden index=(sensitivity + specificity) −1. All
experiments were repeated in triplicate at least three times. The
data are presented as the mean ± SD. P<0.05 was considered to
indicate a statistically significant difference.
Results
LEMD1 expression is upregulated in
TC
In the present study, RNA-seq was performed on 79
paired PTC and non-tumor thyroid tissues to detect the RNA
expression, and the results revealed that LEMD1 expression in the
PTC tissues was significantly upregulated compared with that in the
paired non-cancer tissues (Fig. 1A;
Table SI). The results from TCGA
cohort were consistent with those from the RNA-seq dataset
(Fig. 1B). Furthermore, LEMD1
expression in 47 paired PTC and non-tumor thyroid tissues was
detected using RT-qPCR (Fig. 1C),
revealing that LEMD1 expression was significantly upregulated in
tumor compared with in normal tissues. The diagnostic potential of
LEMD1 was evaluated using ROC curve analysis. In the RNA-seq cohort
(sensitivity, 81.0; specificity, 87.3), TCGA dataset (sensitivity,
79.1; specificity, 93.1) and the local validated cohort
(sensitivity, 78.7; specificity, 91.5), the ROC curve analyses
indicated that LEMD1 expression may be a potential marker for TC
from normal thyroid tissues (Fig.
1D-F). These results indicated that LEMD1 may be a potential
gene for the diagnosis and treatment of TC.
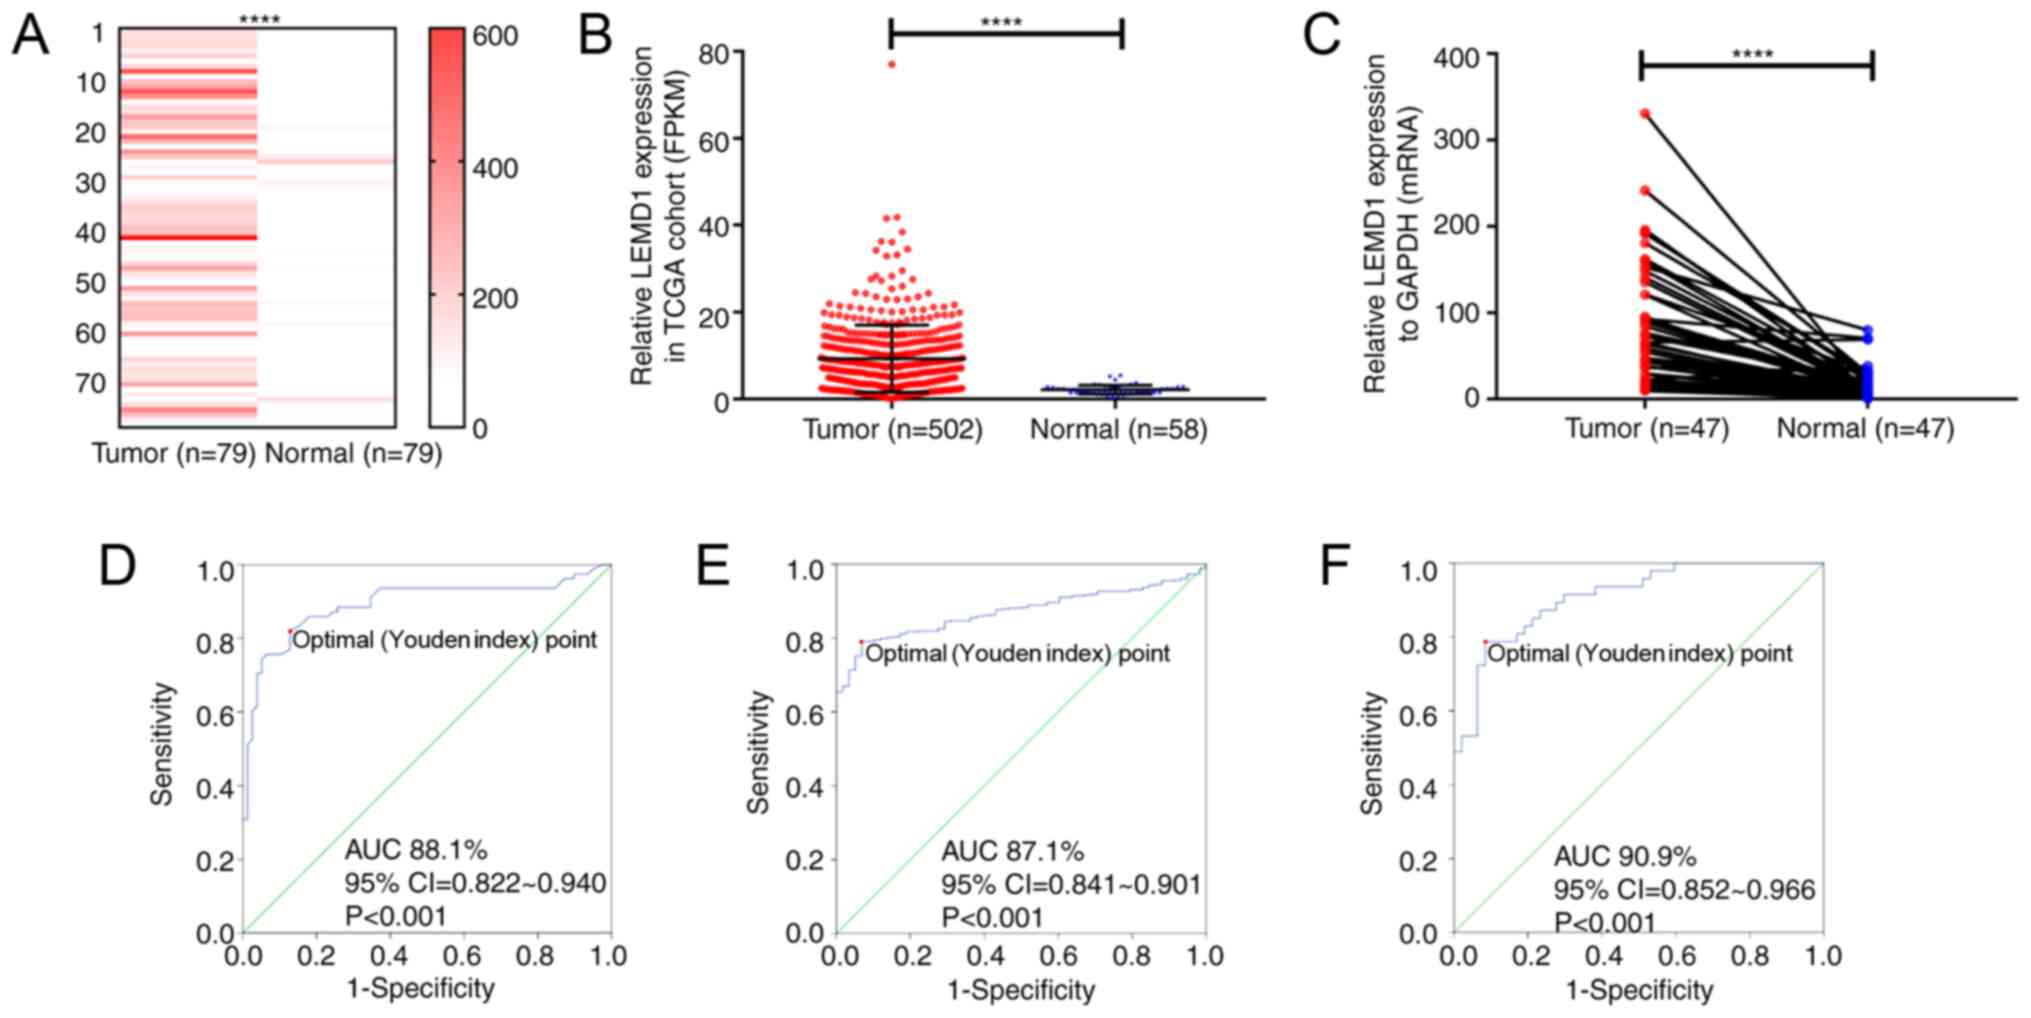 | Figure 1.LEMD1 expression in TC tissues is
upregulated compared with that in normal thyroid tissues. LEMD1
expression was significantly upregulated in the tumor tissues of
(A) the RNA-seq cohort (Wilcoxon test), (B) TCGA dataset
(Mann-Whitney test) and (C) the local validated cohort (Wilcoxon
test). Receiver operating characteristic curve analysis of LEMD1
expression was used to identify TC tissues from normal thyroid
tissues in (D) the RNA-seq cohort (sensitivity and specificity
values were 81.0 and 87.3, respectively), (E) TCGA dataset
(sensitivity and specificity values were 79.1 and 93.1,
respectively) and (F) the local validated cohort (sensitivity and
specificity values were 78.7 and 91.5, respectively). The optimal
cut-off value of LEMD1 expression was determined by maximizing the
Youden index value. Youden index=(sensitivity + specificity)-1.
Data are shown as the mean ± SD of three independent experiments.
****P<0.0001. LEMD1, LEM domain containing 1; TC, thyroid
cancer; TGCA, The Cancer Genome Atlas; FPKM, fragments per kilobase
per million; AUC, area under curve. |
LEMD1 expression is associated with
clinicopathological characteristics in patients with TC
The association between LEMD1 expression and the
clinicopathological features of patients with TC was analyzed in
TCGA dataset and the local validated cohort. According to LEMD1
expression, the RNA-seq results of LEMD1 expression from TCGA
dataset were divided into two groups, namely the high- (n=251) and
low-expression (n=251) groups. The results revealed that LEMD1
expression was associated with histological type (P<0.001),
tumor size (P=0.039), LNM (P<0.001) and disease stage (P=0.001)
(Table I). However, no significant
association was observed between LEMD1 expression and sex, age and
distant metastasis. In the local validated cohort, LEMD1 expression
was associated with LNM (P=0.006) and disease stage (P=0.002)
(Table II). All analyses supported
that LEMD1 may act as a cancer-promoting gene in TC.
 | Table I.Association between LEMD1 expression
and clinicopathological features in The Cancer Genome Atlas cohort
(n=502). |
Table I.
Association between LEMD1 expression
and clinicopathological features in The Cancer Genome Atlas cohort
(n=502).
|
| High LEMD1 | Low LEMD1 |
|
|
|---|
| Clinicopathological
features | expression
(n=251) | expression
(n=251) | χ2 | P-value |
|---|
| Histological
type |
|
| 30.288 |
<0.001a |
|
Classical | 206 | 150 |
|
|
| Other
types | 45 | 101 |
|
|
| Age, years |
|
| <0.001 |
>0.999a |
| Mean ±
SD | 47.55±16.03 | 47.13±15.66 |
|
|
|
≤45 | 113 | 113 |
|
|
|
>45 | 138 | 138 |
|
|
| Sex |
|
| 0.010 | 0.920a |
|
Male | 67 | 68 |
|
|
|
Female | 184 | 183 |
|
|
| Tumor size, mm |
|
| 4.277 | 0.039a |
|
≥20 | 189 | 168 |
|
|
|
<20 | 62 | 83 |
|
|
| Lymph node
metastasis |
|
| 35.179 |
<0.001a |
|
Yes | 144 | 78 |
|
|
| No | 107 | 173 |
|
|
| Distant
metastasis |
|
| NA | 0.504b |
|
Yes | 3 | 6 |
|
|
| No | 248 | 245 |
|
|
| AJCC disease
stage |
|
| 10.992 | 0.001a |
|
I+II | 150 | 185 |
|
|
|
III+IV | 101 | 66 |
|
|
| Table II.Association between LEMD1 expression
and clinicopathological features in the local validated cohort
(n=47). |
Table II.
Association between LEMD1 expression
and clinicopathological features in the local validated cohort
(n=47).
|
| High LEMD1 | Low LEMD1 |
|
|
|---|
| Clinicopathological
features | expression
(n=23) | expression
(n=24) | χ2 | P-value |
|---|
| Histological
type |
|
| NA | NA |
|
Classical | 23 | 24 |
|
|
| Age, years |
|
| 0.180 | 0.671a |
| Mean ±
SD | 47.56±14.43 | 48.23±14.86 |
|
|
|
≤45 | 15 | 14 |
|
|
|
>45 | 11 | 10 |
|
|
| Sex |
|
| 0.295 | 0.587a |
|
Male | 6 | 8 |
|
|
|
Female | 17 | 16 |
|
|
| Tumor size, mm |
|
| 0.236 | 0.627a |
|
≥20 | 15 | 14 |
|
|
|
<20 | 8 | 10 |
|
|
| Lymph node
metastasis |
|
| 7.671 | 0.006a |
|
Yes | 16 | 7 |
|
|
| No | 7 | 17 |
|
|
| Distant
metastasis |
|
| NA | NA |
| No | 23 | 24 |
|
|
| AJCC disease
stage |
|
| NA | 0.002b |
|
I+II | 15 | 24 |
|
|
|
III+IV | 8 | 0 |
|
|
High LEMD1 expression aggravates the
risk of LNM in TC
The association between LNM and LEMD1 expression was
evaluated using logistic regression analysis. The results of the
univariate logistic regression analysis are shown in Table III. The significant variables
associated with LNM were LEMD1 expression odds ratio (OR), 2.985;
95% CI, 2.070–4.305, P<0.001), histological type (OR, 2.649; 95%
CI, 1.747–4.017; P<0.001), age (OR, 0.653; 95% CI, 0.458–0.931;
P=0.019), sex (OR, 0.63; 95% CI, 0.424–0.937; P=0.023) and tumor
size (OR, 2.283; 95% CI, 1.514–3.441; P<0.001) (Table III). Meanwhile, multivariate
logistic regression analysis was performed using the parameters
with significant variables in univariate logistic regression. The
results indicated that LEMD1 expression (OR, 2.581; 95% CI,
1.752–3.804; P<0.001), histological type (OR, 2.128; 95% CI,
1.365–3.318; P=0.001), age (OR, 0.647; 95% CI, 0.441–0.950;
P=0.026), sex (OR, 0.627; 95% CI, 0.410–0.960; P=0.032) and tumor
size (OR, 2.206; 95% CI, 1.429–3.406; P<0.001) were independent
high-risk factors of LNM (Table
IV).
| Table III.Univariate logistic regression
analysis for the risk of lymph node metastasis. |
Table III.
Univariate logistic regression
analysis for the risk of lymph node metastasis.
| Factor | Odds ratio | 95% CI | P-value |
|---|
| LEMD1 expression
(high vs. low) | 2.985 | 2.070–4.305 |
<0.001a |
| Histological type
(PTC vs. other TC subtypes) | 2.649 | 1.747–4.017 |
<0.001a |
| Age (≤45 vs. >45
years) | 0.653 | 0.458–0.931 | 0.019 a |
| Sex (male vs.
female) | 0.630 | 0.424–0.937 | 0.023a |
| AJCC disease stage
(III+IV vs. I+II) | 1.009 | 2.468–3.803 | 0.989 |
| Tumor size (≥20 vs.
<20 mm) | 2.283 | 1.514–3.441 |
<0.001a |
| Table IV.Multivariate logistic regression
analysis for the risk of lymph node metastasis. |
Table IV.
Multivariate logistic regression
analysis for the risk of lymph node metastasis.
| Factor | Odds ratio | 95% CI | P-value |
|---|
| LEMD1 expression
(high vs. low) | 2.581 | 1.752–3.804 |
<0.001a |
| Histological type
(PTC vs. other TC subtypes) | 2.128 | 1.365–3.318 | 0.001a |
| Age (≤45 vs. >45
years) | 0.647 | 0.441–0.950 | 0.026a |
| Sex (male vs.
female) | 0.627 | 0.410–0.960 | 0.032a |
| Tumor size (≥20 vs.
<20 mm) | 2.206 | 1.429–3.406 |
<0.001a |
LEMD1 promotes the proliferation of TC
cell lines
Given that LEMD1 expression was generally
upregulated in TC, LEMD1 may serve an important role in TC
tumorigenesis and progression. Thus, LEMD1 expression in TC cell
lines and a normal human thyroid cell line (HTORI-3) was assessed
at the mRNA and protein levels. LEMD1 expression was significantly
upregulated in TPC-1, BCPAP and KTC-1 cells compared with in
HTORI-3 cells (Fig. 2A).
Subsequently, si-LEMD1 or LEMD1 overexpression vector were chosen
to knock down or overexpress, respectively, LEMD1 expression in the
TC cell lines, and the transfection efficiency was evaluated via
RT-qPCR and WB (Fig. 2B and C).
Subsequently, CCK-8 and colony formation assays were performed. The
results revealed that LEMD1-knockdown significantly inhibited cell
proliferation and colony formation, while LEMD1 overexpression
promoted the proliferation and colony formation of TPC-1, BCPAP and
KTC-1 cell lines (Fig. 2D-F).
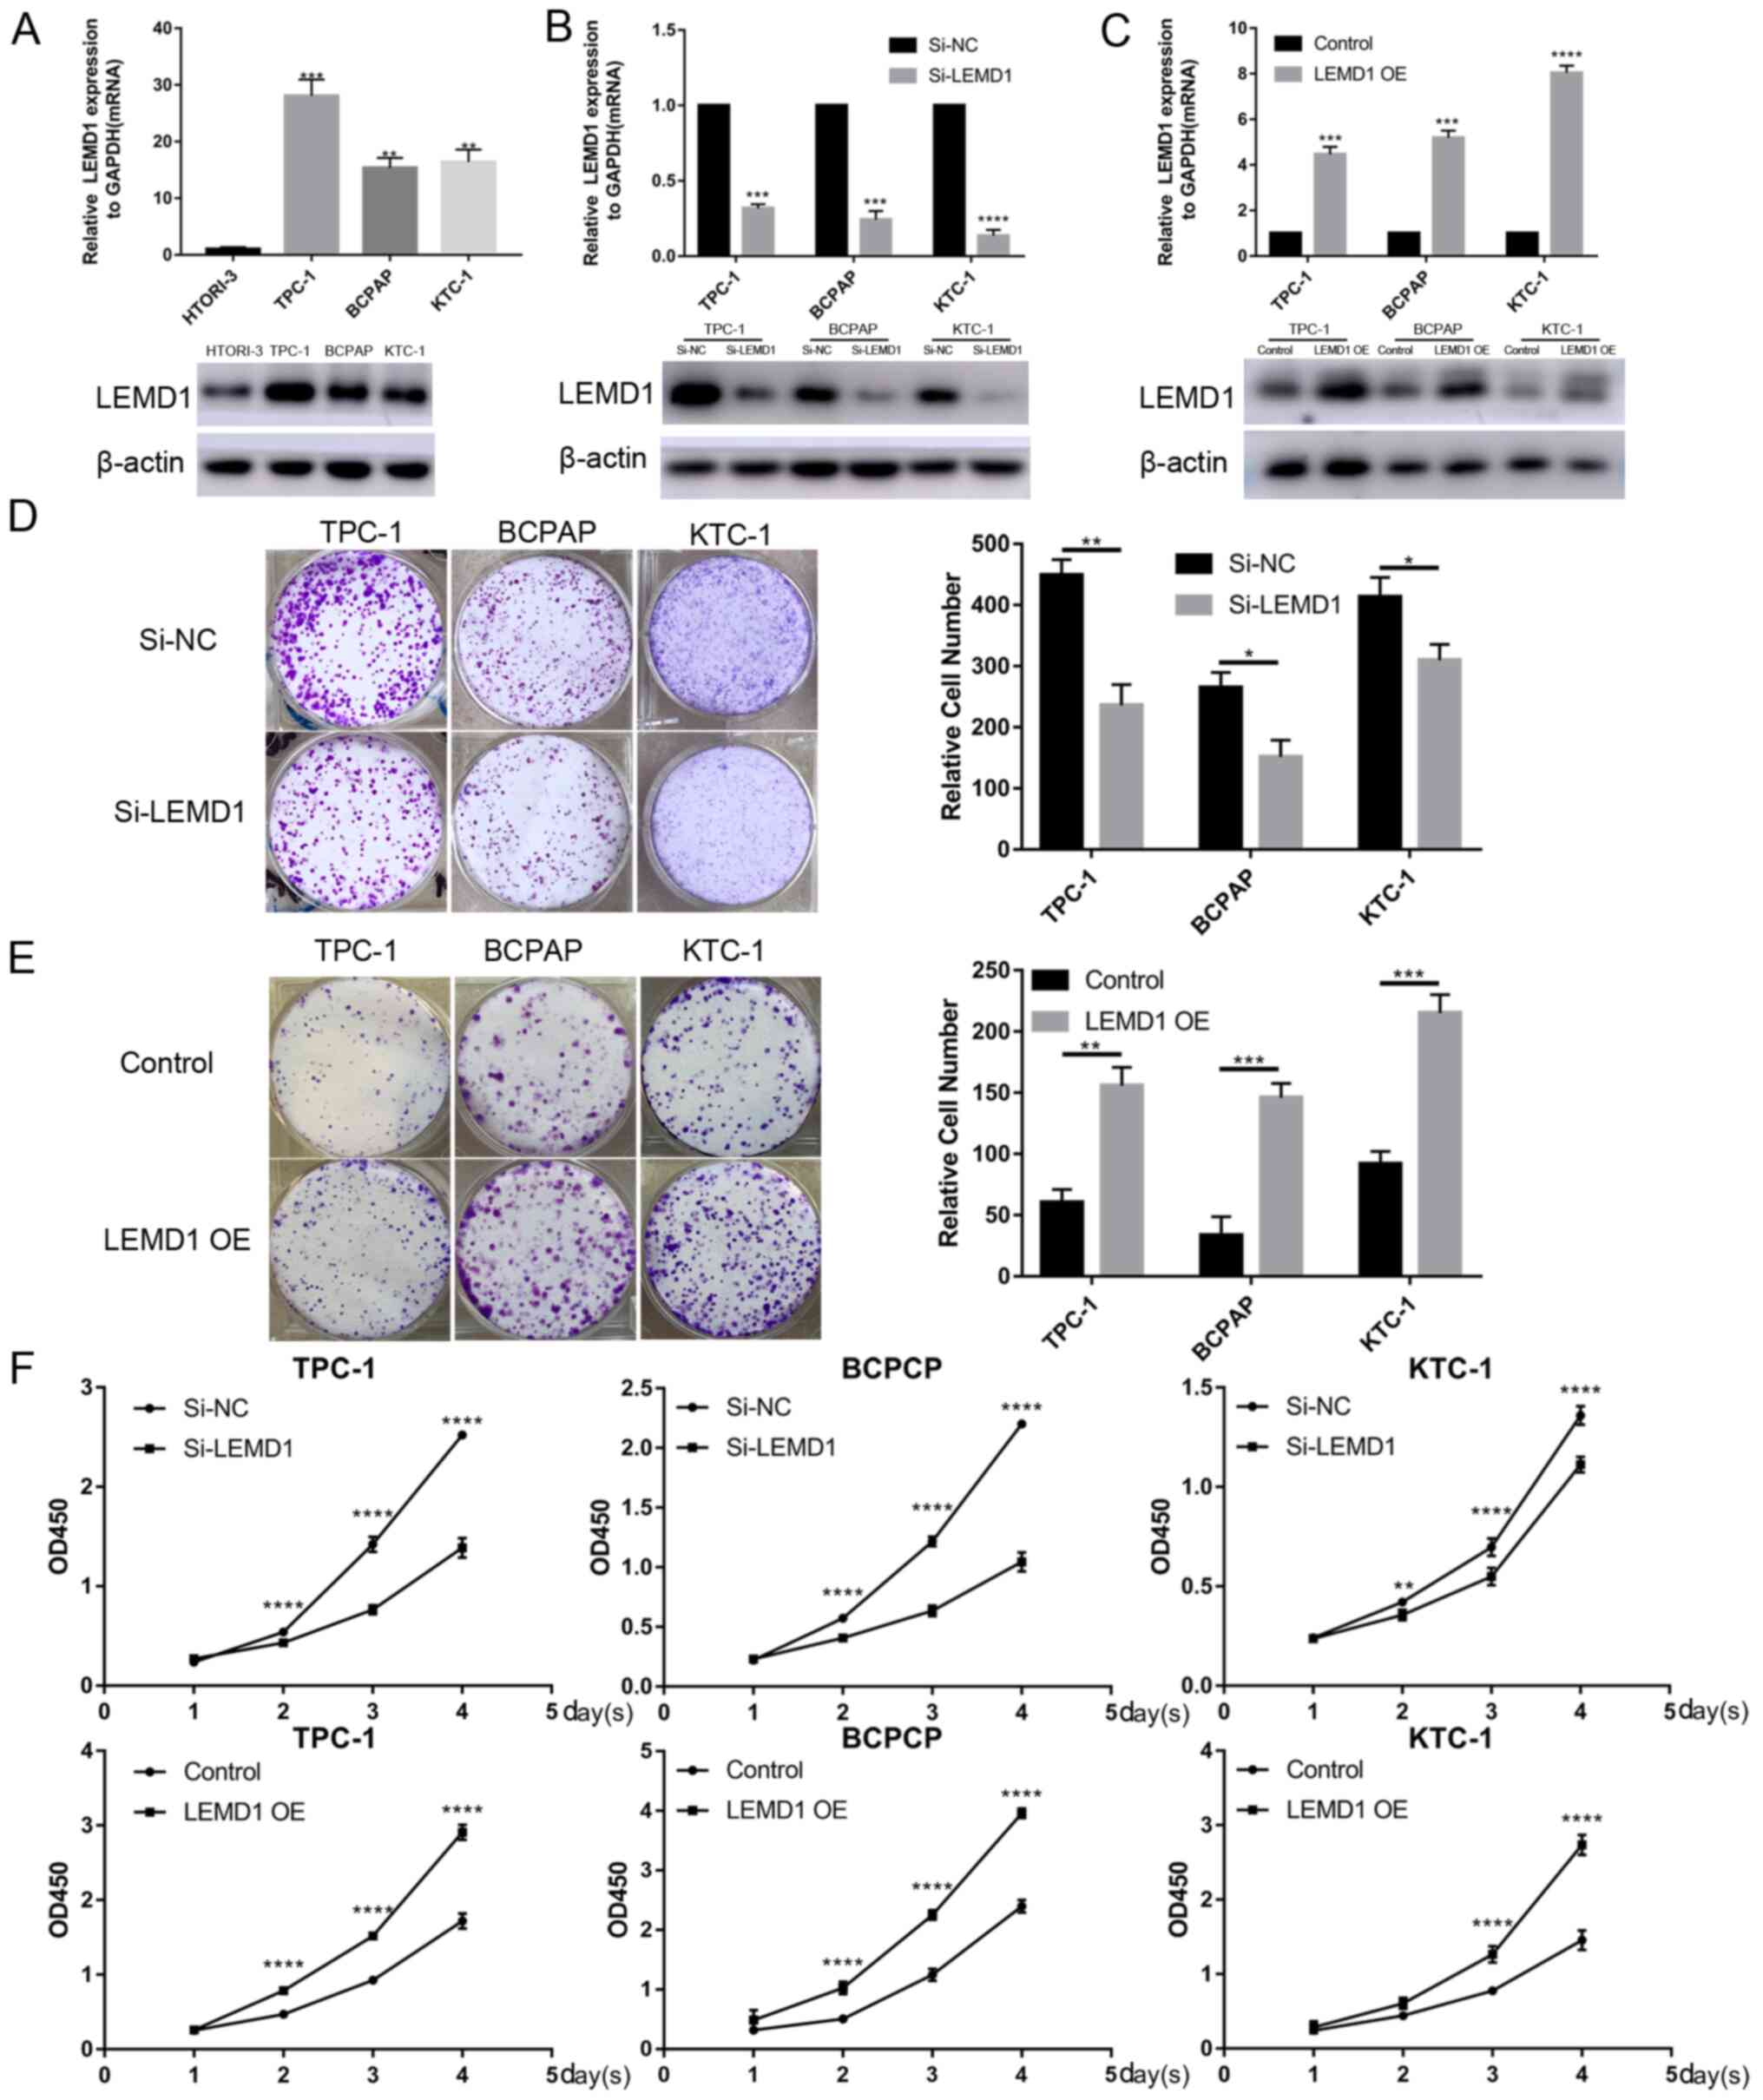 | Figure 2.TC cell transfection with LEMD1 siRNA
or overexpression vector reveals that LEMD1 promotes TC cell
proliferation. (A) Relative mRNA and protein LEMD1 expression in
HTORI-3 (normal human thyroid cell line) and three TC cell lines.
(B) LEMD1 expression was detected via RT-qPCR and WB in TPC-1,
BCPAP and KTC-1 cell lines transfected with siRNA. (C) Transfection
efficiency of LEMD1 overexpression vector in TC cell lines detected
via RT-qPCR and WB. Results of colony formation assays for TC cells
transfected with (D) Si-LEMD1 or (E) LEMD1 OE vector. (F) Cell
proliferation was measured using the Cell Counting Kit-8 assay in
TC cells transfected with Si-LEMD1 or LEMD1 OE vector. The data are
shown as the mean ± SD of three independent experiments.
Statistical significance was evaluated using one-way ANOVA followed
by Tukey's post-hoc test for comparisons among multiple groups or
Student's unpaired t-test for comparisons between two
groups. *P<0.05, **P<0.01, ***P<0.001 and ****P<0.0001
vs. HTORI-3, Si-NC or control. LEMD1, LEM domain containing 1; TC,
thyroid cancer; siRNA, small interfering RNA; RT-qPCR, reverse
transcription quantitative PCR; OE, overexpression; WB, western
blot; NC, negative control; OD, optical density. |
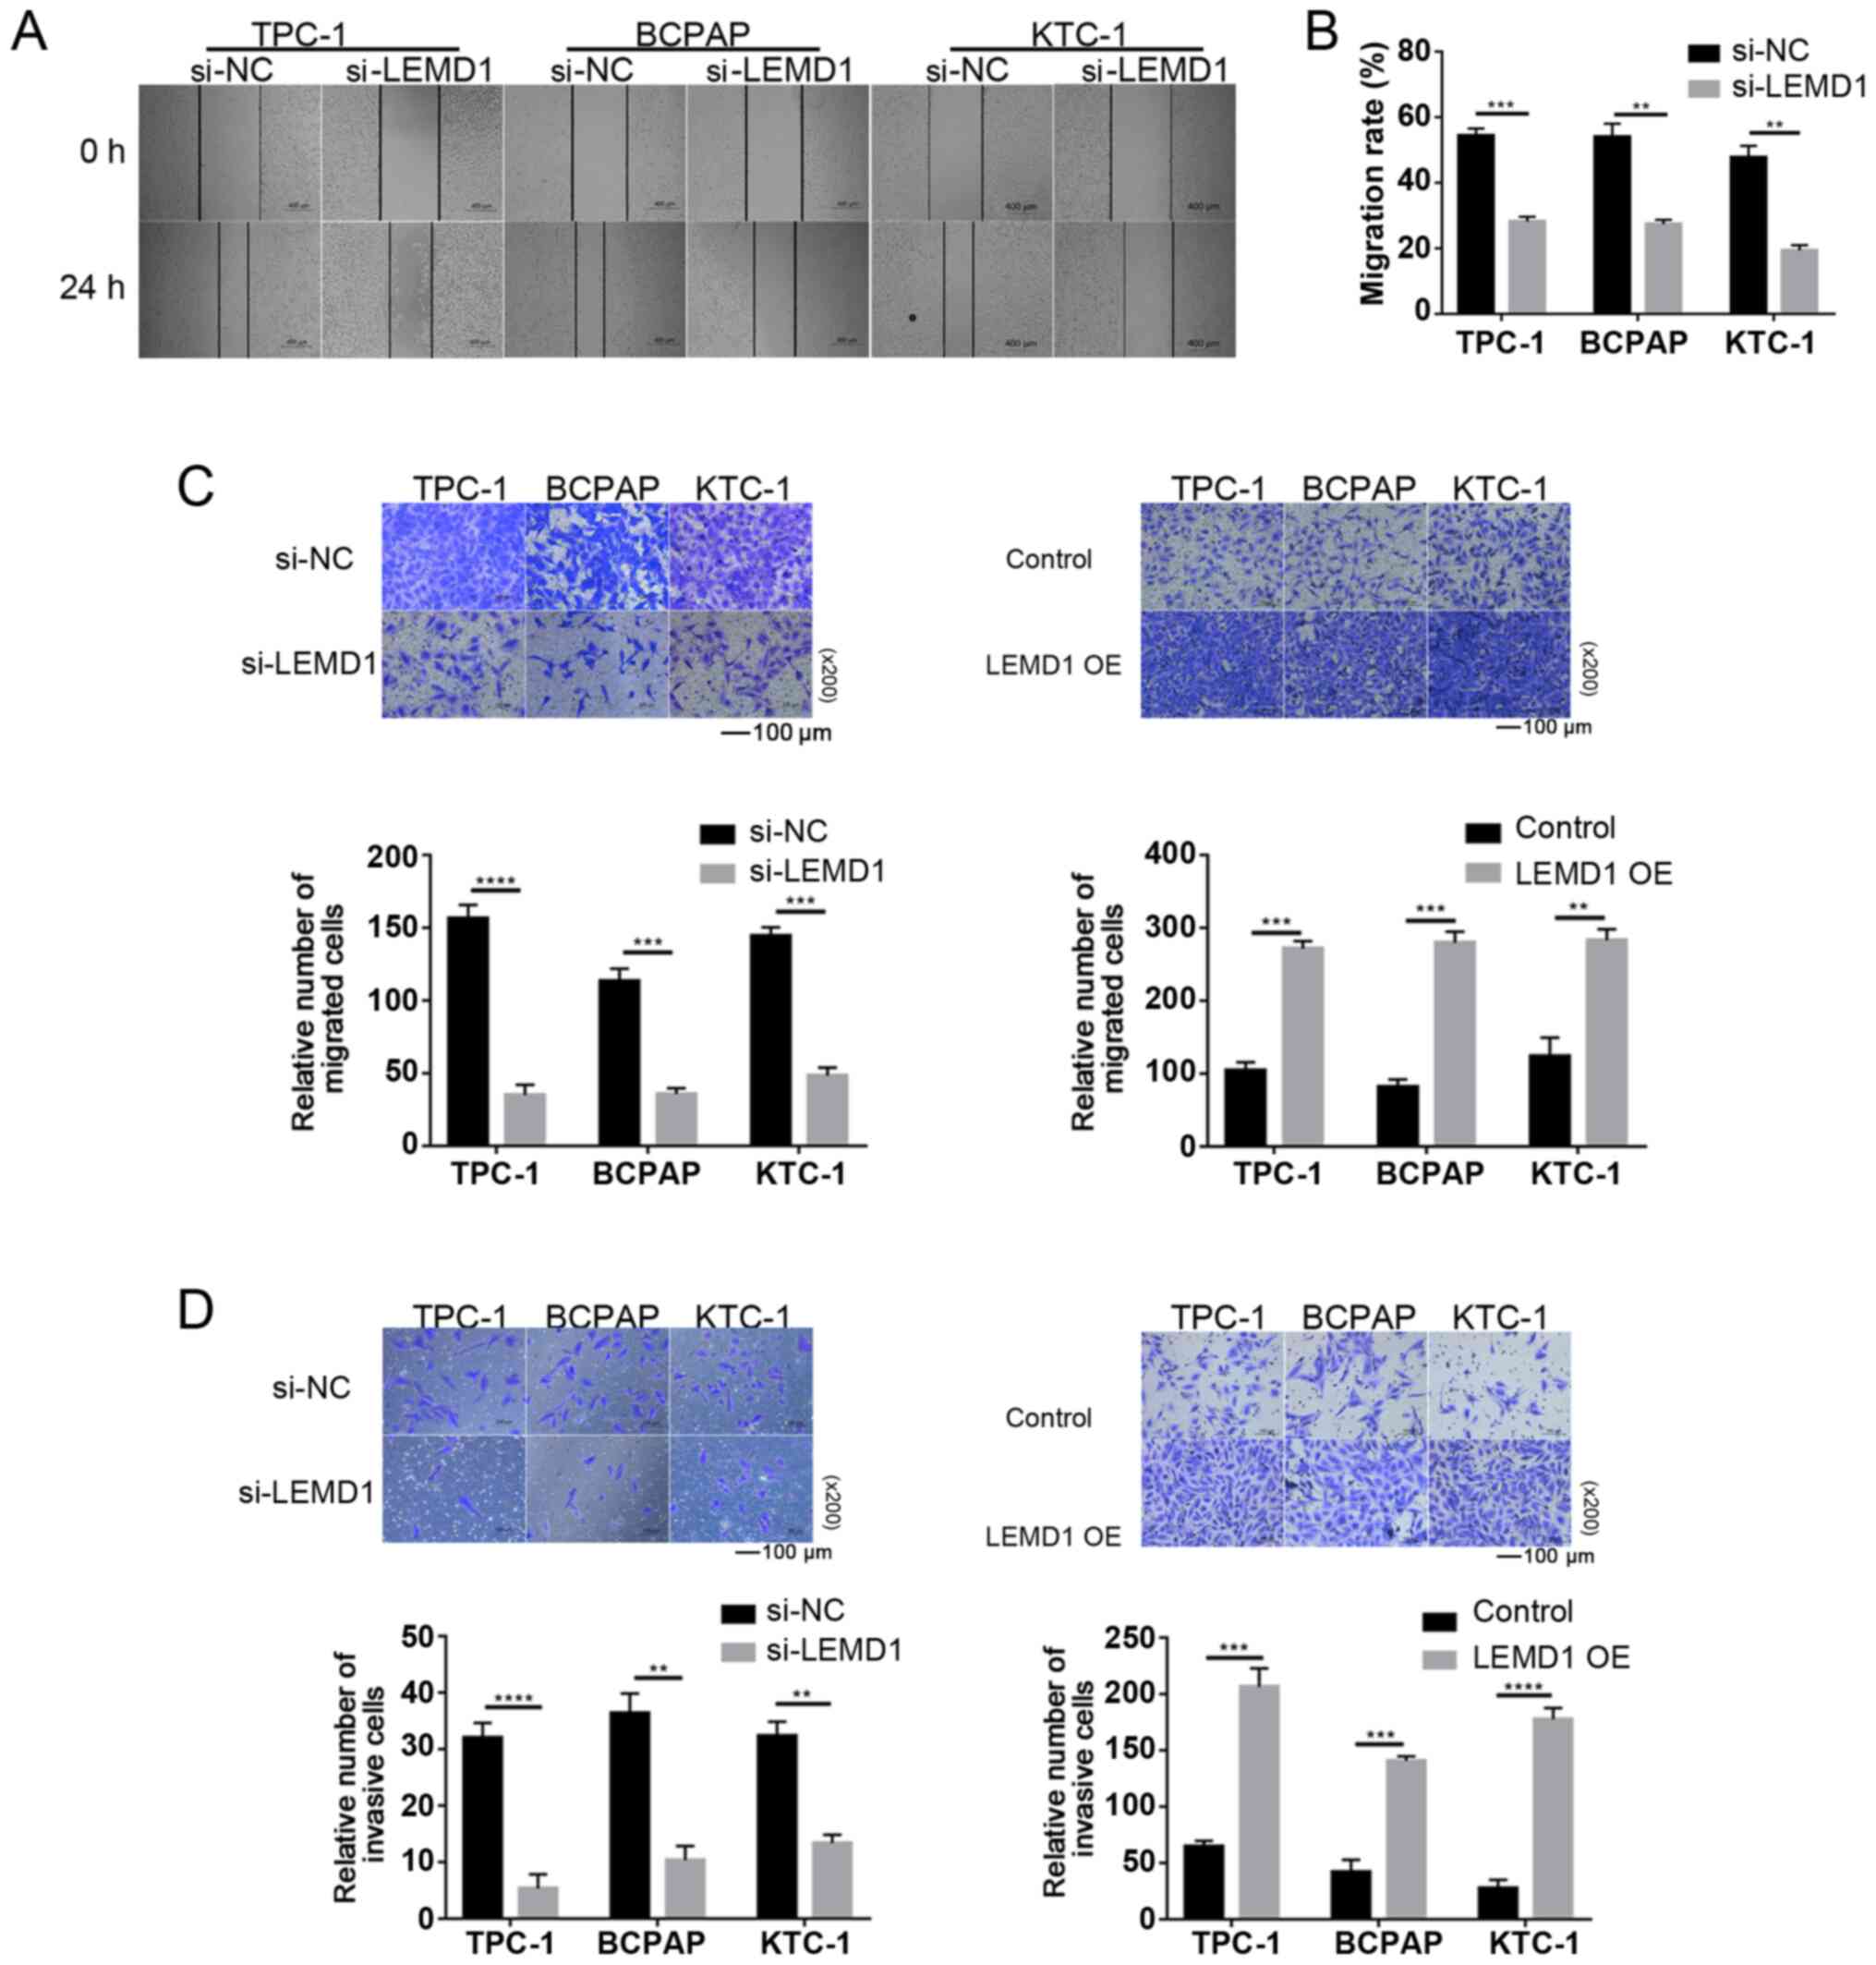
LEMD1 enhances the migratory and
invasive capacities of TC cells in vitro
Considering the significant association between LNM
and LEMD1 expression, the function of LEMD1 in the migratory and
invasive capacities of TC cell lines was assessed. As shown in
Fig. 3A-C, LEMD1-knockdown
significantly decreased the migratory ability of TC cells compared
with that of the control cells. The invasive ability was similarly
inhibited by LEMD1-knockdown in TC cell lines (Fig. 3D). With the overexpression of LEMD1,
the experiments exhibited the opposite results (Fig. 3C and D), with significantly increased
migratory and invasive capacities. The current results indicated
that LEMD1 may serve an important role in the migratory and
invasive capacities of TC cell lines.
LEMD1-knockdown induces apoptosis of
TC cells in vitro
The effect of LEMD1 on the apoptosis of TC cell
lines was analyzed via flow cytometry and WB analysis (caspase 3
and cleaved-caspase 3) to further explore the function of this
gene. LEMD1-knockdown led to a significant increase in the
apoptosis of TPC-1, BCPAP and KTC-1 cells (Fig. 4A, D and E). The results indicated
that the apoptosis suppressed by LEMD1 may be responsible for TC
progression.
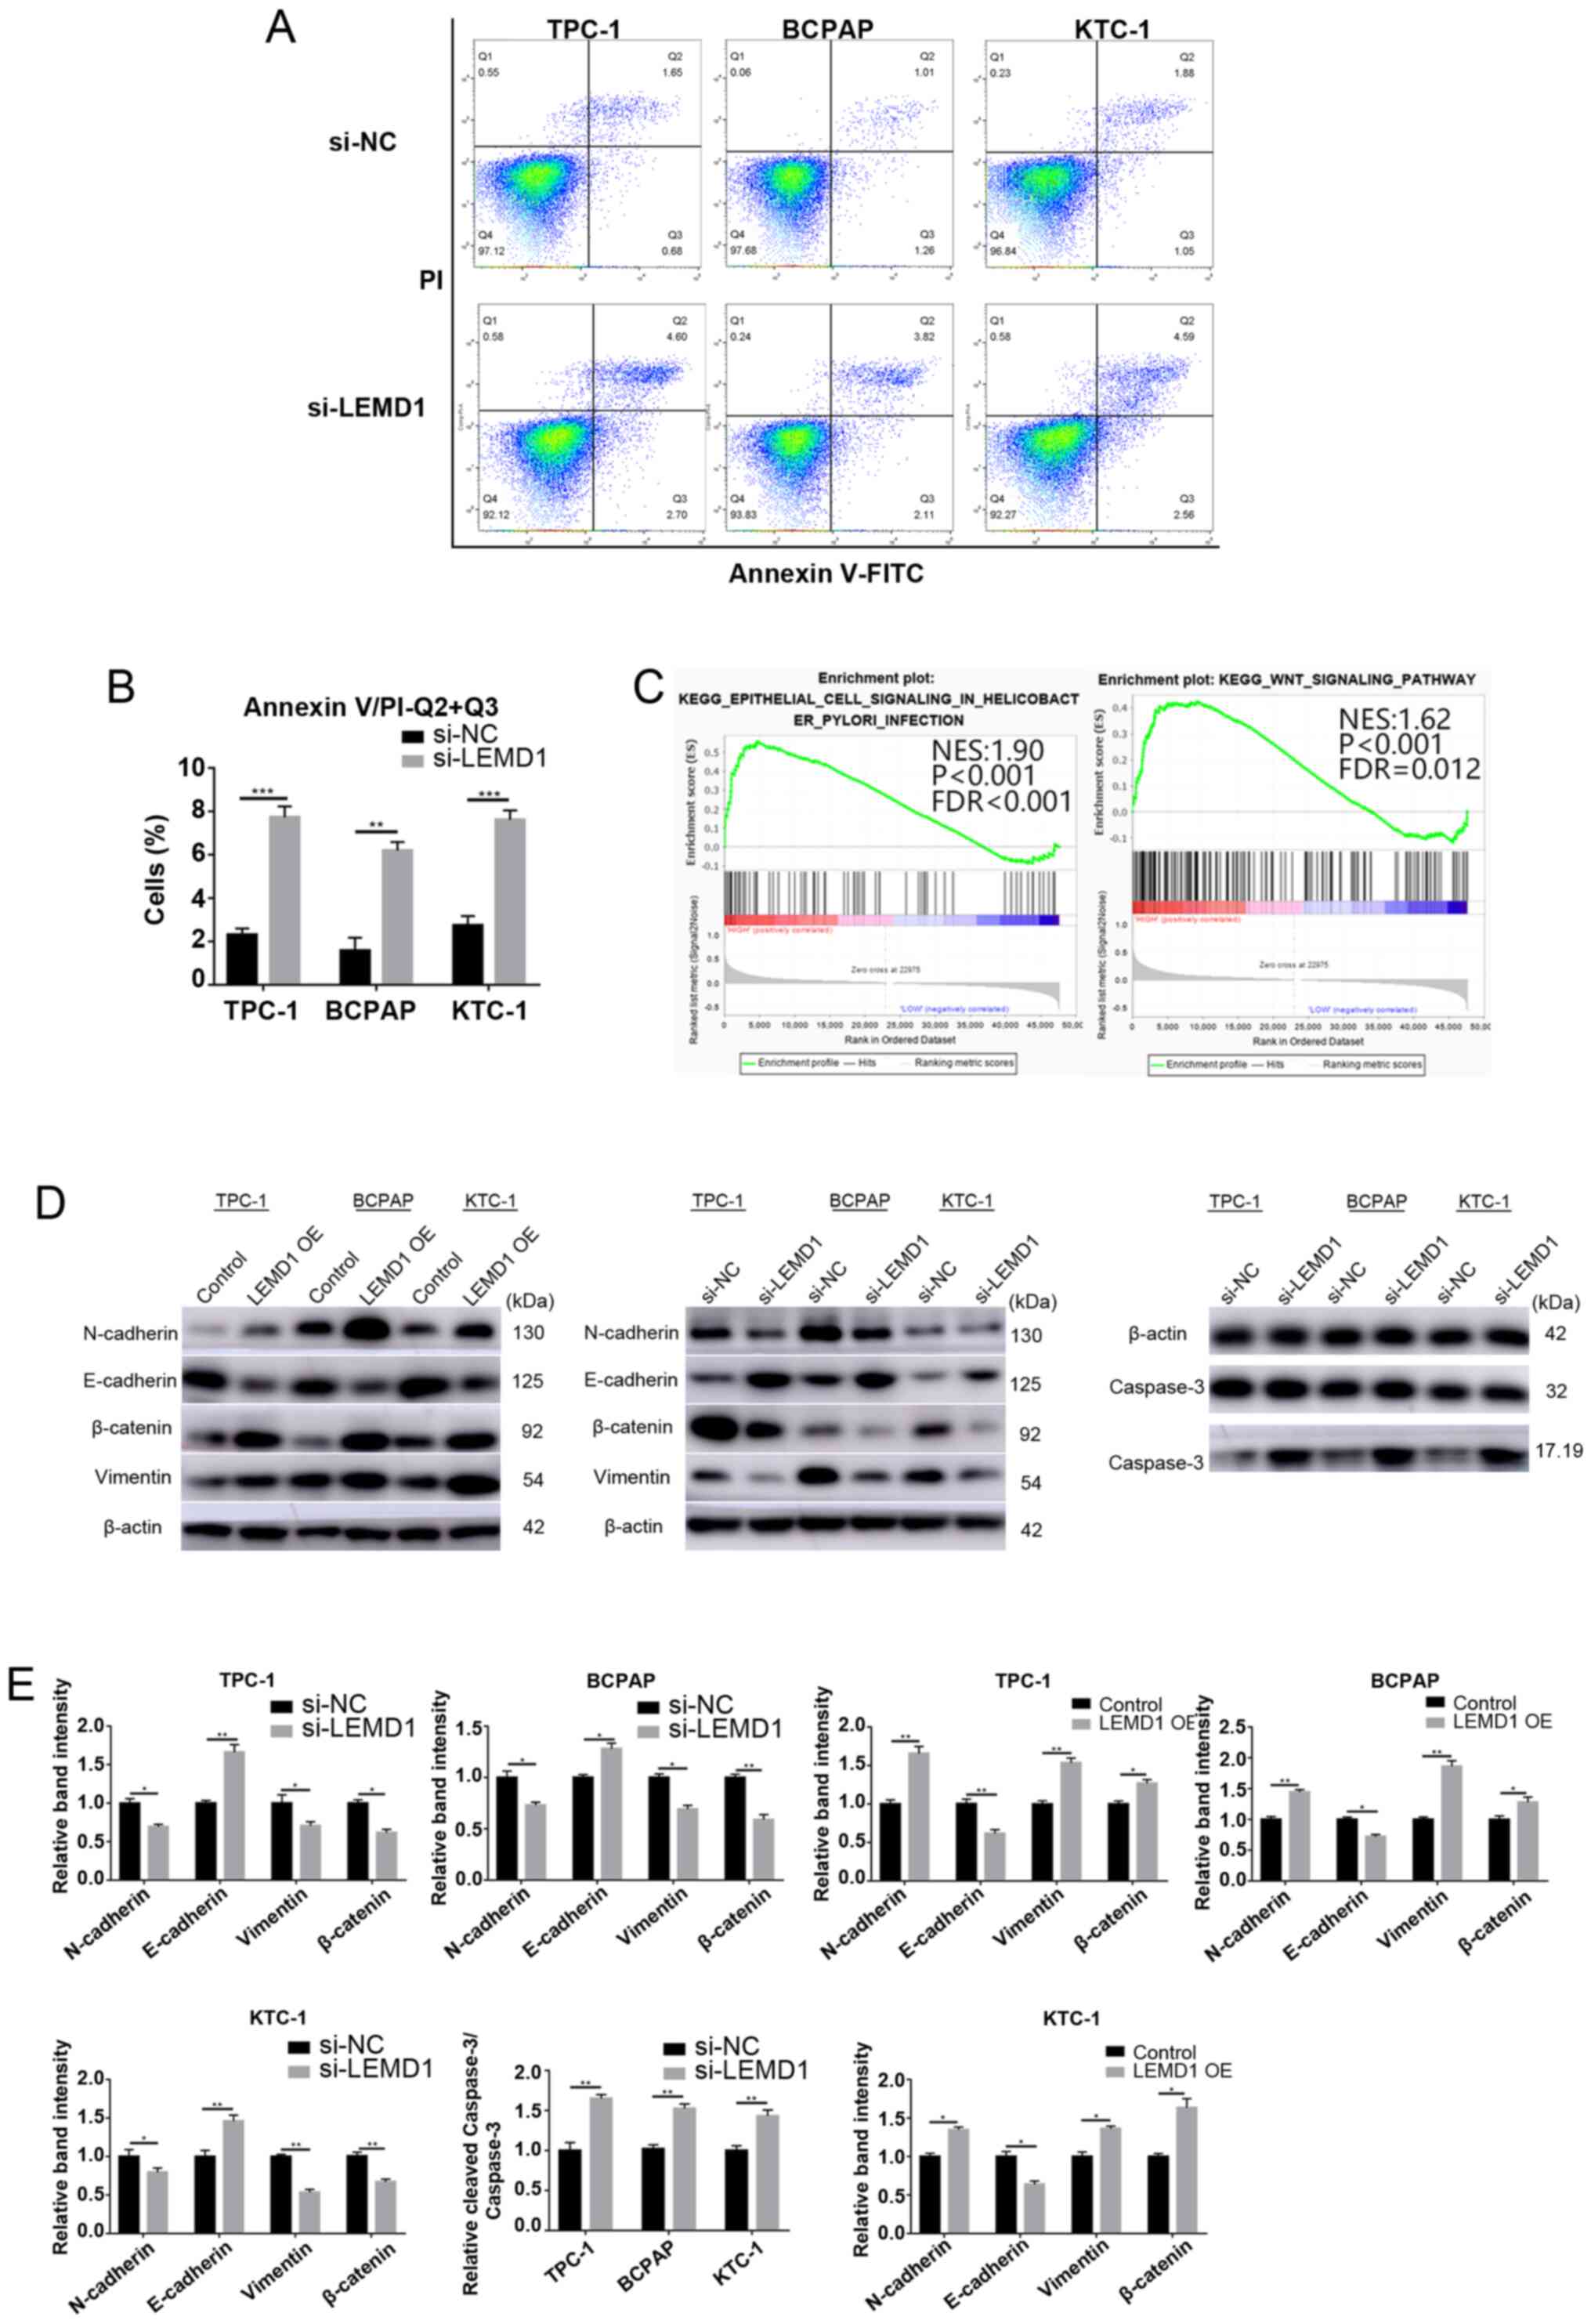 | Figure 4.LEMD1-knockdown induces apoptosis of
thyroid cancer cells in vitro, and LEMD1 regulates EMT and
the Wnt/β-catenin signaling pathway. (A) Flow cytometry analysis of
the apoptotic rates of the TPC-1, BCPAP and KTC-1 cells transfected
with Si-NC or Si-LEMD1. (B) Quantitative results of the apoptotic
cell percentages. Apoptosis included early (Q3) and late apoptosis
(Q2). Percentage of apoptosis=Q2 + Q3. (C) Gene set enrichment
analysis plots revealed that high LEMD1 expression was positively
associated with EMT and the Wnt/β-catenin signaling pathway. (D)
Protein expression levels of vimentin, N-cadherin, E-cadherin,
β-catenin, caspase 3 and cleaved-caspase 3 were evaluated using
western blotting, with β-actin serving as a loading control. (E)
Relative quantitative analysis of protein expression. All
experiments were repeated in triplicate at least three times. The
data are presented as the mean ± SD. Student's unpaired
t-test was used for statistical analyses. *P<0.05,
**P<0.01 and ***P<0.001 vs. Si-NC or control. LEMD1, LEM
domain containing 1; OE, overexpression; NC, negative control; EMT,
epithelial-mesenchymal transition; NES, normalized enrichment
score; FDR, false discovery rate. |
LEMD1 promotes TC progression by
regulating EMT in vitro
EMT is an indispensable process for cancer cell
metastasis (26). As shown in
Tables I and II, LEMD1 expression was significantly
associated with LNM. GSEA was performed on the basis of TCGA
dataset to explore the potential mechanism by which LEMD1 promoted
TC metastasis. The results revealed that the upregulation of LEMD1
expression was closely associated with EMT and the Wnt/β-catenin
signaling pathway (Fig. 4C). The
essential specific markers of EMT (E-cadherin, N-cadherin and
vimentin) were detected in TC cells with LEMD1-knockdown or
overexpression compared with the respective control cells using WB.
The cells with LEMD1-knockdown expressed significantly lower
expression levels of N-cadherin and vimentin, and significantly
higher expression levels of E-cadherin compared with the respective
negative control cells (Fig. 4D and
E). With the overexpression of LEMD1, the WB results exhibited
opposite results (Fig. 4D and E),
with significantly higher expression levels of N-cadherin and
vimentin, and significantly lower expression levels of E-cadherin.
These findings demonstrated that LEMD1 regulated EMT in TC cell
lines.
Effects of LEMD1 on activation of the
Wnt/β-catenin signaling pathway
The Wnt/β-catenin signaling pathway is one of the
classical pathways that drive EMT in malignant tumors (27). The GSEA results indicated that LEMD1
expression was associated with the Wnt/β-catenin signaling pathway.
Several pathway-specific markers that regulate EMT were assessed
using WB to further study the molecular mechanisms of LEMD1 in TC.
The results revealed that LEMD1-knockdown significantly decreased
β-catenin expression (Fig. 4D and
E). On the other hand, the overexpression of LEMD1
significantly upregulated β-catenin expression (Fig. 4D and E). Overall, the results
demonstrated that LEMD1 was able to activate the Wnt/β-catenin
signaling pathway and EMT in TC cell lines in vitro.
Discussion
The incidence of TC has increased rapidly in recent
years. A previous study has predicted that TC would replace
colorectal cancer as the fourth leading type of cancer by 2030
(28). Although almost all patients
with PTC have a favorable prognosis, LNM remains a pressing issue
for some patients (29). Thus,
understanding the molecular pathogenesis underlying PTC LNM and
distant metastasis is essential for the development of improved
diagnostic and therapeutic strategies to treat patients with PTC.
Increasing studies have revealed that LEMD1 serves a vital role in
the tumorigenesis and progression of several types of cancer
(20–22), but the function of LEMD1 in PTC is
poorly understood. The evolution of RNA-seq technologies provided
an effective method to further elucidate the underlying PTC
molecular mechanisms. RNA-seq was previously conducted on 79 paired
PTC and non-tumor thyroid tissues, and LEMD1 expression in PTC
tissues was significantly upregulated compared with that in normal
tissues. This phenomenon was also observed in TCGA dataset. RT-qPCR
and WB analysis revealed that LEMD1 was highly expressed in TC cell
lines and tissues. All these data indicated that LEMD1 may play a
critical role in TC tumorigenesis and progression.
EMT can result in the loss of cell adhesion and
promote the invasion and metastasis of cancer (30). Upregulation of mesenchymal markers
(N-cadherin and vimentin) and downregulation of epithelial markers
(E-cadherin) have been reported in different types of tumor during
EMT (27,31). According to a study by Sasahira et
al (32), LEMD1 downregulation
may promote the invasive and metastatic ability of oral squamous
cell carcinoma. The GSEA results of the present study revealed that
high LEMD1 expression was positively associated with the EMT
signaling pathway in PTC tissues (TCGA cohort). However, to the
best of our knowledge, the association between LEMD1 and EMT in TC
has not been studied.
LEMD1 acts as a cancer-promoting gene in several
types of tumor, such as gastric cancer, prostate cancer, oral
squamous cell carcinoma, anaplastic large-cell lymphoma and
colorectal cancer (33,34). Given that human leucocyte antigen is
not expressed in testis, LEMD1 (cancer/testis antigen) is an ideal
target for TC treatment (35).
However, although several studies have reported that LEMD1
expression is significantly associated with tumor cell invasive
ability and endothelial transmigration in multiple types of tumor,
the metastatic mechanisms of LEMD1 in TC have not been investigated
(20,22,32–34). In
the present study, siRNA was used to knock down LEMD1 expression in
TC cell lines. Gain of function assays were also performed using
overexpression vectors. The results revealed that LEMD1 promoted TC
cell proliferation in vitro. In addition, the migratory and
invasive capacities of TC cell lines were increased following LEMD1
overexpression in vitro. LEMD1-knockdown led to a
significant increase in the protein expression levels of E-cadherin
and cleaved-caspase 3, and a significant decrease in N-cadherin,
vimentin and β-catenin protein expression, while LEMD1
overexpression resulted in the opposite results. All these results
indicated that LEMD1 promoted TC cell migration and invasion by
regulating EMT and the Wnt/β-catenin signaling pathway.
However, there are some limitations in the present
study. The Wnt signaling pathway is complex and complicated.
According to previous studies, the protein expression levels of
WNT1 and WNT3A, the traditionally potent activators of
Wnt/β-catenin signaling, did not change after transfection with
siRNA or overexpression vector (36,37). The
proteins that activate β-catenin-dependent signaling require
further research. Furthermore, since fresh TC tissues from patients
were hard to obtain, immunohistochemical staining of the tissue
sections could not be performed. Additionally, a
co-immunoprecipitation experiment should be performed to evaluate
the association between LEMD1 and β-catenin. Furthermore, animal
experiments should be performed to verify the biological function
of LEMD1 in vivo. The molecular mechanisms of LEMD1
affecting the metastasis of TC require further research in future
studies.
In conclusion, the present study revealed that LEMD1
expression was positively associated with LNM in TCGA cohort and
the local validated cohort. LEMD1-knockdown inhibited TC cell
proliferation and migration, and induced apoptosis by suppressing
EMT and the Wnt/β-catenin signaling pathway. On the other hand,
with the overexpression of LEMD1, opposite results were obtained.
Therefore, the current results suggested that LEMD1 may be a
potential biomarker for the diagnosis and treatment of TC.
Supplementary Material
Supporting Data
Acknowledgements
The authors would like to thank Dr Wenchao Cai
(Emergency Department, The First Affiliated Hospital of Wenzhou
Medical University) for the instrument support.
Funding
The present study was financially supported by
grants from the Wenzhou Science and Technology Bureau (grant no.
Y20180460) and the Natural Science Foundation of Zhejiang Province
(grant no. LY17H160053).
Availability of data and materials
The datasets generated and/or analyzed during the
current study are not publicly available due to restrictions on
data sharing imposed by the funding body, but are available from
the corresponding author on reasonable request.
Authors' contributions
MX, BL and DZ wrote the manuscript and performed the
main experiments. JW and XWZ collected and analyzed the raw data.
WH and CL performed the experiments and revised the article. XHZ
and JQ designed the study. XHZ and JQ confirm the authenticity of
the raw data. All authors read and approved the final
manuscript.
Ethics approval and consent to
participate
The present study was approved by the Ethics
Committee of the First Affiliated Hospital of Wenzhou Medical
University (Wenzhou, China; approval no. 2012-57). Written informed
consent was obtained from all patients.
Patient consent for publication
Not applicable.
Competing interests
The authors declare that they have no competing
interests.
References
|
1
|
Lloyd RV, Osamura RY, Klöppel G and Rosai
J: WHO Classification of Tumours of Endocrine Organs. 4th Edition.
10. IARC Press; Lyon: 2017
|
|
2
|
Siegel RL, Miller KD and Jemal A: Cancer
statistics, 2019. CA Cancer J Clin. 69:7–34. 2019. View Article : Google Scholar : PubMed/NCBI
|
|
3
|
Qian B, He M, Dong S, Wang J and Chen K:
Incidence and mortality of thyroid cancers in Tianjin from 1981 to
2001. Chin J Endocrinol Metab. 21:432–434. 2005.
|
|
4
|
Sosa JA and Udelsman R: Papillary thyroid
cancer. Surg Oncol Clin N Am. 15:585–601. 2006. View Article : Google Scholar : PubMed/NCBI
|
|
5
|
Hinson AM, Massoll NA, Jolly LA, Stack BC
Jr, Bodenner DL and Franco AT: Structural alterations in
tumor-draining lymph nodes before papillary thyroid carcinoma
metastasis. Head Neck. 39:1639–1646. 2017. View Article : Google Scholar : PubMed/NCBI
|
|
6
|
Albores-Saavedra J, Henson DE, Glazer E
and Schwartz AM: Changing patterns in the incidence and survival of
thyroid cancer with follicular phenotype-papillary, follicular, and
anaplastic: A morphological and epidemiological study. Endocr
Pathol. 18:1–7. 2007. View Article : Google Scholar : PubMed/NCBI
|
|
7
|
LiVolsi VA: Papillary thyroid carcinoma:
An update. Mod Pathol. 24 (Suppl 2):S1–S9. 2011. View Article : Google Scholar
|
|
8
|
Hong IK, Eun YG, Chung DH, Kwon KH and Kim
DY: Association of the oncostatin m receptor gene polymorphisms
with papillary thyroid cancer in the korean population. Clin Exp
Otorhinolaryngol. 4:193–198. 2011. View Article : Google Scholar : PubMed/NCBI
|
|
9
|
Ho AS, Luu M, Barrios L, Chen I, Melany M,
Ali N, Patio C, Chen Y, Bose S, Fan X, et al: Incidence and
mortality risk spectrum across aggressive variants of papillary
thyroid carcinoma. JAMA Oncol. 6:706–713. 2020. View Article : Google Scholar : PubMed/NCBI
|
|
10
|
Choden S, Keelawat S, Jung CK and Bychkov
A: VE1 immunohistochemistry improves the limit of genotyping for
detecting BRAFV600E mutation in papillary thyroid
cancer. Cancers (Basel). 12:5962020. View Article : Google Scholar : PubMed/NCBI
|
|
11
|
Levine AJ, Momand J and Finlay CA: The p53
tumour suppressor gene. Nature. 351:453–456. 1991. View Article : Google Scholar : PubMed/NCBI
|
|
12
|
You JS and Jones PA: Cancer genetics and
epigenetics: Two sides of the same coin? Cancer Cell. 22:9–20.
2012. View Article : Google Scholar : PubMed/NCBI
|
|
13
|
Liz J and Esteller M: lncRNAs and
microRNAs with a role in cancer development. Biochim Biophys Acta.
1859:169–176. 2016. View Article : Google Scholar : PubMed/NCBI
|
|
14
|
Liu Z, Hou P, Ji M, Guan H, Studeman K,
Jensen K, Vasko V, El-Naggar AK and Xing M: Highly prevalent
genetic alterations in receptor tyrosine kinases and
phosphatidylinositol 3-kinase/akt and mitogen-activated protein
kinase pathways in anaplastic and follicular thyroid cancers. J
Clin Endocrinol Metab. 93:3106–3116. 2008. View Article : Google Scholar : PubMed/NCBI
|
|
15
|
Xing M: BRAF mutation in thyroid cancer.
Endocr Relat Cancer. 12:245–262. 2005. View Article : Google Scholar : PubMed/NCBI
|
|
16
|
Xie H, Wei B, Shen H, Gao Y, Wang L and
Liu H: BRAF mutation in papillary thyroid carcinoma (PTC) and its
association with clinicopathological features and systemic
inflammation response index (SIRI). Am J Transl Res. 10:2726–2736.
2018.PubMed/NCBI
|
|
17
|
Salvatore G, Giannini R, Faviana P, Caleo
A, Migliaccio I, Fagin JA, Nikiforov YE, Troncone G, Palombini L,
Basolo F and Santoro M: Analysis of BRAF point mutation and RET/PTC
rearrangement refines the fine-needle aspiration diagnosis of
papillary thyroid carcinoma. J Clin Endocrinol Metab. 89:5175–5180.
2004. View Article : Google Scholar : PubMed/NCBI
|
|
18
|
Lian EY, Maritan SM, Cockburn JG, Kasaian
K, Crupi MJ, Hurlbut D, Jones SJ, Wiseman SM and Mulligan LM:
Differential roles of RET isoforms in medullary and papillary
thyroid carcinomas. Endocr Relat Cancer. 24:53–69. 2017. View Article : Google Scholar : PubMed/NCBI
|
|
19
|
Chang Y, Wang X, Xu Y, Yang L, Qian Q, Ju
S, Chen Y, Chen S, Qin N, Ma Z, et al: Comprehensive
characterization of cancer-testis genes in testicular germ cell
tumor. Cancer Med. 8:3511–3519. 2019. View Article : Google Scholar : PubMed/NCBI
|
|
20
|
Li Q, Ge Y, Chen X, Wang L, Xia Y and Xu
Z, Li Z, Wang W, Yang L, Zhang D and Xu Z: LEM domain containing 1
promotes proliferation via activating the PI3K/Akt signaling
pathway in gastric cancer. J Cell Biochem. 120:15190–15201. 2019.
View Article : Google Scholar : PubMed/NCBI
|
|
21
|
Matsuyama H, Suzuki HI, Nishimori H,
Noguchi M, Yao T, Komatsu N, Mano H, Sugimoto K and Miyazono K:
miR-135b mediates NPM-ALK-driven oncogenicity and renders
IL-17-producing immunophenotype to anaplastic large cell lymphoma.
Blood. 118:6881–6892. 2011. View Article : Google Scholar : PubMed/NCBI
|
|
22
|
Takeda R, Hirohashi Y, Shen M, Wang L,
Ogawa T, Murai A, Yamamoto E, Kubo T, Nakatsugawa M, Kanaseki T, et
al: Identification and functional analysis of variants of a
cancer/testis antigen LEMD1 in colorectal cancer stem-like cells.
Biochem Biophys Res Commun. 485:651–657. 2017. View Article : Google Scholar : PubMed/NCBI
|
|
23
|
Wang K, Singh D, Zeng Z, Coleman SJ, Huang
Y, Savich GL, He X, Mieczkowski P, Grimm SA, Perou CM, et al:
MapSplice: Accurate mapping of RNA-seq reads for splice junction
discovery. Nucleic Acids Res. 38:e1782010. View Article : Google Scholar : PubMed/NCBI
|
|
24
|
van Staveren WC, Solis DW, Delys L, Duprez
L, Andry G, Franc B, Thomas G, Libert F, Dumont JE, Detours V and
Maenhaut C: Human thyroid tumor cell lines derived from different
tumor types present a common dedifferentiated phenotype. Cancer
Res. 67:8113–8120. 2007. View Article : Google Scholar : PubMed/NCBI
|
|
25
|
Livak KJ and Schmittgen TD: Analysis of
relative gene expression data using real-time quantitative PCR and
the 2(-Delta Delta C(T)) method. Methods. 25:402–408. 2001.
View Article : Google Scholar : PubMed/NCBI
|
|
26
|
Thiery JP, Acloque H, Huang RY and Nieto
MA: Epithelial-mesenchymal transitions in development and disease.
Cell. 139:871–890. 2009. View Article : Google Scholar : PubMed/NCBI
|
|
27
|
Georgakopoulos-Soares I, Chartoumpekis DV,
Kyriazopoulou V and Zaravinos A: EMT factors and metabolic pathways
in cancer. Front Oncol. 10:4992020. View Article : Google Scholar : PubMed/NCBI
|
|
28
|
Rahib L, Smith BD, Aizenberg R, Rosenzweig
AB, Fleshman JM and Matrisian LM: Projecting cancer incidence and
deaths to 2030: The unexpected burden of thyroid, liver, and
pancreas cancers in the United States. Cancer Res. 74:2913–2921.
2014. View Article : Google Scholar : PubMed/NCBI
|
|
29
|
Lundgren CI, Hall P, Dickman PW and
Zedenius J: Clinically significant prognostic factors for
differentiated thyroid carcinoma: A population-based, nested
case-control study. Cancer. 106:524–531. 2006. View Article : Google Scholar : PubMed/NCBI
|
|
30
|
Lamouille S, Xu J and Derynck R: Molecular
mechanisms of epithelial-mesenchymal transition. Nat Rev Mol Cell
Biol. 15:178–196. 2014. View Article : Google Scholar : PubMed/NCBI
|
|
31
|
Kang Y and Massague J:
Epithelial-mesenchymal transitions: Twist in development and
metastasis. Cell. 118:277–279. 2004. View Article : Google Scholar : PubMed/NCBI
|
|
32
|
Sasahira T, Kurihara M, Nakashima C,
Kirita T and Kuniyasu H: LEM domain containing 1 promotes oral
squamous cell carcinoma invasion and endothelial transmigration. Br
J Cancer. 115:52–58. 2016. View Article : Google Scholar : PubMed/NCBI
|
|
33
|
Yuki D, Lin YM, Fujii Y, Nakamura Y and
Furukawa Y: Isolation of LEM domain-containing 1, a novel
testis-specific gene expressed in colorectal cancers. Oncol Rep.
12:275–280. 2004.PubMed/NCBI
|
|
34
|
Ghafouri-Fard S, Ousati Ashtiani Z, Sabah
Golian B, Hasheminasab SM and Modarressi MH: Expression of two
testis-specific genes, SPATA19 and LEMD1, in prostate cancer. Arch
Med Res. 41:195–200. 2010. View Article : Google Scholar : PubMed/NCBI
|
|
35
|
Hirohashi Y, Torigoe T, Tsukahara T,
Kanaseki T, Kochin V and Sato N: Immune responses to human cancer
stem-like cells/cancer-initiating cells. Cancer Sci. 107:12–17.
2016. View Article : Google Scholar : PubMed/NCBI
|
|
36
|
MacDonald BT, Tamai K and He X:
Wnt/beta-catenin signaling: Components, mechanisms, and diseases.
Dev Cell. 17:9–26. 2009. View Article : Google Scholar : PubMed/NCBI
|
|
37
|
Najdi R, Proffitt K, Sprowl S, Kaur S, Yu
J, Covey TM, Virshup DM and Waterman ML: A uniform human Wnt
expression library reveals a shared secretory pathway and unique
signaling activities. Differentiation. 84:203–213. 2012. View Article : Google Scholar : PubMed/NCBI
|