Introduction
Hepatocellular carcinoma (HCC) is one of the most
common types of tumors, with a high degree of malignancy, high
metastatic potential and poor prognosis (1,2), and
poses serious threats on the health and quality of life of those
affected (1). According to the
Global Cancer Epidemiology Statistics 2012 (GLOBOCAN 2012), the
number of new cases of HCC is ~782,500 (~554,400 men and ~228,100
women) per year worldwide, ranking sixth amongst all types of
cancer (2). HCC is a heterogeneous
malignancy that results from complex genetic and epigenetic
alterations (3). Despite
advancements in the diagnosis and treatment, the clinical outcomes
for patients with HCC remain unsatisfactory due to the untimely
diagnosis, high risk of relapse and likelihood of invasion and
metastasis (4,5). Metastases are usually difficult to
treat with current therapeutic approaches and are the major cause
of mortality in patients with cancer. An essential process in cell
metastasis and invasion is the production of membrane protrusions
in the direction of movement. During the metastasis of cancer
cells, the cell surface structure and adhesive ability are
effectively altered, the cell-cell contacts loosen within the
vicinity and cells subsequently lose their polarity, which
accelerates the formation of protrusions (5–9) Thus, it
is important to identify the specific molecular mechanisms of HCC
for assistance in early diagnosis, clinical decision making and
patient treatment.
MicroRNAs (miRNAs/miRs) are a type of small,
non-coding RNA (~22 nucleotides in length), which participate in
RNA silencing and post-transcriptional regulation of gene
expression (10). Previous studies
have demonstrated that miRNAs are involved in several cellular
processes, including cell cycle regulation, proliferation,
apoptosis and differentiation by directly targeting mRNAs, by
binding to specific sites in the 3′-untranslated regions, resulting
in translational repression, cleavage or destabilization (10,11). In
addition, several studies have indicated the association between
miRNAs and progression of HCC. For example, miR-1, miR-21 and
miR-122 have been reported to be associated with the proliferation
and apoptosis of HCC cells (12–16). For
example, miR-345 inhibits Smad1 expression and suppresses the
growth and metastasis of prostate cancer. Furthermore, Yamashita
et al (9) reported the
potential diagnostic, prognostic and therapeutic values of miRNA
expression profiles in HCC.
Circular RNAs (circRNAs) are a type of non-coding
RNA molecule that are covalently combined to form a ring structure
with their 3′ and 5′ ends joined together. Functionally, circRNAs
act as a miRNA sponge and inhibit several miRNAs through adsorption
(17). In addition, circRNAs have
the potential toinfluence RNA polymerase elongation, regulating
gene transcription and interacting with RNA binding proteins to
modulate the process of translation (18–24).
Previous studies have demonstrated that circRNAs are closely
associated with human diseases, particularly cancer, and thus may
serve as potential biomarkers (25,26).
Hsa_circ_0000069 and hsa_circRNA_001569 are involved in the
development of colorectal cancer (25). Similarly, downregulation of
circ_002059 is associated with distant metastasis of gastric cancer
(26) and serves a vital role in the
diagnosis of gastric cancer. Zhong et al (27) reported that overexpression of
circTCF25 can downregulate miR-103a-3p and miR-107 expression,
increase CDK6 expression and promote bladder cancer cell
proliferation and migration both in vitro and in
vivo. In addition, Han et al (28) demonstrated that circMTO1 knockdown in
HCC can downregulate p21 expression, the target of the oncogene
miR-9, resulting in the promotion of HCC cell proliferation and
invasion.
In the present study, a detailed comparison of small
nuclear RNA expression profiles between the HCCLM3 cell bodies
(CBs) and cell protrusions (CPs) was performed using RNA sequencing
(RNA-Seq) to identify the circRNA/miRNA interaction network
involved in metastasis. In addition, whether the identified miRNAs
and circRNAs serve as potential therapeutic targets for HCC was
investigated by comprehensively profiling the expression patterns
of the miRNAs and circRNAs.
Materials and methods
Cell culture
HCC HCCLM3 cells were preserved at the Key
Laboratory of Laboratory Medicine, Ministry of Education, (Wenzhou,
China). Cells were maintained in complete DMEM supplemented with
10% fetal bovine serum and 1% double resistance (all purchased from
Gibco; Thermo Fisher Scientific, Inc.) at 37°C with 5% CO2
incubator. All experiments were performed on cells in the
logarithmic growth phase.
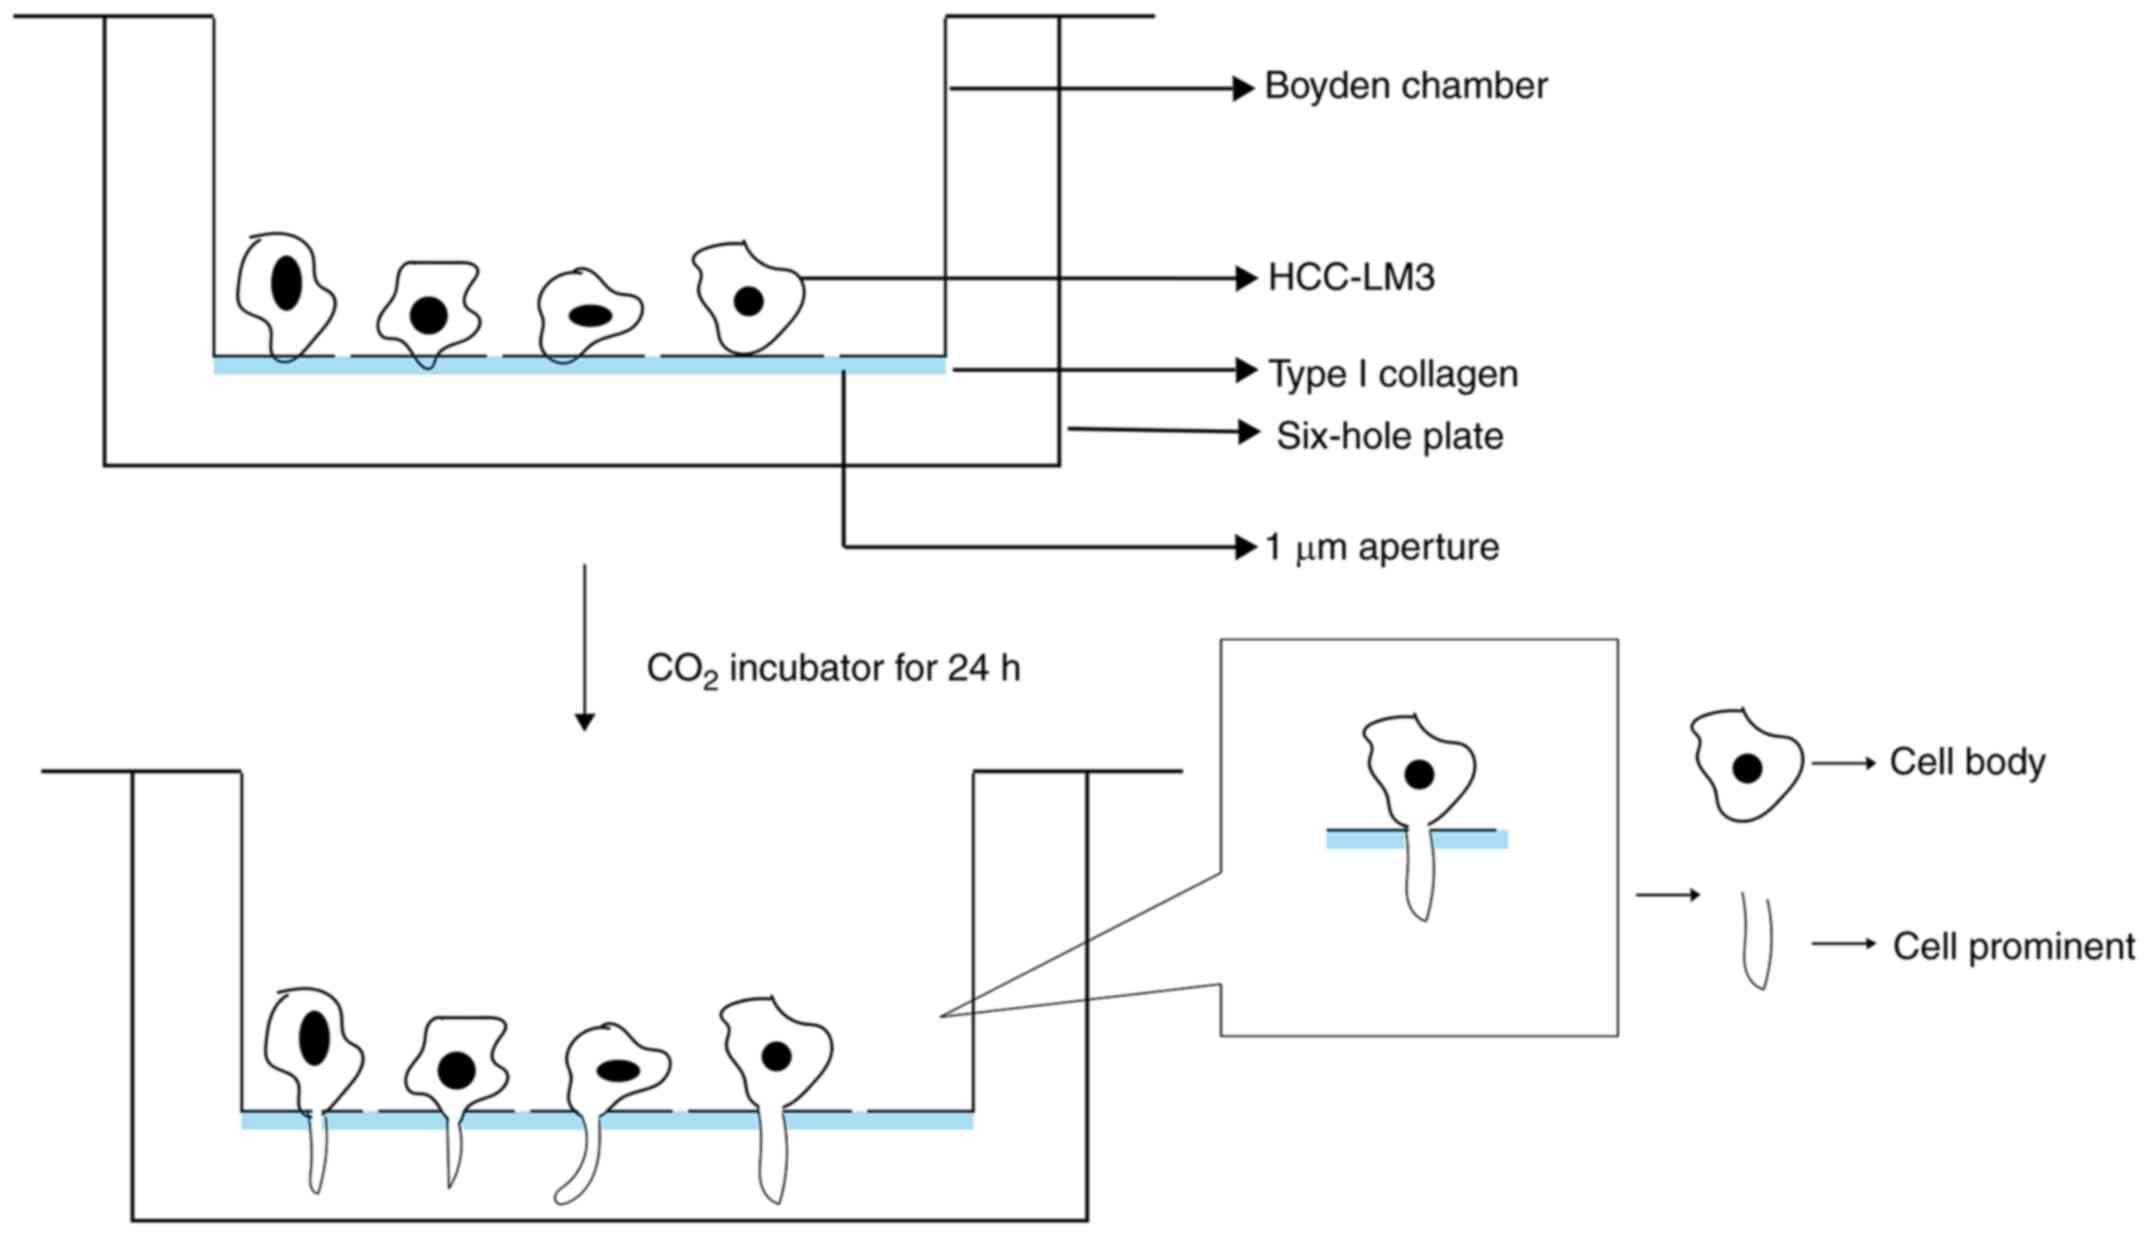
Isolation of CBs and CPs
HCCLM3 cells were incubated at 37°C with type I
collagen (Sigma-Aldrich; Merck KGaA) using Boyden chambers
(Corning, Inc.). Cells were starved overnight and subsequently
inoculated in the Boyden chambers. Cells were further cultured in
serum-free DMEM (Gibco; Thermo Fisher Scientific, Inc.) for 24–30 h
at 37°C. The CBs and CPs were separated by scraping in
TRIzol® reagent (Invitrogen; Thermo Fisher Scientific,
Inc.) (Fig. 1).
Western blotting
Total protein was extracted from HCCLM3 cells
(American Type Culture Collection) using RIPA buffer containing 50
mmol/l Tris-HCl (pH 7.4), 150 mmol/l NaCl, 1 mmol/l PMSF, 1 mmol/l
EDTA, 1% Triton X-100, 1% sodium deoxycholate, 0.1% SDS and
protease inhibitor cocktail (Sigma-Aldrich; Merck KGaA). Total
protein was quantified via the BCA assay and 15 µg protein/lane was
separated by SDS-PAGE on a 10% gel. The separated proteins were
subsequently transferred onto PVDF membranes and blocked with 5%
skimmed milk powder in TBST (0.1% Tween) for 1.5 h at room
temperature. The membranes were incubated with primary antibodies
overnight at 4°C. Following the primary incubation, membranes were
incubated with an HRP-conjugated secondary antibody at room
temperature for 1 h. The following primary antibodies were:
Anti-Histone H3 (1:10,000; Rabbit; Abcam; cat. no. ab1791; 19 kDa),
anti-α-Tubulin (1:5,000; Rabbit; Rockland MMS-489R-200; 51 kDa),
anti-β-Actin (1:2,500; Rabbit; Sigma-Aldrich; Merck KGaA; cat. no.
A2103; 42 kDa). The following secondary antibodies were used:
HRP-labeled goat anti-rabbit IgG (H+L) 1:1,000 (Beyotime Institute
of Biotechnology) and HRP-labeled goat anti-mouse IgG (H+L) 1:1,000
(Beyotime Institute of Biotechnology). Protein bands were
visualized using ECL (Beyotime Institute of Biotechnology).
RNA extraction
The CBs and CPs of cells were scraped using
TRIzol® reagent. Chloroform and isopropyl alcohol
(Jinshan Chemical Reagent Co., Ltd.) were added to the extracts,
and the mixture was incubated for 20 min at −20°C. The samples were
subsequently centrifuged at 12,000 × g for 10 min at 4°C. Following
centrifugation, the supernatant was discarded, RNA was precipitated
with 75% ethanol and dissolved in 20 µl DEPC water. RNA quality was
measured using NanoDrop 2000 (Thermo Fisher Scientific, Inc.) and
samples were stored at −80°C until subsequent experimentation.
Immunofluorescence
Cells were cultured on glass slides (Corning, Inc.)
until they reached ~40% confluence and subsequently fixed with 4%
polyformaldehyde at room temperature for 30 min. Following
cleaning, 0.5% Triton X-100 (Beyotime Institute of Biotechnology)
was used to permeabilize the cells for 15 min, and cells were
subsequently blocked with 0.5% BSA (Beyotime Institute of
Biotechnology) for 2 h at room temperature. Cells were incubated
with primary antibodies (cat. no. AF, 1:5692; Beyotime Institute of
Biotechnology,1:50 dilution of 5% BSA) overnight at 4°C, followed
by incubation with the secondary antibody (cat. no. A0208; Beyotime
Institute of Biotechnology, 1:3,000 dilution of 0.1% TBST) for 1 h
at room temperature. Cells were subsequently counterstained with
DAPI for 5 min at room temperature. Coverslips were mounted and
sealed with immersive oil (Nicon) and observed under a confocal
microscope (Nikon Corporation; ×600). Samples were stored at 4°C in
the dark.
RNA dyeing
Cells that had reached ~40% confluence were fixed
with 4% triformol at room temperature for 15 min. (Beyotime
Institute of Biotechnology). RNase (Beyotime Institute of
Biotechnology) was diluted using PBS (Gibco; Thermo Fisher
Scientific, Inc.) and added to the experimental group, while an
equivalent quantity of PBS was added to the control group for 30
min. Cells were washed with PBS for 10 min at room temperature, and
the nuclei were stained with DAPI for 15 min at room temperature.
Coverslips were mounted and sealed with immersive oil and observed
under a confocal microscope (Nikon Corporation; magnification,
×600). Samples were stored overnight at 4°C in the dark.
RNA purity and quality testing
When separating CBs and CPs, the Boyden dishes were
initially washed with 1X PBS solution and the cells were removed
using cell spatulas in TRIzol® and transferred to an EP
tube. The extracted RNA was analyzed using an Agilent 2100 (Agilent
Technologies) to measure concentration and quality, and the library
was sequenced.
RNA-Seq
PCR amplification was performed to prepare the
library using Illumina HiSeq™ 2000 sequencing following quality
control, according to the manufacturer's protocol.
Reverse transcription-quantitative
(RT-qPCR)
Small RNAs were extracted from HCCLM3 cells using
TRIzol® reagent (Takara Biotechnology), according to the
manufacturer's protocol. For RT, 1 µg of small RNA was reverse
transcribed using the Transcript Green miRNA Two-step RT-qPCR
SuperMix kit (Beijing Transgen Biotech Co., Ltd.), according to the
manufacturer's protocol, at 37°C for 60 min, with a final
incubation at 85°C for 5 sec. miRNA qPCR was performed using the
Transcript Green miRNA Two-step RT-qPCR SuperMix kit on an Applied
Biosystems 7000 real-time PCR machine (Applied Biosystems; Thermo
Fisher Scientific, Inc.). The following thermocycling conditions
were used for qPCR: 94°C for 30 sec, followed by 40 cycles of 94°C
for 5 sec, 55°C for 15 sec and 72°C for 10 sec. The primer
sequences used for qPCR are listed in Table I. Relative expression levels were
calculated using the 2−ΔΔCq method (29) and normalized to the internal
reference gene β-actin.
 | Table I.Primer sequences used for
quantitative PCR. |
Table I.
Primer sequences used for
quantitative PCR.
| ID | Forward primer
(5–3) | Reverse primer
(5–3) |
|---|
| hsa-miR-7-1-3p |
CGGGCCAACAAATCACAGTC |
CAGCCACAAAAGAGCACAAT |
|
hsa-miR-374b-3p |
CGCCGCTTAGCAGGTTGTAT |
CAGCCACAAAAGAGCACAAT |
| hsa-miR-340-5p |
GCGGCTTATAAAGCAATGAG |
CAGCCACAAAAGAGCACAAT |
| hsa-miR-17-5p |
CGGGCCAAAGTGCTTACAGTG |
CAGCCACAAAAGAGCACAAT |
|
hsa-miR-3074-3p |
CGCCGGATATCAGCTCAGTA |
CAGCCACAAAAGAGCACAAT |
| hsa-miR-186-5p |
GCGGCCAAAGAATTCTCCTT |
CAGCCACAAAAGAGCACAAT |
| hsa-miR-21-3p |
CGGGCCAACACCAGTCGAT- |
CAGCCACAAAAGAGCACAAT |
|
hsa-miR-146b-3p |
CGCCGTGCCCTGTGGACTCA |
CAGCCACAAAAGAGCACAAT |
| hsa-let-7f-5p |
GCGGCTGAGGTAGTAGATTG |
CAGCCACAAAAGAGCACAAT |
|
hsa-miR-26a-2-3p |
CGCCGCCTATTCTTGATTAC |
CAGCCACAAAAGAGCACAAT |
| hsa-miR-423-5p |
GCGGTGAGGGGCAGAGAGCG |
CAGCCACAAAAGAGCACAAT |
| hsa-miR-7-5p |
CGGGCTGGAAGACTAGTGATT |
CAGCCACAAAAGAGCACAAT |
| hsa-miR-423-3p |
CGCCGAGCTCGGTCTGAGGCC |
CAGCCACAAAAGAGCACAAT |
| hsa-miR-191-5p |
GCGGCCAACGGAATCCCAAAA |
CAGCCACAAAAGAGCACAAT |
| hsa-miR-744-5p |
CGGGCTGCGGGGCTAGGGCT |
CAGCCACAAAAGAGCACAAT |
|
hsa-miR-193a-3p |
CGCCGAACTGGCCTACAAAG |
CAGCCACAAAAGAGCACAAT |
| hsa-miR-24-3p |
GCGGCTGGCTCAGTTCAGCA |
CAGCCACAAAAGAGCACAAT |
|
hsa-miR-3529-3p |
CGGGAACAACAAAATCACTAG |
CAGCCACAAAAGAGCACAAT |
| hsa-miR-574-5p |
CGCCGTGAGTGTGTGTGTGTG |
CAGCCACAAAAGAGCACAAT |
| hsa-miR-20a-5p |
CGCCGTAAAGTGCTTATAGTG |
CAGCCACAAAAGAGCACAAT |
| hsa-let-7d-3p |
CGGGCCTATACGACCTGCTG |
CAGCCACAAAAGAGCACAAT |
|
hsa-let-7f-2-3p |
CGCCGCTATACAGTCTACTG |
CAGCCACAAAAGAGCACAAT |
|
hsa_circ_0002029 |
CCTCCCATGAAAGTGTTAATG |
CAGTAGCTCCACTGCCTTTTG |
|
hsa_circ_0002100 |
GTTTGCAGAGTCCAGAATTTG |
ACCAGTATATCATCCTGCTT- |
|
hsa_circ_0003656 |
GATTACAGGCTGGAGCCACA |
CTTGGTTGTTCACTCCCTGAG |
|
hsa_circ_0003789 |
CTTGCCAGTGAACTGGAAATC |
CAAACACCTCTTTGGAATGTCC |
|
hsa_circ_0007429 |
TGGGAACATGCACAGTGTCA |
CTGACCCACTGATAGACTATG |
|
hsa_circ_0008797 |
CTGCTGGAGTATACACCAACT |
CTGCTGGAGTATACACCAACT |
|
hsa_circ_0059580 |
CTGAACTATGTCATGGGATTCA |
CATTGCATTCTTTTGCTGAC |
|
hsa_circ_0067475 |
GGCTCTCCTTCCAAACCATG |
CTGAAGTAGTAACTCCAACCT |
|
hsa_circ_0087200 |
CTGAACGTATTCCATGAACGA |
CTTCACTCTAGAATACTGTAC |
| β-actin |
CATGTACGTTGCTATCCAGGC |
CTCCTTAATGTCACGCACGAT |
GO significance enrichment
analysis
Based on the differentially expressed genes, cluster
analysis, GO enrichment analysis of functional significance applied
a Fisher's Exact Test for mapping all DEGs to terms in the GO
database (http://www.geneontology.org).
Statistical analysis
Statistical analysis was performed using SPSS 13.0
software (SPSS, Inc.). All experiments were performed in triplicate
and data are presented as the mean ± standard deviation. Two-tailed
Student's t-test was used to compare differences between two
groups. P<0.05 was considered to indicate a statistically
significant difference.
Results
Validation of successful isolation of
mRNA from the CBs and CPs of HCCLM3 cells
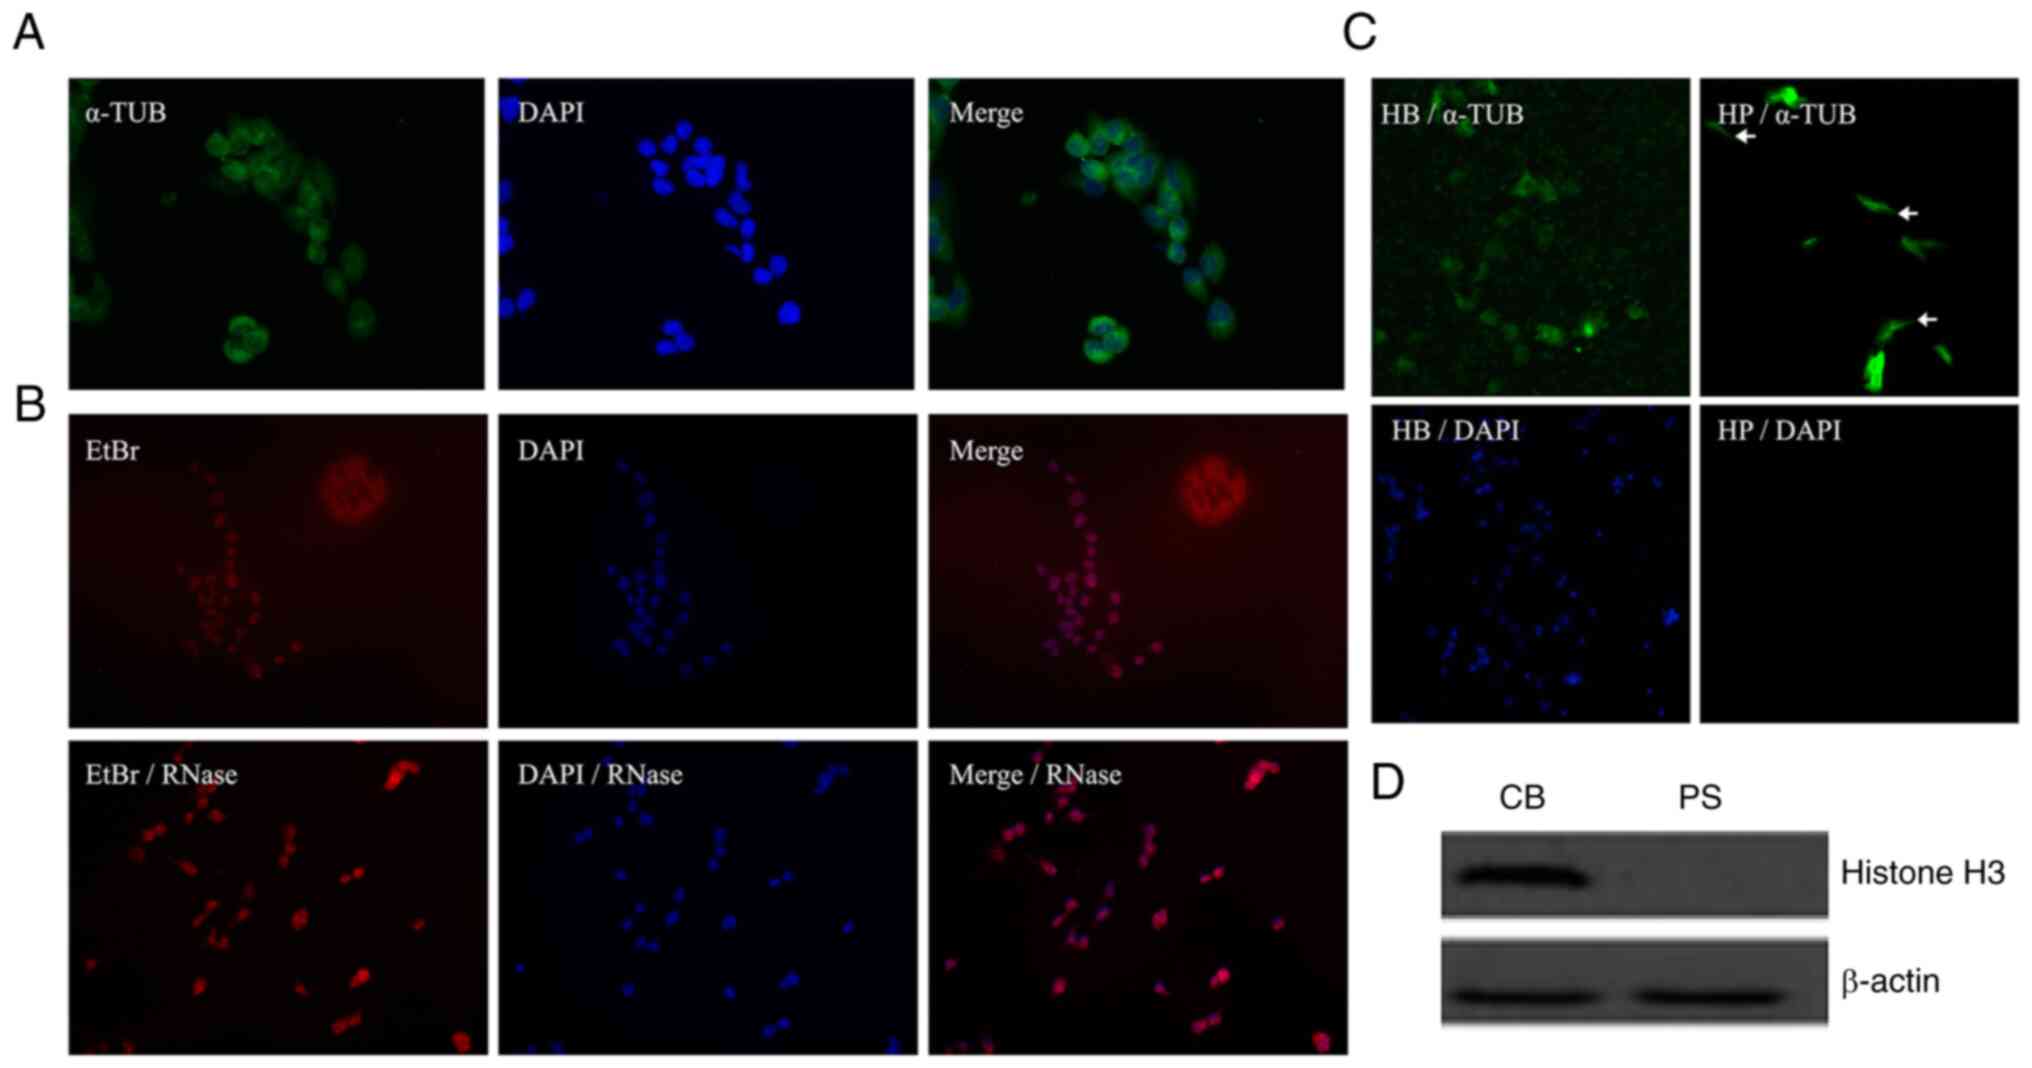
Cancer cells form protrusions prior to invasion and
metastasis, and the RNAs located in the cell projections are often
associated with metastatic invasion (15). To study the RNAs located in the
protrusions of liver cancer cells, HCCLM3 cells were selected for
immunofluorescence experiments, including the cytoplasmic fraction
using α-tubulin staining and nuclear staining with DAPI (Fig. 2A). In addition, a comparative
experiment was performed using RNase for EtBr staining of HCCLM3
cells (Fig. 2B). Cytoplasmic
α-tubulin immunofluorescence staining and nuclear DAPI staining
were performed to verify that the protrusions had migrated through
the pores of the PET membrane into the cell culture chamber below
the Boyden cell culture dish and not the entire cell. As presented
in Figs. 1 and 2C, both the pseudopod and cell body
fractions were stained for α-tubulin (green) but only the cell body
fraction was stained for nuclei (blue). The upper CBs were removed
using cotton swabs, α-tubulin staining was still observed on this
side. However, under the same culture conditions, the cell body of
the culture dish was erased, and no nuclear DAPI staining was
observed on the lower side of the PET film, as shown in the CB/DAPI
and CP/DAPI. Western blotting was performed to evaluate the
effectiveness of the separation. Histone H3 immunoblotting was
performed on the isolated CPs and CBs, and histone H3 was only
observed in the cell body portion on the upper side of the Boyden
cell culture dish (Fig. 2D),
confirming that no migration of the entire cell body occurred from
the top to the bottom of the petri dish during this experiment.
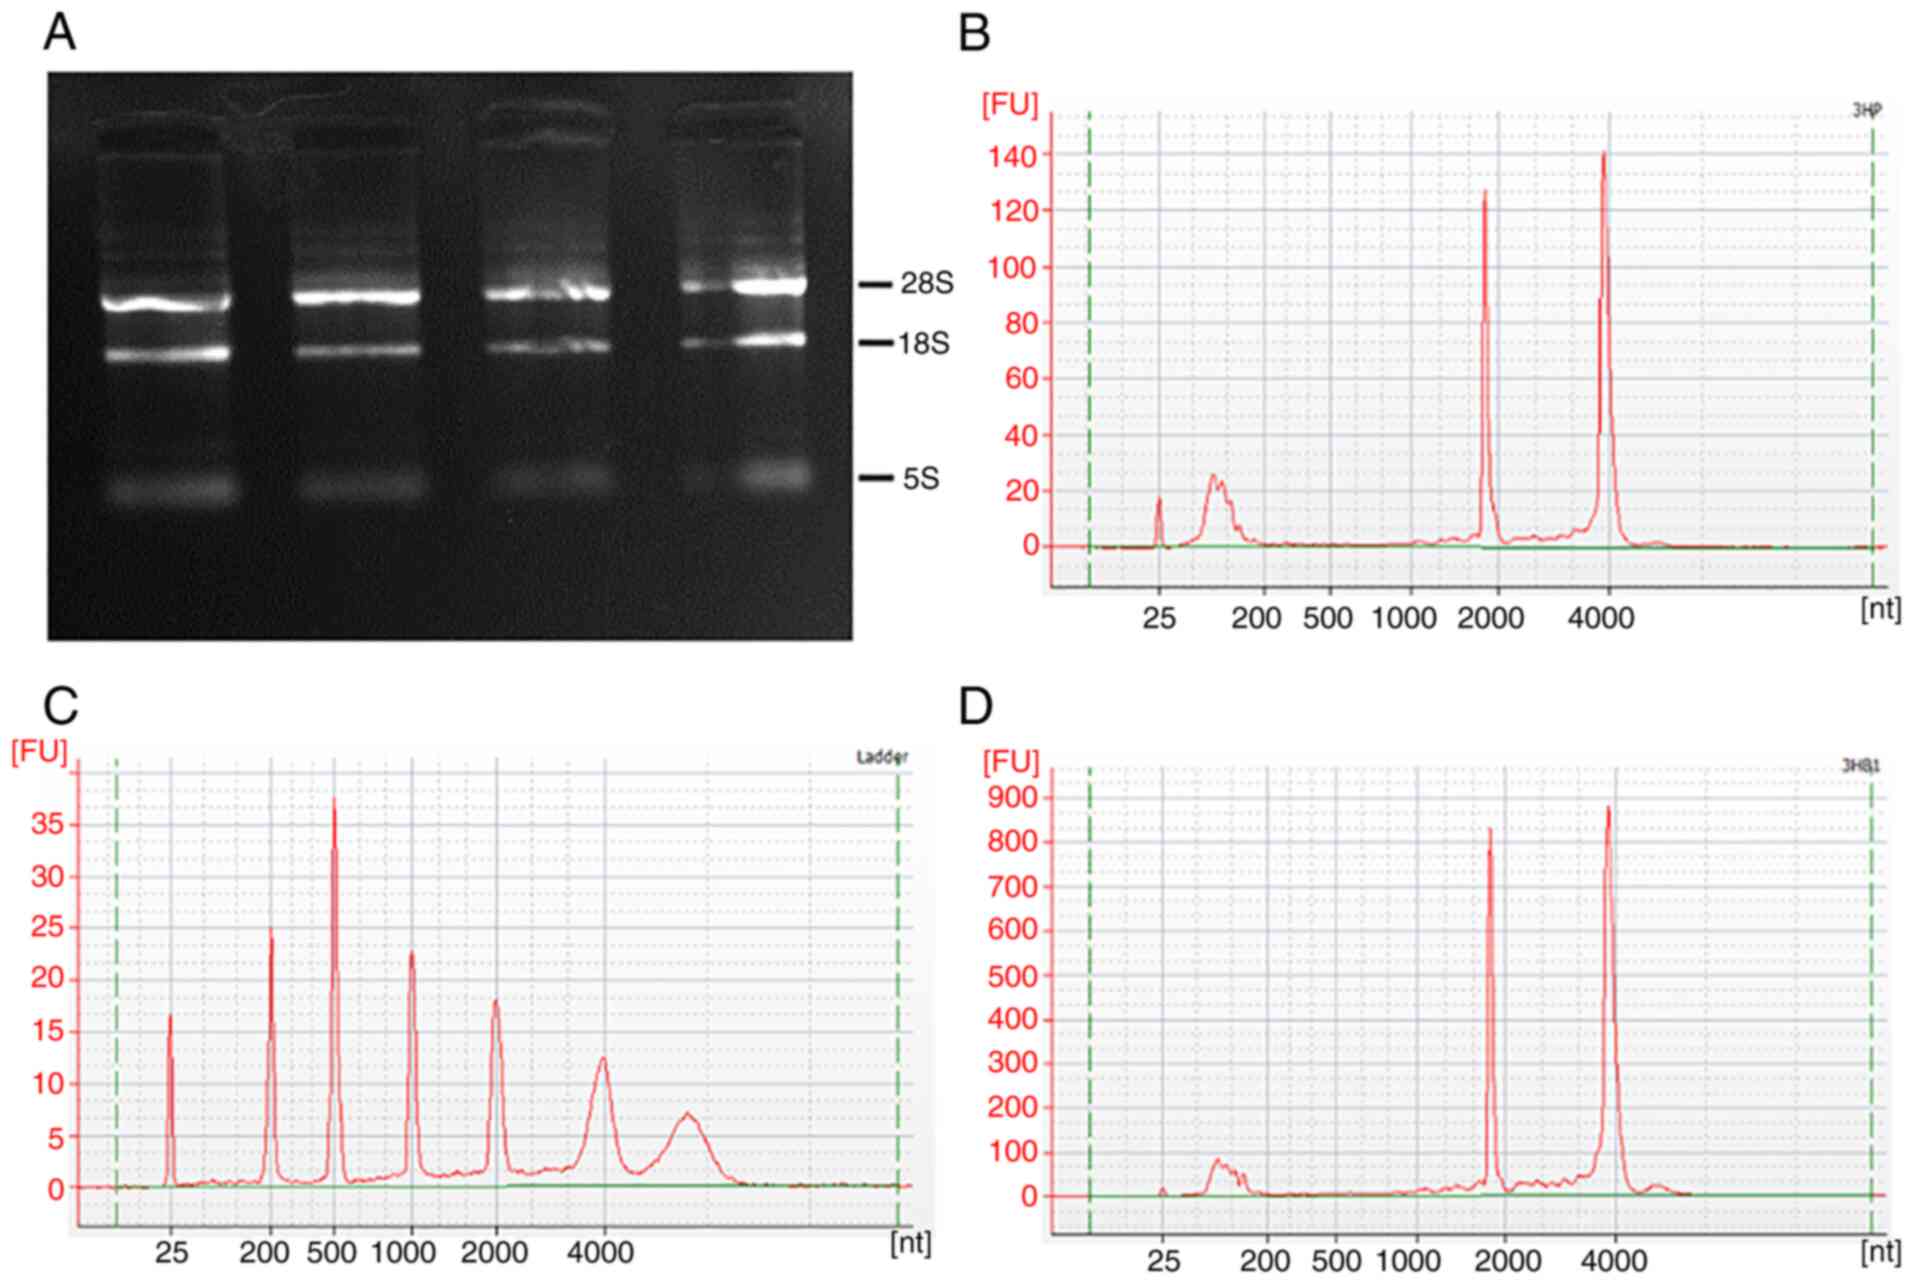
RNA purity and quality testing
Extract and detect the RNA of HCCLM3 cells, the
quality of the extracted RNA was deemed to be suitable for the
construction of a library for on-machine sequencing (Table SI). Agarose gel electrophoresis
demonstrated that the 28s rRNA and 18s rRNA bands were clearer,
while the 5s band was not clear, suggesting that RNA was not
contaminated with DNA and RNA was not degraded, and that the purity
and integrity met the requirements for subsequent chip
hybridization (Fig. 3A). Agilent
2100 Quality Assay Peaks (Fig.
3B-D), different peaks indicate quantification of the
results.
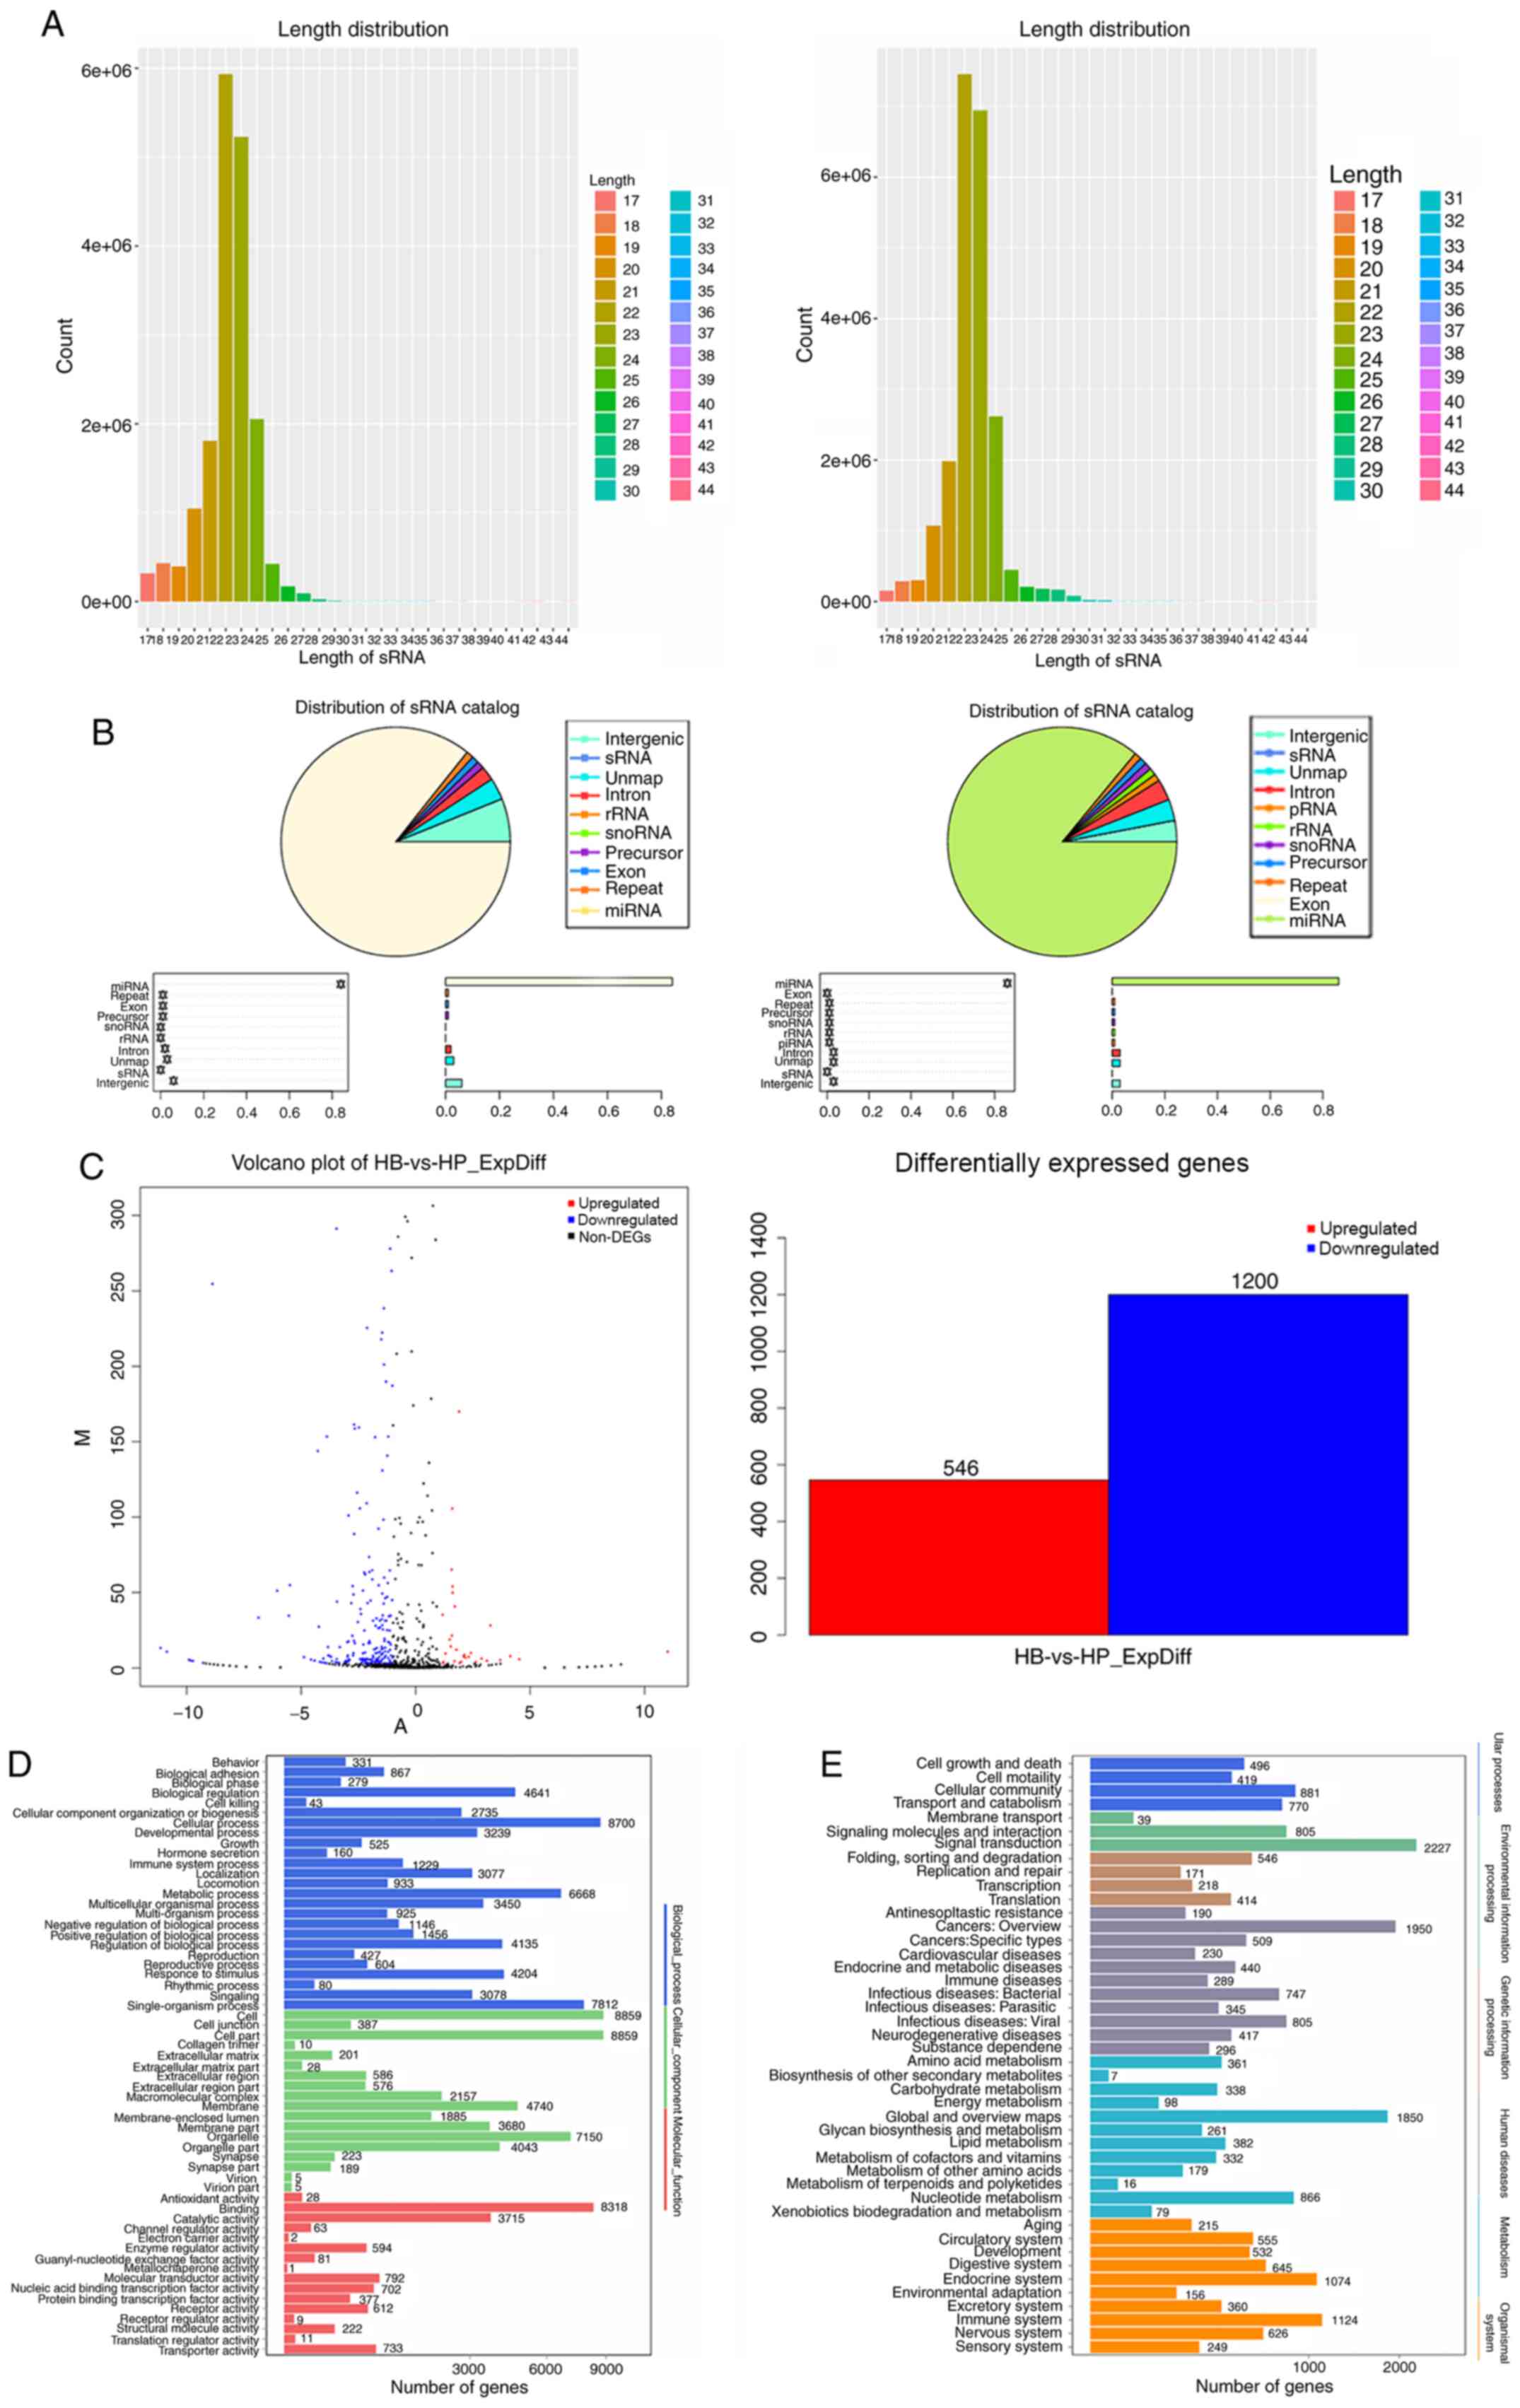
Identification of differentially
expressed miRNA profiles
RNA-Seq of the CBs and CPs of HCCLM3 are presented
in Fig. 4A. which indicate the types
of small RNAs in the sequencing data. Small RNAs were identified
and sequenced by comparing with a known small RNA database
(18,30), and small RNAs were classified and
annotated (Fig. 4B). We use ExpDiff
for differential small RNA screening (31), as shown in Fig. 4C, and the proportions of all types of
small RNAs are presented in Fig. 4.
A total of 19,443,590 and 22,807,548 pairs of sequences were
identified for both the CBs and CPs, respectively (Table SII). A total of 17,630,686 and
21,772,519 pairs of sequences were obtained following removal of
sequences containing the sequencing linker, repeat, indeterminate
and other low-quality reads (Table
SIII). Following filtration of the data, the remaining
sequences were aligned with known small RNA databases, including
miRBase, Rfam and siRNA, with 16,836,644 and 20,907,542 pairs of
sequences for the CBs and CPs, respectively. A total of 20 genes
were upregulated and downregulated.
According to the results of nucleotide sequence
alignment of the CBs and CPs of HCCLM3, the upregulated and
downregulated miRNAs were analyzed via Gene Ontology (GO)
enrichment analysis (32,33). Kyoto Encyclopedia of Genes and
Genomes (KEGG) pathway enrichment analysis (30) of the differentially expressed genes
was performed using a public database. Pathways were classified
according to KEGG functional annotations to identify pathways that
were actively regulated by miRNAs (Fig.
4D and E).
Combined with the cell body of HCCLM3 and the
results of RNA-Seq and the GO enrichment analysis, miRNAs were
enriched in HCCLM3 cell body; there were 64 pairs of genes,
including hsa-miR-17-5p and hsa-miR-30c-5p, of which 23 were
upregulated and 41 were downregulated.
Identification of differentially
expressed circRNA profiles
High-throughput sequencing is an effective means of
studying the biological functions of RNA (34–37).
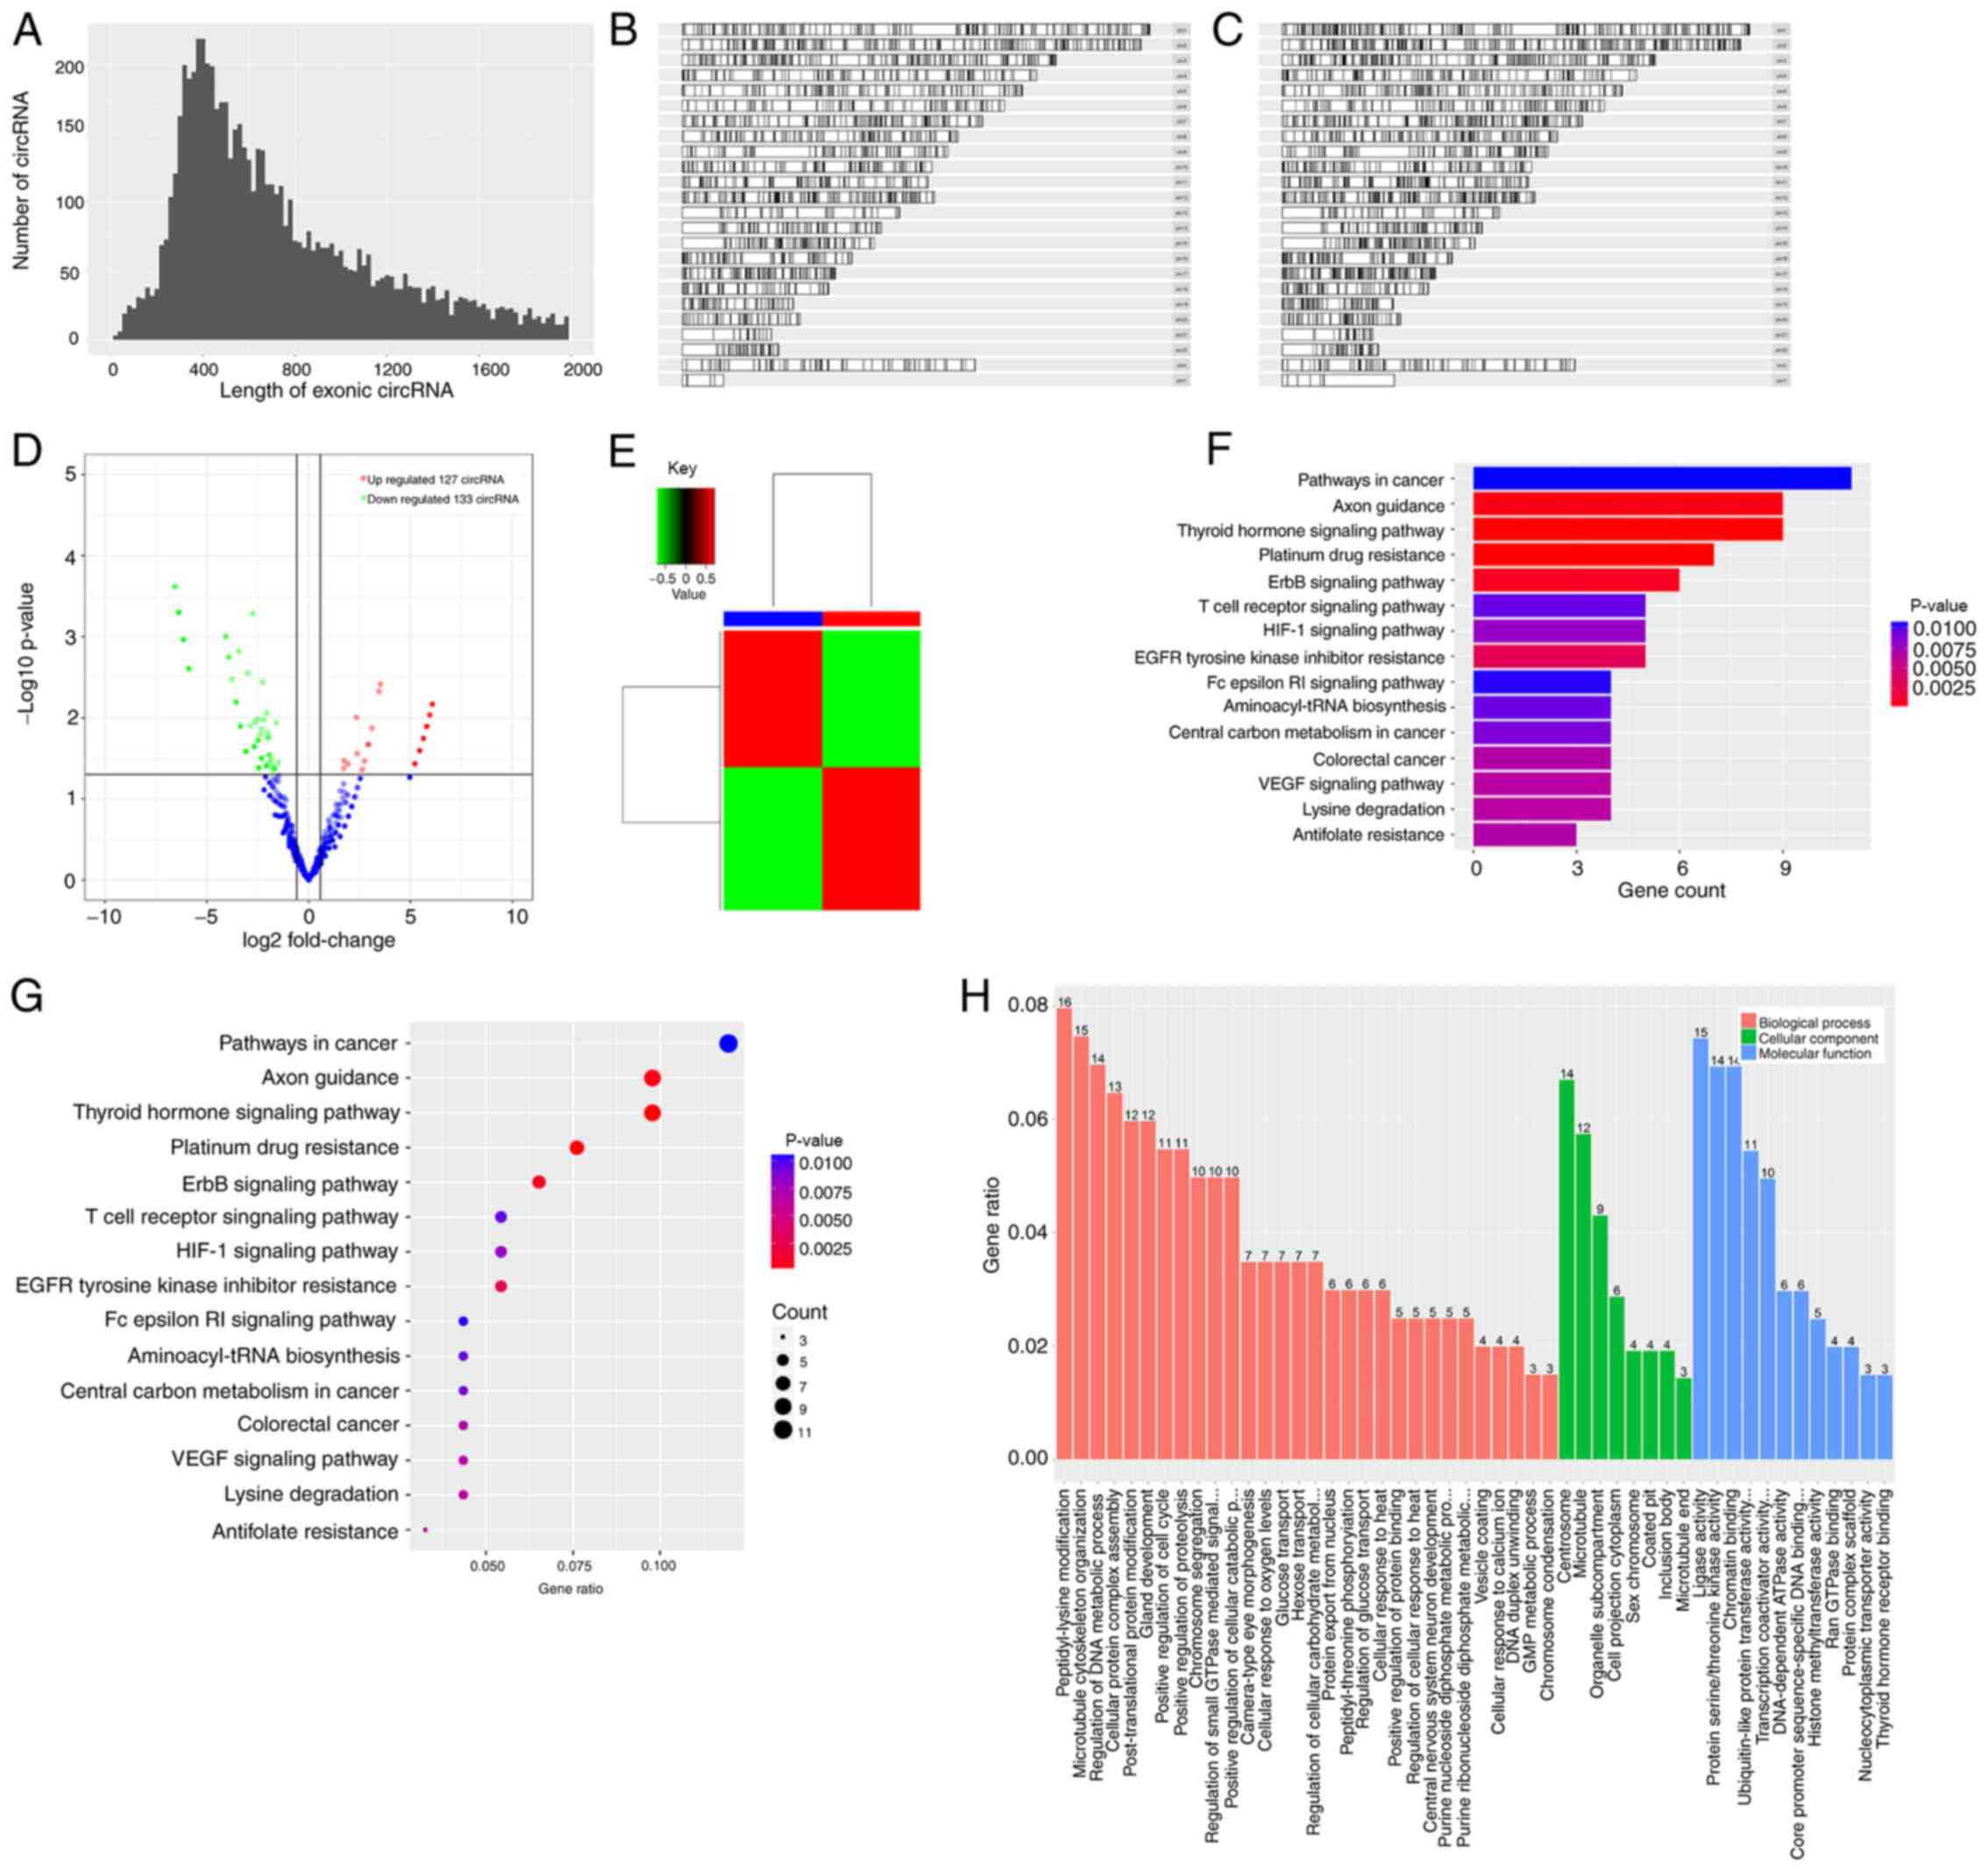
Fig. 5A presents the length
distribution of the circRNAs, while Fig.
5B and C present the length distribution of the RNAs in the CBs
and CPs, respectively. As presented in Table II, 1,538 genes were detected by
high-throughput sequencing, of which only 260 genes were
statistically significant (P<0.05). A total of 260 genes had a
fold change of ≥|1.5|, of which 127 genes were significantly
upregulated and 133 genes were downregulated (P<0.05). A total
of 260 genes had a fold change of ≥|10|, of which 117 genes were
upregulated 67 genes were downregulated.
| Table II.Upregulated and downregulated
genes. |
Table II.
Upregulated and downregulated
genes.
|
hsa_circbase_ID | Fold change | P-value |
hsa_circbase_ID | Fold change | P-value |
|---|
|
hsa_circ_0087200 | 67.60346424 | 0.006742853 |
hsa_circ_0091124 | −83.50491956 | 0.000497791 |
|
hsa_circ_0007090 | 67.60346424 | 0.006742853 |
hsa_circ_0008181 | −83.50491956 | 0.000497791 |
|
hsa_circ_0001487 | 67.60346424 | 0.006742853 |
hsa_circ_0003600 | −83.50491956 | 0.000497791 |
|
hsa_circ_0001264 | 67.60346424 | 0.006742853 |
hsa_circ_0007928 | −71.71850248 | 0.001077943 |
|
hsa_circ_0058039 | 67.60346424 | 0.006742853 |
hsa_circ_0067475 | −71.71850248 | 0.001077943 |
|
hsa_circ_0024960 | 61.54860385 | 0.009205770 |
hsa_circ_0046029 | −71.71850248 | 0.001077943 |
|
hsa_circ_0087357 | 55.49374347 | 0.012719766 |
hsa_circ_0026297 | −71.71850248 | 0.001077943 |
|
hsa_circ_0008058 | 55.49374347 | 0.012719766 |
hsa_circ_0007827 | −71.71850248 | 0.001077943 |
|
hsa_circ_0070680 | 55.49374347 | 0.012719766 |
hsa_circ_0018478 | −71.71850248 | 0.001077943 |
|
hsa_circ_0008027 | 55.49374347 | 0.012719766 |
hsa_circ_0004907 | −71.71850248 | 0.001077943 |
|
hsa_circ_0005775 | 55.49374347 | 0.012719766 |
hsa_circ_0001571 | −59.93208540 | 0.002458840 |
|
hsa_circ_0023182 | 55.49374347 | 0.012719766 |
hsa_circ_0075158 | −59.93208540 | 0.002458840 |
|
hsa_circ_0000126 | 55.49374347 | 0.012719766 |
hsa_circ_0001398 | −59.93208540 | 0.002458840 |
|
hsa_circ_0004994 | 49.43888308 | 0.017811177 |
hsa_circ_0002693 | −59.93208540 | 0.002458840 |
|
hsa_circ_0006348 | 49.43888308 | 0.017811177 |
hsa_circ_0002102 | −59.93208540 | 0.002458840 |
|
hsa_circ_0003789 | 49.43888308 | 0.017811177 |
hsa_circ_0058055 | −59.93208540 | 0.002458840 |
|
hsa_circ_0056280 | 49.43888308 | 0.017811177 |
hsa_circ_0006877 | −59.93208540 | 0.002458840 |
|
hsa_circ_0008520 | 49.43888308 | 0.017811177 |
hsa_circ_0005804 | −59.93208540 | 0.002458840 |
|
hsa_circ_0042880 | 49.43888308 | 0.017811177 |
hsa_circ_0032396 | −59.93208540 | 0.002458840 |
|
hsa_circ_0008926 | 49.43888308 | 0.017811177 |
hsa_circ_0025822 | −59.93208540 | 0.002458840 |
Fig. 5D presents the
comparison of the volcano maps from the CBs and CPs, while Fig. 5E presents the fold difference in gene
expression. The results demonstrated that 133 genes were
upregulated (red), while 127 genes were downregulated (green). KEGG
pathway analysis (Fig. 5F and G)
demonstrated that the differentially expressed genes were enriched
in the pathway, such as canonical pathway, functional disease
correlation analysis and transcription regulation analysis. The
pathway analysis is suggestive of the experimental results.
According to the data, hsa05200 regulated the occurrence and
development of cancer, and hsa04919 was associated with protrusion
growth and regulation.
GO analysis (Fig. 5H)
is divided into three parts: Molecular function, biological process
and cellular component. The results demonstrated that 216 genes
were associated with molecular functions, raw analysis was based on
the selected hypergeometric distribution of genes, pathway analysis
of each process and cell composition. Among these, 30 genes were
associated with biological processes, accounting for 13.6% of the
total number of genes. A total of 115 genes were involved in
molecular functions, accounting for 53.2% of genes, and 71 genes
were associated with cellular components, accounting for 32.9% of
genes.
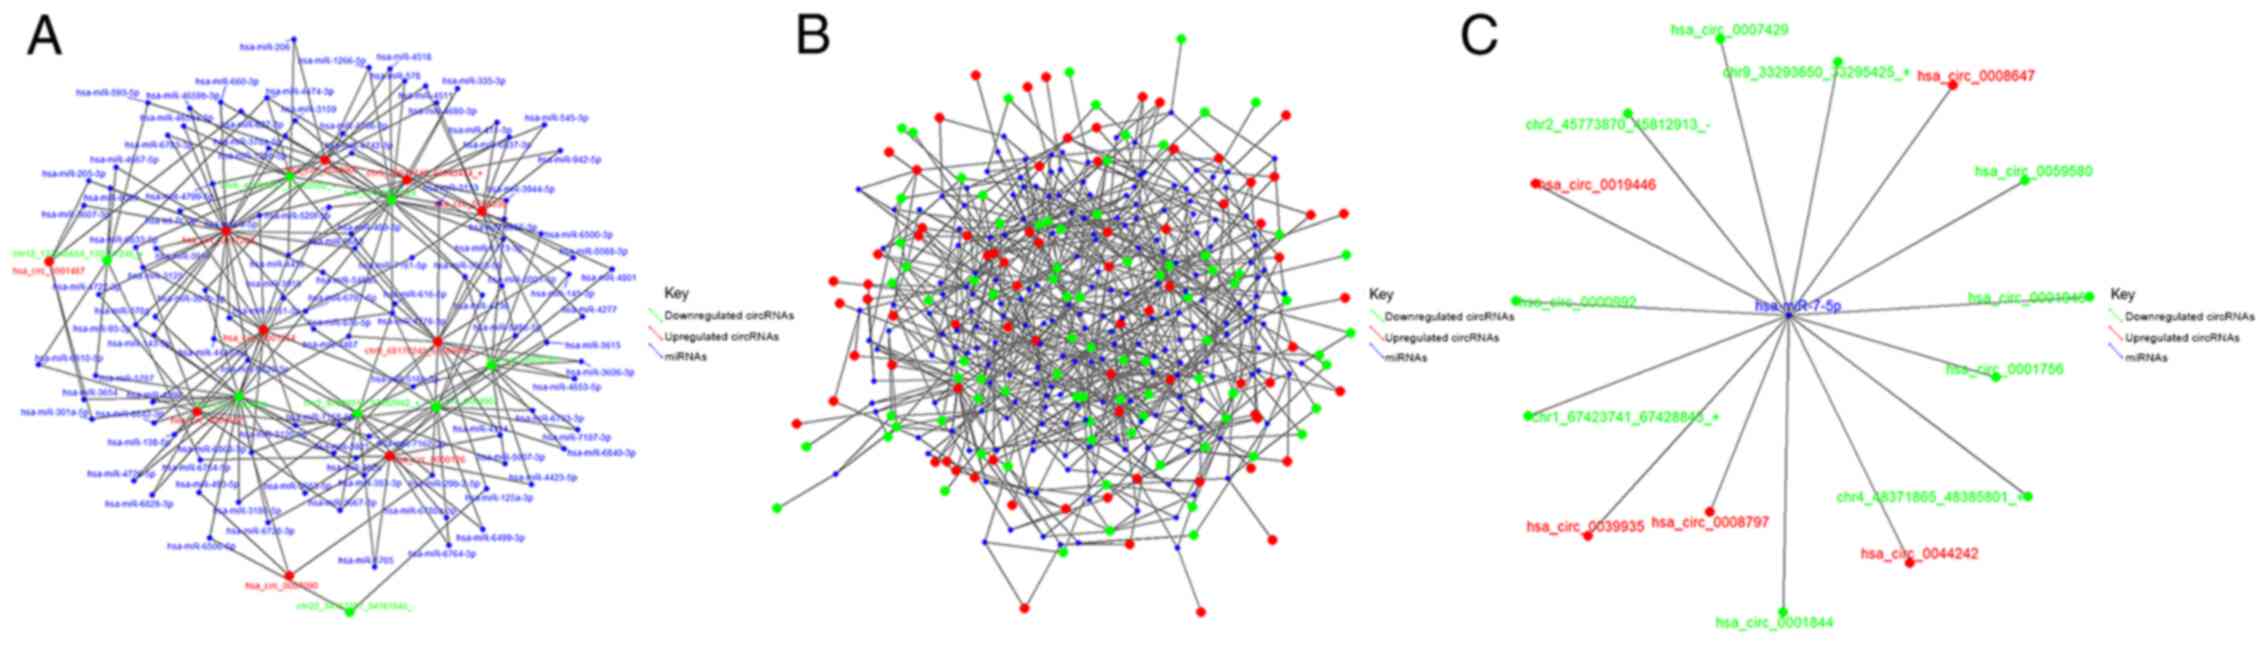
Construction of the circRNA/miRNA
interaction network
Based on the results of RNA-Seq and GO function
analysis, miRNAs and circRNAs with high expression levels in the
CBs or CPs of HCCLM3 cells, and multiple fold difference in
expression, were screened out. Fig.
6A presents the network of CBs interacting with CPs that are
both associated with circRNAs and miRNAs. The network diagram of
circRNA-miRNA interactions is based on the 1,000 pairs of circRNAs
with the highest predicted scores and their targeted miRNAs. The
higher the total score, the more reliable the result, and
interactions with high scores were further assessed, including
hsa-miR-7-5p and the 50 circRNA potential binding sites. Fig. 6B presents the interaction network,
while Fig. 6C presents the binding
sites of miR-7-5P.
Canonical pathway analysis
As presented in Table
III, 200 ingenuity canonical pathways were identified,
including oxidative phosphorylation, mitochondrial dysfunction and
EIF2 signaling, of which 30 pathways had a -log(P-value) of
>1.3, and thus the probability that the result was a random
match was <5%. The z-score indicates whether a pathway is
activated or inhibited by the activity prediction algorithm based
on Ingenuity Pathway Analysis (IPA). A positive value indicates
activation of the pathway, while a negative value indicates
inhibition. However, not all omics data have appropriate z-scores.
When the result does not have a satisfactory z-score, rank analysis
is prioritized using -log(P-value). This value indicates the
enrichment of the corresponding pathway in the dataset. The larger
the value, the better (generally >1.3), with less chance that
the result is a random match (<5%). The ratio indicates how much
of the molecules are identified in the submitted dataset (35).
| Table III.Canonical pathway analysis. |
Table III.
Canonical pathway analysis.
| Ingenuity canonical
pathways | Log (P-value) | Ratio | z-score | Molecules |
|---|
| Oxidative
phosphorylation | 12.30 | 0.327 | #NUM! | NDUFA4, SDHB,
COX7B, ATP5G1, UQCRH, COX5B, NDUFB5, COX8A, ATP5L, ATP5S, ATP5E,
NDUFB3, NDUFA2, ATP5J2, UQCRFS1, NDUFB6, ATP5I, NDUFAB1, COX7B2,
ATP5O, NDUFB1, UQCR11, COX11, NDUFS8, NDUFA11, COX6B2, NDUFB7,
COX7A2, SDHD, CYCS, CYB5A, NDUFS3, NDUFB2, UQCRQ |
| Mitochondrial
dysfunction | 8.63 | 0.230 | #NUM! | NDUFA4, ATP5G1,
SDHB, COX7B, UQCRH, COX5B, NDUFB5, COX8A, ATP5L, ATP5S, ATP5E,
NDUFB3, NDUFA2, PARK7, ATP5J2, NDUFB6, UQCRFS1, PRKN, ATP5I,
NDUFAB1, COX7B2, ATP5O, NDUFB1, UQCR11, FIS1, PRDX3, COX11, NDUFS8,
NDUFA11, COX6B2, NDUFB7, COX7A2, SDHD, CYCS, CYB5A, NDUFS3, NDUFB2,
UQCRQ |
| EIF2 signaling | 8.37 | 0.208 | 2.294 | RPS3A, RPL22L1,
RPLP2, RPL39, RPL26, RPL35A, KLB, RPS28, RPS7, VEGFA, RPL35, RPS20,
RPS13, IGF1R, RPL21, RPL39L, IRS2, RPL36, RPS12, RPS5, RPL32,
RPS19, RPL34, RPS8, RPL17, RPS10, RPL29, EIF2B3, RPS21, RPS29,
RPL10A, RPL9, RPL27, RPS16, RPS26, RPL26L1, EIF3I, RPS27A, PIK3CD,
RPS15A, RPS25, INSR, RPSA, RPS14 |
| Regulation of eIF4
and p70S6K signaling | 4.44 | 0.182 | −2.449 | RPS3A, KLB,
EIF4EBP1, RPS28, RPS7, ITGA3, RPS20, RPS13, IRS2, RPS5, RPS12,
RPS19, ITGA2, RPS8, RPS10, ITGA5, EIF2B3, RPS21, RPS29, RPS16,
RPS26, EIF3I, RPS27A, RPS15A, PIK3CD, RPS25, RPS14, RPSA |
| Prostanoid
biosynthesis | 3.49 | 0.556 | #NUM! | PTGIS, PTGES,
PTGS1, PTGS2, PTGDS |
| Vitamin C
transport | 3.15 | 0.400 | #NUM! | SLC2A1, TXN, NXN,
GSTO2, SLC2A3, GSTO1 |
| mTOR signaling | 2.95 | 0.147 | −0.707 | RPS3A, KLB,
EIF4EBP1, RPS28, VEGFA, RPS7, RPS20, RPS13, RHOD, RPS6KB2, IRS2,
RPS12, RPS5, RPS19, RPS8, RPS10, RPS21, RPS29, RPS6KA6, RPS16,
RPS26, EIF3I, RPS27A, RPS15A, PIK3CD, RPS25, INSR, RPSA, RPS14 |
| Pyrimidine
deoxyribonucleotides de novo biosynthesis I | 2.78 | 0.304 | #NUM! | TYMS, NME3, NME1,
NME2, AK4, DTYMK, AK7 |
Functional and disease correlation
analyses
Following classification of the organ of origin and
cell line, the specific subfunctions were annotated. Predicted
activation state predicts whether the feature is activated or
deactivated. A higher value indicates that this function may be
activated in the experimental system, whereas a lower value
suggests inhibition. Activation z-score for this function is
activated inhibition score, an absolute value of >2 is
considered a high probability of activation or inhibition. The
molecules are listed as potential target genes and the
corresponding number (35). As
presented in Table IV, 35/506
functions were significantly inhibited, including cellular
movement, while six functions were significantly activated,
including cancer, organismal injury and abnormalities.
| Table IV.Functional and disease correlation
analyses. |
Table IV.
Functional and disease correlation
analyses.
| Categories | Disease or function
annotation | P-value | Predicted
activation state | Activation
z-score | Molecules |
|---|
| Cellular
movement | Migration of brain
cancer cell lines | 0.001240 | Decreased | −3.482 | 22 |
| Cellular
movement | Cell movement of
brain cancer cell lines | 0.002400 | Decreased | −3.619 | 24 |
| Cellular
movement | Cell movement of
tumor cell lines | 0.007710 | Decreased | −4.666 | 123 |
| Cellular
movement | Migration of
cells | 0.008930 | Decreased | −4.841 | 160 |
| Cellular
movement | Cell movement | 0.004350 | Decreased | −5.188 | 183 |
| Cancer, organismal
injury and abnormalities | Genitourinary
tumor | 0.000247 | Increased | 2.186 | 823 |
| Cancer, organismal
injury and abnormalities | Urogenital
cancer | 0.000637 | Increased | 2.219 | 804 |
| Cancer, organismal
injury and abnormalities, renal and urological disease | Renal cancer | 0.004210 | Increased | 2.000 | 150 |
| Cancer, organismal
injury and abnormalities, renal and urological disease | Renal cancer and
tumors | 0.00514 | Increased | 2.000 | 152 |
| Cancer, organismal
injury and abnormalities, renal and urological disease | Urinary tract
cancer | 0.00855 | Increased | 2.000 | 182 |
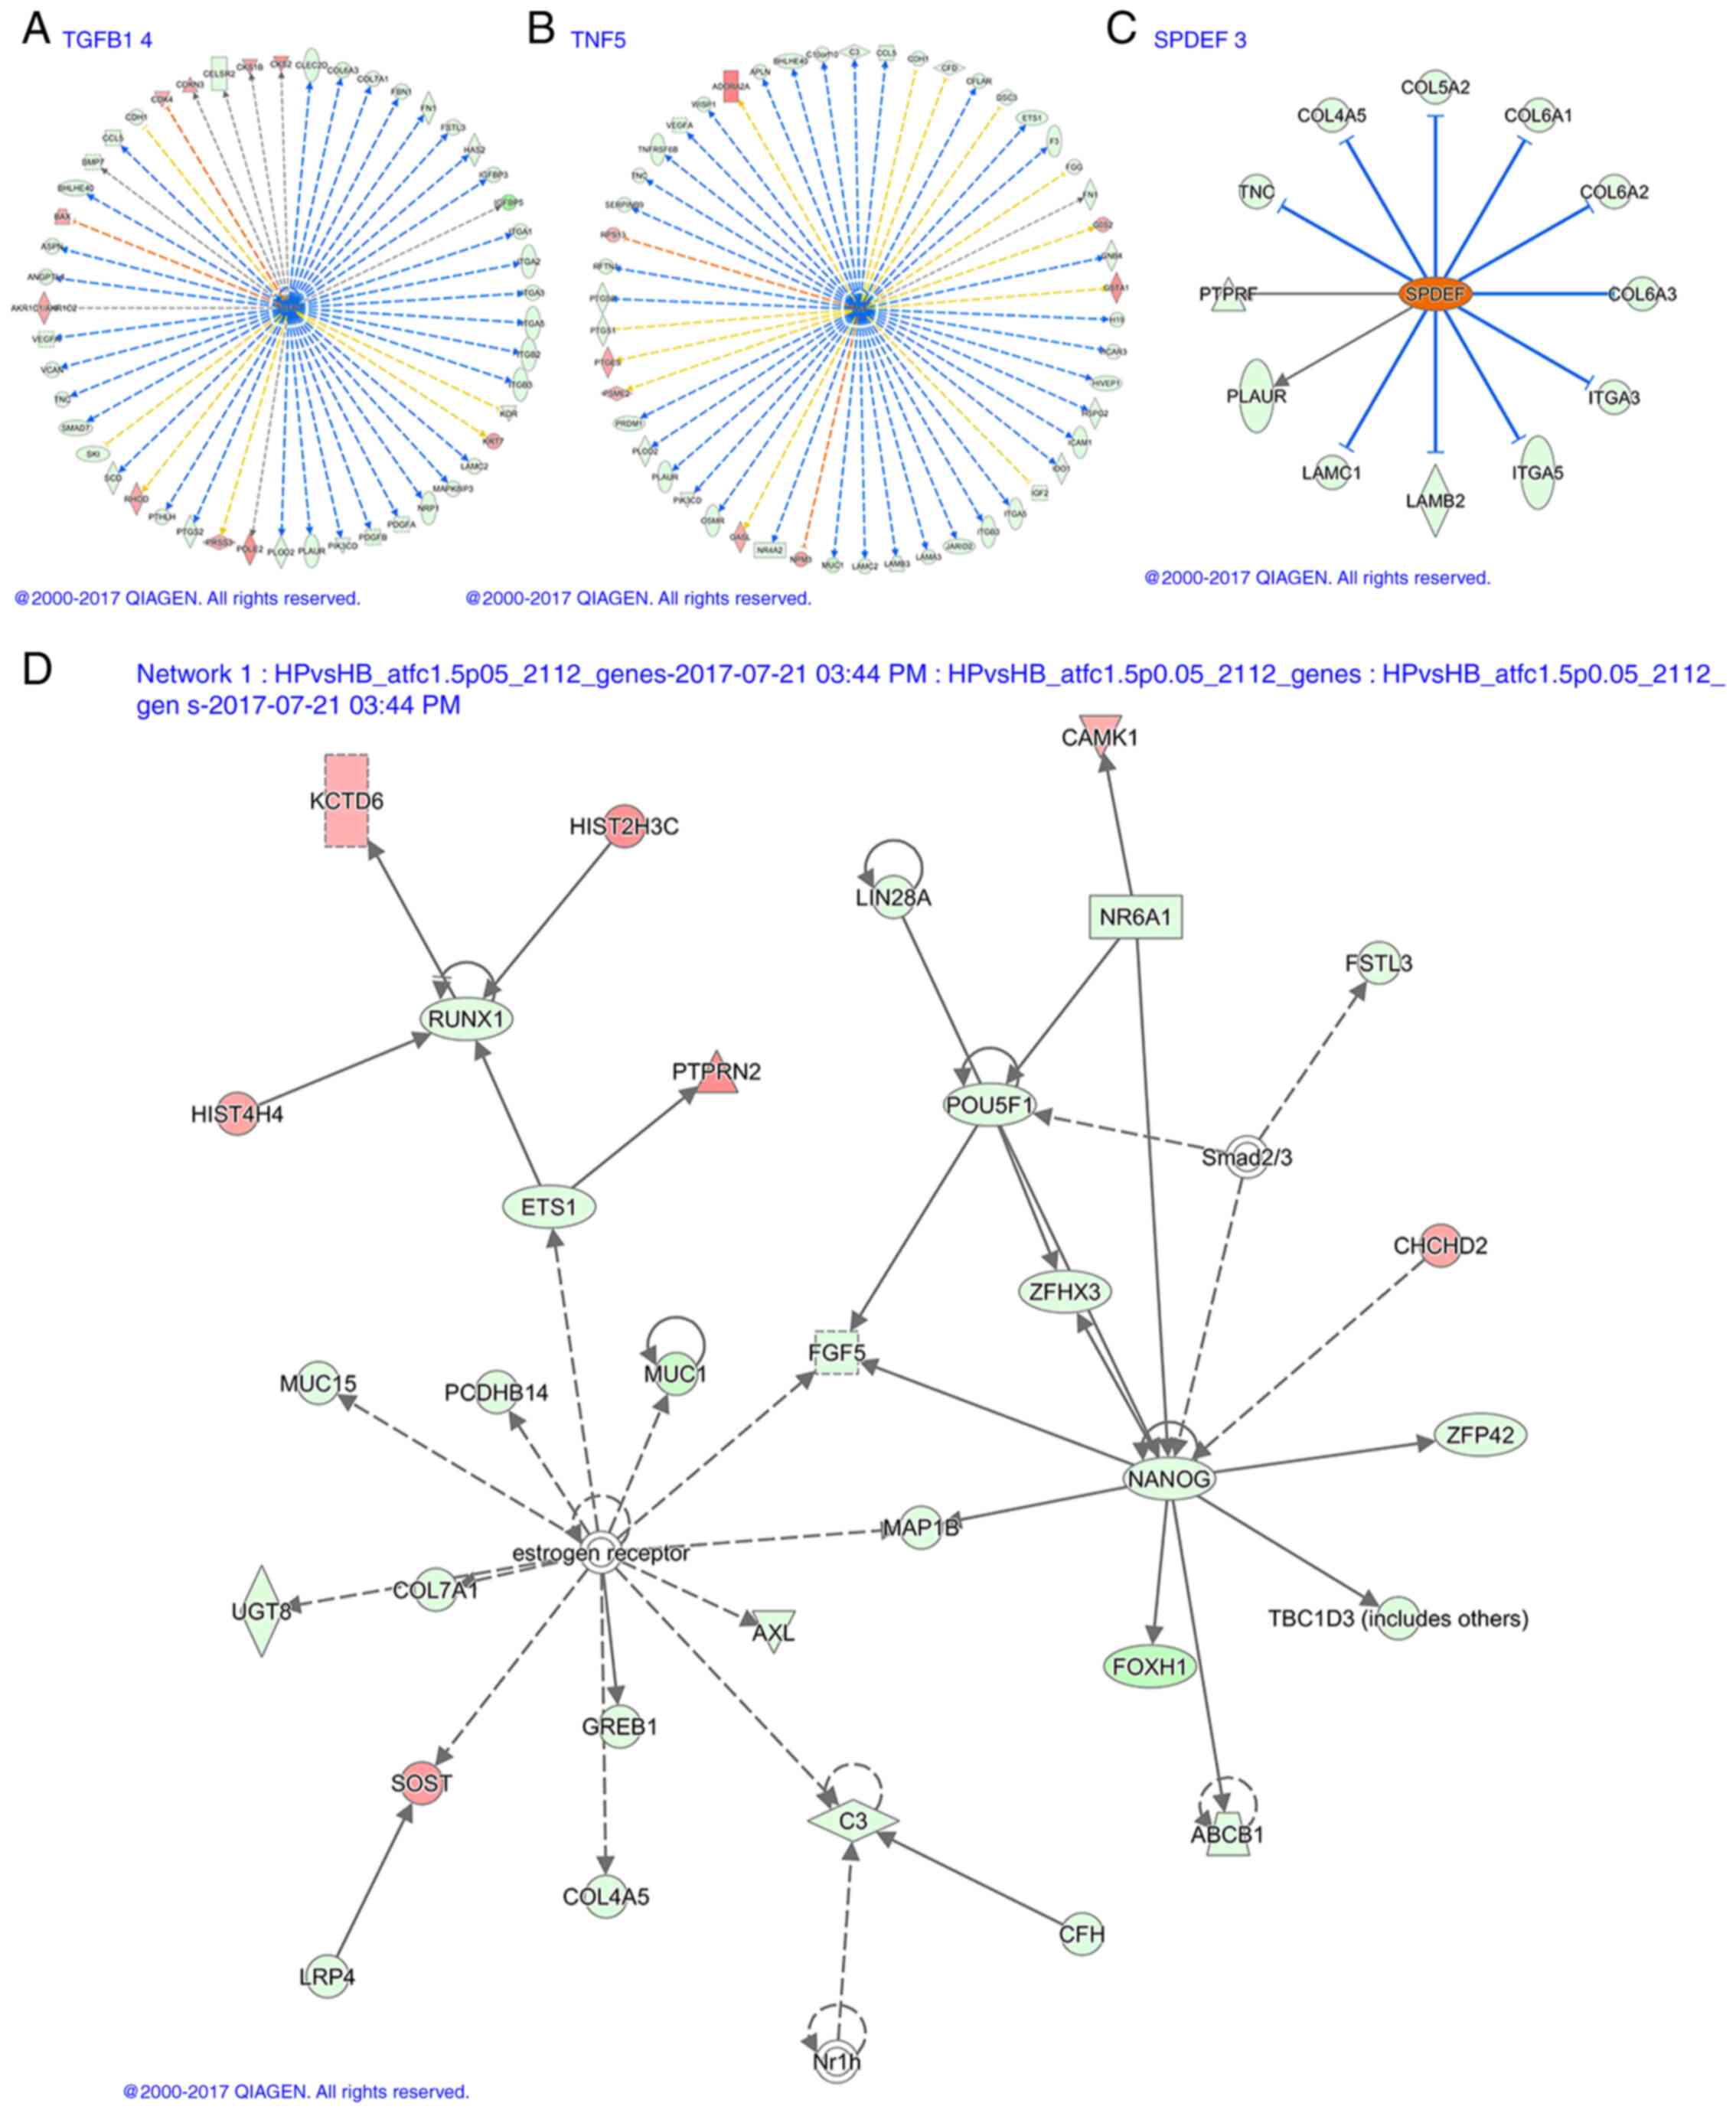
Transcriptional regulation
analysis
Upstream Regulator is the upstream regulator of the
molecule that may change as predicted by IPA. Fold change shows the
change factor of the regulator. Molecule Type is the molecular type
of the regulator, Predicted Activation State is the possible
activity of the regulator predicted by IPA, Activation z-score
measures the possibility of this phenomenon. The greater the
absolute value of this value, the higher the possibility, which
means that the downstream gene expression changes are consistent
with the possible regulatory relationship of the regulator; p-value
indicates the submission of data. P-value indicates the probability
of a random match between the upstream regulator and the molecule.
The lower the probability, the smaller the probability. Target
molecules lists the related molecules in the data set; mechanistic
network is used to predict transcriptional regulator interactions,
and the numbers in the Mechanistic Network column represent the
number of target genes of the regulatory factor, the number in
parentheses represents the number of regulatory factors related to
the regulatory factor (35). The 46
suppressors and 13 activators are listed in Table SIV. Table SV lists information on downregulated
TGFB1 and tumor necrosis factor (TNF) genes and upregulated SPDEF
genes. Fig. 7A-C present the
corresponding transcriptional regulation.
Interaction network analysis
Molecules in Network lists all network molecules,
among which the red arrow indicates the concentration of
upregulated molecules, the green is downregulated molecules and the
other molecules are potential undiscovered molecules that may have
interactions predicted by IPA. Score is the network enrichment
score, generally if the score is >20, the network is considered
to be more credible. Focus Molecules is the number of molecules
involved in the construction of the network, and Top Functions is
the main biological function of the construction of the interaction
network (35). In the present study,
25 interactions were identified, 11 of which scored >20.
Fig. 7D presents one of the
networks.
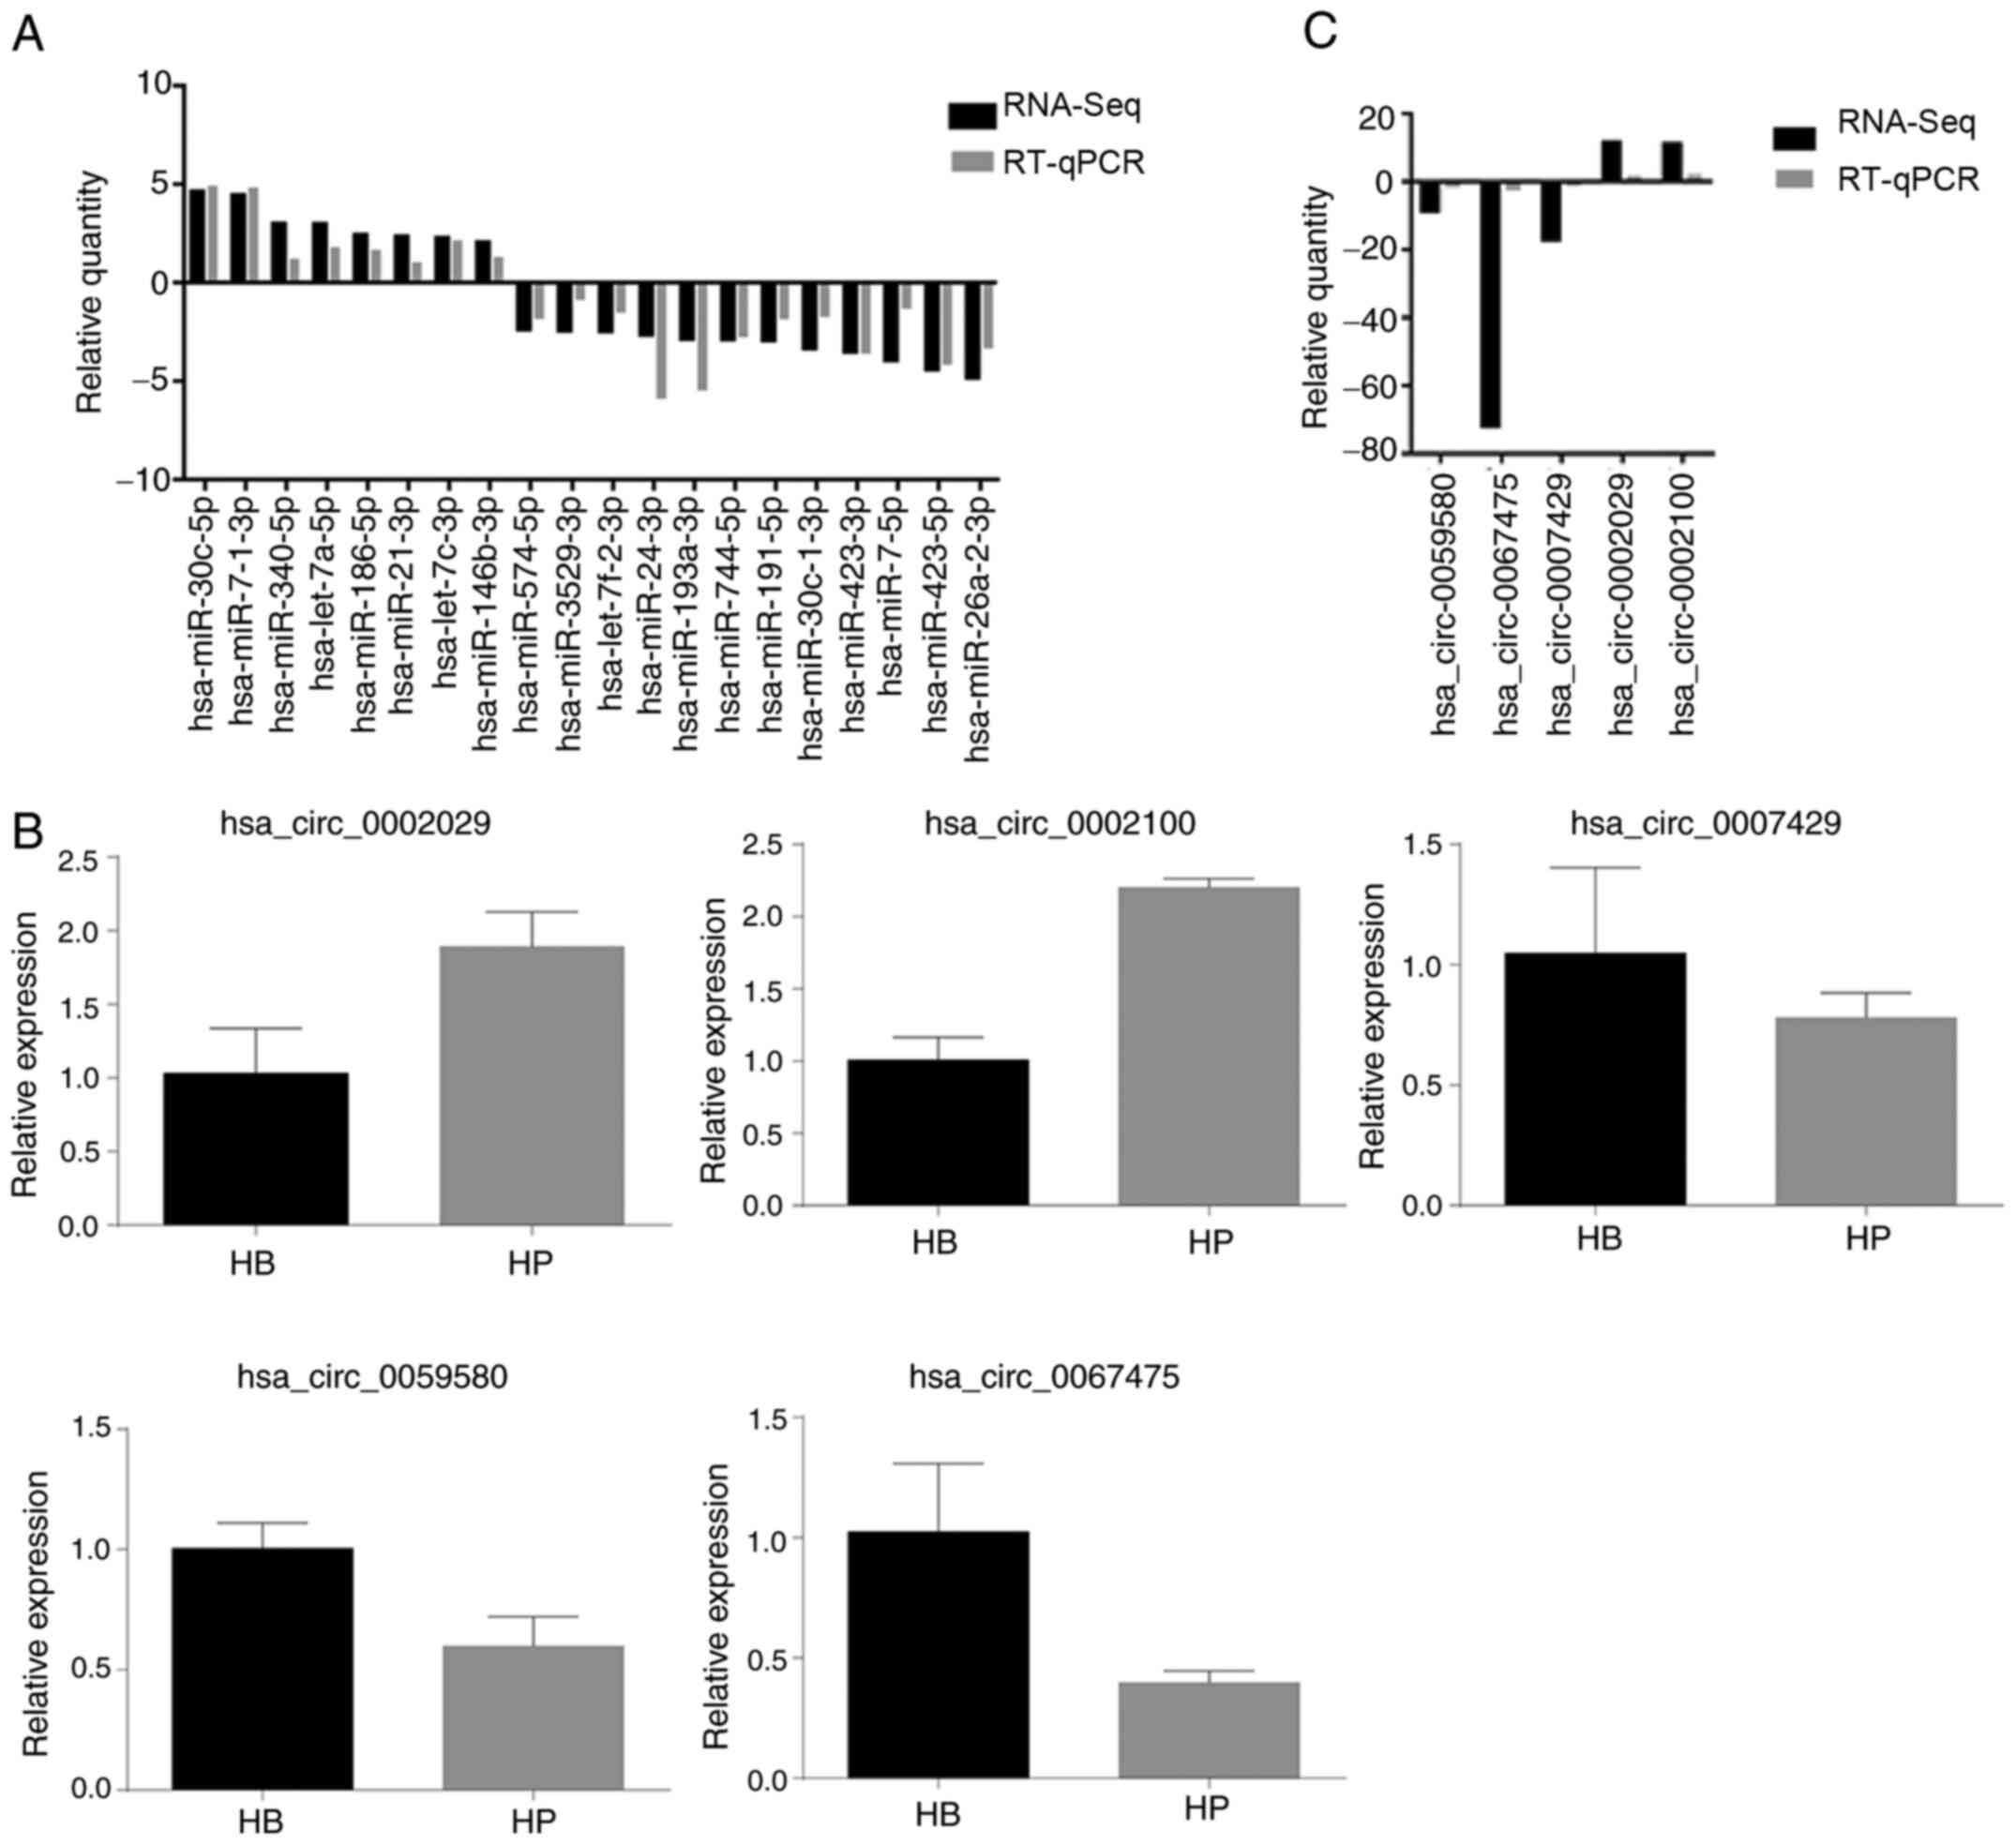
Validation of differentially expressed
miRNA profiles
To further confirm the differentially expressed
miRNAs, 25 miRNAs were selected to perform RT-qPCR analysis in RNA
samples extracted from HCCLM3 CBs and CPs. The selected miRNAs
covered both highly expressed miRNAs in CPs (hsa-let-7a-5p,
hsa-let-7c-3p, hsa-miR-30c-5p, hsa-miR-7-1-3p, hsa-miR-340-5p,
hsa-miR-186-5p, hsa-miR-21-3p and hsa-miR-146b-3p) and miRNAs
expressed at low levels (hsa-miR-26a-2-3p, hsa-miR-423-5p,
hsa-miR-7-5p, hsa-miR-423-3p, hsa-miR-191-5p, hsa-miR-744-5p,
hsa-miR-193a-3p, hsa-miR-24-3p, hsa-miR-3529-3p, hsa-miR-574-5p,
hsa-miR-30c-1-3p and hsa-miR-7f-2-3p). As presented in Table V and Fig.
8A, eight miRNAs were upregulated in CPs, while 12 miRNAs were
downregulated. To confirm these changes, RT-qPCR analysis was
performed on 20 miRNAs. The results demonstrated that the changes
were consistent with the RNA-Seq data (Table SVI), although the magnitude of
changes differed between these two methods. Taken together, these
results suggest that RNA-Seq is a reliable method.
| Table V.Upregulation and downregulation of
the 20 genes. |
Table V.
Upregulation and downregulation of
the 20 genes.
| miRNA ID | Count (HB) | Count (HP) | TPM (HB) | TPM (HP) | log2 ratio
(HP/HB) | Upregulation (Up)
or downregulation (Down) (HP/HB) |
|---|
|
hsa-miR-4742-3p | 0 | 45 | 0.001 | 2.060 | 11.008 | Up |
|
hsa-miR-26a-1-3p | 9036 | 412298 | 511.220 | 18910.310 | 5.209 | Up |
| hsa-miR-17-5p | 210 | 7649 | 11.880 | 350.830 | 4.884 | Up |
| hsa-miR-30c-5p | 808 | 23968 | 45.710 | 1099.310 | 4.587 | Up |
|
hsa-miR-548av-3p | 1 | 30 | 0.0600 | 1.380 | 4.523 | Up |
| hsa-miR-7-1-3p | 6539 | 172266 | 369.950 | 7901.090 | 4.416 | Up |
| hsa-miR-3609 | 2 | 42 | 0.110 | 1.930 | 4.133 | Up |
| hsa-miR-338-5p | 2 | 31 | 0.110 | 1.420 | 3.690 | Up |
|
hsa-miR-374b-3p | 202 | 2580 | 11.430 | 118.330 | 3.371 | Up |
| hsa-miR-576-5p | 15 | 178 | 0.850 | 8.160 | 3.263 | Up |
| novel_mir29 | 40 | 0 | 2.260 | 0.001 | −11.142 | Down |
|
hsa-miR-4750-3p | 33 | 0 | 1.870 | 0.001 | −10.868 | Down |
|
hsa-miR-3150a-3p | 17 | 0 | 0.960 | 0.001 | −9.907 | Down |
|
hsa-miR-6855-5p | 16 | 0 | 0.910 | 0.001 | −9.830 | Down |
| novel_mir111 | 15 | 0 | 0.850 | 0.001 | −9.731 | Down |
|
hsa-miR-6820-3p | 11 | 0 | 0.620 | 0.001 | −9.276 | Down |
| novel_mir27 | 747 | 2 | 42.260 | 0.090 | −8.875 | Down |
| novel_mir47 | 103 | 1 | 5.830 | 0.050 | −6.865 | Down |
| novel_mir57 | 164 | 3 | 9.280 | 0.140 | −6.051 | Down |
| novel_mir109 | 115 | 3 | 6.510 | 0.140 | −5.539 | Down |
Validation of differentially expressed
circRNA profiles
A total of five circRNAs were assessed via RT-qPCR
analysis. The results demonstrated that the circRNA expression
profiles significantly varied in RNA samples extracted from HCCLM3
CBs and CPs. Table SVII presents
the comparisons between RNA-Seq and RT-qPCR analysis amongst the
five circRNAs. As presented in Fig.
8B, two circRNAs (hsa_circ_0002029 and hsa_circ_0002100) were
upregulated in CPs compared with the CBs, while the remaining three
circRNAs (hsa_circ_0007429, hsa_circ_0059580 and hsa_circ_0067475)
were downregulated. RT-qPCR analysis demonstrated that the changes
in all five circRNAs were consistent with that of RNA-Seq. This
variation may exert a notable effect on miRNA interactions, thus
highlighting potential therapeutic targets for the treatment of HCC
(Fig. 8C).
Discussion
HCCLM3 cells develop protrusions to investigate the
surrounding environment, and the information is passed to the cell
body, which regulates cell behavior (25). Several studies have confirmed that
miRNAs and circRNAs are closely associated with the development and
metastasis of malignant tumors, and serve important roles as
oncogenes or tumor suppressor genes (37–40).
Thus, further investigation on the miRNAs and circRNAs enriched in
protrusions is important for understanding cell polarization and
migration.
The present study and previous studies have
demonstrated that the Boyden chamber assay can be used to reliably
isolate the cell body from the protrusions (41,42).
First, a 1.0 µm pore size Boyden suspension cell culture dish was
placed in a Petri dish soaked in type I collagen (10 µg/ml) for 2 h
at 4°C to incubate collagen on the bottom of the Petri dish PET
film. Collagen incubated underneath the bottom layer of the cell
culture dish can induce protrusion migration (43) of hepatoma cells into the culture
chamber below the Boyden cell culture dish (44). Cells were starved for 12 h,
subsequently seeded on the upper side of a Boyden dish, cultured at
37°C for 24 h, and CBs were detached with a spatula and the RNA was
extracted.
The resulting RNA can be used for further
sequencing, western blot and immunofluorescence analyses.
Experimental results have confirmed the reliability of this
separation method, as long as the cell body does not enter into the
lower chamber, the protrusion components will be reliably separated
from the body, and thus the results will be accurate (42).
High-throughput sequencing is an effective means of
studying the biological functions of RNAs (18,30). In
the present study, miRNA and circRNA sequencing demonstrated that
64 pairs of miRNAs were differentially regulated, including 23
pairs of upregulated genes and 41 pairs of downregulated genes.
There were 260 changes in circRNA genes with fold changes ≥|1.5|,
including 127 genes that were upregulated and 133 genes that were
downregulated. GO analysis of the 216 genes demonstrated that
miR-17-5p was closely associated with biological process, molecular
function and cell composition. KEGG pathway analysis revealed that
the differentially expressed miRNAs and circRNAs serve a key role
in the pathogenesis of HCC. The primary pathways regulated were:
‘Cancer pathways’,‘protrusion regulation’, ‘cell cycle’, ‘chemical
carcinogenesis’ and ‘cytokine-cytokine receptor interactions’,
suggesting that miRNAs and circRNAs may serve key roles in these
processes by regulating these pathways. The results of the present
study are consistent with the findings by Zhu et al
(44), who demonstrated that
deregulated long non-coding RNAs may serve a role in these pathways
by regulating protein-coding genes.
RNA-Seq is a reliable approach to quantitatively
evaluate gene expression levels (45). However, the repetitive nature of the
human genome limits the detectability of certain genes (46). Thus, the expression levels of miRNAs
and circRNAs in HCCLM3 CBs and CPs were confirmed via RT-qPCR
analysis in the present study. The results demonstrated that
dysregulation of 20 miRNAs and five circRNAs were consistent with
the RNA-Seq results; and although the specific degree of
dysregulation differed, this may be attributed to the different
methods and experimental conditions (47,48).
However, the consistency indicates the reliability of the RNA-Seq
results and enhances the credibility of the circRNA-miRNA
interacting network.
It has been reported that circRNAs act as RNA
sponges (48,49). circRNAs have been proposed to store
miRNAs and have been found to be rich in functional miRNA binding
sites. Li et al confirmed that circ-ITCH can act as a miRNA
sponge and increase ITCH expression, a target gene for miR-17-5p in
esophageal squamous cell carcinoma (49). Several studies have demonstrated that
the biological presence of circRNAs can compete with the splicing
of pre-mRNAs, indicating that circRNAs serve important roles in the
production of mRNA (50,51). It was hypothesized that circ_0058039,
circ_0087200, circ_0007090, circ_0091124, circ_0008181 amongst the
other differentially regulated small nuclear RNAs may interact with
miR-7-5p, miR-3614-3p, miR-501-5p, miR-3617-5p, miR-1290, miR-4794,
miR-641, miR-8056, miR-8056 and miR-661 to regulate the expression
of the target genes, and thus serve an important role in the
development and progression of HCC. Abnormal expression of miRNAs
has been observed in HCC (52). For
example, miR-7-5p has been reported to regulate several oncogenic
signal transduction pathways, such as the epidermal growth factor
receptor, PI3K/AKT and RAF-MEK-ERK signaling pathways (53,54).
In addition, the present study predicted specific
miRNA and circRNA regulatory mechanisms, through canonical pathway,
functional and disease correlation analyses, and transcriptional
regulation and interaction network analyses, such as AKR1C1/AKR1C2
mediated inhibition of TGFB1 activity and ADORA2A mediated
inhibition of TNF activity, whereas COL4A5 and other activities
were predicted to activate SPDEF.
In conclusion, the present study used the highly
metastatic HCC cell line, HCCLM3, to assess differential regulation
of small nuclear RNAs to provide novel insight from our previous
study (55). The Boyden chamber
assay was used to separate the CBs and CPs, and immunofluorescence
and western blotting analyses were performed to confirm the
efficiency of the Boyden chamber assay. Using the extracted RNA
from CBs and CPs to construct the library, and using RNA-Seq
technology for bioinformatics analysis, miRNAs and circRNAs
associated with invasion and metastasis of HCC were preliminarily
screened, and the function and regulation of miRNAs and circRNAs
were predicted. Taken together, the results of the present study
highlight potential targets for further analysis to determine the
underlying molecular mechanisms of liver cancer.
Future studies should select specific miRNAs or
circRNAs identified in the present study and determine their
molecular mechanisms, which may provide novel targets for the
diagnosis and treatment of patients with liver cancer.
Supplementary Material
Supporting Data
Acknowledgements
Not applicable.
Funding
The present study was supported by National College
Students Innovation and Entrepreneurship Training Program (grant
no. 201710343002), the Zhejiang Medical and Health Science and
Technology Plan Project (grant no. KYB451), the Zhejiang University
Students Science and Technology Innovation Project (grant nos.
2017R413050, 2017R413051 and 2017R413085), the Zhejiang Natural
Science Foundation Youth Project (grant no. LQ19H200002), the
Zhejiang Natural Science Foundation Public Welfare Technology
Project (grant no. LGF18H200003) and the Wenzhou Science and
Technology Plan Project (grant no. Y20170009).
Availability of data and materials
The datasets used and/or analyzed during the present
study are available from the corresponding author upon reasonable
request.
Authors' contributions
WC performed the experiments and drafted the
manuscript. JJ designed the study and performed the experiments. BW
and KH performed the experiments and drafted the initial
manuscript. ZS designed the study, contributed to the discussion
and revised the manuscript for important intellectual content. PR,
YJ, LY and QT analyzed the data. ZS and JJ confirmed the
authenticity of all the raw data. All authors have read and
approved the final manuscript.
Ethics approval and consent to
participate
Not applicable.
Patient consent for publication
Not applicable.
Competing interests
The authors declare that they have no competing
interests.
References
|
1
|
Kindler S, Wang H, Richter D and Tiedge H:
RNA transport and local control of translation. Annu Rev Cell Dev
Biol. 21:223–245. 2005. View Article : Google Scholar : PubMed/NCBI
|
|
2
|
Ferlay J, Soerjomataram I, Dikshit R, Eser
S, Mathers C, Rebelo M, Parkin DM, Forman D and Bray F: Cancer
incidence and mortality worldwide: Sources, methods and major
patterns in GLOBOCAN 2012. Int J Cancer. 136:E359–E386. 2015.
View Article : Google Scholar : PubMed/NCBI
|
|
3
|
Yang X, Xiong Q, Wu Y, Li S and Ge F:
Quantitative proteomics reveals the regulatory networks of circular
RNA CDR1as in hepatocellular carcinoma cells. J Proteome Res.
16:3891–3902. 2017. View Article : Google Scholar : PubMed/NCBI
|
|
4
|
Shen C, Zhao CY, Zhang R and Qiao L:
Obesity-related hepatocellular carcinoma: Roles of risk factors
altered in obesity. Front Biosci. 17:2356–2370. 2012. View Article : Google Scholar : PubMed/NCBI
|
|
5
|
Chang CK, Chiang MH, Toh EK, Chang CF and
Huang TH: Molecular mechanism of oxidation-induced TDP-43 RRM1
aggregation and loss of function. FEBS Lett. 587:575–582. 2013.
View Article : Google Scholar : PubMed/NCBI
|
|
6
|
Kokoulina P and Rohn TT: Caspase-cleaved
transactivation response DNA-binding protein 43 in Parkinson's
disease and dementia with Lewy bodies. Neurodegener Dis. 7:243–250.
2010.PubMed/NCBI
|
|
7
|
Li Q, Yokoshi M, Okada H and Kawahara Y:
The cleavage pattern of TDP-43 determines its rate of clearance and
cytotoxicity. Nat Commun. 6:61832015. View Article : Google Scholar : PubMed/NCBI
|
|
8
|
Xiao S, Sanelli T, Chiang H, Sun Y,
Chakrabartty A, Keith J, Rogaeva E, Zinman L and Robertson J: Low
molecular weight species of TDP-43 generated by abnormal splicing
form inclusions in amyotrophic lateral sclerosis and result in
motor neuron death. Acta Neuropathol. 130:49–61. 2015. View Article : Google Scholar : PubMed/NCBI
|
|
9
|
Yamashita T, Hideyama T, Hachiga K,
Teramoto S, Takano J, Iwata N, Saido TC and Kwak S: A role for
calpain-dependent cleavage of TDP-43 in amyotrophic lateral
sclerosis pathology. Nat Commun. 3:13072012. View Article : Google Scholar : PubMed/NCBI
|
|
10
|
Michlewski G and Cáceres JF:
Post-transcriptional control of miRNA biogenesis. RNA. 25:1–16.
2019. View Article : Google Scholar : PubMed/NCBI
|
|
11
|
Zhu Y, Lu H, Huo Z, Ma Z, Dang J, Dang W,
Pan L, Chen J and Zhong H: MicroRNA-16 inhibits feto-maternal
angiogenesis and causes recurrent spontaneous abortion by targeting
vascular endothelial growth factor. Sci Rep. 6:355362016.
View Article : Google Scholar : PubMed/NCBI
|
|
12
|
Augello C, Vaira V, Caruso L, Destro A,
Maggioni M, Park YN, Montorsi M, Santambrogio R, Roncalli M and
Bosari S: MicroRNA profiling of hepatocarcinogenesis identifies
C19MC cluster as a novel prognostic biomarker in hepatocellular
carcinoma. Liver Int. 32:772–782. 2012. View Article : Google Scholar : PubMed/NCBI
|
|
13
|
Datta J, Kutay H, Nasser MW, Nuovo GJ,
Wang B, Majumder S, Liu CG, Volinia S, Croce CM, Schmittgen TD, et
al: Methylation mediated silencing of MicroRNA-1 gene and its role
in hepatocellular carcinogenesis. Cancer Res. 68:5049–5058. 2008.
View Article : Google Scholar : PubMed/NCBI
|
|
14
|
Kim WH, Min KT, Jeon YJ, Kwon CI, Ko KH,
Park PW, Hong SP, Rim KS, Kwon SW, Hwang SG, et al: Association
study of microRNA polymorphisms with hepatocellular carcinoma in
Korean population. Gene. 504:92–97. 2012. View Article : Google Scholar : PubMed/NCBI
|
|
15
|
Xu J, Zhu X, Wu L, Yang R, Yang Z, Wang Q
and Wu F: MicroRNA-122 suppresses cell proliferation and induces
cell apoptosis in hepatocellular carcinoma by directly targeting
Wnt/β-catenin pathway. Liver Int. 32:752–760. 2012. View Article : Google Scholar : PubMed/NCBI
|
|
16
|
Zhu S, Wu H, Wu F, Nie D, Sheng S and Mo
YY: MicroRNA-21 targets tumor suppressor genes in invasion and
metastasis. Cell Res. 18:350–359. 2008. View Article : Google Scholar : PubMed/NCBI
|
|
17
|
Chen QG, Zhou W, Han T, Du SQ, Li ZH,
Zhang Z, Shan GY and Kong CZ: MiR-345 suppresses proliferation,
migration and invasion by targeting Smad1 in human prostate cancer.
J Cancer Res Clin Oncol. 142:213–224. 2016. View Article : Google Scholar : PubMed/NCBI
|
|
18
|
Wang Z, Gerstein M and Snyder M: RNA-Seq:
A revolutionary tool for transcriptomics. Nat Rev Genet. 10:57–63.
2009. View Article : Google Scholar : PubMed/NCBI
|
|
19
|
Marguerat S and Bähler J: RNA-seq: From
technology to biology. Cell Mol Life Sci. 67:569–579. 2010.
View Article : Google Scholar : PubMed/NCBI
|
|
20
|
Voelkerding KV, Dames SA and Durtschi JD:
Next-generation sequencing: From basic research to diagnostics.
Clin Chem. 55:641–658. 2009. View Article : Google Scholar : PubMed/NCBI
|
|
21
|
Chrystoja CC and Diamandis EP: Whole
genome sequencing as a diagnostic test: Challenges and
opportunities. Clin Chem. 60:724–733. 2014. View Article : Google Scholar : PubMed/NCBI
|
|
22
|
Kanehisa M, Sato Y, Kawashima M, Furumichi
M and Tanabe M: KEGG as a reference resource for gene and protein
annotation. Nucleic Acids Res. 44:D457–D462. 2016. View Article : Google Scholar : PubMed/NCBI
|
|
23
|
Kanehisa M, Goto S, Furumichi M, Tanabe M
and Hirakawa M: KEGG for representation and analysis of molecular
networks involving diseases and drugs. Nucleic Acids Res. 38 (Suppl
1):D355–D360. 2010. View Article : Google Scholar : PubMed/NCBI
|
|
24
|
O'Leary NA, Wright MW, Brister JR, Ciufo
S, Haddad D, McVeigh R, Rajput B, Robbertse B, Smith-White B,
Ako-Adjei D, et al: Reference sequence (RefSeq) database at NCBI:
Current status, taxonomic expansion, and functional annotation.
Nucleic Acids Res. 44:D733–D745. 2016. View Article : Google Scholar
|
|
25
|
Burgos KL, Javaherian A, Bomprezzi R,
Ghaffari L, Rhodes S, Courtright A, Tembe W, Kim S, Metpally R and
Van Keuren-Jensen K: Identification of extracellular miRNA in human
cerebrospinal fluid by next-generation sequencing. RNA. 19:712–722.
2013. View Article : Google Scholar : PubMed/NCBI
|
|
26
|
Lee EC, Elhassan SA, Lim GPL, Kok WH, Tan
SW, Leong EN, Tan SH, Chan EW, Bhattamisra SK, Rajendran R, et al:
The roles of circular RNAs in human development and diseases.
Biomed Pharmacother. 111:198–208. 2019. View Article : Google Scholar : PubMed/NCBI
|
|
27
|
Zhong Z, Lv M and Chen J: Screening
differential circular RNA expression profiles reveals the
regulatory role of circTCF25-miR-103a-3p/miR-107-CDK6 pathway in
bladder carcinoma. Sci Rep. 6:309192016. View Article : Google Scholar : PubMed/NCBI
|
|
28
|
Han D, Li J, Wang H, Su X, Hou J, Gu Y,
Qian C, Lin Y, Liu X, Huang M, et al: Circular RNA circMTO1 acts as
the sponge of microRNA-9 to suppress hepatocellular carcinoma
progression. Hepatology. 66:1151–1164. 2017. View Article : Google Scholar : PubMed/NCBI
|
|
29
|
Livak KJ and Schmittgen TD: Analysis of
relative gene expression data using real-time quantitative PCR and
the 2(-Delta Delta C(T)) method. Methods. 25:402–408. 2001.
View Article : Google Scholar : PubMed/NCBI
|
|
30
|
Mortazavi A, Williams BA, McCue K,
Schaeffer L and Wold B: Mapping and quantifying mammalian
transcriptomes by RNA-Seq. Nat Methods. 5:621–628. 2008. View Article : Google Scholar : PubMed/NCBI
|
|
31
|
Audic S and Claverie JM: The significance
of digital gene expression profiles. Genome Res. 7:986–995. 1997.
View Article : Google Scholar : PubMed/NCBI
|
|
32
|
Ashburner M, Ball CA, Blake JA, Botstein
D, Butler H, Cherry JM, Davis AP, Dolinski K, Dwight SS, Eppig JT,
et al The Gene Ontology Consortium, : Gene ontology: Tool for the
unification of biology. Nat Genet. 25:25–29. 2000. View Article : Google Scholar : PubMed/NCBI
|
|
33
|
The Gene Ontology Consortium, . The Gene
Ontology Resource: 20 years and still GOing strong. Nucleic Acids
Res. 47:D330–D338. 2019. View Article : Google Scholar : PubMed/NCBI
|
|
34
|
Kanehisa M: Post-genome Informatics.
Oxford University Press; Oxford: pp. 1482000
|
|
35
|
Robinson MD, McCarthy DJ and Smyth GK:
edgeR: A Bioconductor package for differential expression analysis
of digital gene expression data. Bioinformatics. 26:139–140. 2010.
View Article : Google Scholar : PubMed/NCBI
|
|
36
|
Shankar J, Messenberg A, Chan J, Underhill
TM, Foster LJ and Nabi IR: Pseudopodial actin dynamics control
epithelial-mesenchymal transition in metastatic cancer cells.
Cancer Res. 70:3780–3790. 2010. View Article : Google Scholar : PubMed/NCBI
|
|
37
|
Hu J, Li P, Song Y, Ge YX, Meng XM, Huang
C, Li J and Xu T: Progress and prospects of circular RNAs in
Hepatocellular carcinoma: Novel insights into their function. J
Cell Physiol. 233:4408–4422. 2018. View Article : Google Scholar : PubMed/NCBI
|
|
38
|
Guo W, Zhang J, Zhang D, Cao S, Li G,
Zhang S, Wang Z, Wen P, Yang H, Shi X, et al: Polymorphisms and
expression pattern of circular RNA circ-ITCH contributes to the
carcinogenesis of hepatocellular carcinoma. Oncotarget.
8:48169–48177. 2017. View Article : Google Scholar : PubMed/NCBI
|
|
39
|
Liu C, Liu R, Zhang D, Deng Q, Liu B, Chao
HP, Rycaj K, Takata Y, Lin K, Lu Y, et al: MicroRNA-141 suppresses
prostate cancer stem cells and metastasis by targeting a cohort of
pro-metastasis genes. Nat Commun. 8:142702017. View Article : Google Scholar : PubMed/NCBI
|
|
40
|
Liu YH, Jin JL, Wang YZ, Tan Y, Zhou YY,
Peng T, Li F, Liang WD, Chartrand P, Jiang YY, et al:
Protrusion-localized STAT3 mRNA promotes metastasis of highly
metastatic hepatocellular carcinoma cells in vitro. Acta Pharmacol
Sin. 37:805–813. 2016. View Article : Google Scholar : PubMed/NCBI
|
|
41
|
Guy JB, Espenel S, Vallard A,
Battiston-Montagne P, Wozny AS, Ardail D, Alphonse G, Rancoule C,
Rodriguez-Lafrasse C and Magne N: Evaluation of the cell invasion
and migration process: A comparison of the video microscope-based
scratch wound assay and the boyden chamber assay. J Vis Exp. Nov
17–2017.doi: 10.3791/56337. View
Article : Google Scholar : PubMed/NCBI
|
|
42
|
Chen HC: Boyden chamber assay. Methods Mol
Biol. 294:15–22. 2005.PubMed/NCBI
|
|
43
|
Fusco D, Accornero N, Lavoie B, Shenoy SM,
Blanchard JM, Singer RH and Bertrand E: Single mRNA molecules
demonstrate probabilistic movement in living mammalian cells. Curr
Biol. 13:161–167. 2003. View Article : Google Scholar : PubMed/NCBI
|
|
44
|
Zhu YP, Bian XJ, Ye DW, Yao XD, Zhang SL,
Dai B, Zhang HL and Shen YJ: Long noncoding RNA expression
signatures of bladder cancer revealed by microarray. Oncol Lett.
7:1197–1202. 2014. View Article : Google Scholar : PubMed/NCBI
|
|
45
|
Rehrauer H, Opitz L, Tan G, Sieverling L
and Schlapbach R: Blind spots of quantitative RNA-seq: The limits
for assessing abundance, differential expression, and isoform
switching. BMC Bioinformatics. 14:3702013. View Article : Google Scholar : PubMed/NCBI
|
|
46
|
Ashwal-Fluss R, Meyer M, Pamudurti NR,
Ivanov A, Bartok O, Hanan M, Evantal N, Memczak S, Rajewsky N and
Kadener S: circRNA biogenesis competes with pre-mRNA splicing. Mol
Cell. 56:55–66. 2014. View Article : Google Scholar : PubMed/NCBI
|
|
47
|
Cheng J, Metge F and Dieterich C: Specific
identification and quantification of circular RNAs from sequencing
data. Bioinformatics. 32:1094–1096. 2016. View Article : Google Scholar : PubMed/NCBI
|
|
48
|
Enright AJ, John B, Gaul U, Tuschl T,
Sander C and Marks DS: MicroRNA targets in Drosophila.
Genome Biol. 5:R12003. View Article : Google Scholar : PubMed/NCBI
|
|
49
|
Li F, Zhang L, Li W, Deng J, Zheng J, An
M, Lu J and Zhou Y: Circular RNA ITCH has inhibitory effect on ESCC
by suppressing the Wnt/β-catenin pathway. Oncotarget. 6:6001–6013.
2015. View Article : Google Scholar : PubMed/NCBI
|
|
50
|
Yang C, Yuan W, Yang X, Li P, Wang J, Han
J, Tao J, Li P, Yang H, Lv Q, et al: Circular RNA circ-ITCH
inhibits bladder cancer progression by sponging miR-17/miR-224 and
regulating p21, PTEN expression. Mol Cancer. 17:192018. View Article : Google Scholar : PubMed/NCBI
|
|
51
|
Zhang X, Hu S, Zhang X, Wang L, Zhang X,
Yan B, Zhao J, Yang A and Zhang R: MicroRNA-7 arrests cell cycle in
G1 phase by directly targeting CCNE1 in human hepatocellular
carcinoma cells. Biochem Biophys Res Commun. 443:1078–1084. 2014.
View Article : Google Scholar : PubMed/NCBI
|
|
52
|
Fang Y, Xue JL, Shen Q, Chen J and Tian L:
MicroRNA-7 inhibits tumor growth and metastasis by targeting the
phosphoinositide 3-kinase/Akt pathway in hepatocellular carcinoma.
Hepatology. 55:1852–1862. 2012. View Article : Google Scholar : PubMed/NCBI
|
|
53
|
Giles KM, Brown RA, Ganda C, Podgorny MJ,
Candy PA, Wintle LC, Richardson KL, Kalinowski FC, Stuart LM, Epis
MR, et al: microRNA-7-5p inhibits melanoma cell proliferation and
metastasis by suppressing RelA/NF-κB. Oncotarget. 7:31663–31680.
2016. View Article : Google Scholar : PubMed/NCBI
|
|
54
|
Shi Y, Luo X, Li P, Tan J, Wang X, Xiang T
and Ren G: miR-7-5p suppresses cell proliferation and induces
apoptosis of breast cancer cells mainly by targeting REGγ. Cancer
Lett. 358:27–36. 2015. View Article : Google Scholar : PubMed/NCBI
|
|
55
|
Guo F, Wang H, Jiang M, Yang Q, Xiang Q,
Zhou H, Hu X, Hao K, Yang J, Cao H, et al: TDP-43 induces EMT and
promotes hepatocellular carcinoma metastasis via activating
Wnt/β-catenin signaling pathway. Am J Cancer Res. 10:3285–3301.
2020.PubMed/NCBI
|