Introduction
As the predominant malignant tumor with high
incidence worldwide, lung cancer has been reported to be primarily
responsible for cancer-related deaths (1). With the improvement of living standards
and health awareness of the public, detection and diagnosis
techniques of lung cancer have improved in recent years (2). However, the incidence of lung cancer is
still rising in both men and women around the world (3). Treatment approaches of lung cancer are
constantly improving, however its long-term survival rate has not
significantly improved, due to failure of early detection, early
treatment and its complexity in pathogenesis (3,4). In
addition, non-small cell lung cancer (NSCLC) accounting for ~80-85%
of the total incidence of lung cancer, is primarily diagnosed at an
advanced stage with a quite low 5-year survival rate (5,6). Hence,
it is necessary to explore the pathogenesis of NSCLC and potential
molecular mechanism related to early diagnosis and treatment of
this type of cancer. Chemotherapy is an important treatment for
local advanced NSCLC (7). Although
tumor tissues may shrink or even disappear after chemotherapy, some
patients will experience local recurrence or even distant
metastasis (8).
In general, the recurrence and metastasis of a tumor
is a process involving multiple factors, genes and stages (9). For example, in the process of
recurrence and metastasis, cells from the primary tumor proliferate
in a large amounts, forming new blood vessels and growing rapidly
(10). In addition, tumor cells
disseminate from the primary site, invade and penetrate the
basement membrane, and then invade blood vessels, the lymphatic
system or body cavities (11).
Furthermore, tumor cells adhere to the capillary wall of the target
organ, pass through blood vessels and form a small metastatic mass,
which in turn proliferates and produces new blood vessels, forming
a secondary tumor of the same type as the primary tumor, resulting
in another tumor cell invasion and metastasis (12,13).
Tumor recurrence and metastasis enhance the invasion and
proliferation of tumor cells (14).
Nevertheless, in clinical practice, although clinical stage, tissue
type and differentiation degree, invasion depth and lymph node
metastasis can partly predict the recurrence and metastasis of
patients after treatment (15,16),
there remains a shortage of systematic research concerning specific
mechanisms of local recurrence and progression of lung cancer after
chemotherapy.
In recent years, the molecular diagnosis and
targeted treatment of lung cancer provide a new direction for its
comprehensive prevention and treatment. Correlation of the
expression of special genes with tumor stages and the prognosis of
patients has gradually become a major direction of lung cancer
research (17). Prior evidence
supports that one of the important reasons for the resistance of
tumor cells to chemotherapy relates to the abnormal activation or
inhibition of intracellular signal transduction pathways (18). For instance, the PI3K/Akt/mTOR
signaling pathway has been revealed to be commonly upregulated in
multiple cancer cells (19,20). The pathway is regulated by tyrosine
kinase receptors, such as epidermal growth factor receptor 1–2 and
insulin-like growth factor 1, which are indispensable for
maintaining tumor cell proliferation, forming independent clones
and distant invasion (21,22). Furthermore, PI3K/Akt/mTOR activation
can upregulate the expression of P-glycoprotein, multidrug
resistance protein 1 and other drug-resistant proteins, in order to
cause resistance to various chemotherapy drugs (23). In addition, the BRAF gene belonging
to the RAF gene family, mediates the integration of RAS and MAPK,
which have been recognized to regulate cell proliferation,
differentiation and apoptosis, and whose mutation and high
expression have been reported to be associated with lung cancer
(24). However, systematic research
is required with respect to the involvement of the BRAF gene and
the PI3K/Akt/mTOR signaling pathway in the recurrence and
metastasis of lung cancer after chemotherapy, and the specific
mechanism of aberrant expression of this pathway as it affects
chemotherapy resistance.
Therefore, to explore the possible mechanism of
local recurrence and chemosensitivity after chemotherapy for lung
cancer, the present study used NSCLC cell lines to explore the
biological characteristics of lung cancer cells after chemotherapy,
the change of the PI3K/Akt/mTOR pathway by BRAF gene silencing and
the chemosensitivity, preliminarily. In addition, our study
explored the mechanism involved in improving the chemotherapeutic
effect by inhibiting the PI3K/Akt/mTOR pathway.
Materials and methods
Experimental cells and grouping
The present study used a cisplatin-resistant NSCLC
(A549/DDP) cell line, purchased from the Cell Center of the Chinese
Academy of Medical Sciences, which was cultured in a 5%
CO2 cell incubator at 37°C. Prior to cell transfection,
A549/DDP cells were cultured in a culture medium containing 1 µg/ml
cisplatin in a routine incubator with saturated humidity and 5%
CO2 at 37°C. NSCLC cells were designed and divided into
a control group (no cell transfection), a negative control (NC)
group [transfected with the small interfering (si)RNA NC sequence],
a siBRAF group (transfected with a siBRAF plasmid), an NVP-BEZ235
group (a PI3K/Akt/mTOR signaling pathway inhibitor; dual inhibitor
of both PI3K and mTOR), a siBRAF + NVP-BEZ235 group (transfected
with a siBRAF plasmid combined with the proposed pathway
inhibitor), and a siBRAF + IGF-1 group (transfected with a siBRAF
plasmid combined with treatment of PI3K/Akt/mTOR signaling pathway
agonist, PI3K agonist). The BRAF siRNA sequences for knockdown of
BRAF were as follows: Sense, 5′-AGAAUUGGAUCUGGAUCAU-3′ and
antisense; 5′-AUGAUCCAGAUCCAAUUCU; and the NC siRNA was: Sense,
5′-UUCUCCGAACGUGUCACGUTT-3′ and antisense,
5′-TTAAGAGGCUUGCACAGUGCA-3′. When A549/DDP cells grew to the
logarithmic growth phase, the cells were digested with 0.25%
trypsin, and the cells were re-suspended with M199 medium
supplemented with 10% fetal bovine serum (Thermo Fisher Scientific,
Inc.) at an adjusted density of 11×105 cells/ml, and
then inoculated into a 6-well culture plate. When the cells grew to
70% confluence, the serum-free M199 medium was replaced and
transfection was performed following culture for 24 h. An amount of
200 µl serum-free Opti-MEM culture medium (Gibco; Thermo Fisher
Scientific, Inc.) was added to dilute 5 µl Lipofectamine 2000
(Invitrogen; Thermo Fisher Scientific, Inc.). Subsequently, 100 µl
serum-free Opti-MEM culture medium was collected to dilute 100 pmol
siRNA or NC siRNA which was to be transfected, followed by separate
mixing and reaction at room temperature quietly for 10 min. Then
the two solutions were mixed well and incubated at room temperature
for 20 min. The original medium was discarded from the 6-well
plate, and Opti-MEM medium was added to the transfection complex in
the corresponding cell culture wells. Then, the aforementioned
medium was cultured in an incubator with 5% CO2 at 37°C
for 18 h, and the prepared cells were collected after 48 h of
transfection after replacement of new complete medium. As for cell
treatment, prior to following the tests, cells were treated by
cisplatin (Shanghai Baoman Biotechnology Co., Ltd.) at different
concentrations (0.5, 1 and 3 µl) before grouping for 24 h.
MTT colorimetric assay
MTT colorimetric method was used for determination
of cell survival after 20 µl of cisplatin treatment for 30 h of
continuous culture. After transfection, A549/DDP cells at the
logarithmic growth phase were digested with 0.25% trypsin to
prepare a cell suspension. The cell concentration was adjusted to
2–5×10⁴ cells/ml and cells were seeded into a 96-well
culture plate. Then, 100 µl of cell suspension was supplemented per
well (the final concentration was 5×10⁴ cells/well) for
culture in a 5% CO2 cell incubator at 37°C for 48 h.
After the cells adhered to the wall for 2 h, the original culture
medium was aspirated and discarded. Then, 20 µl (5 mg/µl) of MTT
solution was added to each well 4 h before the termination of the
culture, followed by continuous incubation in the 5% CO2
cell incubator at 37°C for 4 h. The culture solution of each well
was aspirated, followed by the addition of 150 µl 10% DMSO into
each well, and shaking with a shaker for 10 min in order to
dissolve the crystal precipitate. Subsequently, the absorbance (OD)
of each well was measured with an MTT enzyme-linked immunometric
meter (Shanghai Precision Instrument Co., Ltd.) at a wavelength of
490 nm. The cell survival rate was calculated as follows: Cell
survival rate = (OD of the control group - OD of the experimental
group/OD of the control group) ×100%. The results were expressed by
the mean values of the OD of three replicates.
Wound healing assay
After 48 h of transfection, cells at the logarithmic
growth phase in each group were obtained for inoculation in a 35-mm
dish at a cell density of 5×10⁴ cells/ml. After the cell
confluence was synthesized into a single layer, a 1-mm wide scratch
was carefully made (across the well; with at least 5 lines in each
well) in the center of the monolayer cells at the bottom of the
culture dish with a sterilized 10-µl pipette tip, followed by
washing 3 times with PBS after discarding the culture medium to
wash off the floating cells and serum. Images of the cells were
captured under an inverted fluorescence microscope (×200
magnification; Olympus Corporation). Then, further routine culture
was carried out by changing to a fresh serum-free DMEM culture
medium for 24 h of incubation. Subsequently, PBS was used to wash
the floating cells and cell migration of the experimental group was
observed using inverted fluorescence microscope (×200
magnification; Olympus Corporation). The control group consisted of
the non-transfected cells. After 24 h of culture, ImageJ software
(v1.48; National Institutes of Health) was used to measure the area
of the wound to obtain the mean migration distance, with 5 repeats
for each well to measure the average and three replicates for each
group. The migration rate was calculated according to the formula:
Mean migration distance of the experimental group/mean migration
distance of the control group ×100%.
Flow cytometry using PI staining
Cells after 48 h of transfection were washed 3 times
with cold PBS, centrifuged (~1,100 × g for 5 min at room
temperature) to discard the supernatant, and then re-suspended with
PBS to prepare a cell suspension. The cell concentration was
adjusted to ~1×10⁷ cells/ml, followed by the addition of
2 ml of 75% ethanol pre-cooled at −20°C to fix the cells, shaking
and mixing well, sealing with a sealing film, and fixation at 4°C
for over 12 h. Before detection on the flow cytometer, the
supernatant was washed twice with PBS, and 200 µl cell suspension
was added to RNase A to culture in the dark. After 30 min in a
water bath at 37°C, the RNA was digested and removed, and then 1.5
ml of staining solution containing propidium iodide (PI;
Sigma-Aldrich; Merck KGaA) was added to the supernatant for 30 min
at 4°C. The sample was filtered using a 300-mesh nylon mesh, and
mixed well before flow cytometry (Gallios; Beckman Coulter, Inc.).
The cell cycle was determined according to the DNA content labeled
by PI.
TUNEL detection
After 48 h of transfection, the cells were
inoculated in a plate/dish that contained DMEM medium and cultured
at 37°C for 24 h, followed by the adjustment of cell density at
5×10⁶ cells/ml. Then, the cells were fixed at room
temperature for 10 min with 4% neutral formaldehyde, and 100 µl
cell suspension was dripped on the slide, dried, and washed twice
with PBS (5 min each time). Subsequently, PBS containing 2%
H2O2 was added, and reacted at room
temperature for 5 min, followed by PBS washing two times (5 min
each time). Excess liquid was removed by filter paper. The reaction
solution was prepared with the addition of 5 µl TdT enzyme reaction
solution (Amyjet Scientific, Inc.), 45 µl fluorescence-labeled
solution (Beyotime Biotechnology) and 50 µl TUNEL (Beyotime
Biotechnology), in a total volume of 100 µl. The solution was
prepared when it was required for use to avoid cryopreservation.
When the solution was prepared, it was added to culture cells at a
constant temperature of 37°C in the dark for 60 min. A negative
staining control was set with the addition of TdT enzyme-free
reaction solution, with other processing steps and conditions
similar to those aforementioned. Then, PBS washing was repeated
twice (5 min each time). Subsequently, the cells were re-stained
with the addition of DAPI at room temperature for 5 min, followed
by another three washes with PBS (5 min each time) and the reaction
was terminated by adding a drop of anti-fade mounting medium on the
sample. For the determination of the results it was observed that
the apoptotic cell nucleus was varying degrees of brown, the
nuclear membrane and cell membrane were intact, and the
non-apoptotic cells were stained blue. The number of cells was
counted under a light microscope (magnification, ×400; Shanghai
Dianying Optical Instrument Co., Ltd), and 5 visual fields were
randomly selected for each slide that was processed as described in
the aforementioned steps. Apoptosis was observed under the light
microscope, and the percentage of apoptotic cells was calculated
based on the formula: Apoptosis rate (%) = (number of apoptotic
cells/total cells) ×100%.
Flow cytometry using Annexin V-PI
staining
After 48 h of transfection, the cells were collected
and the cell culture medium was removed. At room temperature, the
cells were washed twice with PBS, trypsin was added into the
culture plate for 24 min, and 2 ml of culture medium without
penicillin-streptomycin and serum was added to terminate digestion.
The digested cells were aspirated from a 6-well plate into a 10-ml
centrifuge tube for centrifugation at ~1,100 × g for 6 min. The
supernatant was discarded and 1 ml of pre-cooled PBS was added to
prepare the cell suspension. Following another centrifugation and
preparation of the cell suspension, samples were centrifuged at
~1,100 × g for 6 min. After discarding the supernatant, 100 µl 1X
Binding buffer was added to suspend the cells. With the addition of
10 µl Annexin V and PI subsequently in 100 µl cell suspension,
cells were incubated at room temperature in the dark for 15 min,
followed by another addition of 100 µl pre-cooled 1X binding
buffer. The apoptotic rate was quantitatively analyzed by
FACSCalibur flow cytometer with apoptosis software Cellquest Pro
(both from BD Biosciences).
Colony formation assay
After transfection, cells in the logarithmic phase
were obtained from each group, followed by digestion and dispersion
of the cell suspension with trypsin, and the cell density was
adjusted to 500 cells/ml. Then, 1 ml of culture medium and 1 ml of
diluted cell suspension were added into the 6-well culture plate,
respectively, followed by the addition and treatment with cisplatin
at different concentrations of 0.5, 1.0 and 3.0 µl/ml, with three
replicates in each group. Subsequently, the mixture in the wells
was cultured in an incubator of 5% CO2 at 37°C. Then,
the culture medium was replaced every 3 days, and discarded 14 days
later. After washing 3 times with PBS, the cells were fixed with 4%
formaldehyde at 37°C for 15 min, followed by 0.1% crystal violet
staining at 37°C for 15 min. In the next step, the number of
colonies with >50 cells was counted under an inverted
fluorescence microscope (×200 magnification; Olympus Corporation),
and finally the colony formation rate was obtained in accordance
with the following formula: Colony forming rate (%) = number of
colonies/total number of cultured cells ×100%.
Reverse transcription-quantitative
(RT-q)PCR
After transfection, the cells of each group in
logarithmic phase were digested by trypsin, and the cell density
was adjusted to 1×10⁷ cells/ml. The cell suspension was
obtained and centrifuged at ~1,100 × g for 5 min at room
temperature to collect the cell precipitation. TRIzol (Invitrogen;
Thermo Fisher Scientific, Inc.) was used to extract total RNA of
each group of cells cultured for 24 h after transfection. The
absorbance values at wavelengths of 260 and 280 nm of the total RNA
were measured by Nano-Drop ND-1000 spectrophotometry, and the
OD260/OD280 ratio was calculated to verify
the purity and meet the requirement (ratio >1.80). Concurrently,
the RNA integrity was measured by 1% agarose gel electrophoresis.
The bands at 28, 18 and 5 sec were clearly displayed under
ultraviolet light, indicating that RNA was not degraded. According
to the protocol of the related experimental kit, a reverse
transcription reaction was carried out on a PCR amplification
apparatus to synthesize the cDNA template. The primers were all
synthesized by Beijing Genetics Institute Co., Ltd. The reverse
transcription system was 20 µl, which was carried out according to
the instructions of EasyScript First-Strand cDNA Synthesis SuperMix
(Invitrogen; Thermo Fisher Scientific, Inc.). Real-time
fluorescence quantitative PCR was used to calculate the volume
ratio of the amplification product of the target gene to the
internal reference gene for the measurement of the relative
expression of the target gene, with β-actin as the internal
reference. According to the instructions of the SYBR®
Premix Ex Taq™ II kit (Takara Bio, Inc.), fluorescence quantitative
PCR was carried out. The reaction system was 25 µl, including 10X
PCR buffer, 1 µl cDNA template, 1.7 µl 25 mM MgCl2, 0.5
µl of upstream and downstream primers of the target gene, 1 unit of
Taq DNA polymerase, 10 mM dNTPs, and sterilized deionized water to
supplement the volume. The real-time quantitative PCR experiment
was carried out using 7500 Real-Time PCR system from ABI (Thermo
Fisher Scientific, Inc.). The reaction conditions were as follows:
Pre-denaturation at 95°C for 5 min, denaturation at 95°C for 30
sec, annealing at 58°C for 30 sec (the aforementioned steps were
repeated for 35 cycles under the described conditions), extension
at 72°C for 1 min, and finally extension at 72°C for 10 min. The
gene expression levels of BRAF (upstream,
5′-TCATAATGCTTGCTCTGATAGGA-3′ and downstream,
5′-GGCCAAAAATTTAATCAGTGGA-3′); PTEN (upstream,
5′-ACCAGGACCAGAGGAAACCT-3′ and downstream,
5′-GCTAGCCTCTGGATTTGACG-3′); PI3K (upstream,
5′-ATGCCAGAAAGGAGAATG-3′ and downstream, 5′-TGTTGGACTCAGCAATAC-3′);
and mTOR (upstream, 5′-GGATGGCAACTACAGAATCACA-3′ and downstream,
5′-TCACACCCATGACGAACAT-3′); were then detected with GAPDH
(upstream, 5′-ATCACTGCCACCCAGAAG-3′ and downstream,
5′-TCCACGACGGACACATTG-3′) as the reference gene. The
2−ΔΔCq method (25) was
used for quantitative analysis, with the following formula: ΔΔCq =
ΔCq experimental group - ΔCq Control
group.
Western blotting
RIPA lysis buffer (Beyotime Biotechnology) was used
to lyse protein. A549/DDP cells were collected and cultured for 24
h after centrifugation at 450 × g at 4°C for 5 min, washed with PBS
and re-suspended. The supernatant was collected after another
centrifugation and added to the lysate mixture according to the
ratio of 1 ml per 107 cells. After an ice bath at 4°C
for 5 min, the supernatant was centrifuged at ~13,400 × g at 4°C
for 15 min. The supernatant was then transferred to another
centrifuge tube and stored at −80°C (i.e. total protein of cells).
Bicinchoninic acid (BCA) working solution was prepared according to
the ratio of sample:BCA working solution (1:8), the protein
standard was diluted, followed by the addition of 20 µl of diluted
protein sample into the 96-well plate standard well, with 200 µl of
BCA working solution into each well, and then the sample protein
concentration was calculated by measuring the absorbance value at a
wavelength of 562 nm with a microplate reader. Subsequently, 30 µg
of total cell protein was separated by 10% SDS-PAGE, which was
stopped when bromophenol blue was close to 1 cm from the rubber
bottom and then, it was transferred to a PVDF membrane using a wet
method, with 5% skimmed milk powder used to seal for 1 h on the
shaker, followed by washing 3 times with TBST (5 min/time). Then,
the primary antibodies of BRAF (product code ab33899; 1:5,000),
PTEN (product code ab267787; 1:1,000), PI3K (product code ab32089;
1:1,000), phosphorylated (p)-PI3K (product code ab278545; 1:1,000),
mTOR (product code ab32028; 1:2,000), p-mTOR (product code
ab109268; 1:5,000), cisplatin resistance-related enzymes ERCC1
(product code ab129267; 1:2,000) and BRCA1 (ab191042; 1:1,000), Bax
(product code ab32503; 1:2,000), Bcl-2 (ab32124; 1:1,000) and GAPDH
(product code ab8245; 1:10,000; all from Abcam) were added and
incubated overnight at 4°C, followed by washing with TBST (three
times, 5 min each time). Subsequently, the secondary antibody,
HRP-labeled goat anti-rabbit IgG antibody (product code ab190495;
1:1,000; Abcam) was added and incubated by shaking at room
temperature for 2 h, followed by another three washes with TBST (5
min/each time). The reference gene was GAPDH. Finally, the
sensitized electrogenerated chemiluminescence (ECL; Amersham;
Cytiva) was used for development. The optical density values of the
target protein bands and internal reference were measured by ImageJ
image analysis software (v1.48), with the corresponding ratio
reflecting the relative expression of the target protein.
Statistical analysis
SPSS 21.0 software package (IBM Corp.) was used to
analyze the data and calculate the mean value ± standard deviation
(SD). All experiments were repeated at least three times. Following
the identification of the normal distribution (Kolmogorov-Smirnov
test) and homogeneous nature (Homogeneity of variance test) of the
data, t-tests were used for data analysis between groups; one-way
analysis of variance (ANOVA) was used for multiple data analysis.
Tukey's post hoc test was performed to obtain P-values and
adequately assess differences to determine significance following
one-way ANOVA. P<0.05 was considered to indicate a statistically
significant difference.
Results
Comparison of cell viability in each
group after transfection
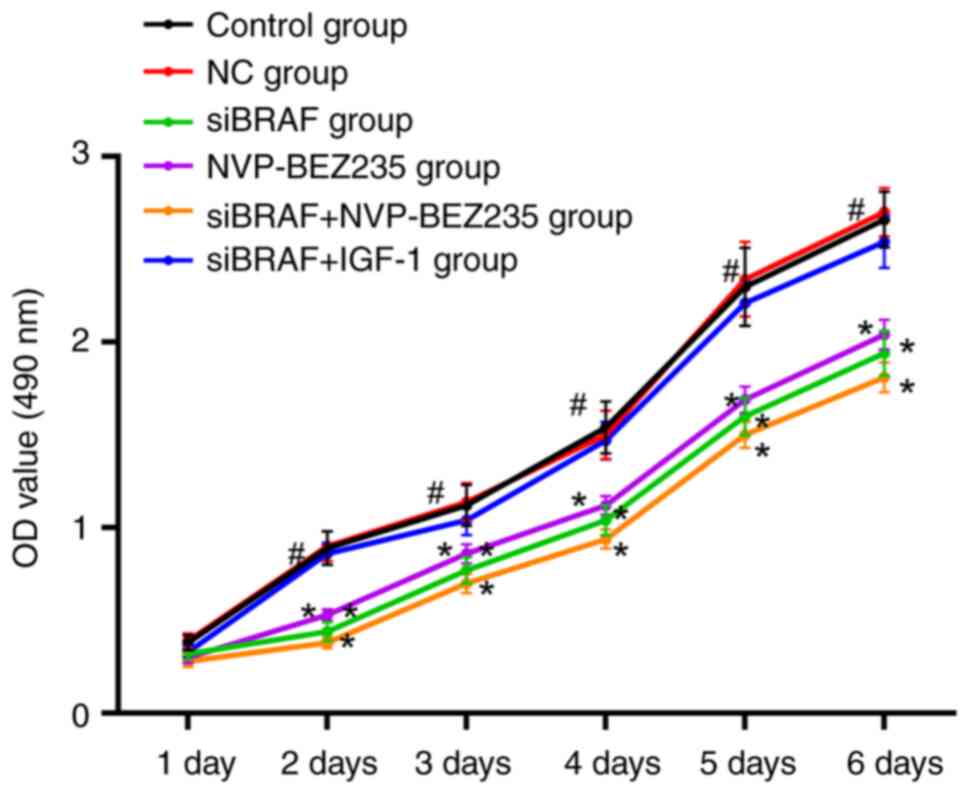
There was no difference in cell viability between
the control group and NC group at day 1 (P>0.05). Compared with
the NC group, no obvious change was revealed in cell activity in
each group at day 1, without the estimation of obvious statistical
differences (all P>0.05); at 2–6 days, cell viability of the
siBRAF group, NVP-BEZ235 group and siBRAF + NVP-BEZ235 group was
significantly decreased (all P<0.05); while no obvious
difference was found with the siBRAF + IGF-1 group (all P>0.05).
In addition, there was no significant difference in cell viability
between the siBRAF group and NVP-BEZ235 group at 2–6 days (all
P>0.05); while the cell viability of cancer cells in the siBRAF
+ IGF-1 group was significantly increased compared with siBRAF +
NVP-BEZ235 group (all P<0.05) (Fig.
1).
Comparison of cell migration in each
group after transfection
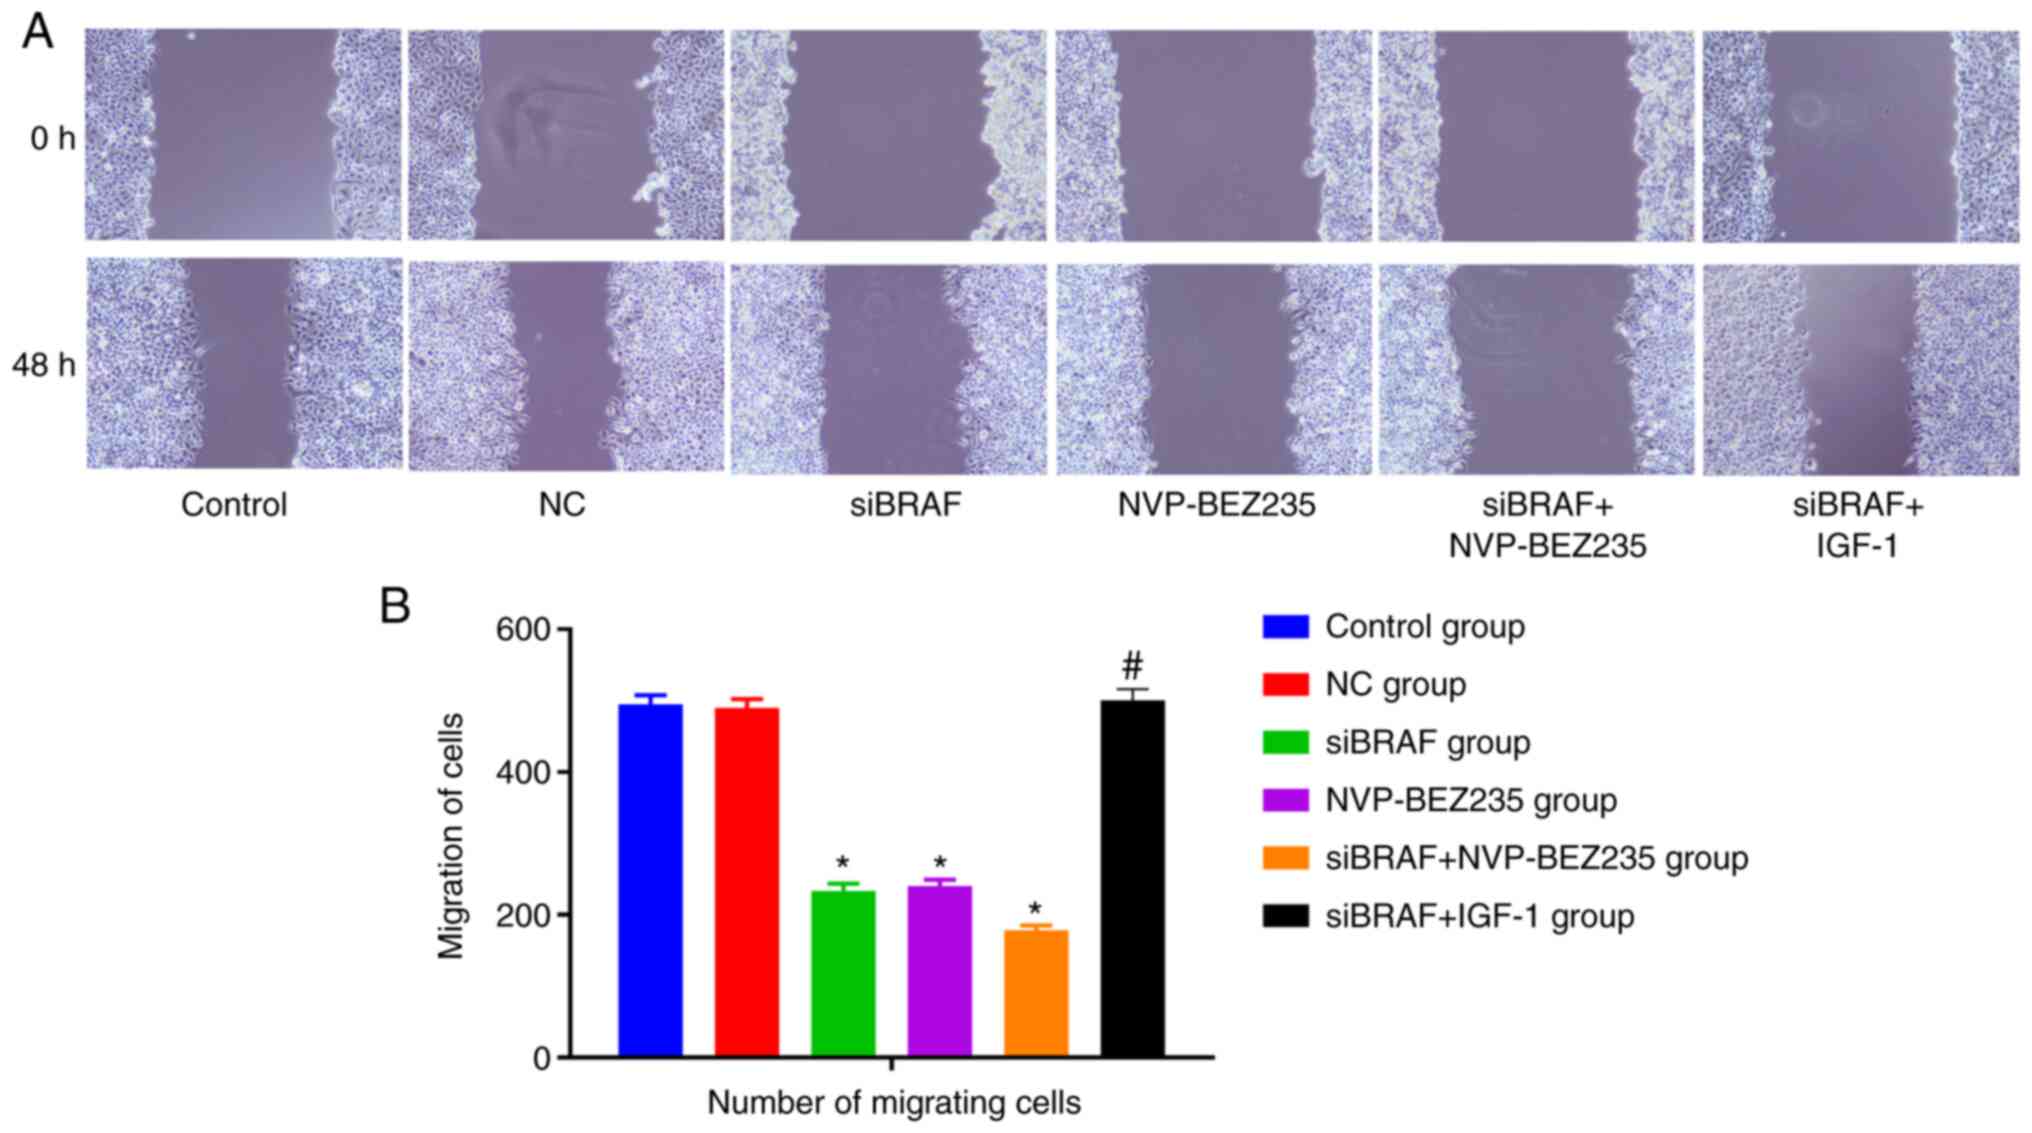
Compared with the control group, no significant
change was detected in migration ability in the NC group,
exhibiting no statistical difference (P>0.05). The migration
ability of cancer cells was significantly decreased in the siBRAF
group, NVP-BEZ235 group and siBRAF + NVP-BEZ235 group when compared
with the NC group (all P<0.05); while it was evidently increased
in the siBRAF + IGF-1 group when compared with the siBRAF +
NVP-BEZ235 group, with a statistical difference (P<0.05), yet no
difference was found when compared with that in the NC group
(P>0.05). There was no significant difference in cell migration
between the siBRAF group and NVP-BEZ235 group (P>0.05) (Fig. 2).
Comparison of cell cycle phases in
each group after transfection
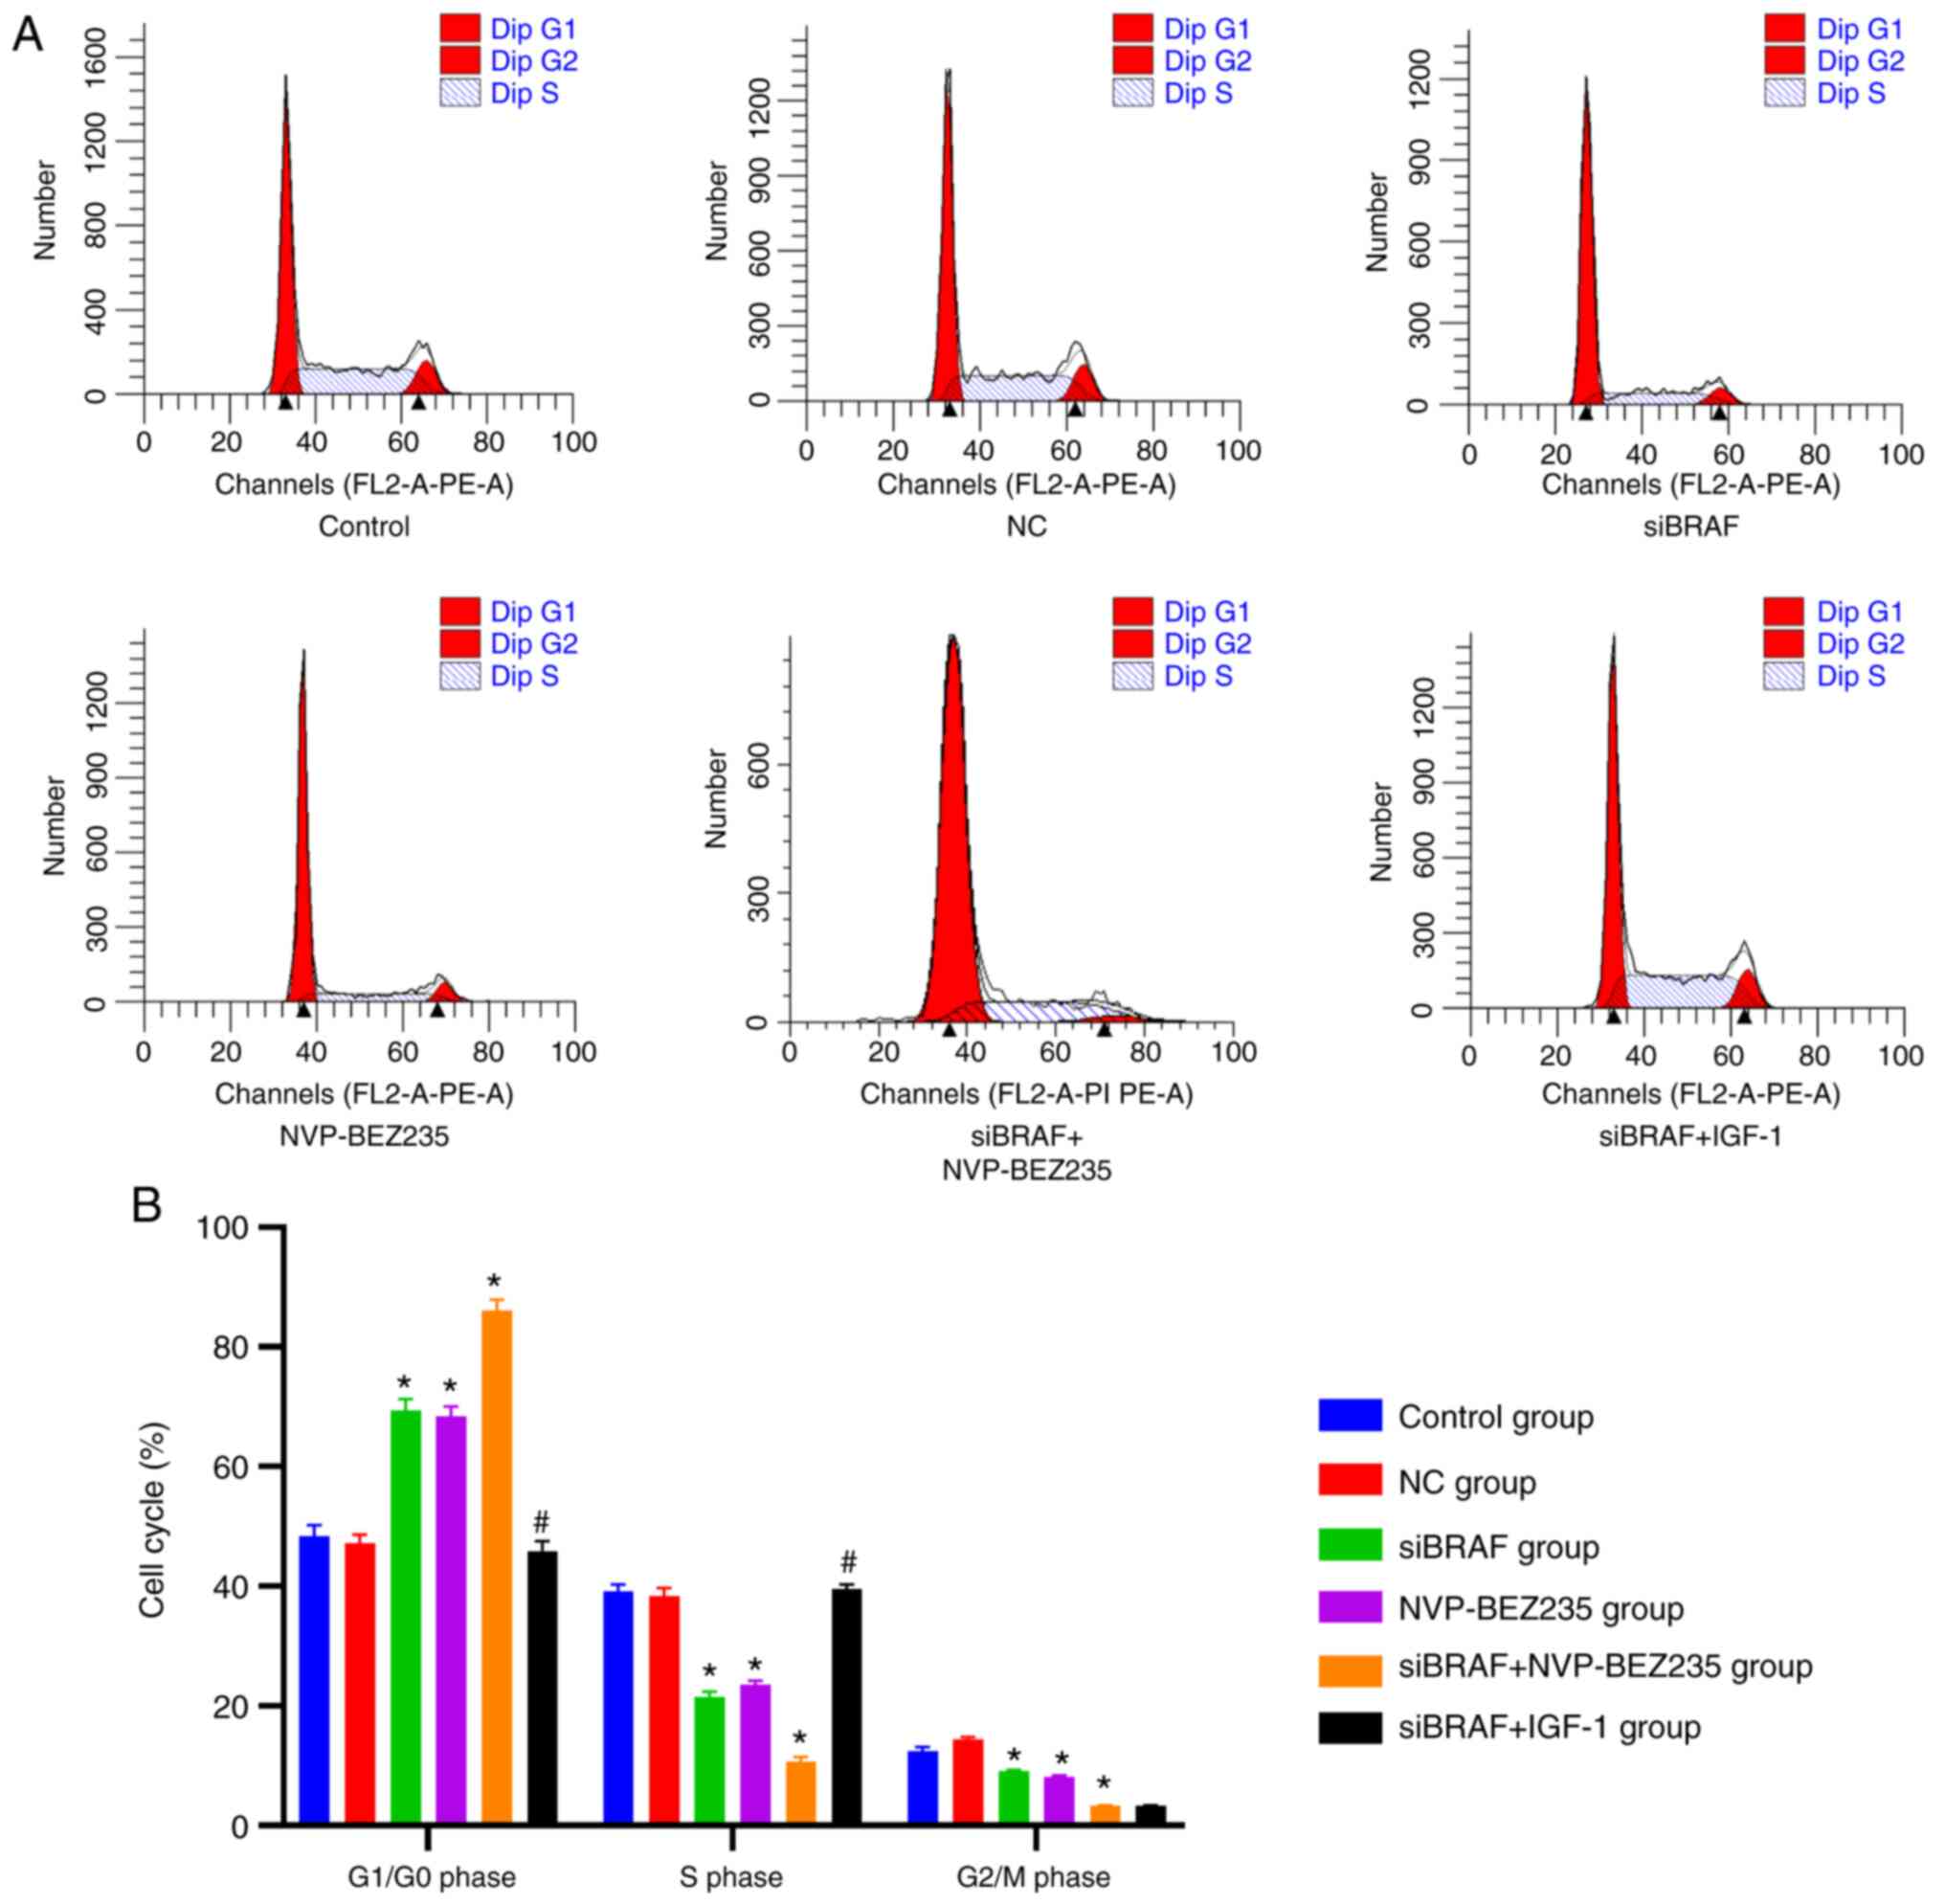
Compared with the control group, the NC group had no
significant difference in the distribution of the cell cycle in the
S phase, G2/M phase and G1/G0
phase (P>0.05). The proportion of cells in the S phase and
G2/M phase in the siBRAF group, NVP-BEZ235 group and
siBRAF + NVP-BEZ235 group was decreased, and the proportion of
cells in the G1/G0 phase was increased, with
statistical differences. These trends were more evident in the
siBRAF + NVP-BEZ235 group compared with the siBRAF group and
NVP-BEZ235 group (all P<0.05). In addition, in the siBRAF +
IGF-1 group, the proportion of cells in the S phase increased but
the proportion of G1/G0-phase cells decreased
when compared with siBRAF + NVP-BEZ235 group (all P<0.05), with
no statistically significant difference in the G2/M
phase (P>0.05). However, no significant difference was found in
the S, G2/M and G1/G0 phases
between the siBRAF group and NVP-BEZ235 group, and between the NC
group and the siBRAF + IGF-1 group (P>0.05) (Fig. 3; Table
I).
 | Table I.Comparison of cell cycle phases in
each group after transfection by flow cytometric assay. |
Table I.
Comparison of cell cycle phases in
each group after transfection by flow cytometric assay.
|
| Cell cycle
phases |
|---|
|
|
|
|---|
| Groups |
G1/G0 | S |
G2/M |
|---|
| Control | 48.40±1.77 | 39.12±1.18 | 12.48±0.64 |
| NC | 47.21±1.45 | 38.35±1.32 | 14.44±0.36 |
| siBRAF |
69.41±1.90a |
21.49±0.87a |
9.10±0.17a |
| NVP-BEZ235 |
68.34±1.72a |
23.51±0.69a |
8.15±0.26a |
| siBRAF +
NVP-BEZ235 |
86.00±1.89a,b |
10.74±0.71a,b |
3.26±0.15a,b |
| siBRAF + IGF-1 |
45.91±1.60b |
39.55±1.20b |
14.54±0.41b |
Comparison of the apoptosis rate in
each group after transfection
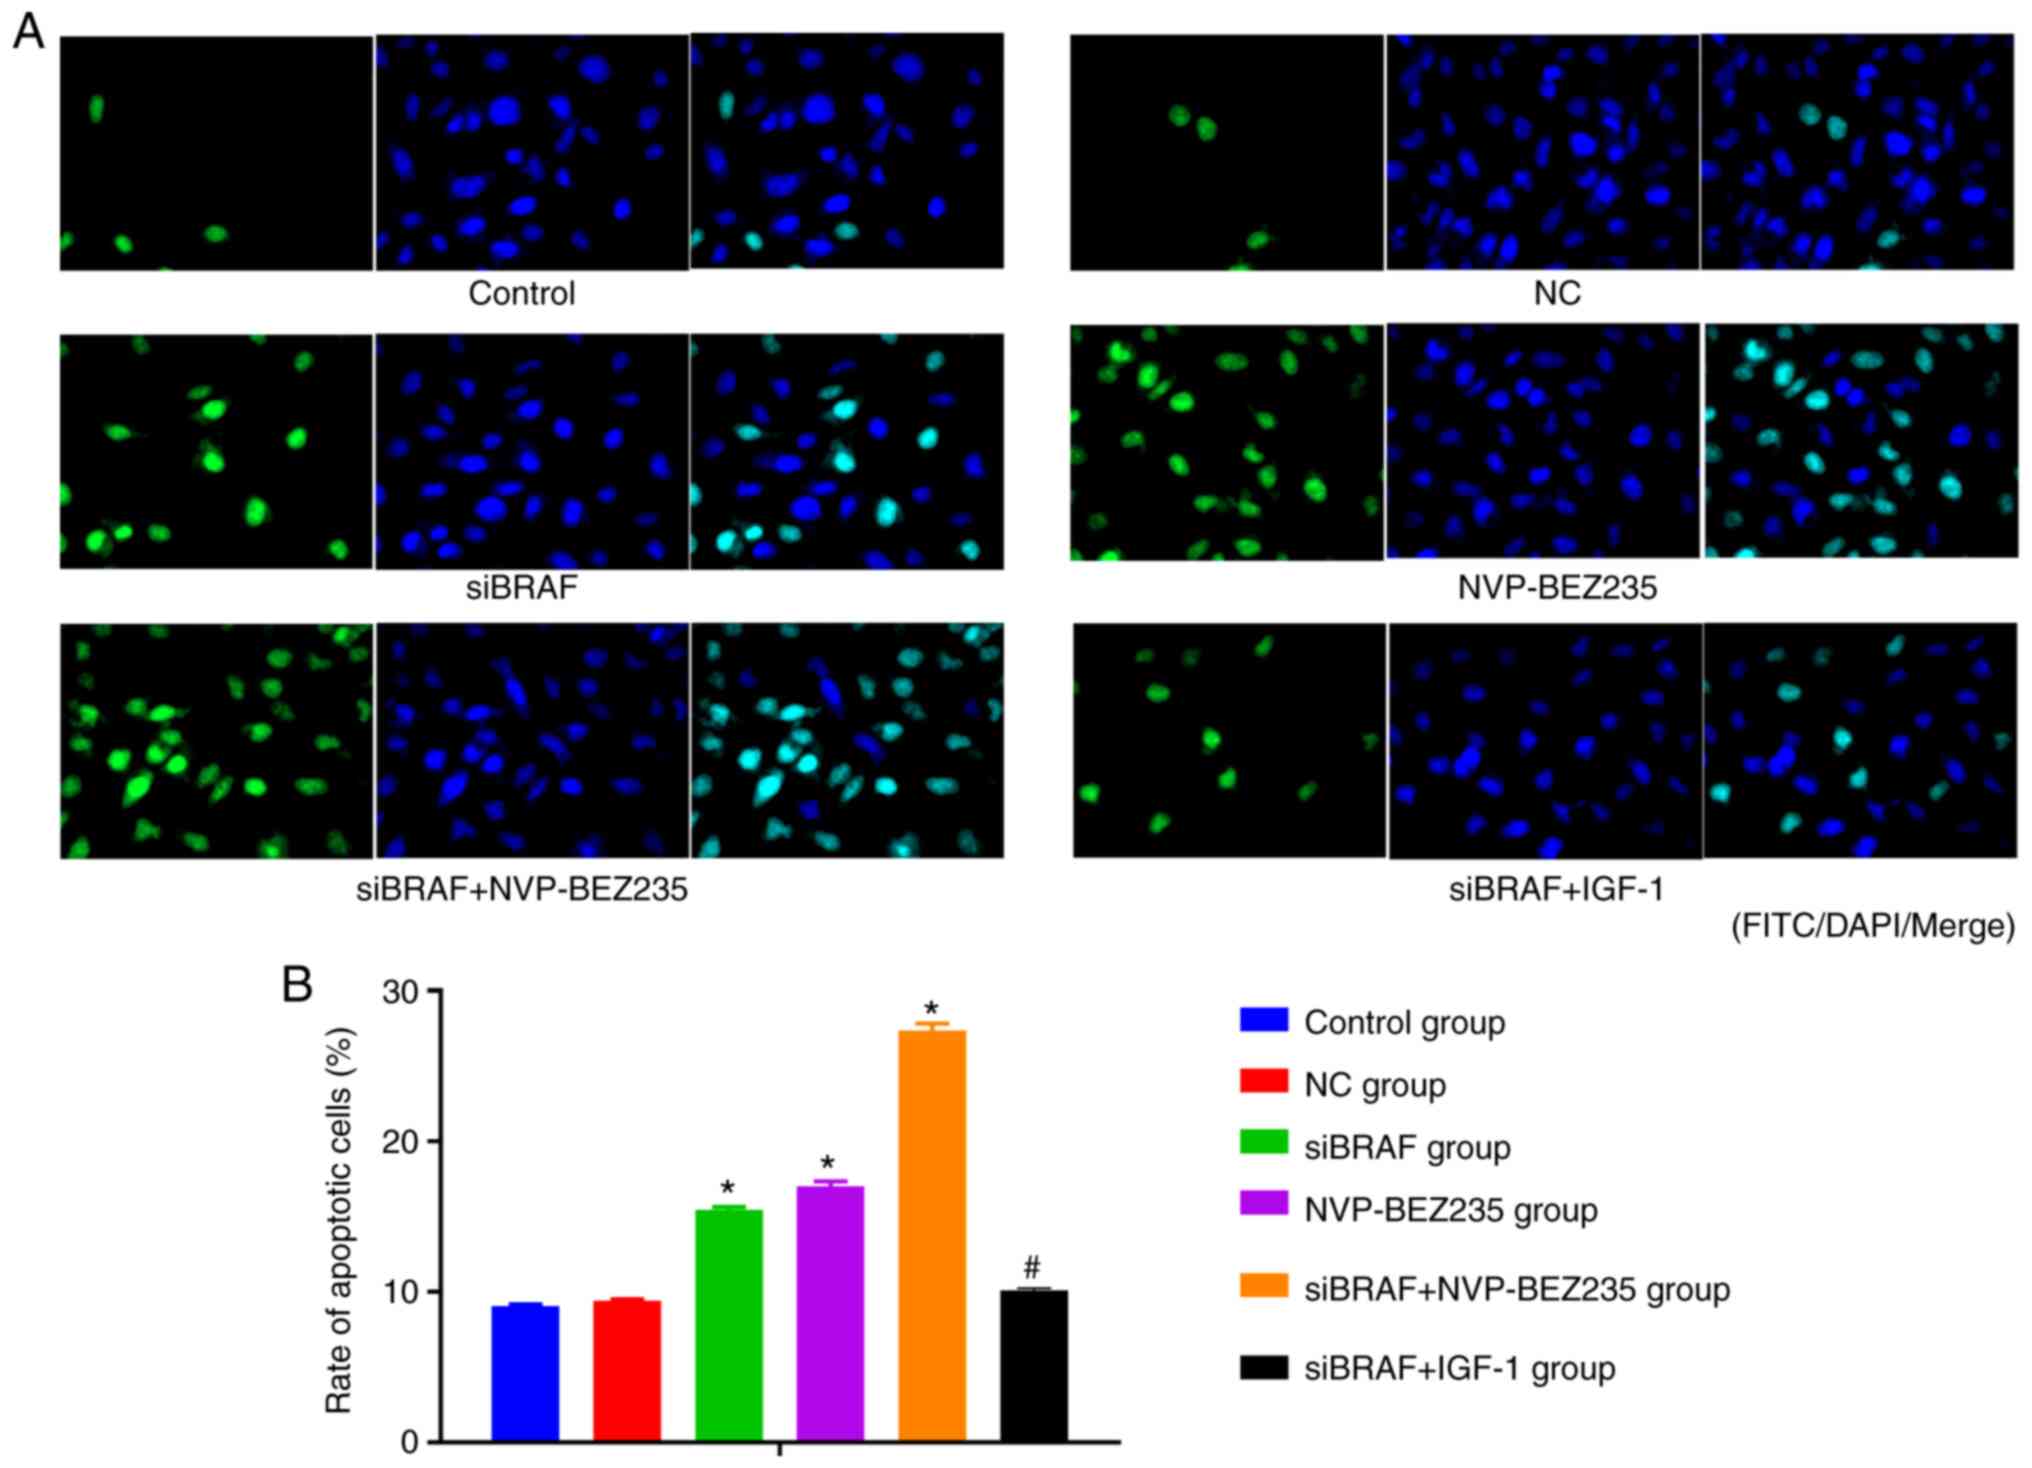
The apoptosis of cancer cells in each group after
transfection under light microscope by TUNEL assay is presented in
Fig. 4. According to the statistical
analysis results of the apoptosis rate, there was no significant
difference between NC group and control group (P>0.05). Compared
with NC group and control group, the apoptosis rate was
significantly increased in the siBRAF group and NVP-BEZ235 group,
and was especially higher in the siBRAF + NVP-BEZ235 group compared
with in siBRAF group and NVP-BEZ235 group (all P<0.05).
Furthermore, no significant difference was found in the apoptosis
rate in the siBRAF + IGF-1 group when compared with the NC group
and control group; while there was a decreased trend of the rate in
the siBRAF + IGF-1 group when compared with siBRAF + NVP-BEZ235
group (all P<0.05). In addition, no significant difference was
revealed in the apoptosis rate between the siBRAF group and
NVP-BEZ235 group, and between the NC group and siBRAF + IGF-1 group
(all P>0.05).
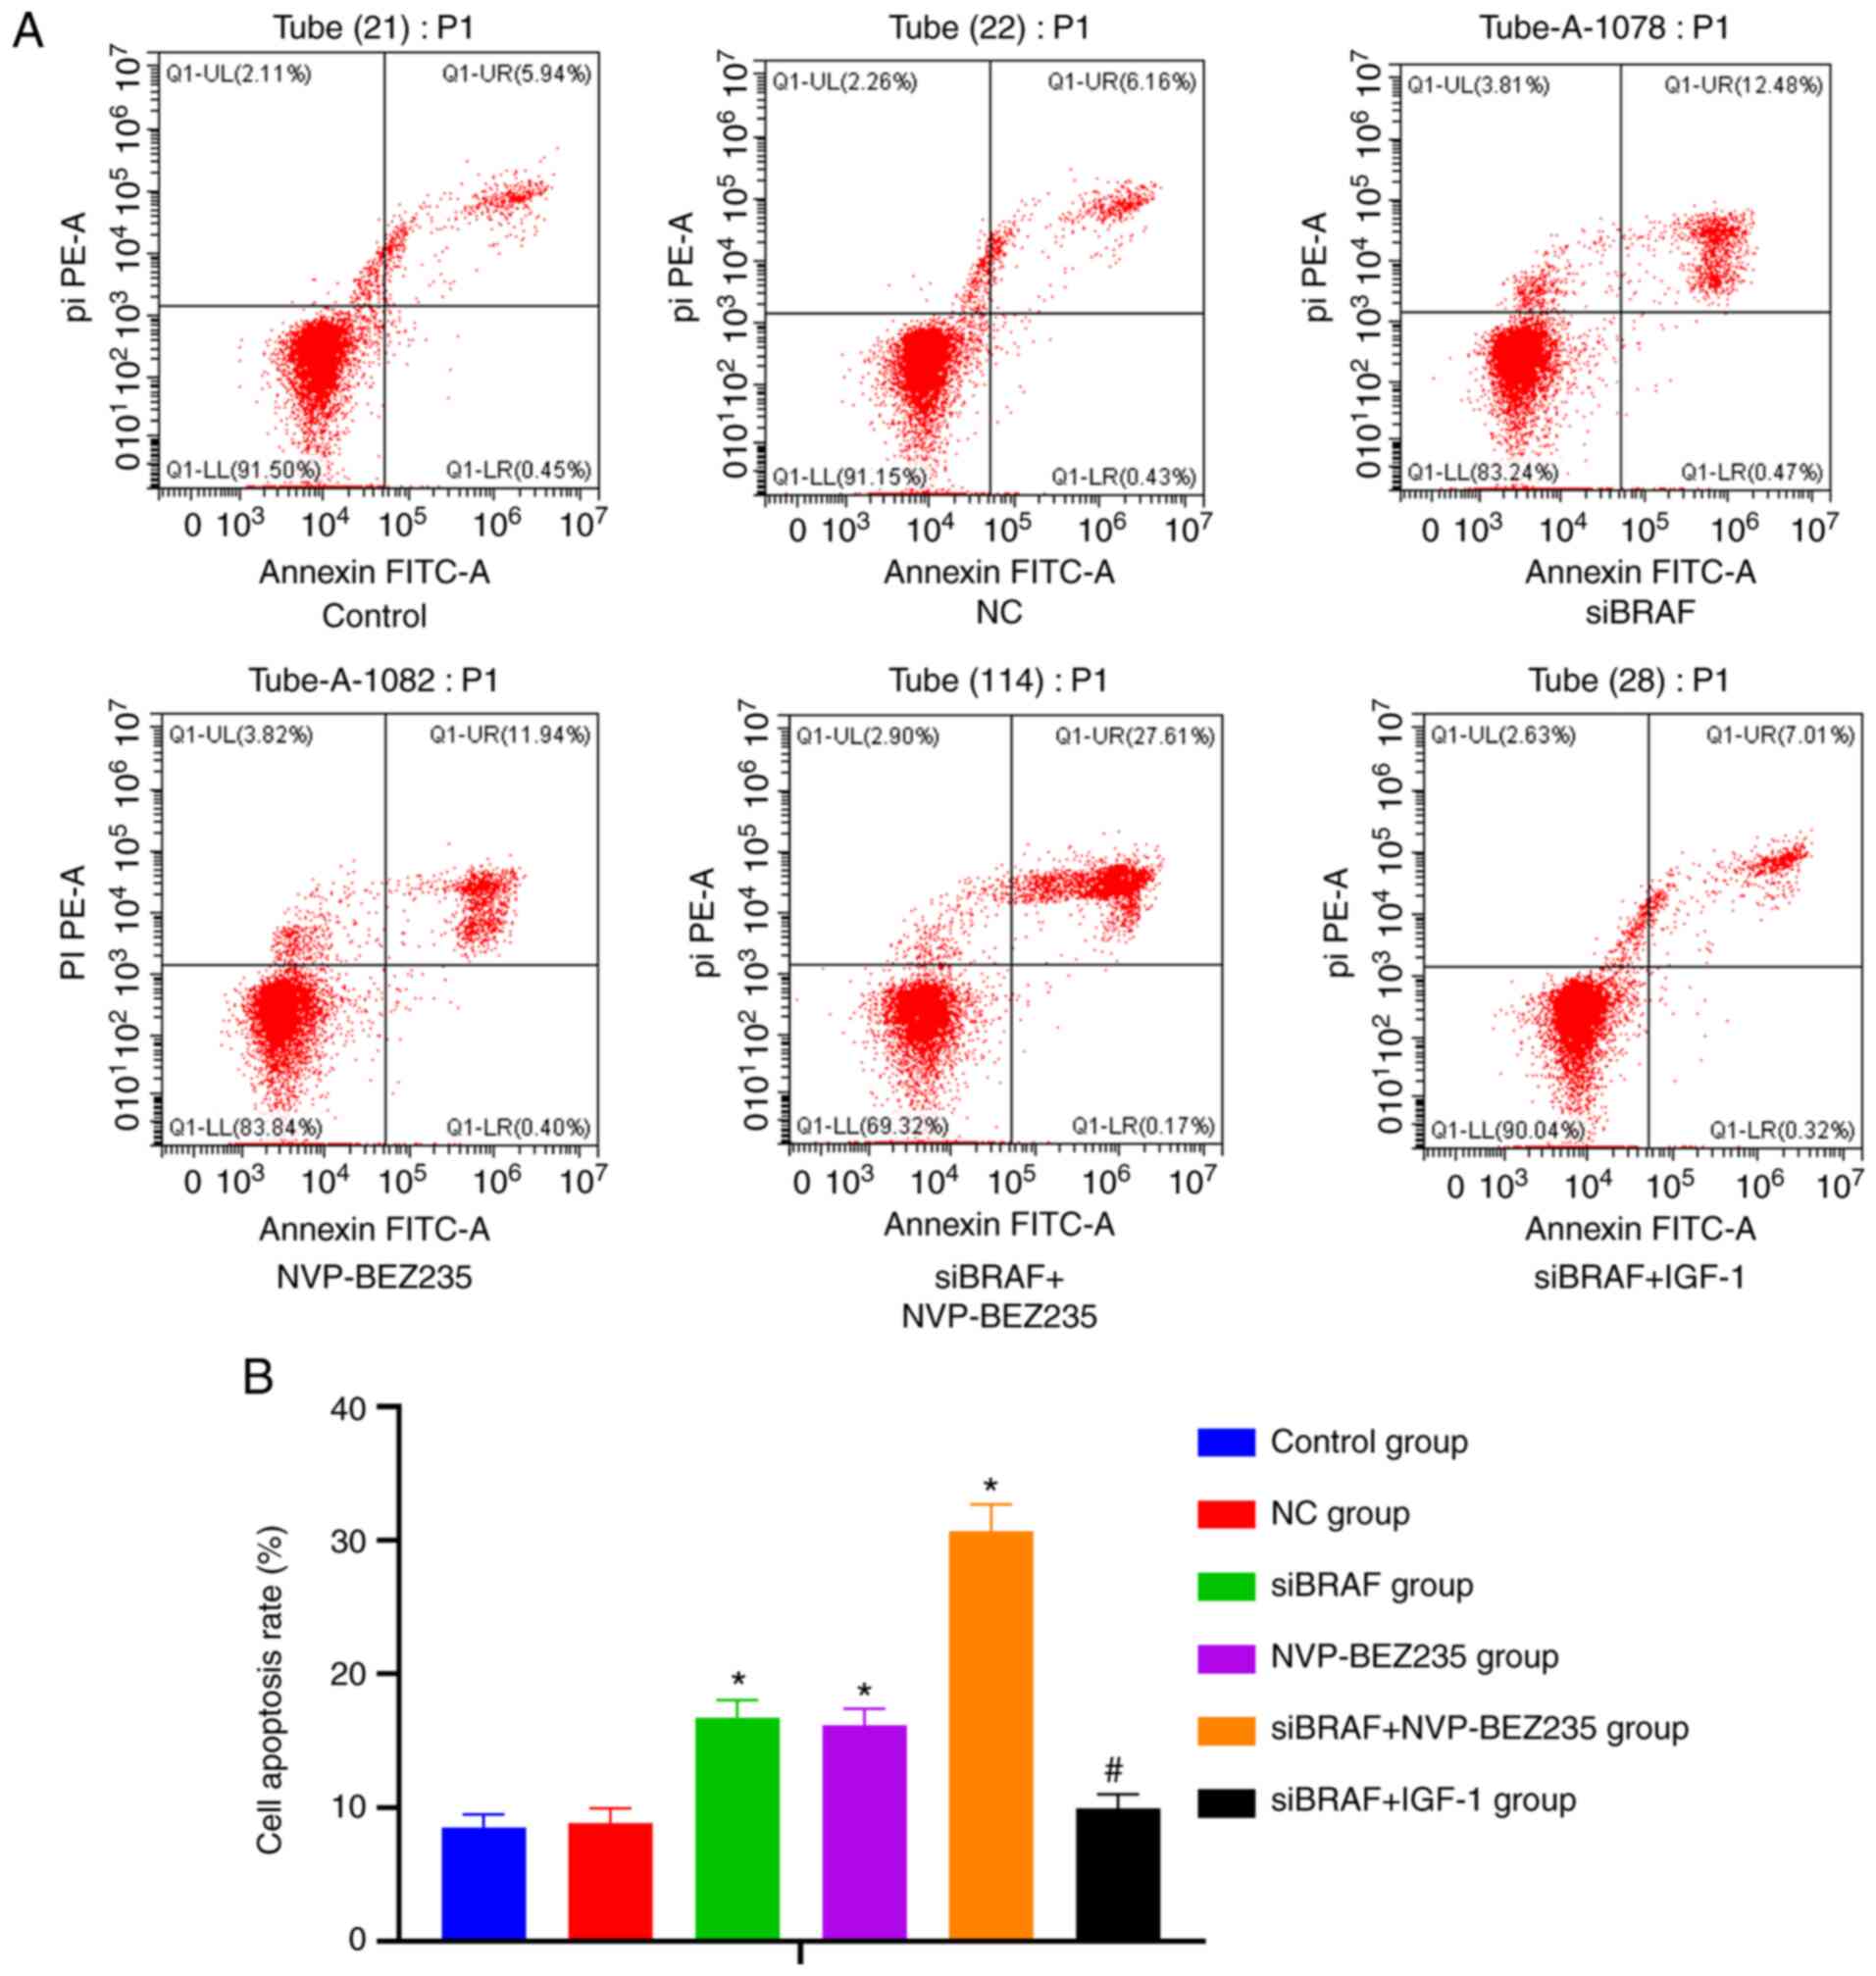
The apoptosis of cancer cells in each group after
transfection was detected by flow cytometry and is presented in
Fig. 5. Consistent with the results
of the TUNEL assay, it was revealed that there was no difference in
the cell apoptosis rate among the control group, NC group and
siBRAF + IGF-1 group (both P>0.05), which, however, was
increased in the siBRAF group and NVP-BEZ235 group, and more
markedly increased in the siBRAF + NVP-BEZ235 group, but decreased
in siBRAF + IGF-1 group (all P>0.05).
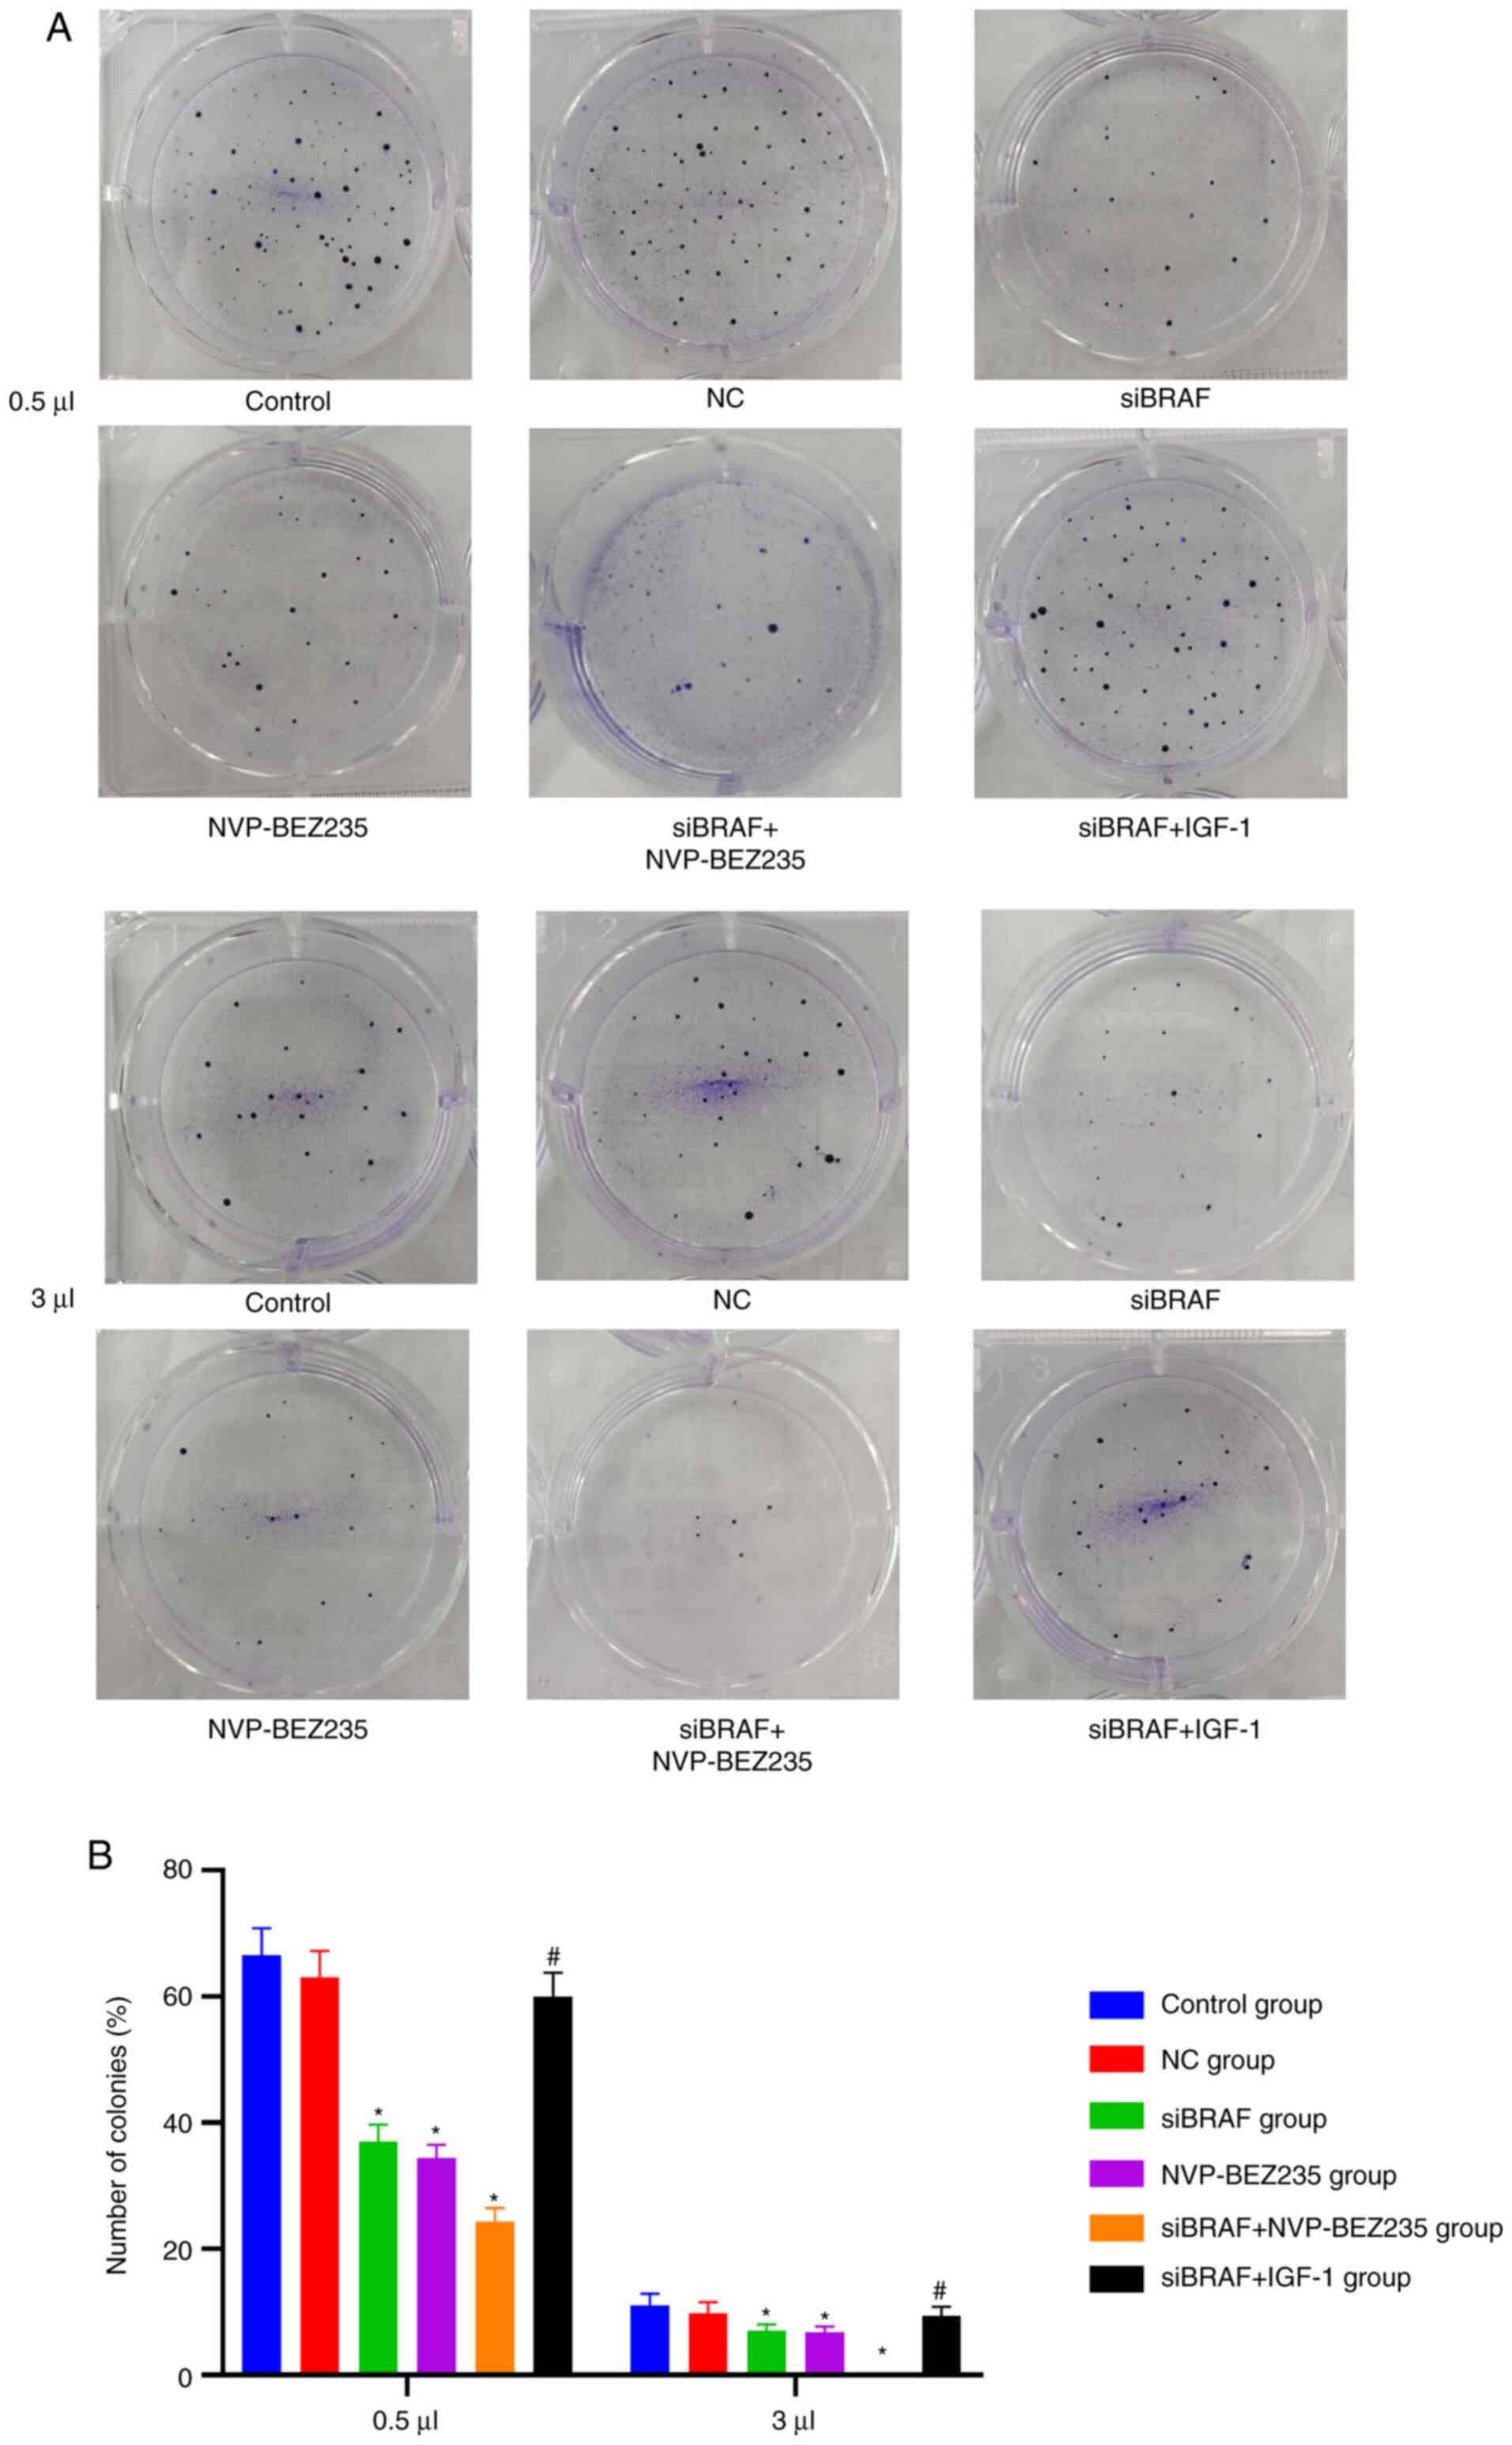
Comparison of the colony-forming
number of cells of each group after transfection
Compared with the control group, there was no
significant difference in the number of colony-forming cells in the
NC group (P>0.05). Compared with the NC group, the number of
colony-forming cells in the siBRAF group, NVP-BEZ235 group and
siBRAF + NVP-BEZ235 group was significantly decreased, and was
especially evident in the siBRAF + NVP-BEZ235 group than that in
the siBRAF group and NVP-BEZ235 group, with obvious statistical
difference (all P<0.05); whereas the number of colony-forming
cells was increased in the siBRAF + IGF-1 group when compared with
siBRAF + NVP-BEZ235 group, with significant difference (P<0.05).
However, there was no obvious difference in the number of
colony-forming cells between the siBRAF group and NVP-BEZ235 group,
and between the NC group and siBRAF + IGF-1 group (all P>0.05).
Detailed results are presented in Fig.
6 and Table II.
| Table II.Comparison of colony-forming number
of cells of each group after transfection as determined by colony
formation assay. |
Table II.
Comparison of colony-forming number
of cells of each group after transfection as determined by colony
formation assay.
|
| Concentrations
(µl) |
|---|
|
|
|
|---|
| Groups | 0.5 | 1 | 3 |
|---|
| Control | 66.56±4.27 | 35.72±4.12 | 11.08±1.85 |
| NC | 63.07±4.13 | 32.00±3.89 | 9.86±1.68 |
| siBRAF |
17.06±2.65a |
4.67±0.48a | 0a |
| NVP-BEZ235 |
16.45±2.08a |
4.55±0.32a | 0a |
| siBRAF +
NVP-BEZ235 |
4.33±0.37a,b | 0a,b | 0a |
| siBRAF + IGF-1 |
59.98±3.76b |
28.65±3.42b |
8.27±1.47b |
Comparison of mRNA expression levels
in each group after transfection
There was no difference in the mRNA expression
levels of the detected indexes between the control group and NC
group (P>0.05). No significant difference was observed in BRAF
mRNA expression between NVP-BEZ235 group and NC group (P>0.05);
while it was decreased in the siBRAF group, siBRAF + NVP-BEZ235
group and siBRAF + IGF-1 group (all P<0.05). Furthermore,
compared with the NC group, the mRNA expression of PI3K, Akt and
mTOR was decreased, while PTEN expression was increased in the
siBRAF group, NVP-BEZ235 group and siBRAF + NVP-BEZ235 group, and
especially evident in the siBRAF + NVP-BEZ235 group than that in
the siBRAF group and NVP-BEZ235 group, with significant differences
(all P<0.05). However, in the siBRAF + IGF-1 group, the mRNA
expression of PI3K, Akt and mTOR was increased, while PTEN was
decreased when compared with the siBRAF + NVP-BEZ235 group, and the
difference was significant (all P<0.05). There was no obvious
difference between the siBRAF group and NVP-BEZ235 group, and
between NC group and siBRAF + IGF-1 group (all P>0.05) (Fig. 7).
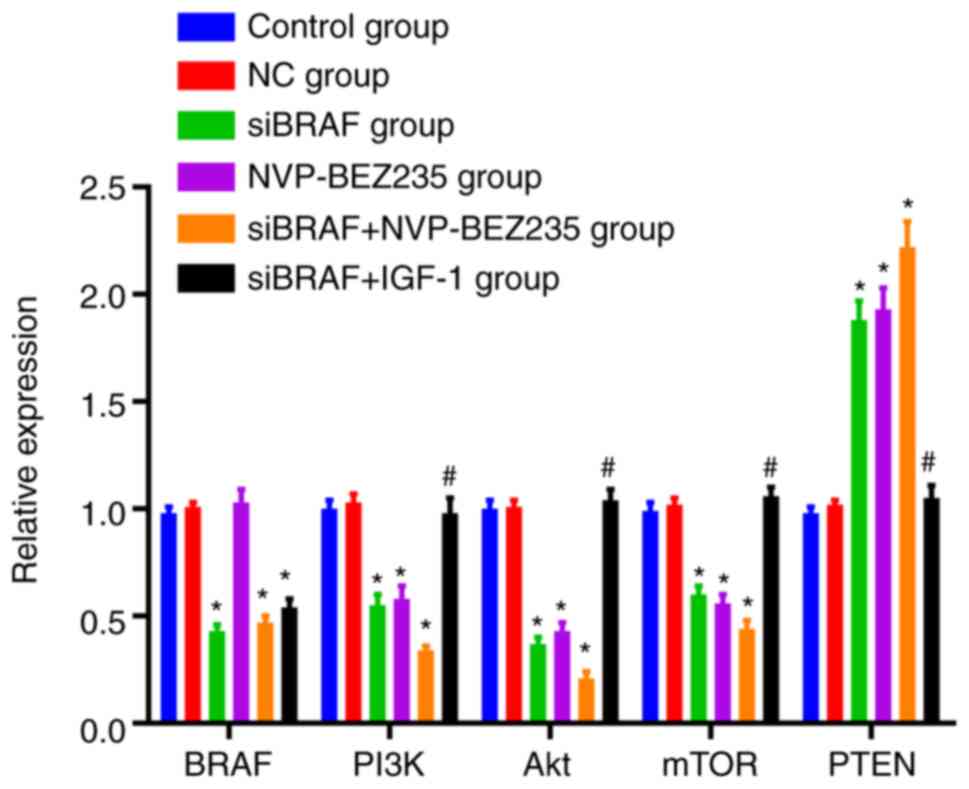 | Figure 7.Comparison of the mRNA expression
levels of BRAF, PI3K, Akt, mTOR and PTEN in each group after
transfection by reverse transcription-quantitative PCR. The data
were measured and expressed as the mean ± standard deviation. The
comparison between the two groups was performed by unpaired t-test,
and the comparison between multiple groups was performed by one-way
ANOVA. The cell experiment was repeated three times. *P<0.05,
compared with the control group and NC group, revealing statistical
difference; #P<0.05, compared with the siBRAF +
NVP-BEZ235 group, showing statistical difference. NC, negative
control; si, small interfering. |
Comparison of the protein expression
levels in each group after transfection
Compared with the control group, no obvious
difference was revealed in BRAF protein expression between the NC
group and NVP-BEZ235 group (P>0.05). In addition, it was
evidently decreased in siBRAF group, siBRAF + NVP-BEZ235 group and
siBRAF + IGF-1 group, with statistical difference (all
P<0.05).
Compared with the control group, there was no
significant difference in the protein expression levels of PTEN,
PI3K, p-PI3K, Akt, p-Akt, mTOR, p-mTOR, ERCC1 and BRCA1, Bax, and
Bcl-2 in the NC group (all P>0.05). The protein expression
levels of PI3K, p-PI3K, Akt, p-Akt, mTOR, p-mTOR, ERCC1, BRCA1 and
Bcl-2 were decreased, while those of PTEN and Bax were increased in
the siBRAF group, NVP-BEZ235 group, and siBRAF + NVP-BEZ235 group,
and especially evident in the siBRAF + NVP-BEZ235 group than that
in the siBRAF group and NVP-BEZ235 group, with statistical
difference (all P<0.05). In addition, the protein expression
levels of PI3K, p-PI3K, Akt, p-Akt, mTOR, p-mTOR, ERCC1 and BRCA1
and Bcl-2 were increased in siBRAF + IGF-1 group, but those of PTEN
and Bax were decreased when compared with the siBRAF + NVP-BEZ235
group (P<0.05). No significant difference in the detected
protein expression levels was revealed between the siBRAF group and
NVP-BEZ235 group, and between the NC group and siBRAF + IGF-1 group
(all P>0.05) (Fig. 8).
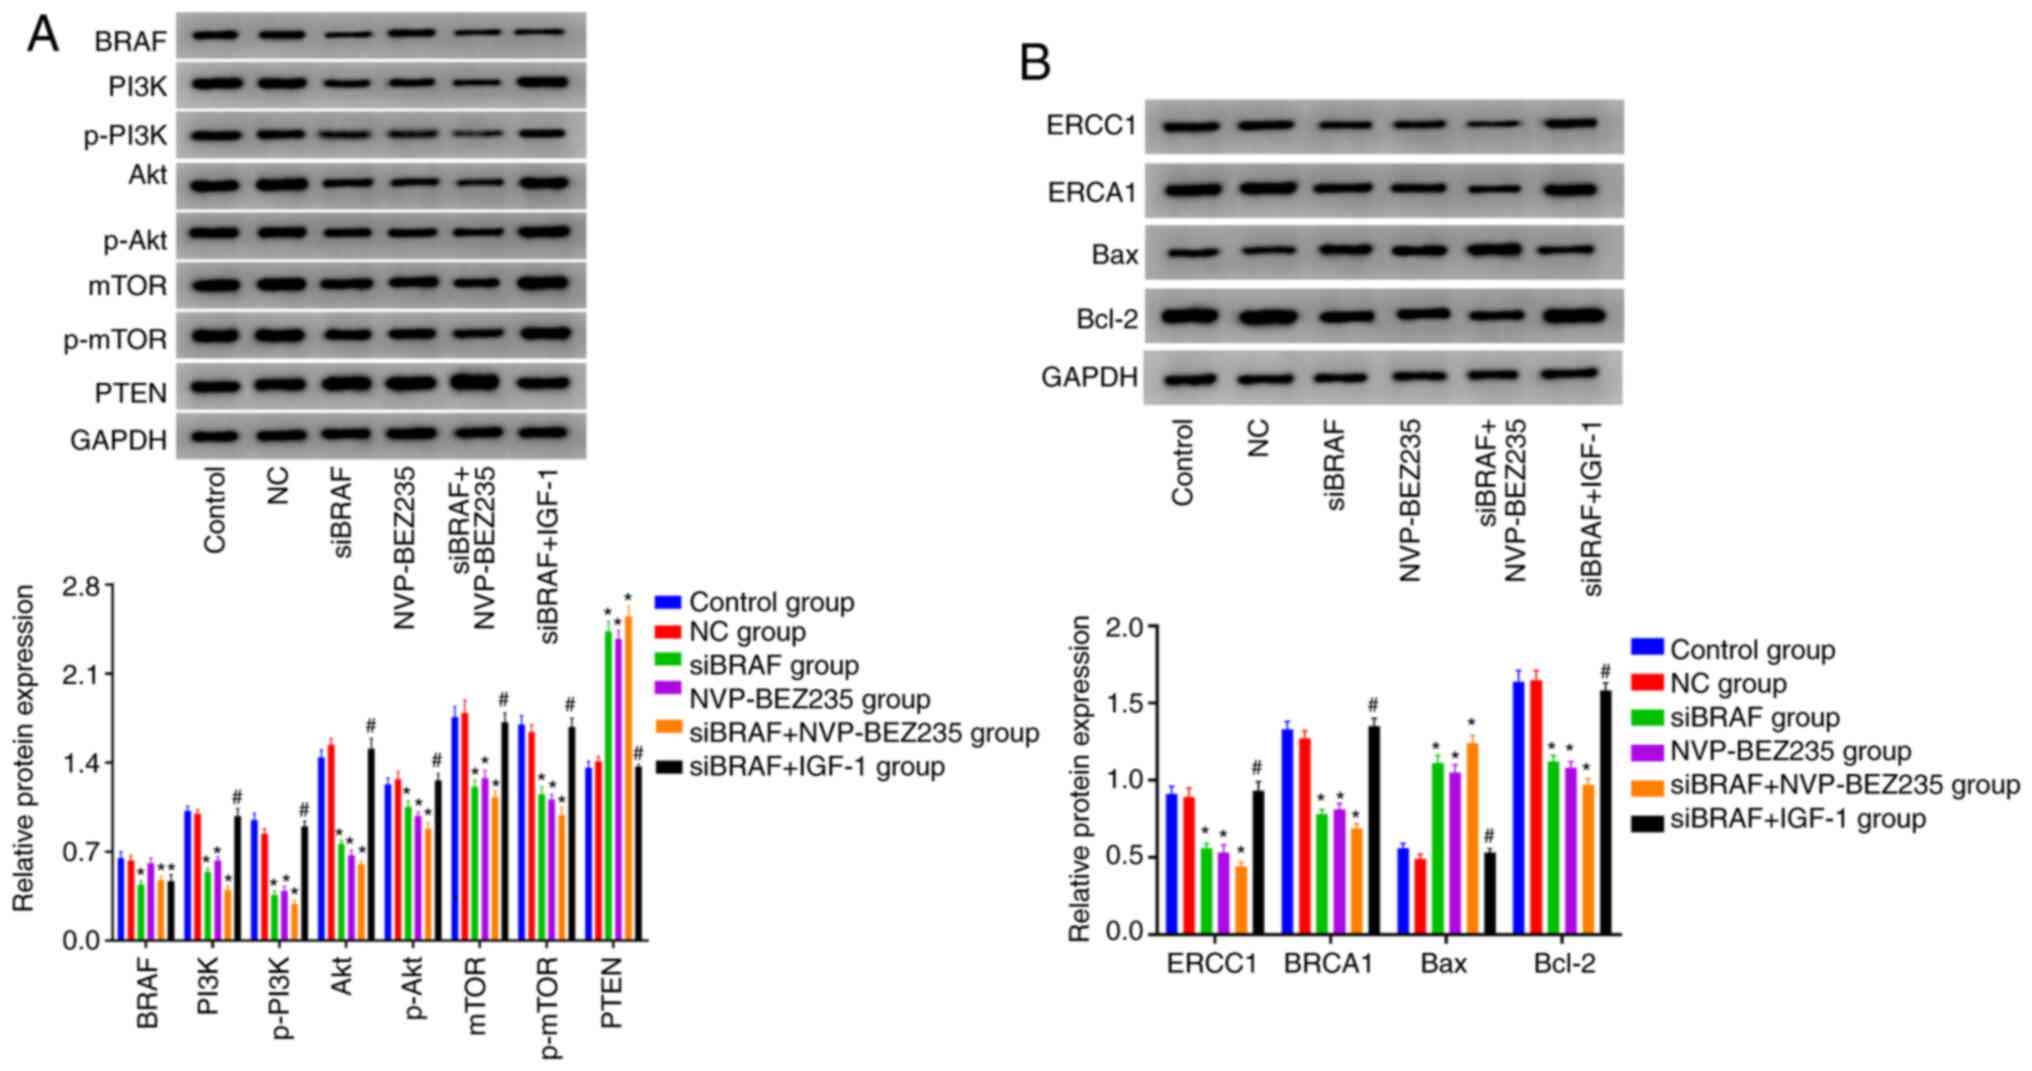 | Figure 8.Detection of the protein expression
levels of BRAF, PI3K, p-PI3K, Akt, p-Akt, mTOR, p-mTOR, PTEN, ERCC1
and BRCA1, Bax, and Bcl-2 in each group after transfection by
western blotting. (A) Western blotting bands and statistical
analysis of protein expression including BRAF and PI3K/Akt/mTOR
signaling pathway-related proteins. (B) Western blotting bands and
statistical analysis of the protein expression including cisplatin
resistance-related enzymes and apoptotic proteins. The data were
measured and expressed as the mean ± standard deviation. The
comparison between the two groups was performed by unpaired t-test,
and the comparison between multiple groups was performed by one-way
ANOVA. The cell experiment was repeated three times. *P<0.05,
compared with the control group and NC group, revealing statistical
difference; #P<0.05, compared with the siBRAF +
NVP-BEZ235 group, showing statistical difference. p-,
phosphorylated; NC, negative control; si, small interfering. |
Discussion
Surgery, radiotherapy and chemotherapy are the major
methods used for the treatment of lung cancer (26). However, the overall survival outcome
of lung cancer patients is not satisfactory after comprehensive
treatment (27). The causes of
recurrence, metastasis and treatment resistance after comprehensive
treatment are not quite clear at present. In addition, there are a
small number of cell sub-populations that are resistant to various
therapies in tumor tissue, which can survive after traditional
chemotherapy or chemotherapy, and continue to proliferate, forming
new recurrence or metastasis (28).
In other words, chemotherapy can kill most sensitive cells, but not
all cells. Notably, BRAF is a proto-oncogene found in numerous
tumor types, which can be regulated and used as a clinical strategy
to overcome or prevent acquired drug resistance in colorectal
cancer and also reported in lung cancer (29,30).
Prior studies have confirmed that the PI3K/Akt/mTOR
signaling pathway can regulate the growth, proliferation and
invasion of tumor cells from numerous aspects (31). For instance, PI3K can activate cell
cycle-dependent protein kinases to promote cells to enter the S
phase and induce DNA synthesis (32). In addition, the pathway can also
affect cell apoptosis through a number of ways (33). It can promote the transcription of
anti-apoptotic proteins by activating NF-kB, and inhibit
caspase-mediated apoptosis by phosphorylation to suppress
pro-apoptotic proteins (34). In
addition, activated Akt can activate endothelial NO synthetase,
promote endothelial cell migration and form new blood vessels
(35). Furthermore, concerning its
role in stimulating cell adhesion and migration, activated Akt can
increase the activity of NF-kB, promote cell movement and increase
invasiveness by increasing MMP-2 and MMP-9 levels that are critical
in extracellular matrix degradation (36). Notably, there have been various
studies concerning the role of PI3K/Akt/mTOR involved in cancer
development and resistance to chemotherapy, and downregulation of
AKT or inhibited activation of the PI3K/Akt/mTOR signaling pathway
could be an available beneficial adjuvant antitumor therapy
(37,38). In addition, it has been reported that
targeting the PI3K/AKT/mTOR pathway can be a potential option for
lung cancer treatment, which embodies preventing oncogenesis and
regulating chemotherapy response (39,40).
The PI3K/Akt/mTOR signal is involved in the
regulation of cell proliferation and differentiation by activating
PI3K, Akt and mTOR, which can affect cell activity, cycle, cell
growth and cell proliferation (41).
In addition, BRAF is generally highly expressed in different tumor
cells to modulate cell growth, differentiation and apoptosis, which
can stimulate the occurrence of tumors in the case of aberrant cell
metabolism resulted from abnormal activation of relevant pathways
due to increased expression of BRAF (42). In the present study, NSCLC cells were
divided into different groups with different transfection
protocols. According to the results, with the detection of BRAF
expression in different groups, verifying the expression status of
BRAF and side validation of successful transfection, it was
revealed that BRAF gene silencing and PI3K inhibitor NVP-BEZ235
treatment separately resulted in obvious decreased cell viability
at 2–6 days, decreased migration ability, shortened proportion of S
phase, increased proportion of G1/G0 phase,
increased apoptosis rate, and decreased number of colony formation.
The two separate treatments also had decreased mRNA expression of
PI3K, Akt and mTOR, increased PTEN mRNA expression, decreased
protein expression levels of PI3K, p-PI3K, Akt, p-Akt, mTOR,
p-mTOR, ERCC1, BRCA1 and Bcl-2, and increased protein expression
levels of PTEN and Bax. In particular, the beneficial roles were
further enhanced with a combined treatment of BRAF gene silencing
and PI3K inhibitor, which in turn highlighted the synergistic
effect of the combination of siBRAF and NVP-BEZ235.
It is theorized that BRAF can promote the expression
of p-Akt and mTOR (mammalian target of rapamycin) through
phosphorylation of PI3K, which can increase the level of Bcl-2,
decrease the level of Bax and enhance the metabolism of cells;
concurrently, when PI3K inhibitor was administered and BRAF
expression was silenced, the phosphorylation of Akt induced by BRAF
was blocked, and the response of tumor cells to BRAF was decreased,
thus inhibiting tumor growth and migration and promoting tumor cell
apoptosis. In addition to the effect on the phosphorylated levels
of PI3K, Akt and mTOR, total expression levels of PI3K, Akt and the
downstream protein mTOR were also suppressed after silencing of
BRAF gene expression, which may be related to the translation
efficiency of selective mRNAs after protein modification. It
suggests that BRAF gene silencing has a role in mediating the
activation of the PI3K/Akt/mTOR signaling pathway, which is
considered to be realized through the inhibition of both the total
and phosphorylated protein levels of PI3K, Akt and mTOR.
Concurrently, in the present study, the activation of the
PI3K/Akt/mTOR signaling pathway, the increase of expression of
chemoresistance-related enzymes and the increase of S-phase cell
subsets all suggested a reduced sensitivity to chemotherapeutic
drugs. In addition, the change of the cell cycle also reduced the
sensitivity of the remaining cells to chemotherapy. Thus, these
cells that remained after chemotherapy were resistant to
chemotherapy, which may be the main reason for the failure of local
treatment after chemotherapy. In this way, the PI3K/Akt/mTOR
signaling pathway inhibitor, dual inhibitor of PI3K and mTOR, could
block BRAF-mediated cell proliferation and survival, indicating
that the PI3K/Akt/mTOR signaling pathway may promote the inhibition
of cell response to BRAF. Accordingly, BRAF may be involved in cell
proliferation and survival as an upstream factor of the
PI3K/Akt/mTOR signaling pathway. Notably, the PI3K/Akt/mTOR
signaling pathway agonist (PI3K agonist) was used in the in the
present study, and an opposite trend was revealed under the
combined treatment of BRAF gene silencing and the PI3K agonist,
highlighting that activation of PI3K/Akt/mTOR reversed the positive
role of BRAF gene silencing, and demonstrated the role of BRAF gene
expression silencing in inhibiting the activation of PI3K/Akt/mTOR
in the development of NSCLS.
In addition, it should be noted that cisplatin, as a
classical drug for chemotherapy, is mainly involved in DNA
synthesis as a competitive inhibitor in the S phase (43). For example, a previous in
vitro study revealed that combined use of cisplatin could block
the G1/S phase of the cell cycle of colorectal cancer cells in a
certain concentration range (44).
Additionally, when HeLa hepatoma cells were treated with cisplatin
using different methods, it was revealed that cisplatin alone
decreased cell viability, glycolysis and oxidative phosphorylation
(45). In the present study, after
cell treatment with cisplatin, the cell cycle was analyzed by flow
cytometry, and it was found that BRAF gene silencing, the pathway
inhibitor and their combined treatment decreased the proportion of
cells in the S phase and G2/M phase, and increased the
proportion of G1/G0-phase cells, and was
especially significant under the combined action; while the pathway
agonist reversed the positive role of BRAF gene silencing, and
blocked A549/DDP cells in the S phase and G2/M phase.
The sensitivity of cells to chemotherapy is different depending on
the phase of the cell cycle, and is higher in the
G1/G0 phase than that in the G2/M
phase and S phase (46), however the
specific mechanism is not clear. Therefore, theoretically, the use
of chemotherapy drugs to render cells sensitive to the cell cycle
during chemotherapy, or in other words, reduce the proportion of
G2/M-phase and S-phase cells but increase the proportion
of G1/G0 phase can improve the sensitivity of
chemotherapy (47). In the present
study, MTT and cell colony experiments were used to evaluate
chemosensitivity, which was revealed to be decreased in cells
treated with chemotherapeutics to various doses. The possible
reason may be that cells with stem cell characteristics are
enriched after treatment of chemotherapy agents, and the proportion
of S-phase cells increased, resulting in the decrease of
sensitivity to chemotherapy. Silencing of the BRAF gene may inhibit
the activation of the PI3K/Akt/mTOR signaling pathway to reduce the
expression of chemoresistance-related enzymes and partially restore
the sensitivity of A549/DDP cells to chemotherapy drugs, thus
increasing the tolerance of tumor cells to treatment. In addition,
suppressing the activation of this signaling pathway can induce an
increase in cell subsets of the S-phase, thus increasing the
resistance of cells to chemotherapy. After blocking the pathway by
silencing of BRAF and using pathway inhibitor NVP-BEZ235, the
proportion of S-phase cell subsets was reduced, and the sensitivity
to chemotherapy was partially restored, which in turn supports our
prior hypothesis of the role of the PI3K/Akt/mTOR signaling pathway
mediated by BRAF gene silencing. The role of regulating
PI3K/AKT/mTOR pathway in lung cancer has been demonstrated
previously (48). In a similar
mechanism of action, it has been reported that an antitumor effect
could be promoted with the suppression of PI3K and p-Akt protein
expression, which may be achieved through the regulation of the
PI3K/AKT pathway achieved by targeting the EGFR gene through
miRNA-223 (49), supporting the
antitumor effect of using PI3K inhibitor to suppress the proposed
pathway in NSCLC. Similarly, Wang et al also reported a
similar regulatory axis of gene-signaling pathway in NSCLC, and
found that ELF3 could promote cell growth and metastasis by
regulating PI3K/Akt and ERK pathways in NSCLC (50), highlighting the role of searching for
potential genes as promising new targets to inhibit the
PI3K/Akt/mTOR signaling pathway for the treatment of NSCLC
patients. To sum up, silencing of BRAF gene expression and
inhibiting the activation of the PI3K/Akt/mTOR signaling pathway
could decrease cell viability, inhibit the cell cycle and
migration, increase the apoptosis rate, decrease the number of
colony-forming cells and increase chemosensitivity of NSCLC. The
present study suggests that BRAF gene silencing combined with
NVP-BEZ235 exert a synergistic effect to reduce the resistance of
cells to chemotherapy and improve the sensitivity of chemotherapy
by suppressing the activation of the PI3K/Akt/mTOR signaling
pathway. In addition, activation of the PI3K/Akt/mTOR signaling
pathway may reverse the role of silencing of BRAF gene expression
in cell viability, the cell cycle and migration, apoptosis, and
colony formation, providing a potential approach for improving the
chemosensitivity of NSCLC. However, our study still has some
limitations. For example, there was a weak additive effect of
siBRAF + NVP vs. siBRAF alone, as indicated in the detection of the
protein expression levels of related indexes in each group after
transfection by western blotting, which deserves to be verified by
further experimentation. In addition, the present study was a
single-cell experiment, and the reliability of the findings in this
study can be enhanced by an animal experiment. However, the present
study, for the first time, clarified the possible mechanism of
NSCLC cell biological characteristics and chemosensitivity using a
siRNA silencing technique, with abundant experimental data to
support the positive role of BRAF gene silencing and inhibited the
PI3K/Akt/mTOR signaling pathway thus suppressing the progression
and enhancing chemosensitivity of NSCLC. It may provide a potential
reference for suppressing tumor aggravation and improving the
therapeutic outcomes of NSCLC at the genetic level.
Acknowledgements
Not applicable.
Funding
No funding was received.
Availability of data and materials
The datasets used and/or analyzed during the current
study are available from the corresponding author on reasonable
request.
Authors' contributions
BR made substantial contributions to conception and
design, acquisition of data, analysis and interpretation of data;
was involved in drafting the manuscript and revising it critically
for important intellectual content; and gave final approval of the
version to be published. HL and YY helped with general data
collection and analysis. YL helped with statistical analysis. All
authors have participated sufficiently in the work to take public
responsibility for appropriate portions of the content; and agreed
to be accountable for all aspects of the work in ensuring that
questions related to the accuracy and integrity of the work are
appropriately investigated and resolved. All authors read and
approved the final manuscript.
Ethics approval and consent to
participate
Not applicable.
Patient consent for publication
Not applicable.
Competing interests
The authors declare that they have no competing
interests.
References
|
1
|
Masel EK, Berghoff AS, Füreder LM,
Heicappell P, Schlieter F, Widhalm G, Gatterbauer B, Dieckmann U,
Birner P, Bartsch R, et al: Decreased body mass index is associated
with impaired survival in lung cancer patients with brain
metastases: A retrospective analysis of 624 patients. Eur J Cancer
Care (Engl). 26:e127072017. View Article : Google Scholar : PubMed/NCBI
|
|
2
|
Sui T, Liu A and Jiao W: Difference of
lung function retention after segmentectomy and lobectomy. Zhongguo
Fei Ai Za Zhi. 22:178–182. 2019.PubMed/NCBI
|
|
3
|
Wang W, Zhang L, Liu L, Zheng Y, Zhang Y,
Yang S, Shi R and Wang S: Chemosensitizing effect of shRNA-mediated
ERCC1 silencing on a Xuanwei lung adenocarcinoma cell line and its
clinical significance. Oncol Rep. 37:1989–1997. 2017. View Article : Google Scholar : PubMed/NCBI
|
|
4
|
Levy A, Faivre-Finn C, Hasan B, De Maio E,
Berghoff AS, Girard N, Greillier L, Lantuéjoul S, O'Brien M, Reck
M, et al: Diversity of brain metastases screening and management in
non-small cell lung cancer in Europe: Results of the European
Organisation for Research and Treatment of Cancer Lung Cancer Group
survey. Eur J Cancer. 93:37–46. 2018. View Article : Google Scholar : PubMed/NCBI
|
|
5
|
Majem M, Juan O, Insa A, Reguart N, Trigo
JM, Carcereny E, García-Campelo R, García Y, Guirado M and
Provencio M: SEOM clinical guidelines for the treatment of
non-small cell lung cancer (2018). Clin Transl Oncol. 21:3–17.
2019. View Article : Google Scholar : PubMed/NCBI
|
|
6
|
Cheng L, Gao E, Zhu F, Wang Y, Zhong J and
An T: A case report on successful third challenge to the
Pemetrexed-based regimen for advanced non-small cell lung cancer.
Zhongguo Fei Ai Za Zhi. 22:395–400. 2019.PubMed/NCBI
|
|
7
|
Zhang Y: Chemotherapy in advanced
non-small cell lung cancer: Present and future. J Int Transl Med.
5:38–44. 2017.
|
|
8
|
Matsufuji H, Shiozaki E, Nakatake Y,
Yoshida K, Kamada K and Matsuo T: A case of slowly progressive
brain metastasis with minor bleeding after removal of and
chemotherapy for non-small cell lung cancer. No Shinkei Geka.
45:339–344. 2017.PubMed/NCBI
|
|
9
|
Farré PL, Scalise GD, Duca RB, Dalton GN,
Massillo C, Porretti J, Graña K, Gardner K, De Luca P and De Siervi
A: CTBP1 and metabolic syndrome induce an mRNA and miRNA expression
profile critical for breast cancer progression and metastasis.
Oncotarget. 9:13848–13858. 2018. View Article : Google Scholar
|
|
10
|
Zhang L, Wang Y, Rashid MH, Liu M, Angara
K, Mivechi NF, Maihle NJ, Arbab AS and Ko L: Malignant pericytes
expressing GT198 give rise to tumor cells through angiogenesis.
Oncotarget. 8:51591–51607. 2017. View Article : Google Scholar : PubMed/NCBI
|
|
11
|
Glentis A, Oertle P, Mariani P, Chikina A,
El Marjou F, Attieh Y, Zaccarini F, Lae M, Loew D, Dingli F, et al:
Cancer-associated fibroblasts induce metalloprotease-independent
cancer cell invasion of the basement membrane. Nat Commun.
8:9242017. View Article : Google Scholar : PubMed/NCBI
|
|
12
|
Oudin MJ and Weaver VM: Physical and
chemical gradients in the tumor microenvironment regulate tumor
cell invasion, migration, and metastasis. Cold Spring Harb Symp
Quant Biol. 81:189–205. 2016. View Article : Google Scholar : PubMed/NCBI
|
|
13
|
Shen Y, Su C, Shi Y, Liu X and Zhao L:
Chitosan nanoparticles promoted cancer cell invasion and metastasis
via the massive production of reactive oxygen species. J Biomater
Tissue Eng. 7:484–490. 2017. View Article : Google Scholar
|
|
14
|
Li N, Gao WJ and Liu NS: LncRNA BCAR4
promotes proliferation, invasion and metastasis of non-small cell
lung cancer cells by affecting epithelial-mesenchymal transition.
Eur Rev Med Pharmacol Sci. 21:2075–2086. 2017.PubMed/NCBI
|
|
15
|
Shimizu T, Asakuma M, Tomioka A, Inoue Y,
Hirokawa F, Hayashi M and Uchiyama K: Span-1 and CA19-9 as
predictors of early recurrence and lymph node metastasis for
patients with invasive pancreatic cancer after pancreatectomy. Am
Surg. 84:109–113. 2018. View Article : Google Scholar : PubMed/NCBI
|
|
16
|
Zhu BP, Guo ZQ, Lin L and Liu Q: Serum
BSP, PSADT, and Spondin-2 levels in prostate cancer and the
diagnostic significance of their ROC curves in bone metastasis. Eur
Rev Med Pharmacol Sci. 21:61–67. 2017.PubMed/NCBI
|
|
17
|
Feng HM, Zhao Y, Zhang JP, Zhang JH, Jiang
P, Li B and Wang C: Expression and potential mechanism of
metabolism-related genes and CRLS1 in non-small cell lung cancer.
Oncol Lett. 15:2661–2668. 2018.PubMed/NCBI
|
|
18
|
Choi H, Ding CG, Lee SB, Durrans A, Ryu S,
Elemento O, Wong S, Altorki NK and Mittal V: Abstract 1159: A novel
HGF-MET paracrine signaling pathway promotes growth and resistance
to chemotherapy in lung cancer. Cancer Res. 74:11592014.
|
|
19
|
Bahrami A, Hasanzadeh M, Hassanian SM,
ShahidSales S, Ghayour-Mobarhan M, Ferns GA and Avan A: The
potential value of the PI3K/Akt/mTOR signaling pathway for
assessing prognosis in cervical cancer and as a target for therapy.
J Cell Biochem. 118:4163–4169. 2017. View Article : Google Scholar : PubMed/NCBI
|
|
20
|
Pan JH, Wang HB, Du XF, Liu JY and Zhang
DJ: Polydatin induces human cervical cancer cell apoptosis via
PI3K/AKT/mTOR signaling pathway. Zhongguo Zhong Yao Za Zhi.
42:2345–2349. 2017.PubMed/NCBI
|
|
21
|
Du C, Zhang T, Xiao X, Shi Y, Duan H and
Ren Y: Protease-Activated Receptor-2 promotes kidney tubular
epithelial inflammation by inhibiting autophagy via the
PI3K/Akt/mTOR signalling pathway. Biochem J. 474:2733–2747. 2017.
View Article : Google Scholar : PubMed/NCBI
|
|
22
|
Tian B, Zhao Y, Liang T, Ye X, Li Z, Yan
D, Fu Q and Li Y: Curcumin inhibits urothelial tumor development by
suppressing IGF2 and IGF2-mediated PI3K/AKT/mTOR signaling pathway.
J Drug Target. 25:626–636. 2017. View Article : Google Scholar : PubMed/NCBI
|
|
23
|
Liu M, Tang R and Jiang Y: Pantoprazole
induces apoptosis of leukemic cells by inhibiting expression of
P-Glycoprotein/Multidrug Resistance-Associated Protein-1 Through
PI3K/AKT/mTOR Signaling. Indian J Hematol Blood Transfus.
33:500–508. 2017. View Article : Google Scholar : PubMed/NCBI
|
|
24
|
Dalal AA, Guerin A, Mutebi A and Culver
KW: Economic analysis of BRAF gene mutation testing in real world
practice using claims data: Costs of single gene versus panel tests
in patients with lung cancer. J Med Econ. 21:649–655. 2018.
View Article : Google Scholar : PubMed/NCBI
|
|
25
|
Livak KJ and Schmittgen TD: Analysis of
relative gene expression data using real-time quantitative PCR and
the 2(-Delta Delta C(T)) method. Methods. 25:402–408. 2001.
View Article : Google Scholar : PubMed/NCBI
|
|
26
|
Toffart AC, Duruisseaux M, Brichon PY,
Pirvu A, Villa J, Selek L, Guillem P, Dumas I, Ferrer L, Levra MG
and Moro-Sibilot D: Operation and chemotherapy: Prognostic factors
for lung cancer with one synchronous metastasis. Ann Thorac Surg.
105:957–965. 2018. View Article : Google Scholar : PubMed/NCBI
|
|
27
|
Wang X, Zhang W, Du W, Zhang X, Ren X and
Cao S: Efficacy and survival analysis of apatinib in patients with
advanced nonsquamous non-small cell lung cancer after failure of
first-line treatment. Zhongguo Fei Ai Za Zhi. 20:761–768.
2017.PubMed/NCBI
|
|
28
|
Farnie G, Sotgia F and Lisanti MP: High
mitochondrial mass identifies a sub-population of stem-like cancer
cells that are chemo-resistant. Oncotarget. 6:30472–30486. 2015.
View Article : Google Scholar : PubMed/NCBI
|
|
29
|
Corcoran RB, Dias-Santagata D, Bergethon
K, Iafrate AJ, Settleman J and Engelman JA: BRAF gene amplification
can promote acquired resistance to MEK inhibitors in cancer cells
Harboring the BRAF V600E Mutation. Ence Signaling.
3:ra842010.PubMed/NCBI
|
|
30
|
Ohashi K, Sequist LV, Arcila ME, Moran T,
Chmielecki J, Lin YL, Pan Y, Wang L, de Stanchina E, Shien K, et
al: Lung cancers with acquired resistance to EGFR inhibitors
occasionally harbor BRAF gene mutations but lack mutations in KRAS,
NRAS, or MEK1. Proc Natl Acad, USA 109. 109:E2127–E2133. 2012.
View Article : Google Scholar : PubMed/NCBI
|
|
31
|
Xiao W, Tang H, Wu M, Liao Y, Li K, Li L
and Xu X: Ozone oil promotes wound healing by increasing the
migration of fibroblasts via PI3K/Akt/mTOR signaling pathway.
Biosci Rep. 37:BSR201706582017. View Article : Google Scholar : PubMed/NCBI
|
|
32
|
Okada K, Nogami A, Ishida S, Akiyama H,
Chen C, Umezawa Y and Miura O: FLT3-ITD induces expression of Pim
kinases through STAT5 to confer resistance to the PI3K/Akt pathway
inhibitors on leukemic cells by enhancing the mTORC1/Mcl-1 pathway.
Oncotarget. 9:8870–8886. 2017. View Article : Google Scholar : PubMed/NCBI
|
|
33
|
Fu JH, Yang S, Nan CJ, Zhou CC, Lu DQ, Li
S and Mu HQ: miR-182 affects renal cancer cell proliferation,
apoptosis, and invasion by regulating PI3K/AKT/mTOR signaling
pathway. Eur Rev Med Pharmacol Sci. 24:72022020.PubMed/NCBI
|
|
34
|
Guoyin Z, Hao P, Min L, Wei G, Zhe C and
Changquan L: Antihepatocarcinoma effect of Portulaca
oleracea L. in Mice by PI3K/Akt/mTOR and Nrf2/HO-1/NF-κB
Pathway. Evid Based Complement Alternat Med. 2017:82313582017.
View Article : Google Scholar : PubMed/NCBI
|
|
35
|
Kim GD: Myricetin inhibits angiogenesis by
inducing apoptosis and suppressing PI3K/Akt/mTOR signaling in
endothelial cells. J Cancer Prev. 22:219–227. 2017. View Article : Google Scholar : PubMed/NCBI
|
|
36
|
Chen J, Crawford R and Xiao Y: Vertical
inhibition of the PI3K/Akt/mTOR pathway for the treatment of
osteoarthritis. J Cell Biochem. 114:245–249. 2013. View Article : Google Scholar : PubMed/NCBI
|
|
37
|
Burris HA III: Overcoming acquired
resistance to anticancer therapy: Focus on the PI3K/AKT/mTOR
pathway. Cancer Chemother Pharmacol. 71:829–842. 2013. View Article : Google Scholar : PubMed/NCBI
|
|
38
|
Zhang HY, Zhang PN and Sun H: Aberration
of the PI3K/AKT/mTOR signaling in epithelial ovarian cancer and its
implication in cisplatin-based chemotherapy. Eur J Obstet Gynecol
Reprod Biol. 146:81–86. 2009. View Article : Google Scholar : PubMed/NCBI
|
|
39
|
Cheng H, Shcherba M, Pendurti G, Liang Y,
Piperdi B and Perez-Soler R: Targeting the PI3K/AKT/mTOR pathway:
Potential for lung cancer treatment. Lung Cancer Manag. 3:67–75.
2014. View Article : Google Scholar : PubMed/NCBI
|
|
40
|
Xu JL, Wang ZW, Hu LM, Yin ZQ, Huang MD,
Hu ZB, Shen HB and Shu YQ: Genetic Variants in the
PI3K/PTEN/AKT/mTOR pathway predict Platinum-based chemotherapy
response of advanced non-small cell lung cancers in a Chinese
population. Asian Pac J Cancer Prev. 13:2157–2162. 2012. View Article : Google Scholar : PubMed/NCBI
|
|
41
|
Zhang Q, Lai S, Hou X, Cao W, Zhang Y and
Zhang Z: Protective effects of PI3K/Akt signal pathway induced cell
autophagy in rat knee joint cartilage injury. Am J Transl Res.
10:762–770. 2018.PubMed/NCBI
|
|
42
|
Cheriyan VT, Alsaab H, Sekhar S, Venkatesh
J, Mondal A, Vhora I, Sau S, Muthu M, Polin LA, Levi E, et al: A
CARP-1 functional mimetic compound is synergistic with
BRAF-targeting in non-small cell lung cancers. Oncotarget.
9:29680–29697. 2018. View Article : Google Scholar : PubMed/NCBI
|
|
43
|
Oei AL, van Leeuwen CM, Ahire VR,
Rodermond HM, Ten Cate R, Westermann AM, Stalpers LJA, Crezee J,
Kok HP, Krawczyk PM, et al: Enhancing synthetic lethality of
PARP-inhibitor and cisplatin in BRCA-proficient Tumour cells with
hyperthermia. Oncotarget. 8:28116–28124. 2017. View Article : Google Scholar : PubMed/NCBI
|
|
44
|
An SH, Kang JH, Kim DH and Lee MS: Vitamin
C increases the apoptosis via up-regulation p53 during cisplatin
treatment in human colon cancer cells. BMB Rep. 44:211–216. 2011.
View Article : Google Scholar : PubMed/NCBI
|
|
45
|
Heymann PGB, Henkenius KSE, Ziebart T,
Braun A, Hirthammer K, Halling F, Neff A and Mandic R: Modulation
of tumor cell metabolism by laser photochemotherapy with cisplatin
or zoledronic acid in vitro. Anticancer Res. 38:1291–1301.
2018.PubMed/NCBI
|
|
46
|
Nolte E, Wach S, Silva IT, Lukat S, Ekici
AB, Munkert J, Müller-Uri F, Kreis W, Oliveira Simões CM, Vera J,
et al: A new semisynthetic cardenolide analog
3β-[2-(1-amantadine)-1-on-ethylamine]-digitoxigenin (AMANTADIG)
affects G2/M cell cycle arrest and miRNA expression profiles and
enhances proapoptotic survivin-2B expression in renal cell
carcinoma cell lines. Oncotarget. 8:11676–11691. 2017. View Article : Google Scholar : PubMed/NCBI
|
|
47
|
Xu C, Sun G, Yuan G, Wang R and Sun X:
Effects of Platycodin D on proliferation, apoptosis and PI3K/Akt
Signal Pathway of Human Glioma U251 Cells. Molecules.
19:21411–21423. 2014. View Article : Google Scholar : PubMed/NCBI
|
|
48
|
Li H, Hu J, Wu S, Wang L, Cao X, Zhang X,
Dai B, Cao M, Shao R, Zhang R, et al: Auranofin-mediated inhibition
of PI3K/AKT/mTOR axis and anticancer activity in non-small cell
lung cancer cells. Oncotarget. 7:3548–3558. 2016. View Article : Google Scholar : PubMed/NCBI
|
|
49
|
Ma HP, Kong WX, Li XY, Li W, Zhang Y and
Wu Y: miRNA-223 is an anticancer gene in human non-small cell lung
cancer through the PI3K/AKT pathway by targeting EGFR. Oncol Rep.
41:1549–1559. 2019.PubMed/NCBI
|
|
50
|
Wang H, Yu Z, Huo S, Chen Z, Ou Z, Mai J,
Ding S and Zhang J: Overexpression of ELF3 facilitates cell growth
and metastasis through PI3K/Akt and ERK signaling pathways in
non-small cell lung cancer. Int J Biochem Cell Biol. 94:98–106.
2018. View Article : Google Scholar : PubMed/NCBI
|