Introduction
In 2018, esophageal cancer was the seventh leading
cause of cancer-associated mortality and the sixth leading cause of
morbidity worldwide (1). In
particular, patients in East Asian regions, including Japan, have
esophageal squamous cell carcinoma (ESCC), which is the most common
histopathological subtype in the region (2). The major tumor depth of ESCC is within
the subserosa of the esophagus; however, even in the shallower
depth, 30–50% of cases are identified with lymph node metastasis
(3). Therefore, numerous patients
are diagnosed at an advanced stage, and it can be difficult to
treat the disease with monotherapy. Accordingly, the standard
treatment for ESCC is esophagectomy combined with three-field
lymphadenectomy and neoadjuvant or adjuvant chemoradiation therapy
(4,5). Moreover, the immune checkpoint
inhibitor pembrolizumab has been approved as a second-line
treatment option by the United States Food and Drug Administration
(6,7); this therapeutic strategy is expected to
be widely applied.
It has been previously reported that patients with
ESCC with a high percentage of tumor-infiltrating lymphocytes
(TILs) exhibit significantly improved prognoses compared with
patients with a low percentage of TILs (8). Similar findings have been reported in
other gastrointestinal cancers (9–13),
suggesting that the existence of immune cells, particularly
lymphocytes, in the tumor region is important for fighting the
disease. TILs include components of the T-cell subsets including
cytotoxic T cells, memory T cells, helper T cells and regulatory T
cells (14–16). The TIL component balance determines
the immunologic anti- or pro-tumor effect (17). Therefore, analysis of the patterns of
TIL subsets may reveal the most appropriate antitumor effect.
Furthermore, T-cell receptors (TCRs) on the surface
of T cells specifically recognize the antigens presented on major
histocompatibility complex molecules on tumor cells. TCRs are
composed of α and β chains. Both chains have variable (V) and
joining (J) regions that depend on the TCRα and TCRβ DNA
rearrangements during T-cell maturation, and function to maintain
TCR diversity to allow specific TCR recognition of various
pathogens invading into the body or of harmful malfunctioning cells
(18).
The tumor tissue is an aggregation of heterogeneous
tumor cells; therefore, the existence of T cells expressing diverse
TCRs is essential for effective antitumor immune responses
(19–21). Additionally, among the diverse TCRs,
identification of tumor-specific shared TCR sequences, including
TCR gene rearrangements, may facilitate the development of novel
immune therapies, such as chimeric antigen receptor T (CAR-T) cell
therapy (22).
Previously, comprehensive TCR sequence analysis was
laborious due to the huge TCR diversity; however, next-generation
sequencing (NGS) technologies now enable the investigation of the
numerous TCR repertoires. Accordingly, the primary objective of the
present study was to investigate the diversity of the TCR
repertoire and explore the shared TCR repertoire on T cells within
the tumor environment of patients with ESCC, using a combination of
adaptor ligation PCR and NGS. The secondary objective was to assess
the impact of the T-cell subset pattern on the immuno relation (IR)
group in patients with ESCC.
Materials and methods
Patients and institutional review
board approval
In total, 124 patients with ESCC underwent
esophagectomy at the Department of Surgery of Kurume University
Hospital (Kurume, Japan) between April 2013 and March 2017. Among
these patients, the cases with neoadjuvant chemotherapy and a lack
of clinical information cases were excluded from the study, and a
total of 53 cases were enrolled in the present study. An overview
of the patients' characteristics, pathological staging and
clinicopathological factors is shown in Table SI. All patients underwent subtotal
esophagectomy, including three-field lymphadenectomy. Additional
adjuvant chemotherapy was performed after surgery in patients with
pathological lymph node metastasis. Patients were regularly checked
every 3 months in the first year and following every 6 months for 5
years after surgery. The mean observation period after surgery was
565±525.54 days. TNM classification (8th edition) was used for
clinical and pathological staging (23). Written informed consent was obtained
from all enrolled patients. The patient selection process,
clinicopathological information obtained during analysis and
experimental protocol of the present study complied with the
guidelines approved by the Ethics Committee of Kurume University
School of Medicine (approval no. 282).
Immunohistochemical (IHC) staining. Formalin-fixed
(10% at room temperature for 48 h) paraffin-embedded tissue samples
were sliced to a thickness of 4 µm and examined on coated glass
slides. The tissues were deparaffinized and labeled with antibodies
using a BenchMark ULTRA (Ventana Medical Systems, Inc.) and
Bond-Max autostainer (Leica Microsystems, Inc.). Each slide was
heat-treated using CC1 retrieval solution (Ventana Medical Systems,
Inc.) at 99°C for 60 min and incubated with the primary antibody at
room temperature for 30 min, followed by incubation with a
streptavidin-biotin complex using 3,3′-diaminobenzidine (UltraVIEW
DAB detection kit; Ventana Medical Systems, Inc.) as the chromogen.
The following primary antibodies were used: Anti-CD3 (1:300; clone
LN10; cat. no. CD3-565-L-CE; Leica Microsystems, Inc.), anti-CD8
(1:200; clone 4B11; cat. no. CD8-4B11-L_CE; Leica Microsystems,
Inc.), anti-CD45RO (1:5,000; clone UCLH1; cat. no. Ab23; Abcam),
anti-FOXP3 (1:100; Abcam), anti-CD274/programmed cell death 1
ligand 1 (PD-L1; 1:100; clone E1L3N; cat. no. 13684; Cell Signaling
Technology, Inc.), anti-human leukocyte antigen (HLA) class I
(1:1,000; cat. no. ab52922; Abcam) and anti-cytokeratin (AE1/AE3;
1:400; cat. no. GA05361-2; Dako; Agilent Technologies, Inc.).
IHC evaluation of CD3, CD8, CD45RO,
FOXP3, CD274, HLA class I and AE1/AE3
A digital pathology procedure was used to evaluate
the prepared slides to avoid the subjectivity of evaluation by
pathologists. All of the routinely stained hematoxylin and eosin
(H&E) slides- and IHC-stained slides were captured by the
NanoZoomer XR digital scanner (Hamamatsu Photonics KK), and digital
data were acquired. For analysis of CD3, CD8, FOXP3 and CD45RO,
five positions within the center of the tumor (CT) and along the
invasive margin (IM) of the tumor were selected, and images at ×20
magnification were captured and digitized (Fig. S1). For CD274, HLA class I and
AE1/AE3, images at ×1.25 magnification were captured and processed
using ImageJ v1.41 (National Institutes of Health) image-processing
software (24). Briefly, a color
deconvolution procedure was performed on the original images,
red-colored images were selected, and binary images were generated.
For binary images of CD3, CD8, FOXP3 and CD45RO, five positions
were selected, within the CT and IM of the tumor, and the numbers
of dots representing T cells were counted. The median staining
intensity values at the CT and IM were calculated. For binary
images of CD274, HLA class I and AE1/AE3, the tumor area was
calculated, and the expression of CD274 was standardized by
dividing the value by that of AE1/AE3. Similarly, the expression of
HLA class I on the tumor was obtained using the same procedure
(Figs. S2 and S3).
Positive staining for CD3, CD8, FOXP3 and CD45RO was
limited in lymphocytes. Digital evaluation of these markers was
performed by counting the positive dots. Positive evaluation of
CD274, HLA class I and AE1/AE3 in a tumor was complex since
positive staining was observed in tumor cells and adjacent
surrounding structures. Therefore, the value of positive area of
each marker was calculated, and this value was standardized by the
area of AE1/AE3 representing epithelial cells.
Identification for IR groups and
further subset stratification
To elucidate the involvement of lymphocytes and
relevant molecules in ESCC, the expression values calculated with
ImageJ for CD3, CD8, CD45RO, FOXP3, CD274 and HLA were utilized.
Principal component analysis (PCA) (25,26) was
performed using the K-means clustering method and the entered cases
were divided into two groups. The group showing the same vector
pattern of all the markers through the PCA was defined as IR high
(IR-Hi) group (n=21) and the other group showing no such trend was
defined as IR low (IR-Lo) group (n=32).
Hierarchical clustering analysis with the Ward
method was conducted to exploratively visualize the level of T-cell
subset involvement in the IR-Hi group. The analysis was performed
using JMP v13.0 software (SAS Institute, Inc.).
RNA extraction
Small sections of tumor tissues and corresponding
normal tissues were collected and stored in RNAlater reagent
(Thermo Fisher Scientific, Inc.) at −80°C until use. mRNA was
extracted from the tissue sections using an AllPrep kit (Qiagen
GmbH) according to the manufacturer's protocol. The extracted mRNA
samples were stored at −80°C until use for TCR analysis.
Unbiased amplification of TCR genes
and NGS
Among the 53 cases included in the cluster analysis,
the stored mRNA samples five cases from each of the IR-Hi and IR-Lo
groups were randomly selected for unbiased TCR amplification by
reverse transcription (RT)-PCR followed by NGS. An NGS technology
for unbiased TCR repertoire analysis developed by Repertoire
Genesis Inc. was used. Briefly, unbiased adaptor ligation RT-PCR
was performed as described previously (27). Total RNA was reverse transcribed into
cDNA using Superscript III reverse transcriptase (Invitrogen;
Thermo Fisher Scientific, Inc.) and the BSL-18E primer containing
polyT18 as previously reported (27) and a NotI site. The second
strand of the cDNA was synthesized using Escherichia coli
DNA polymerase I (Invitrogen; Thermo Fisher Scientific, Inc.),
E. coli DNA ligase (Invitrogen; Thermo Fisher Scientific,
Inc.) and RNase H (Invitrogen; Thermo Fisher Scientific, Inc.). The
double-stranded cDNA fragments were blunt-ended using T4 DNA
polymerase (Invitrogen; Thermo Fisher Scientific, Inc.). The
P10EA/P20EA adapter was ligated to the 5′ end of the
double-stranded cDNA and then digested with the NotI
restriction enzyme at 37°C for 2 h. After removal of adaptor and
primer sequences using a MinElute Reaction Cleanup kit (Qiagen
GmbH), according to the manufacturer's instructions, PCR was
performed using KAPA HiFi DNA Polymerase (Kapa Biosystems; Roche
Diagnostics) and a primer specific to either the TCR α-chain
constant region (CA1) or β-chain constant region (CB1), and a
primer specific to P20EA (27). The
primer sequences used in the PCR method are available in Table SII (28). The PCR conditions were as follows: 20
cycles of 98°C for 20 sec, 65°C for 30 sec and 72°C for 1 min. The
second PCR was performed using either the CA2 or CB2 primers and
the P20EA primer under the same PCR conditions. Amplicons were
prepared by amplification of the second PCR products using
P20EA-ST1 and either CA-ST1 or CB-ST1 (27). After PCR amplification, index
(barcode) sequences were added using the Nextera XT Index kit v2,
Set A (Illumina, Inc.). The indexed amplicon products were mixed at
equimolar concentrations and quantified using the Qubit 2.0
Fluorometer (Thermo Fisher Scientific, Inc.). Sequencing was
performed using the Illumina MiSeq paired-end platform (2×300
bp).
TCR repertoire analyses
All the paired-end reads were classified based on
index sequences. Assignment of sequences was performed by
determining sequences with the highest identity in a dataset of
reference sequences from the international ImMunoGeneTics
information system® (IMGT) database (http://www.imgt.org). Data processing, assignment and
data aggregation were automatically performed using repertoire
analysis software originally developed by Repertoire Genesis (RG)
Inc.; the RG software ver.1.0 is composed of sequence homology
searches using BLATN, an automatic aggregation program, a graphics
program for TCR variant (TRV) and TCR Joining (TRJ) usage, and CDR3
length distribution. Sequence identities at the nucleotide level
between query and entry sequences were automatically calculated.
Parameters that increased sensitivity and accuracy (E-value
threshold, minimum kernel and high-scoring segment pair score) were
carefully optimized for respective repertoire analysis. Nucleotide
sequences of CDR3 regions, ranging from the conserved cysteine at
position 104 (Cys104) of IMGT nomenclature to the conserved
phenylalanine at position 118 (Phe118) and the following glycine
(Gly119), were translated to deduce the amino acid sequences. A
unique sequence read (USR) was defined as a sequence read having no
identity in TRV or TRJ and in the deduced amino acid sequence of
CDR3 with the other sequence reads. The copy numbers of identical
USRs were automatically counted by RG software in each sample and
then ranked in order of the copy number. Percentage occurrence
frequencies of sequence reads with TCRα variable (TRAV), TCRα
joining (TRAJ), TCRβ variable (TRBV) and TCRβ joining (TRBJ) genes
in total sequence reads were calculated.
Statistical analysis and evaluation of
the TCR repertoire dissimilarity in each case
The acquired NGS data were processed for a complete
comprehensive analysis of the TCR repertoire. The combinations of
the TRAV and TRAJ regions and the TRBV and TRBJ regions that were
significantly (P<0.05) and commonly elevated in the IR-Hi group
were selected as the shared combination of the TRAV|TRAJ and
TRBV|TRBJ repertoire.
Fisher's exact test was performed using the
Bioconductor package edgeR in R (v3.4.2) (Foundation for
Statistical Computing, http://www.r-project.org/foundation) (29,30) to
retrieve these analyses. To further ensure the significance of the
shared combination of TRAV|TRAJ and TRBV|TRBJ repertoire, Mann
Whitney U tests were simultaneously conducted and the combinations
with P<0.05 in both tests were selected as statistically
significant.
Dissimilarity analysis of each case (cases 1–10) was
conducted using the average repertoire dissimilarity index (RDI)
analysis (31,32). The average RDI was calculated using
the following procedure. The singleton repertoires were retracted
from the TCR repertoire combinations data identified as
statistically significant in previous analyses and 500 repertoire
combinations were randomly collected using the bootstrap
restoration extractive maneuver. The frequency of each repertoire
was calculated using the calcVDJcounts function in the RDI package
(https://rdocumentation.org/packages/rdi/versions/1.0.0)
(ver.1.0.0) of R (ver.3.6.1). The RDIs were acquired for each case
using the calcRDI() function, and the average values of the RDIs
were calculated. Cases in which RDI was difficult to calculate
owing to the low frequency were considered not determined and
inserted into the matrix of a table. All RDI values of repertoires
were described in the upper right columns and rows. The RDI values
showing significant similarities based on both Fisher's exact tests
and Mann Whitney U tests were described in the lower left columns
and rows.
Other statistical analyses
Clinicopathological variables and IHC data were
analyzed using JMP v13.0. software. The associations between the
clinicopathological factors and IR groups were assessed using
unpaired Student's t-test, χ2 tests and the Fisher's
exact tests. Postoperative recurrence-free survival (RFS) and
cancer-specific survival (CSS) rates were calculated using the
Kaplan-Meier method, and differences in survival between groups
were compared using the log-rank test. Comparisons of each T-cell
subset marker CD274 and HLA were performed using the Kruskal-Wallis
test followed by Dunn's test. P<0.05 was considered to indicate
a statistically significant difference.
Results
Identification of IR group and
clinicopathological analyses
In total, 53 patients with surgically treated ESCC
were enrolled in the present study. IHC staining analysis with
T-cell subset markers and relevant immune checkpoint molecule
markers was performed. As shown in Fig.
S4, the expression of each T-cell marker was significantly
increased in IM than in CT. Additionally, the expression levels of
each marker were significantly correlated between the IM and CT via
linear regression analysis (Fig.
S5).
The 53 patients in the present study were divided
into two clusters according to the PCA. As shown in Fig. 1A, the target cases were classified
into Cluster_1 (n=32) and Cluster_2 (n=21) and the utilized markers
were all concentrated in Cluster_2. Thus, Cluster_1 and Cluster_2
were defined as the IR-Lo and IR-Hi groups, respectively.
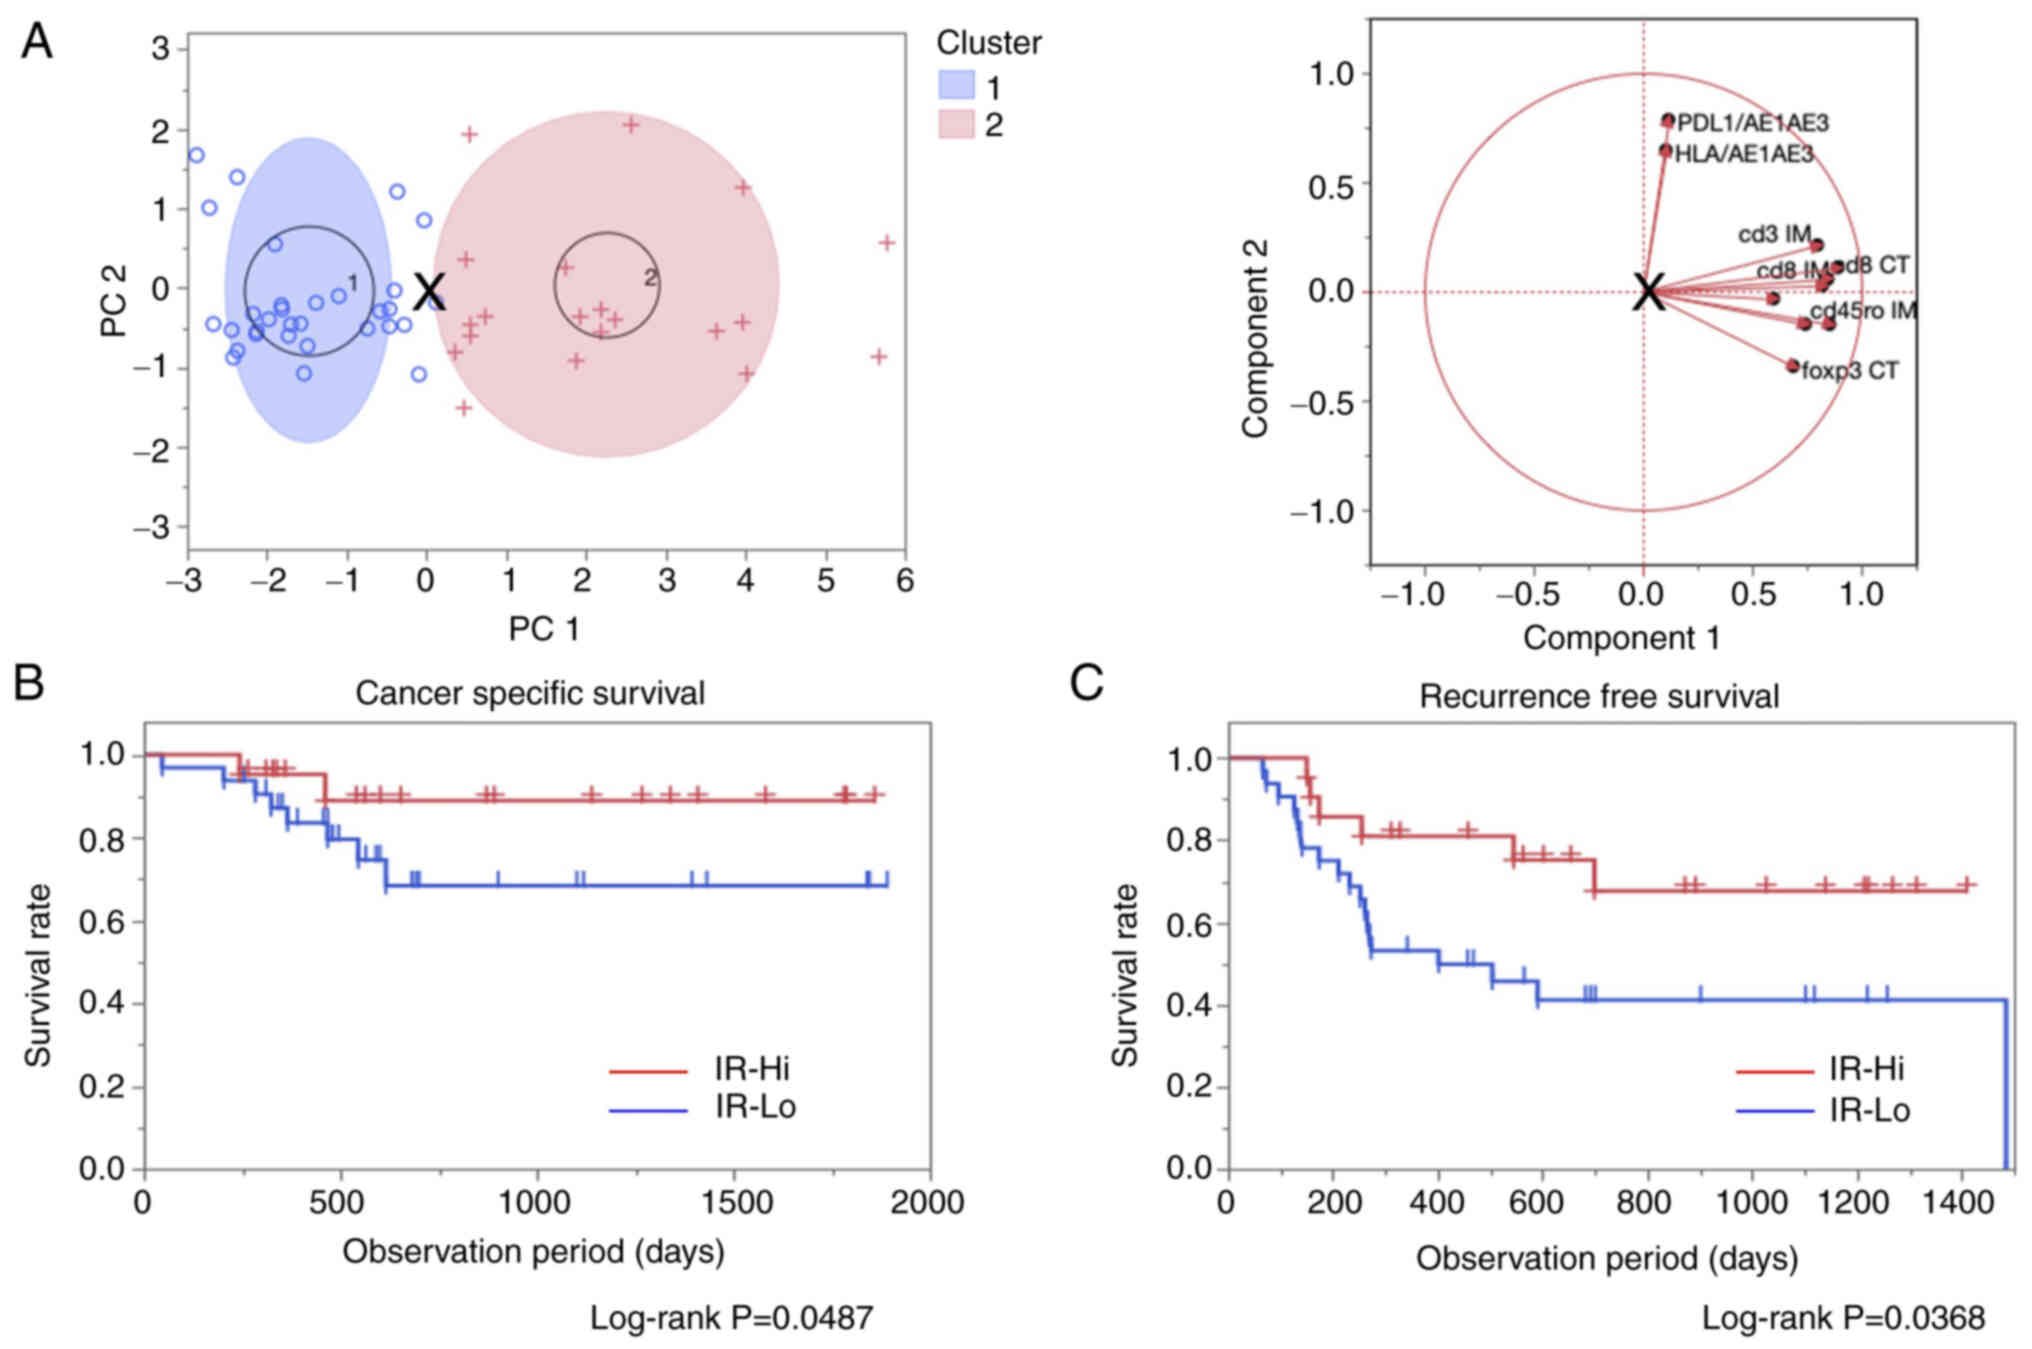 | Figure 1.Identification for IR groups using
PCA with K-means method and prognostic comparison using the
log-rank test. (A) Overview of the PCA with K-means clustering
method (left). Each blue circle and red cross marks indicate
classified cases into cluster 1 (IR-Lo) and cluster 2 (IR-Hi). The
blue and red ellipses indicate 95% confidence areas. The ‘X’ mark
in the middle of the figure indicates a specific point to divide
the cases into two clusters. Correlative direction diagram in each
parameter used in the calculation by PCA (right). Introduced values
to determine PC1 and PC2 were calculated using the values for the
CT and IM for CD3, CD8, CD45RO, FOXP3, CD274 and HLA. The length
and direction of each line indicate the strength and the
correlation similarity between each parameter. (B) Cancer-specific
survival and (C) recurrence-free survival comparison between the
IR-Hi and IR-Lo groups. Both survival curves were compared using
log-rank tests, and results with P<0.05 were considered
statistically significant. + and | indicate censored events in each
group. PCA, principal component analysis; PC1/2, principal
component 1/2; IR, immuno relation; Hi, high; Lo, low; CT, center
of the tumor; IM, invasive margin; HLA, human leukocyte
antigen. |
The impact of the immune involvement on the
prognosis of patients was assessed by comparing results between the
IR-Hi and IR-Lo groups. CSS and RFS rates were significantly
improved in the IR-Hi group compared with in the IR-Lo group
(Fig. 1B and C). Clinicopathological
variables were compared between the IR-Hi and IR-Lo groups to
reveal the immune involvement and clinical features. There were no
significant differences in patients' age, sex, tumor depth,
lymphatic and vascular invasion, tumor infiltrating pattern, tumor
grading, pathological stage and pathological prognostic group;
however, lymph node metastasis was relatively higher in the IR-Lo
group than in the IR-Hi group (Table
I).
 | Table I.Comparisons of clinicopathological
variables between the IR-Hi (n=21) and IR-Lo (n=32) groups in 53
patients with esophageal squamous cell carcinoma. |
Table I.
Comparisons of clinicopathological
variables between the IR-Hi (n=21) and IR-Lo (n=32) groups in 53
patients with esophageal squamous cell carcinoma.
| Clinicopathological
variable | IR-Hi (n=21) | IR-Lo (n=32) | P-value |
|---|
| Age ± SD,
years | 69.33±6.59 | 69.44±7.13 | 0.9575a |
| Sex,
male/female | 17/4 | 27/5 |
>0.9990c |
| Tumor depth, n
(%) |
|
| 0.6871b |
|
T1-T2 | 7
(33.33) | 9
(28.13) |
|
|
T3-T4 | 14 (66.67) | 23 (71.88) |
|
| Lymphatic invasion,
n (%) |
|
| 0.0179b |
|
ly- | 12 (63.16) | 7
(36.84) |
|
|
ly+ | 9
(36.84) | 25 (73.53) |
|
| Vascular invasion,
n (%) |
|
| 0.4561c |
| v- | 5
(23.81) | 4
(12.50) |
|
| v+ | 16 (76.19) | 28 (87.50) |
|
| INF isoform, n
(%) |
|
| 0.4561c |
| α | 5
(23.81) | 4
(12.50) |
|
|
β/γ | 16 (76.19) | 28 (87.50) |
|
| Lymph node
metastasis, n (%) |
|
| 0.1827b |
|
N0-N1 | 15 (71.43) | 17 (53.13) |
|
|
N2-N3 | 6
(28.58) | 15 (46.88) |
|
| Grading, n (%) |
|
| 0.1731b |
| G1 | 9
(42.86) | 8
(25.00) |
|
|
G2-G3 | 12 (57.14) | 24 (75.00) |
|
| TNM pathological
stage, n (%) |
|
| 0.2305b |
| Stage
I–II | 10 (47.62) | 10 (31.25) |
|
| Stage
III–IV | 11 (52.38) | 22 (68.75) |
|
| Pathological
prognostic group, n (%) |
|
| 0.2305b |
| Group
I–II | 10 (47.62) | 10 (31.25) |
|
| Group
III–IV | 11 (52.38) | 22 (68.75) |
|
TCR repertoire analysis
Initially, five patients were randomly selected from
the IR-Hi group. Subsequently, the five corresponding patients with
matched backgrounds were chosen from the IR-Lo group for
comprehensive TCR repertoire analysis using unbiased PCR
amplification and NGS analysis of TCR genes. The pathological
findings of the 10 ESCC cases are shown in Table II, and images of H&E-stained and
CD3 IHC tumor tissue samples are presented in Fig. S6.
| Table II.Overview of the pathological features
of the 10 cases included in the T-cell receptor repertoire
analysis. |
Table II.
Overview of the pathological features
of the 10 cases included in the T-cell receptor repertoire
analysis.
| A, IR-High |
|---|
|
|---|
| Case no. | Sex | Age, years | Tumor depth | Lymph node
metastasis | Distant
metastasis | Ly | V | TNM pathological
stagea | Histological
grading | Pathological
prognostic group | Operation
procedure |
|---|
| 1 | M | 58 | T3 | N2 | M0 | ly2 | v2 | IIIB | G3 | IIIB | Subtotal
esophagectomy+2-field lymphadenectomy |
| 2 | M | 67 | T3 | N2 | M0 | ly1 | v1 | IIIB | G1 | IIIB | Subtotal
esophagectomy+3-field lymphadenectomy |
| 3 | M | 70 | T3 | N2 | M0 | ly1 | v1 | IIIB | G1 | IIIB | Subtotal
esophagectomy+3-field lymphadenectomy |
| 4 | M | 70 | T3 | N1 | M0 | ly0 | v1 | IIB | G2 | IIB | Subtotal
esophagectomy+3-field lymphadenectomy |
| 5 | M | 72 | T1b | N0 | M0 | ly0 | v2 | IB | G2 | IB | Subtotal
esophagectomy+2-field lymphadenectomy |
|
| B,
IR-Low |
|
| Case
no. | Sex | Age,
years | Tumor
depth | Lymph node
metastasis | Distant
metastasis | Ly | V | TNM pathological
stagea | Histological
grading | Pathological
prognostic group | Operation
procedure |
|
| 6 | M | 67 | T1b | N0 | M0 | ly0 | v0 | IB | G2 | IB | Subtotal
esophagectomy+3-field lymphadenectomy |
| 7 | M | 64 | T3 | N0 | M0 | ly0 | v1 | IIIB | G2 | IIIB | Subtotal
esophagectomy+3-field lymphadenectomy |
| 8 | M | 72 | T2 | N0 | M0 | ly0 | v0 | IIA | G1 | IB | Subtotal
esophagectomy+3-field lymphadenectomy |
| 9 | M | 56 | T3 | N0 | M0 | ly0 | v1 | IIB | G1 | IIB | Subtotal
esophagectomy+3-field lymphadenectomy |
| 10 | M | 68 | T4a | N0 | M0 | ly1 | v1 | IIIB | G2 | IIIB | Subtotal
esophagectomy+3-field lymphadenectomy |
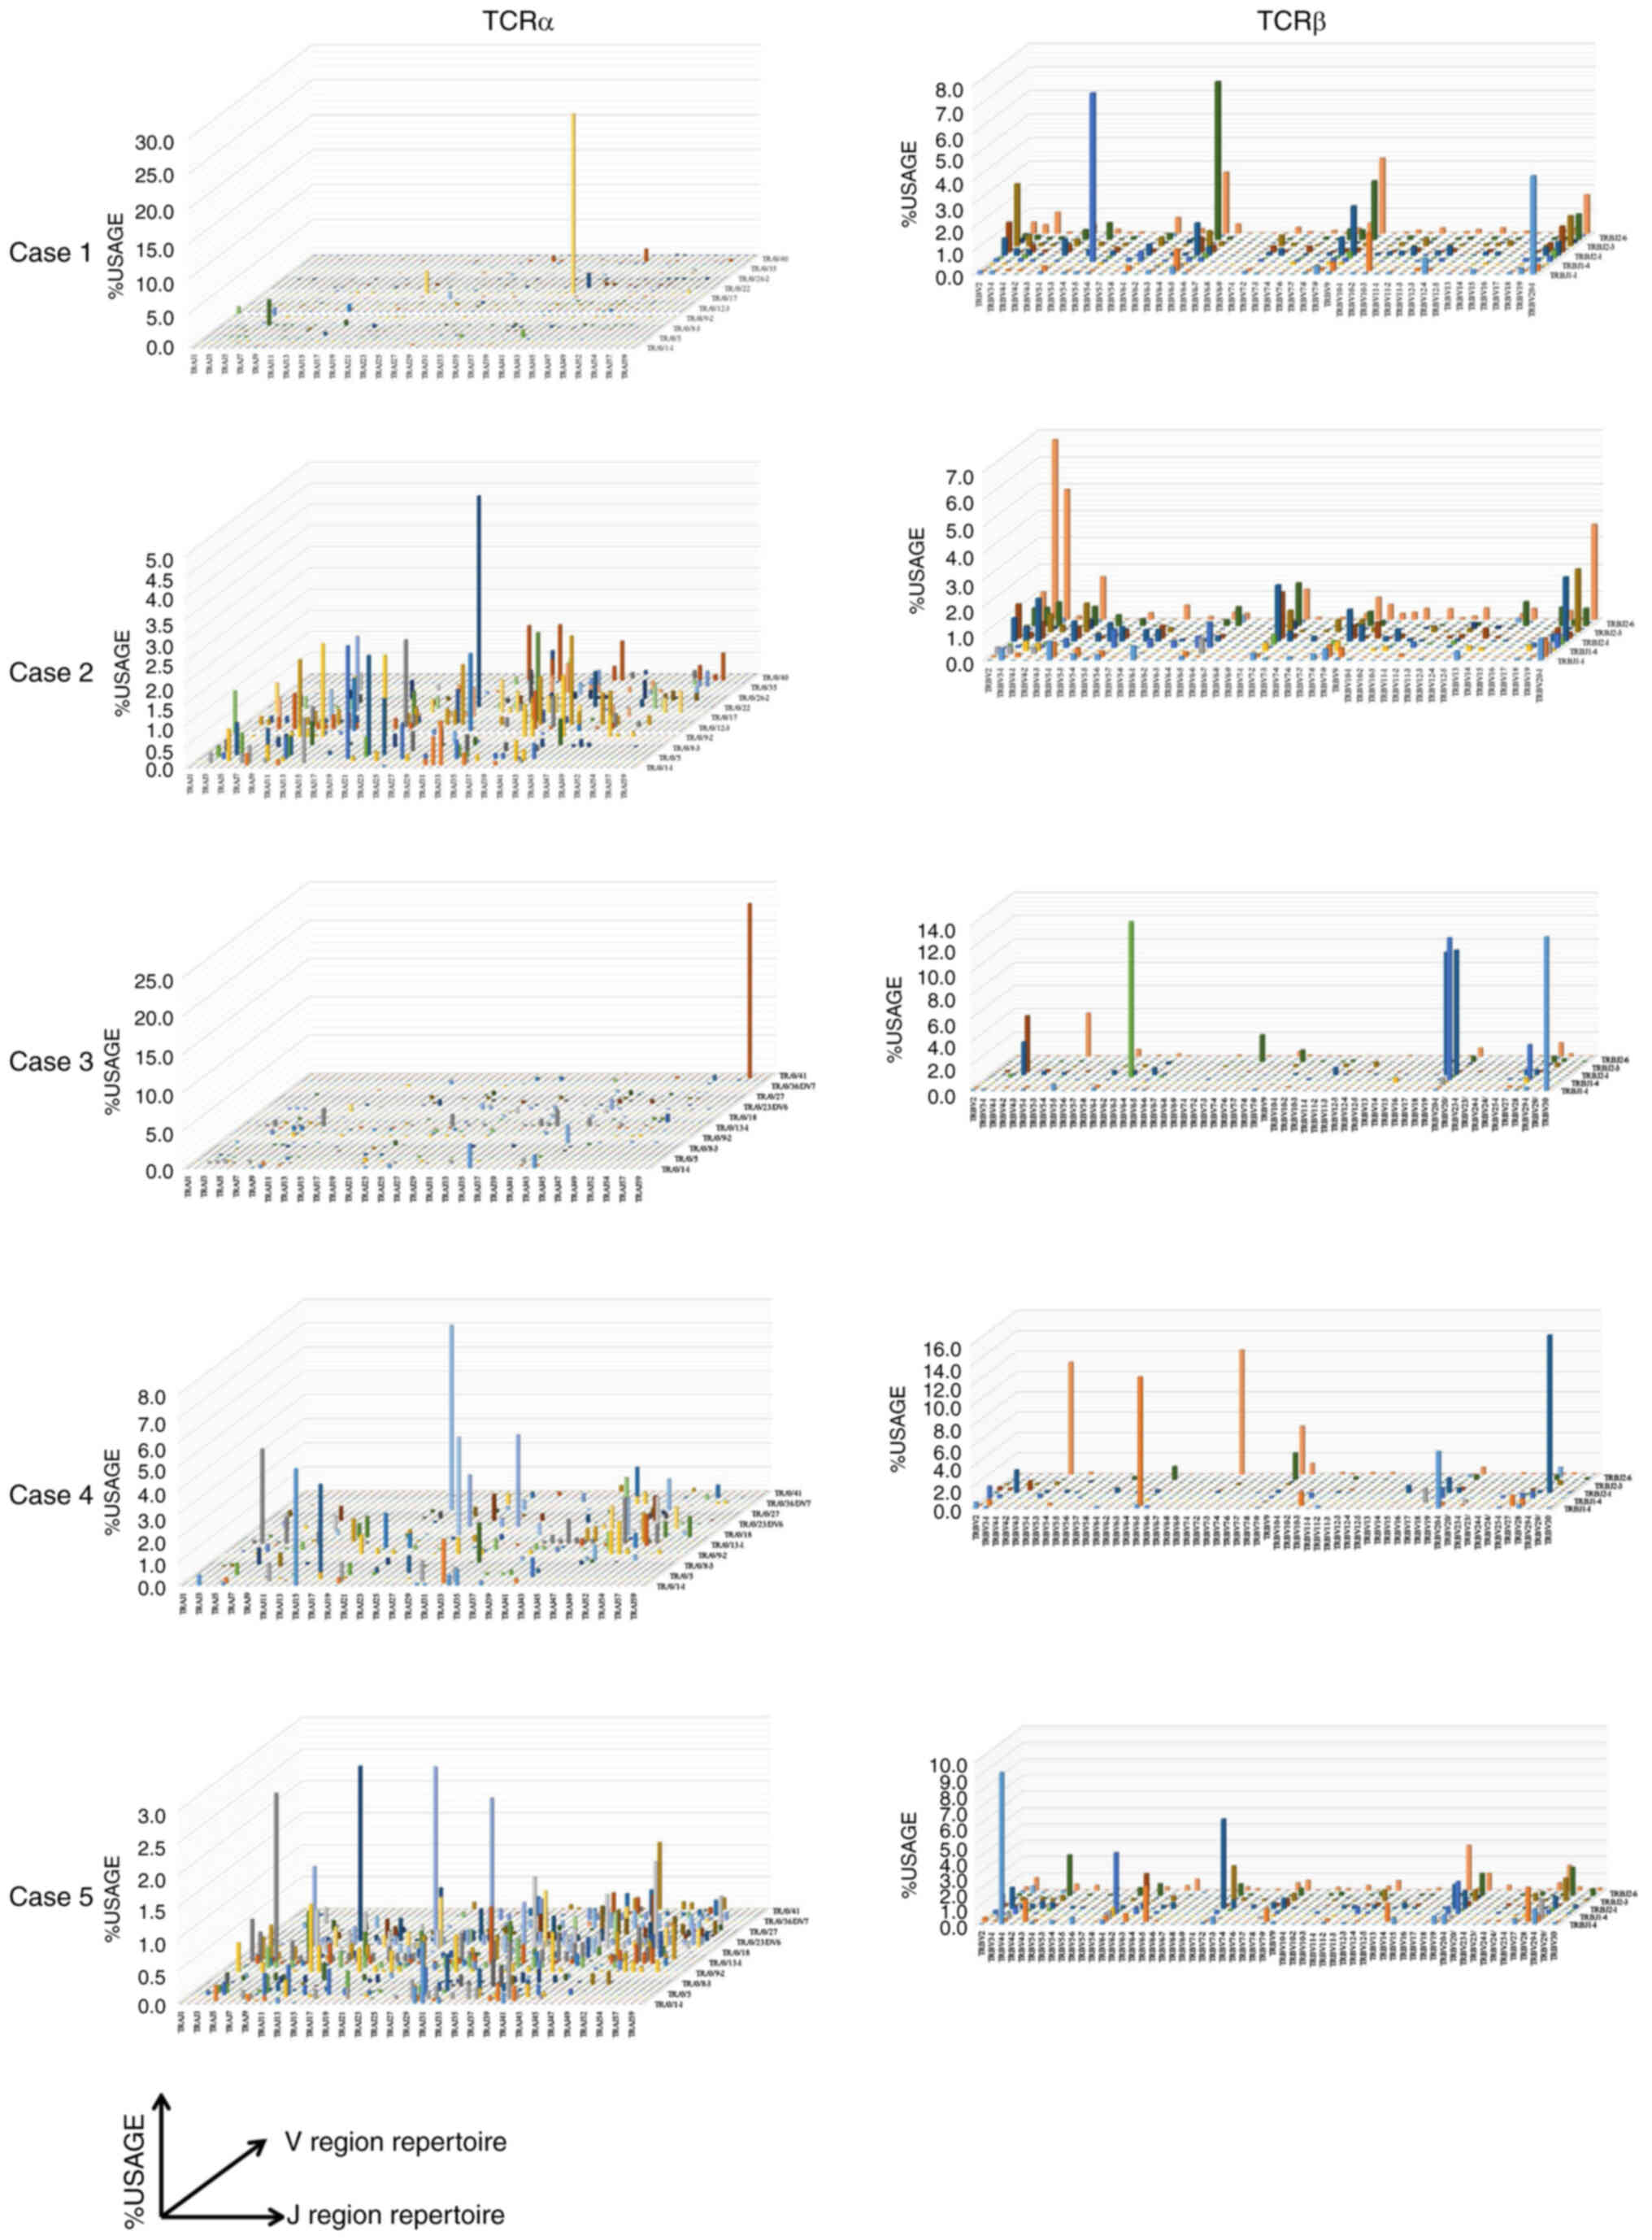
In the comprehensive analysis of the TCR repertoire,
1,671,742 and 1,291,510 total reads of the TCRα and TCRβ sequences,
respectively, were obtained from the 10 cases; of these reads,
31,954 and 34,876 were unique, respectively (Table SIII). In cases 1 and 3 in the IR-Hi
group, a single VJ region recombination amplification was observed
for TCRα, and the diversity of the TCRα repertoire seemed to be
lost. In case 1, 34,671 reads were obtained for recombination of
TRAV19|TRAJ41 regions. In case 3, 24,315 reads were obtained for
recombination of TRAV39|TRAJ58 regions. No other cases showed a
single recombinant repertoire amplification (Fig. 2). In terms of the IR-Lo group, case 9
showed a single VJ recombination amplification (TRAV19|TRAJ12) and
the reduction of its diversity in the TCRα repertoire. There seemed
to be no marked differences in TCR diversity between IR-Hi and
IR-Lo groups (Figs. 2 and S7). The subsequent investigation was
performed to compare the TCR repertoire differences between the
IR-Hi and the IR-Lo groups.
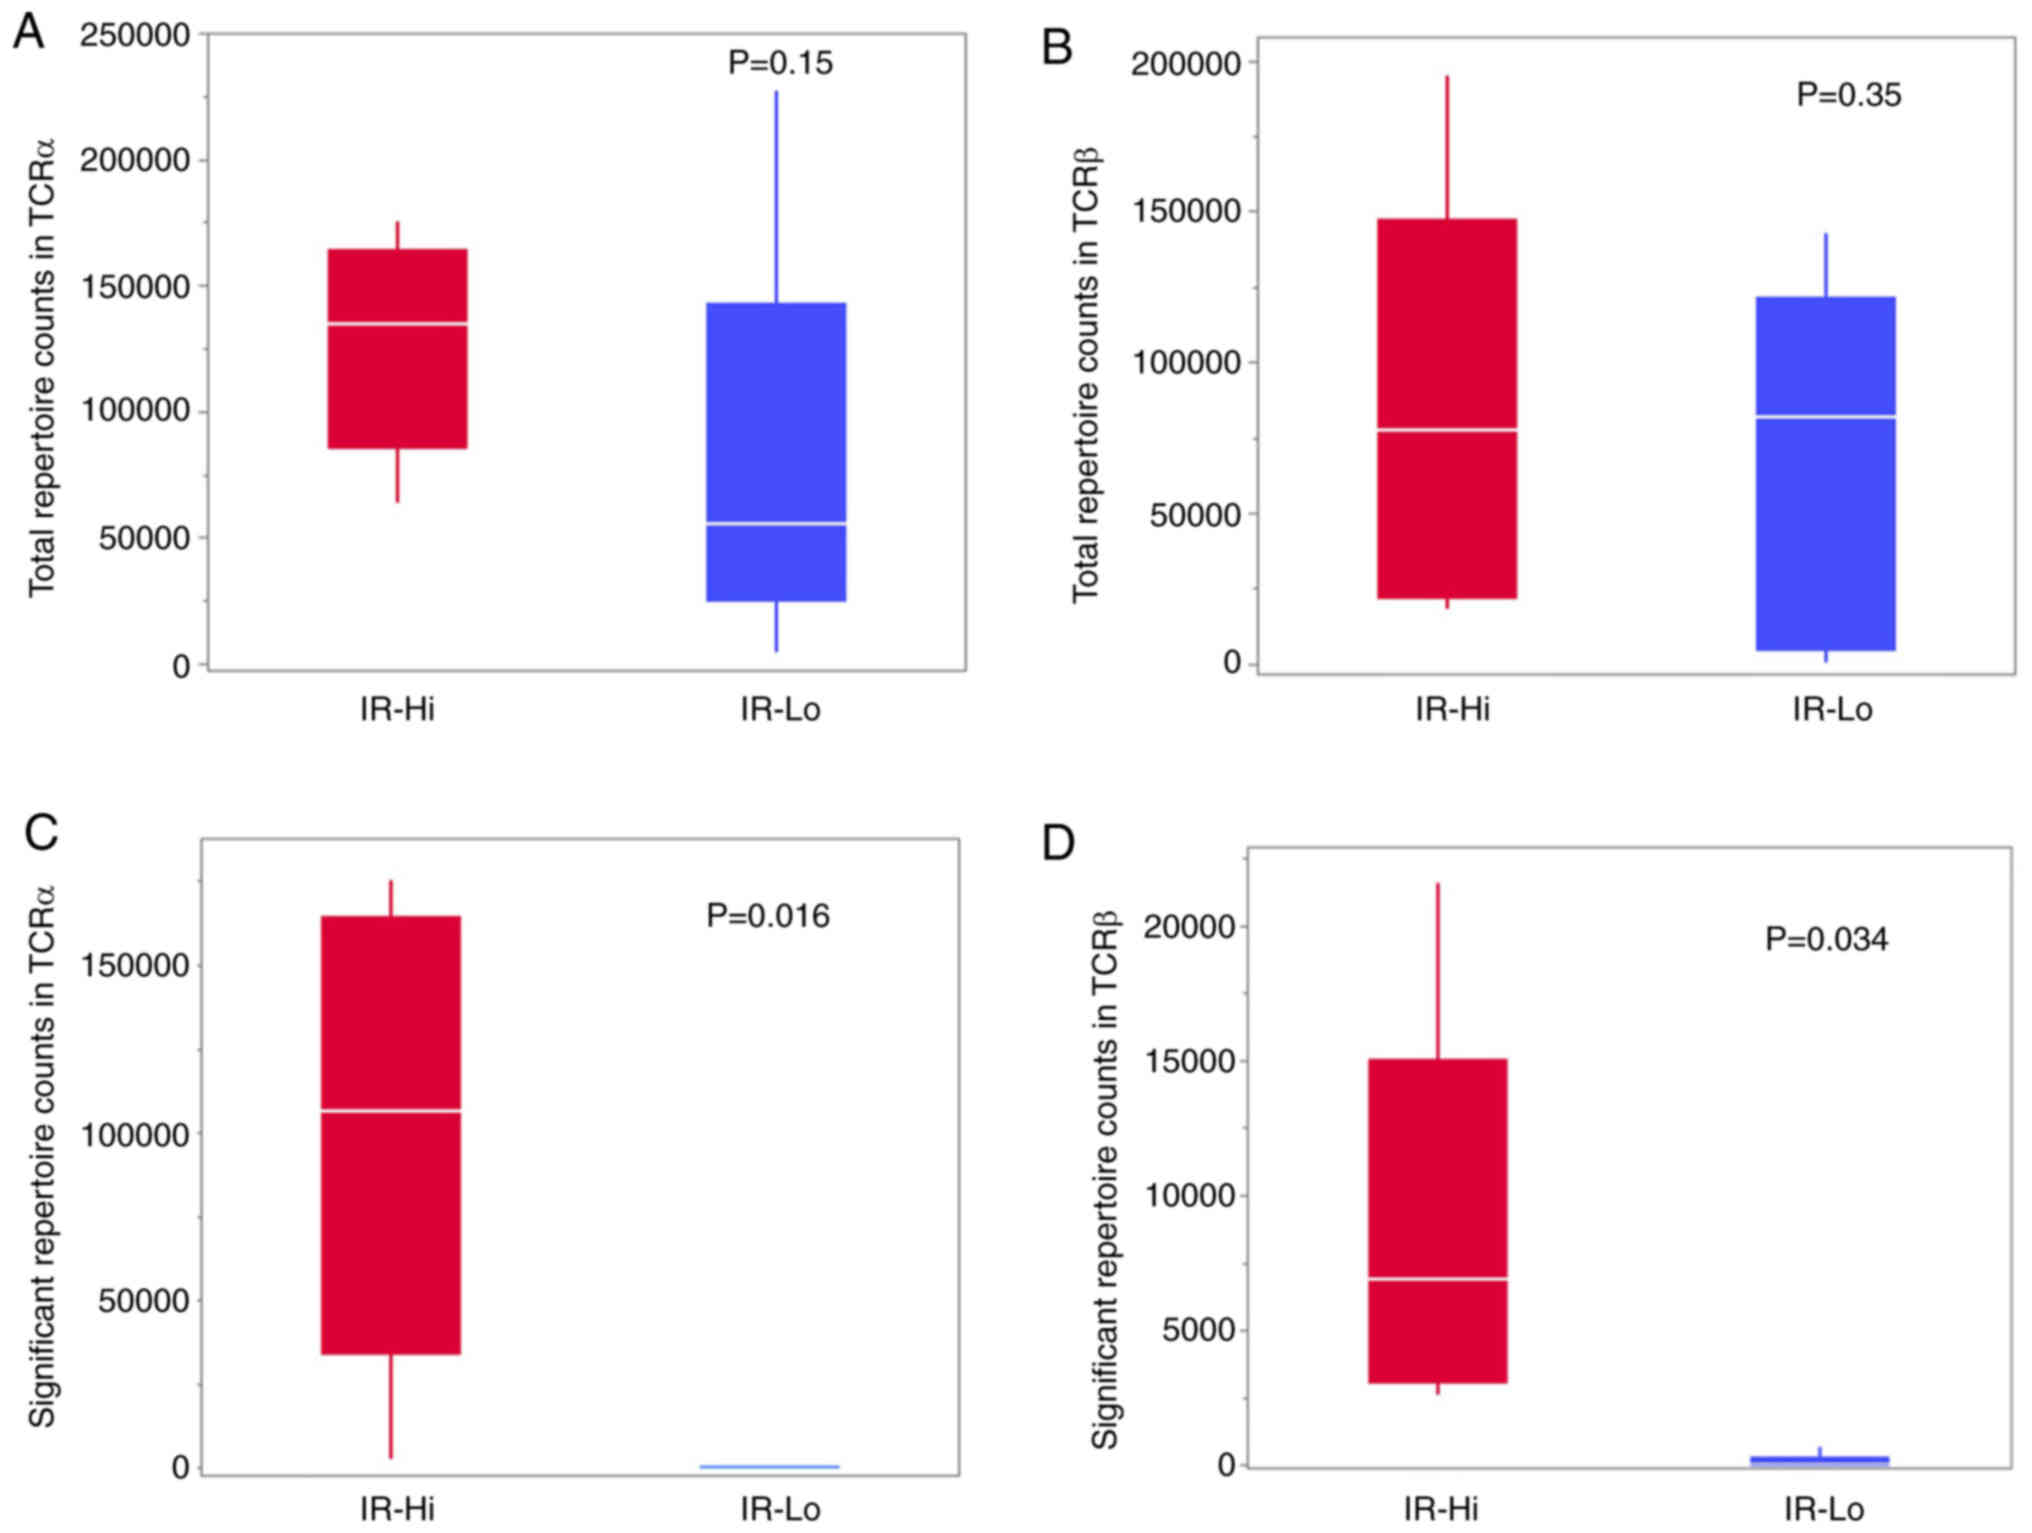
TCR repertoire dissimilarity analysis
and shared TCR VJ region
The RDI of the TCR was investigated to determine
whether there were diversities in the VJ regions in the IR-Hi
group. Among the 10 cases in which the indexes were investigated,
RDIs were conserved in the IR-Hi group; however, the index could
not be calculated in the IR-Lo group owing to the lack of
sufficient numbers in the repertoire. In TCRα and TCRβ, the rates
of significant diverse repertoires were 2–7 and 6–11%,
respectively, in the IR-Hi group; by contrast, there were no
diverse repertoires other than for case 8 for the TCRβ repertoire
in the IR-Lo group (Table III).
The total repertoire TCR counts of TCRα and TCRβ did not differ
significantly (Fig. 3A and B);
however, the significant repertoire TCR counts were significantly
higher in the IR-Hi group compared with in the IR-Lo group
(Fig. 3C and D).
| Table III.Evaluation of T-cell receptor α
repertoire dissimilarity using repertoire dissimilarity index. |
Table III.
Evaluation of T-cell receptor α
repertoire dissimilarity using repertoire dissimilarity index.
| A, T-cell receptor
α repertoire dissimilarity |
|---|
|
|---|
|
| High | Low |
|---|
|
|
|
|
|---|
| Immuno relation
group | Case 1 | Case 2 | Case 3 | Case 4 | Case 5 | Case 6 | Case 7 | Case 8 | Case 9 | Case 10 |
|---|
| High |
|
|
|
|
|
|
|
|
|
|
| Case
1 |
| 8.509702 | 8.508795 | 8.506906 | 8.51214 | 8.503504 | 8.507228 | 8.510379 | 8.49927 | 8.498511 |
| Case
2 | 8.254487 |
| 8.508038 | 8.506446 | 8.510183 | 8.499028 | 8.504402 | 8.508794 | 8.495203 | 8.492751 |
| Case
3 | 8.25659 | 8.253822 |
| 8.506592 | 8.510897 | 8.500547 | 8.503517 | 8.509322 | 8.496966 | 8.494865 |
| Case
4 | 8.254597 | 8.254819 | 8.256535 |
| 8.509006 | 8.500105 | 8.500935 | 8.505542 | 8.494539 | 8.496345 |
| Case
5 | 8.256147 | 8.253324 | 8.25111 | 8.256535 |
| 8.502894 | 8.5071 | 8.510353 | 8.500168 | 8.501201 |
| Low |
|
|
|
|
|
|
|
|
|
|
| Case
6 | n.d. | n.d. | n.d. | n.d. | n.d. |
| 8.496531 | 8.499098 | 8.477264 | 8.483806 |
| Case
7 | n.d. | n.d. | n.d. | n.d. | n.d. | n.d. |
| 8.504452 | 8.491961 | 8.492129 |
| Case
8 | n.d. | n.d. | n.d. | n.d. | n.d. | n.d. | n.d. |
| 8.498345 | 8.498308 |
| Case
9 | n.d. | n.d. | n.d. | n.d. | n.d. | n.d. | n.d. | n.d. |
| 8.498711 |
| Case
10 | n.d. | n.d. | n.d. | n.d. | n.d. | n.d. | n.d. | n.d. | n.d. |
|
| Significant
repertoire counts |
2,767 |
3,950 |
7,628 |
7,129 |
6,544 | 1 | 1 | 1 | 8 | 1 |
| Total repertoire
counts | 134,875 | 64,044 | 106,293 | 153,533 | 175,418 | 55,411 | 44,406 | 58,097 | 227,668 | 4,342 |
| Significant/total,
% | 2.05 | 6.17 | 7.18 | 4.64 | 3.73 | 0.00 | 0.00 | 0.00 | 0.00 | 0.02 |
|
| B, T-cell
receptor β repertoire dissimilarity |
|
|
| High | Low |
|
|
|
|
| Immuno relation
group | Case 1 | Case 2 | Case 3 | Case 4 | Case 5 | Case 6 | Case 7 | Case 8 | Case 9 | Case 10 |
|
| High |
|
|
|
|
|
|
|
|
|
|
| Case
1 |
| 8.501869 | 8.495595 | 8.489577 | 8.505926 | 8.490056 | 8.501935 | 8.496525 | 8.490997 | 8.485799 |
| Case
2 | 8.257919 |
| 8.496853 | 8.496798 | 8.503197 | 8.494402 | 8.500575 | 8.501094 | 8.488172 | 8.494946 |
| Case
3 | 8.256646 | 8.255981 |
| 8.480118 | 8.49145 | 8.480562 | 8.495326 | 8.494674 | 8.488092 | 8.471184 |
| Case
4 | 8.255262 | 8.254819 | 8.254376 |
| 8.496286 | 8.472485 | 8.492614 | 8.492866 | 8.481299 | 8.476389 |
| Case
5 | 8.257089 | 8.255206 | 8.254431 | 8.257642 |
| 8.494265 | 8.500012 | 8.500613 | 8.490941 | 8.488498 |
| Low |
|
|
|
|
|
|
|
|
|
|
| Case
6 | n.d. | n.d. | n.d. | n.d. | n.d. |
| 8.483006 | 8.484909 | 8.472864 | 8.469056 |
| Case
7 | n.d. | n.d. | n.d. | n.d. | n.d. | n.d. |
| 8.496313 | 8.488974 | 8.480548 |
| Case
8 | 8.253158 | 8.257365 | 8.253767 | 8.256369 | 8.256922 | n.d. | n.d. |
| 8.48754 | 8.483452 |
| Case
9 | n.d. | n.d. | n.d. | n.d. | n.d. | n.d. | n.d. | n.d. |
| 8.475119 |
| Case
10 | n.d. | n.d. | n.d. | n.d. | n.d. | n.d. | n.d. | n.d. | n.d. |
|
| Significant
repertoire counts |
21,542 |
8,594 |
3,492 |
2,571 |
4,859 | 13 | 9 | 650 | 4 | 2 |
| Total repertoire
counts | 195,125 | 99,868 | 25,345 | 17,991 | 77,260 | 8,358 | 81,919 | 100,537 | 142,663 | 336 |
| Significant/total,
% | 11.04 | 8.61 | 13.78 | 14.29 | 6.29 | 0.16 | 0.01 | 0.65 | 0.00 | 0.60 |
Among the significantly diverse TCRα and TCRβ
repertoire, the shared recombinant sequences in the VJ region were
explored. Fisher's exact tests were used, followed by Mann Whitney
U tests, to ensure the significance of the results. In total, 27
TRAV|TRAJ combinations for TCRα and 23 TRBV|TRBJ combinations for
TCRβ were identified as having shared repertoires (Table IV). In particular, in the IR-Hi
group, the read-out numbers for the combinations of TRAV13-1|TRAJ44
and TRAV13-1|TRAJ22 for TCRα and the combinations of
TRBV7-9|TRBJ2-7 and TRBV20-1|TRBJ1-1 for TCRβ were consistently
high.
| Table IV.List of TRAV|TRAJ and TRBV|TRBJ
recombinations shared across IR-Hi cases of esophageal squamous
cell carcinoma. |
Table IV.
List of TRAV|TRAJ and TRBV|TRBJ
recombinations shared across IR-Hi cases of esophageal squamous
cell carcinoma.
| A, TRAV|TRAJ
recombinations |
|---|
|
|---|
|
| IR-Hi | IR-Lo |
|
|
|
|
|
|
|---|
|
|
|
|
|
|
|
|
|
|
|---|
| Recombination | Case 1 | Case 2 | Case 3 | Case 4 | Case 5 | Case 6 | Case 7 | Case 8 | Case 9 | Case 10 | P-value Fisher | Q-value Fisher | Ranking Fisher | P-value MWU | Q-value MWU | Ranking MWU |
|---|
| TRAV2|TRAJ22 | 73 | 1 | 228 | 1 | 1 | 0 | 0 | 0 | 0 | 0 | 0.0394 | 0.9633 | 18 | 0.0067 | 0.5633 | 1 |
| TRAV13-2|TRAJ4 | 5 | 107 | 53 | 5 | 631 | 0 | 0 | 0 | 0 | 0 | 0.0182 | 0.9633 | 3 | 0.0073 | 0.5633 | 2 |
|
TRAV13-1|TRAJ44 | 243 | 200 | 1,191 | 243 | 534 | 0 | 0 | 0 | 8 | 0 | 0.0169 | 0.9633 | 2 | 0.0095 | 0.5633 | 3 |
|
TRAV13-1|TRAJ39 | 48 | 733 | 481 | 179 | 329 | 1 | 0 | 0 | 0 | 0 | 0.0169 | 0.9633 | 1 | 0.0097 | 0.5633 | 4.5 |
|
TRAV13-1|TRAJ22 | 60 | 168 | 194 | 3 | 223 | 0 | 1 | 0 | 0 | 0 | 0.0242 | 0.9633 | 6 | 0.0097 | 0.5633 | 4.5 |
|
TRAV12-3|TRAJ53 | 0 | 74 | 101 | 1,989 | 305 | 0 | 0 | 0 | 0 | 0 | 0.0224 | 0.9633 | 4 | 0.0254 | 0.5633 | 32.5 |
| TRAV10|TRAJ6 | 1,498 | 0 | 660 | 504 | 1 | 0 | 0 | 0 | 0 | 0 | 0.0236 | 0.9633 | 5 | 0.0254 | 0.5633 | 32.5 |
| TRAV19|TRAJ32 | 96 | 495 | 307 | 0 | 338 | 0 | 0 | 0 | 0 | 0 | 0.0242 | 0.9633 | 7 | 0.0254 | 0.5633 | 32.5 |
|
TRAV12-3|TRAJ49 | 83 | 209 | 114 | 0 | 371 | 0 | 0 | 0 | 0 | 0 | 0.0294 | 0.9633 | 8 | 0.0254 | 0.5633 | 32.5 |
|
TRAV12-2|TRAJ23 | 38 | 93 | 0 | 923 | 80 | 0 | 0 | 0 | 0 | 0 | 0.0315 | 0.9633 | 9 | 0.0254 | 0.5633 | 32.5 |
| TRAV9-2|TRAJ10 | 140 | 168 | 123 | 0 | 63 | 0 | 0 | 0 | 0 | 0 | 0.0336 | 0.9633 | 10 | 0.0254 | 0.5633 | 32.5 |
|
TRAV12-1|TRAJ31 | 93 | 1,174 | 0 | 1 | 317 | 0 | 0 | 0 | 0 | 0 | 0.0337 | 0.9633 | 11 | 0.0254 | 0.5633 | 32.5 |
| TRAV20|TRAJ32 | 30 | 0 | 162 | 91 | 369 | 0 | 0 | 0 | 0 | 0 | 0.0338 | 0.9633 | 12 | 0.0254 | 0.5633 | 32.5 |
| TRAV8-6|TRAJ48 | 7 | 0 | 153 | 982 | 50 | 0 | 0 | 0 | 0 | 0 | 0.0348 | 0.9633 | 13 | 0.0254 | 0.5633 | 32.5 |
|
TRAV12-2|TRAJ13 | 127 | 218 | 47 | 0 | 56 | 0 | 0 | 0 | 0 | 0 | 0.0356 | 0.9633 | 14 | 0.0254 | 0.5633 | 32.5 |
|
TRAV36/DV7|TRAJ53 | 14 | 72 | 265 | 0 | 160 | 0 | 0 | 0 | 0 | 0 | 0.0373 | 0.9633 | 15 | 0.0254 | 0.5633 | 32.5 |
|
TRAV12-1|TRAJ33 | 11 | 0 | 503 | 49 | 144 | 0 | 0 | 0 | 0 | 0 | 0.0374 | 0.9633 | 16 | 0.0254 | 0.5633 | 32.5 |
| TRAV12-1|TRAJ9 | 14 | 0 | 52 | 126 | 213 | 0 | 0 | 0 | 0 | 0 | 0.0386 | 0.9633 | 17 | 0.0254 | 0.5633 | 32.5 |
|
TRAV13-1|TRAJ53 | 33 | 0 | 3 | 297 | 407 | 0 | 0 | 0 | 0 | 0 | 0.0400 | 0.9633 | 19 | 0.0254 | 0.5633 | 32.5 |
| TRAV13-2|TRAJ6 | 0 | 103 | 377 | 1 | 202 | 0 | 0 | 0 | 0 | 0 | 0.0429 | 0.9633 | 21 | 0.0254 | 0.5633 | 32.5 |
| TRAV6|TRAJ23 | 9 | 0 | 266 | 361 | 8 | 0 | 0 | 0 | 0 | 0 | 0.0432 | 0.9633 | 22 | 0.0254 | 0.5633 | 32.5 |
| TRAV9-2|TRAJ9 | 48 | 82 | 617 | 0 | 1 | 0 | 0 | 0 | 0 | 0 | 0.0438 | 0.9633 | 23 | 0.0254 | 0.5633 | 32.5 |
| TRAV27|TRAJ27 | 3 | 53 | 570 | 0 | 18 | 0 | 0 | 0 | 0 | 0 | 0.0464 | 0.9633 | 24 | 0.0254 | 0.5633 | 32.5 |
| TRAV41|TRAJ40 | 28 | 0 | 32 | 393 | 4 | 0 | 0 | 0 | 0 | 0 | 0.0479 | 0.9633 | 27 | 0.0254 | 0.5633 | 32.5 |
|
TRAV12-1|TRAJ29 | 29 | 0 | 223 | 1 | 209 | 0 | 0 | 0 | 0 | 0 | 0.0498 | 0.9633 | 28 | 0.0254 | 0.5633 | 32.5 |
| TRAV19|TRAJ9 | 35 | 0 | 732 | 664 | 1,082 | 0 | 0 | 1 | 0 | 0 | 0.0412 | 0.9633 | 20 | 0.0449 | 0.5633 | 61 |
| TRAV1-2|TRAJ42 | 2 | 0 | 174 | 316 | 428 | 0 | 0 | 0 | 0 | 1 | 0.0477 | 0.9633 | 26 | 0.0449 | 0.5633 | 61 |
|
| B, TRBV|TRBJ
recombinations |
|
|
| IR-Hi | IR-Lo |
|
|
|
|
|
|
|
|
|
|
|
|
|
|
|
|
|
Recombination | Case 1 | Case 2 | Case 3 | Case 4 | Case 5 | Case 6 | Case 7 | Case 8 | Case 9 | Case 10 | P-value
Fisher | Q-value
Fisher | Ranking
Fisher | P-value
MWU | Q-value
MWU | Ranking
MWU |
|
|
|
|
|
|
|
|
|
|
|
|
|
|
|
|
|
|
| IR-Hi | IR-Lo | P-value
Fisher | Q-value
Fisher | Ranking
Fisher | P-value
MWU | Q-value
MWU | Ranking
MWU | IR-Hi | IR-Lo | P-value
Fisher | Q-value
Fisher | Ranking
Fisher | P-value
MWU | Q-value
MWU | Ranking
MWU | IR-Hi |
|
|
TRBV6-6|TRBJ1-1 | 110 | 1 | 22 | 50 | 9 | 0 | 0 | 0 | 0 | 0 | 0.0122 | 0.3556 | 18 | 0.0075 | 0.6004 | 2.5 |
|
TRBV4-1|TRBJ2-3 | 217 | 668 | 24 | 10 | 22 | 0 | 0 | 0 | 0 | 0 | 0.0036 | 0.3556 | 5 | 0.0075 | 0.6004 | 2.5 |
|
TRBV3-1|TRBJ2-2 | 94 | 223 | 41 | 37 | 51 | 0 | 0 | 0 | 0 | 0 | 0.0032 | 0.3556 | 4 | 0.0075 | 0.6004 | 2.5 |
| TRBV27|TRBJ1-5 | 47 | 68 | 17 | 87 | 584 | 0 | 0 | 0 | 0 | 0 | 0.0023 | 0.3556 | 1 | 0.0075 | 0.6004 | 2.5 |
|
TRBV5-5|TRBJ2-1 | 12 | 689 | 2 | 19 | 74 | 0 | 1 | 0 | 0 | 0 | 0.0046 | 0.3556 | 7 | 0.0097 | 0.6004 | 5 |
| TRBV30|TRBJ2-5 | 71 | 86 | 16 | 39 | 342 | 0 | 0 | 1 | 1 | 0 | 0.0032 | 0.3556 | 3 | 0.0109 | 0.6004 | 6 |
|
TRBV7-9|TRBJ2-7 | 875 | 829 | 107 | 859 | 492 | 5 | 3 | 46 | 3 | 0 | 0.0041 | 0.3556 | 6 | 0.0119 | 0.6004 | 8 |
| TRBV2|TRBJ2-1 | 1,438 | 881 | 4 | 14 | 677 | 4 | 1 | 1 | 0 | 1 | 0.0262 | 0.3871 | 38 | 0.0147 | 0.6004 | 9 |
|
TRBV20-1|TRBJ1-1 | 8,143 | 814 | 32 | 1,016 | 477 | 0 | 1 | 346 | 0 | 0 | 0.0362 | 0.3933 | 54 | 0.0200 | 0.6004 | 10 |
|
TRBV5-6|TRBJ1-5 | 121 | 674 | 14 | 14 | 0 | 0 | 0 | 0 | 0 | 0 | 0.0104 | 0.3556 | 13 | 0.0248 | 0.6004 | 11.5 |
|
TRBV10-2|TRBJ2-2 | 0 | 44 | 2 | 6 | 6 | 0 | 0 | 0 | 0 | 0 | 0.0307 | 0.3871 | 45 | 0.0248 | 0.6004 | 11.5 |
|
TRBV5-8|TRBJ2-1 | 40 | 435 | 0 | 3 | 1 | 0 | 0 | 0 | 0 | 0 | 0.0145 | 0.3571 | 24 | 0.0254 | 0.6004 | 15.5 |
|
TRBV7-9|TRBJ2-4 | 62 | 18 | 0 | 15 | 3 | 0 | 0 | 0 | 0 | 0 | 0.0233 | 0.3871 | 33 | 0.0254 | 0.6004 | 15.5 |
|
TRBV25-1|TRBJ1-5 | 370 | 0 | 32 | 4 | 16 | 0 | 0 | 0 | 0 | 0 | 0.0196 | 0.3871 | 29 | 0.0254 | 0.6004 | 15.5 |
|
TRBV11-1|TRBJ2-5 | 32 | 1 | 17 | 0 | 16 | 0 | 0 | 0 | 0 | 0 | 0.0309 | 0.3871 | 46 | 0.0254 | 0.6004 | 15.5 |
|
TRBV3-1|TRBJ1-2 | 69 | 18 | 0 | 116 | 58 | 0 | 0 | 0 | 0 | 0 | 0.0121 | 0.3556 | 17 | 0.0254 | 0.6004 | 15.5 |
|
TRBV7-2|TRBJ1-1 | 245 | 269 | 8 | 0 | 118 | 0 | 0 | 0 | 0 | 0 | 0.0113 | 0.3556 | 16 | 0.0254 | 0.6004 | 15.5 |
|
TRBV20-1|TRBJ1-5 | 460 | 507 | 3,103 | 3 | 1,551 | 3 | 0 | 138 | 0 | 1 | 0.0099 | 0.3556 | 12 | 0.0273 | 0.6004 | 19 |
| TRBV9|TRBJ2-7 | 6,219 | 562 | 39 | 200 | 16 | 0 | 2 | 114 | 0 | 0 | 0.0232 | 0.3871 | 32 | 0.0345 | 0.6004 | 21 |
| TRBV14|TRBJ2-2 | 220 | 62 | 9 | 0 | 22 | 0 | 0 | 2 | 0 | 0 | 0.0189 | 0.3871 | 28 | 0.0449 | 0.6004 | 27 |
| TRBV2|TRBJ1-4 | 86 | 51 | 3 | 0 | 24 | 0 | 1 | 0 | 0 | 0 | 0.0307 | 0.3871 | 44 | 0.0449 | 0.6004 | 27 |
| TRBV2|TRBJ2-2 | 2,478 | 1274 | 0 | 65 | 114 | 1 | 0 | 0 | 0 | 0 | 0.0067 | 0.3556 | 9 | 0.0449 | 0.6004 | 27 |
| TRBV30|TRBJ2-1 | 133 | 420 | 0 | 14 | 186 | 0 | 0 | 2 | 0 | 0 | 0.0071 | 0.3556 | 10 | 0.0449 | 0.6004 | 27 |
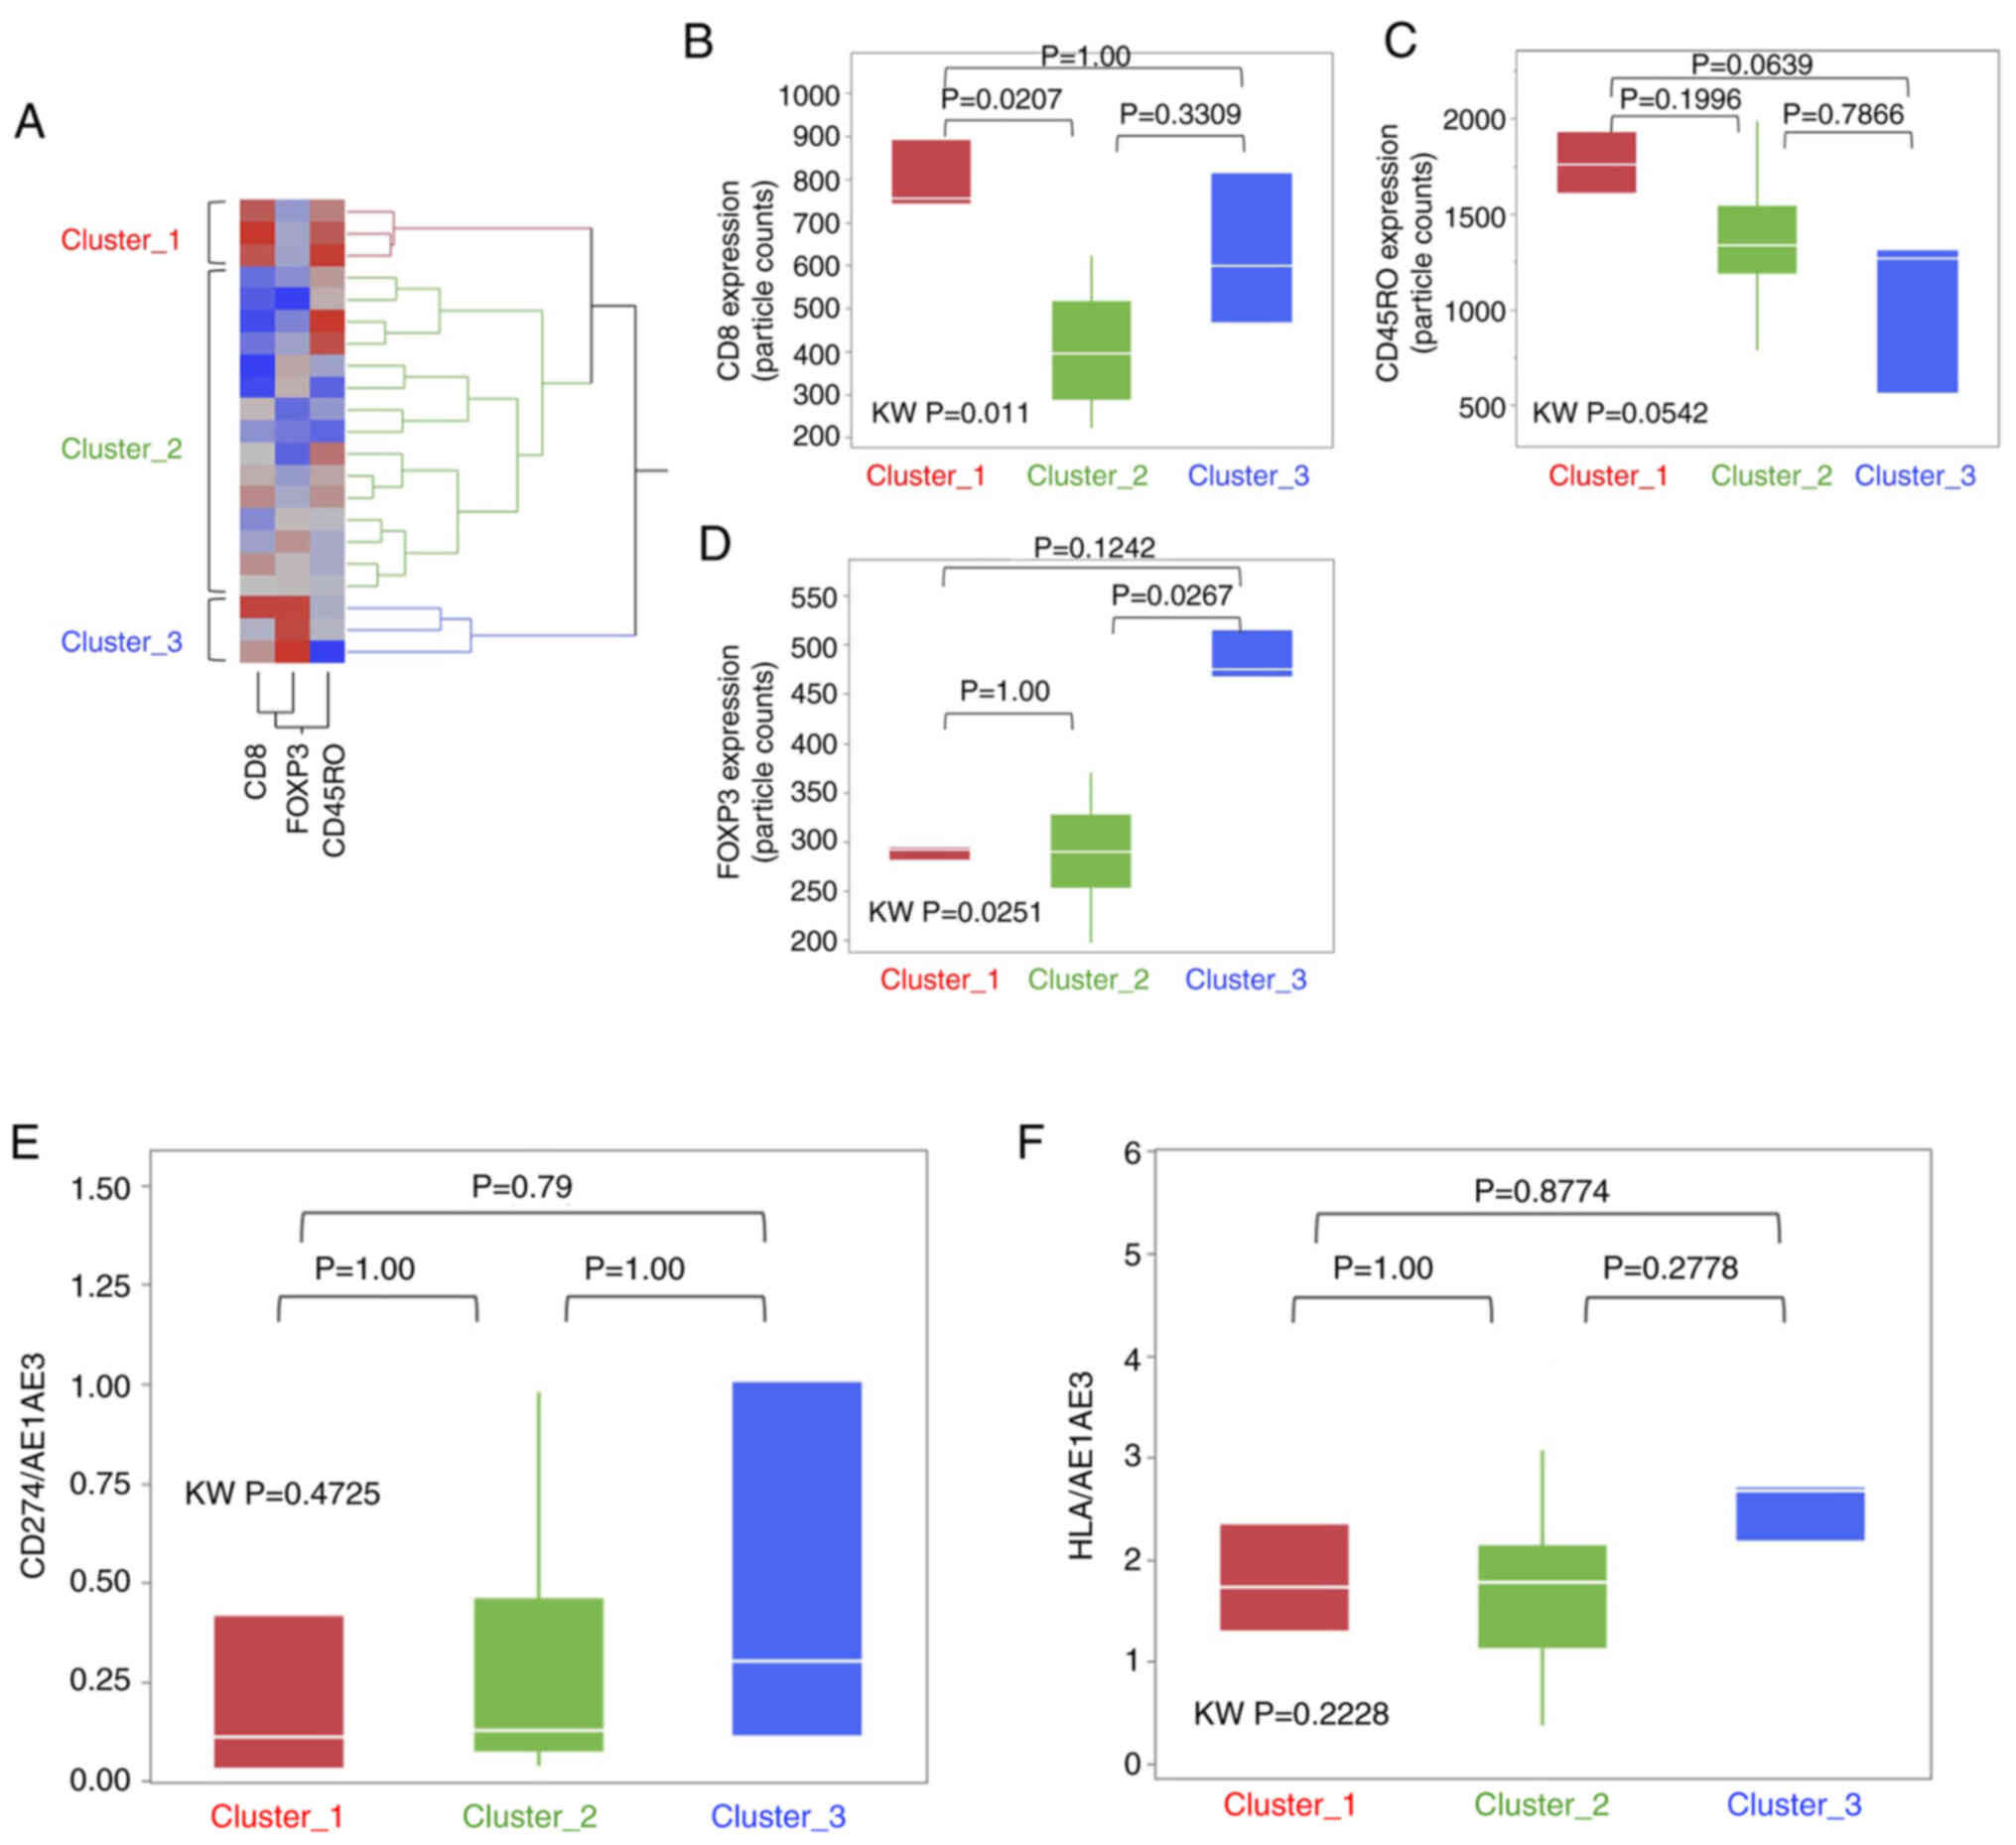
T-cell subset cluster analysis in the
IR-Hi group
Exploratory visualization utilizing hierarchical
clustering analysis was then performed to assess whether the T-cell
subset imbalance had any influence in the IR-Hi group. The IR-Hi
group was classified in three clusters (Fig. 4A), namely Cluster_1 (n=3), Cluster_2
(n=15) and Cluster_3 (n=3).
Next, each T-cell subset marker, as well as CD274
and HLA, were compared to determine whether the imbalances existed
within the three clusters. The expression levels of CD8 and FOXP3
were significantly higher in Cluster_1 and Cluster 3, respectively,
compared with in Cluster_2 (Fig. 4B and
D). However, there were no significant differences with regard
to CD45RO, CD274 and HLA among the three clusters (Fig. 4C, E and F). The CSS and RFS for each
cluster were compared, and there were no significant differences
among the 3 clusters; however, cluster 1 tended to have a less
favourable RFS outcome than the other clusters (Fig. S8).
Discussion
The present study indicated that the prognosis of
patients with ESCC could be stratified according to IR status,
which was evaluated based on T-cell subset markers CD274 and HLA. A
comprehensive TCR analysis and comparison between the IR-Hi and
IR-Lo groups indicated that the IR-Hi group exhibited a diverse TCR
repertoire and shared V/J regions recombination in TCR α and β
chains. In the IR-Hi group, the prognosis of the patients could be
further stratified into three clusters according to the expression
patterns of CD8, CD45RO and FOXP3.
The TCR diversity was well conserved and the values
of RDI were significantly higher in the IR-Hi group. Thus, the
IR-Hi group persistently exhibited the capacity to respond to
diverse antigens. TCR diversity is an important element used to
evaluate the immunogenicity of tumors and host immune capabilities.
The level of the TCR diversity increased as the immunogenicity of
the tumor increased. Notably, Carreno et al (33) reported that dendritic vaccination for
translation of tumor antigen information into the host immune
system increased the TCR diversity. Manuel et al (34) suggested that the prognosis of
patients with metastatic breast cancer was worse in patients with
decreasing TCR diversity. Accordingly, the IR-Hi group may be a
receptive candidate for immunotherapy since it is in a preferable
immune responsive status and holds diverse TCR expression T cells
that can respond to various antigens.
In addition to TCR diversity analysis, the present
study observed shared V/J region recombinations in TCRα and TCRβ.
Tan et al (35) screened
tumor-reactive TILs specifically to recognize fragments from
autologous tumor cells and identified nine TRAV/TRAJ and four
TRBV/TRBJ recombination sequences via TCR analysis. Notably,
TRAV13-1/TRAJ22 and TRBV7-9/TRBJ2-7 are both candidates identified
from the aforementioned study (35),
and the same combinations were identified in the present study.
Additionally, Tan et al (35)
provided evidence that these TCRs could work for tumor-reactive;
however, their study was conducted using the sample acquired from
one patient. If there is a tumor-reactive T cell with the shared
TCR in patients with ESCC, it implies the existence of an antigen
that holds the common portion for the T cell reactivity. Thus, the
shared TCR repertoires in the IR-Hi group that were identified in
the present study may be important for investigating the novel
antigen.
In the hierarchical cluster analysis, the IR-Hi
group was divided into three clusters according to the expression
patterns of CD8, CD45RO and FOXP3. There were no significant
differences in prognosis among the clusters; however, the RFS rate
in Cluster_3 was the highest and that in Cluster_1 the least
favourable. When considering T-cell subset functions, the RFS of
Cluster_1, which showed abundant cytotoxic and memory T cells, was
expected to be better than that of Cluster_3, which was rich in
regulatory T cells. However, the result was contradictory to the
expectation. With regards to these findings, six immune subtype
clusters (C1, wound healing; C2, IFN-γ dominant; C3, inflammatory;
C4, lymphocyte depleted; C5, immunologically quiet; and C6, TGF-β
dominant subtypes) were proposed through the gene expression
profile of TILs using The Cancer Genome Atlas data (36). According to the report, the C2
subtype with a hyper cytotoxic T-cell signature had a poor
prognosis than that of the C3 subtype with a balanced macrophage
and T cell signature. As suggested by Thorsson et al
(36), exacerbating the cytotoxic
dominant condition in the tumor microenvironment may favor tumor
growth, whereas a well-balanced T-cell subset between cytotoxic and
regulatory signatures may be necessary for optimal immunological
antitumor function.
Considering the IR-status and hierarchical
clustering in a clinical setting, the IR-Lo group would not be
indicated for immunotherapy since its immune profile would be low,
so conventional chemoradiotherapy or surgery may be preferable. On
the contrary, in the IR-Hi group, Cluster_3 would be the most
preferable group for immunotherapy since its immune profile is high
and the T-cell subset is well balanced. Additionally, comprehensive
TCR repertoire analysis may facilitate the discovery of novel
common cancer antigens and the development of CAR-T cell therapy in
ESCC.
In the present study, the V/J recombination
sequences were narrowed down using two different statistical
procedures and several combinations were commonly shared in the
IR-Hi group. By combining multiple statistical methods, the present
study attempted to ascertain the reliability of the V/J
recombination candidate. Notably, the selected candidates contained
the recombination sequences that were involved in T cell activation
and cytokine release (35), thus the
results presented here are reasonable.
Adaptor ligation PCR and NGS analysis were performed
utilizing the mRNA samples collected from bulk tumor tissues in the
present study. There may be concerns for the credibility of the TCR
analysis without using laser micro dissection or other equivalent
techniques; however, the procedures performed in the present study
have been previously reported in several studies (37–39), and
the reliability of the technique is expected to be sufficient.
Moreover, as shown in Fig. S4, T
cells were spatially accumulated surrounding the tumor, therefore
bulk samples containing surrounding tumor structures may be
appropriate for obtaining TCR information.
However, there are some limitations in the present
study. The study was conducted with a relatively small number of
cases, which may have limited the conclusions of the findings. The
TCR repertoire analysis, which suggested the existence of shared
V/J region recombinations and corresponding antigens, included only
a few cases, and additional CDR3 clonotypes investigation should be
conducted. Additionally, the TCRα and β chains were investigated
separately. T cells recognize antigens via heterodimerization of
the TCRα and TCRβ chains, thus it was not clear which antigen was
recognized by the common V/J recombination regions confirmed in the
ESCC cases. Furthermore, the variations in TCRαβ repertoire
combination were large, and it may be possible that candidates were
selected by chance. Therefore, further investigations are warranted
in future studies.
In conclusion, the results of the present study
confirmed two distinctive subgroups in ESCC according to the T cell
subset marker expression. Furthermore, abundant TCR repertoire
diversity partly containing shared V/J region recombination in the
IR-Hi group was confirmed, which may allow development of a novel
immune-oriented therapy.
Supplementary Material
Supporting Data
Acknowledgements
The authors would like to thank Ms. Matsuo from the
Department of Surgery, Kurume University (Kurume, Japan) and Ms.
Kawaguchi from Research for Innovative Cancer Therapy, Kurume
University (Kurume, Japan) for performing the RNA extractions from
the tissue samples, and Ms. Otsu fom the Department of Surgery,
Kurume University (Kurume, Japan) for the preparation of the slides
for H&E and IHC staining.
Funding
The present study was supported by a Grant-in-Aid
for Scientific Research (grant no. 16K07130).
Availability of data and materials
The datasets generated and/or analyzed during the
current study are available in the DDBJ BioProject repository
(http://trace.ddbj.nig.ac.jp/BPSearch/bioproject?acc=PRJDB9359)
and the NCBI repository (https://www.ncbi.nlm.nih.gov/bioproject/?term=PRJDB9359).
Authors' contributions
TS planned all experiments and wrote the article. KI
performed the computational analysis. AK and JA performed
immunohistochemical staining and pathological diagnosis. SN, MN,
HK, MF, HH, KS, SM and NM collected and interpreted the clinical
data for the enrolled patients. TS and KI confirmed the
authenticity of all raw data. AM helped to perform the final
pathological diagnosis and provided a critical suggestion about the
interpretation of the IHC staining materials. AY helped to
interpret the T cell receptor repertoire analysis. AM and AY were
involved in drafting the initial manuscript and critically revising
it for important intellectual content. YA supervised the research
group, conceived the study, helped to write the discussion section
and gave final approval of the version to be published. All authors
have read and approved the final manuscript.
Ethics approval and consent to
participate
The present study was conducted under the provision
of the Declaration of Helsinki and was approved by the
Institutional Review Board of Kurume University Hospital (Kurume,
Japan; approval no. 282). Written informed consent was obtained
from all enrolled patients.
Patient consent for publication
Not applicable.
Competing interests
The authors declare that they have no competing
interests.
References
|
1
|
Bray F, Ferlay J, Soerjomataram I, Siegel
RL, Torre LA and Jemal A: Global cancer statistics 2018: GLOBOCAN
estimates of incidence and mortality worldwide for 36 cancers in
185 countries. CA Cancer J Clin. 68:394–424. 2018. View Article : Google Scholar : PubMed/NCBI
|
|
2
|
Domper Arnal MJ, Ferrández Arenas Á and
Lanas Arbeloa Á: Esophageal cancer: Risk factors, screening and
endoscopic treatment in Western and Eastern countries. World J
Gastroenterol. 21:7933–7943. 2015. View Article : Google Scholar : PubMed/NCBI
|
|
3
|
Ide H, Nakamura T, Hayashi K, Endo T,
Kobayashi A, Eguchi R and Hanyu F: Esophageal squamous cell
carcinoma: Pathology and prognosis. World J Surg. 18:321–330. 1994.
View Article : Google Scholar : PubMed/NCBI
|
|
4
|
Matsuda S, Takeuchi H, Kawakubo H, Ando N
and Kitagawa Y: Current advancement in multidisciplinary treatment
for resectable cStage II/III esophageal squamous cell carcinoma in
Japan. Ann Thorac Cardiovasc Surg. 22:275–283. 2016. View Article : Google Scholar : PubMed/NCBI
|
|
5
|
Watanabe M, Otake R, Kozuki R, Toihata T,
Takahashi K, Okamura A and Imamura Y: Correction to: Recent
progress in multidisciplinary treatment for patients with
esophageal cancer. Surg Today. 50:4252020. View Article : Google Scholar : PubMed/NCBI
|
|
6
|
Shah MA, Kojima T, Hochhauser D, Enzinger
P, Raimbourg J, Hollebecque A, Lordick F, Kim SB, Tajika M, Kim HT,
et al: Efficacy and safety of pembrolizumab for heavily pretreated
patients with advanced, metastatic adenocarcinoma or squamous cell
carcinoma of the esophagus: The phase 2 KEYNOTE-180 study. JAMA
Oncol. 5:546–550. 2019. View Article : Google Scholar : PubMed/NCBI
|
|
7
|
Kojima T, Shah MA, Muro K, Francois E,
Adenis A, Hsu CH, Doi T, Moriwaki T, Kim SB, Lee SH, et al:
Randomized phase III KEYNOTE-181 study of pembrolizumab versus
chemotherapy in advanced esophageal cancer. J Clin Oncol.
38:4138–4148. 2020. View Article : Google Scholar : PubMed/NCBI
|
|
8
|
Sudo T, Nishida R, Kawahara A, Saisho K,
Mimori K, Yamada A, Mizoguchi A, Kadoya K, Matono S, Mori N, et al:
Clinical impact of tumor-infiltrating lymphocytes in esophageal
squamous cell carcinoma. Ann Surg Oncol. 24:3763–3770. 2017.
View Article : Google Scholar : PubMed/NCBI
|
|
9
|
Ohtani H: Focus on TILs: Prognostic
significance of tumor infiltrating lymphocytes in human colorectal
cancer. Cancer Immun. 7:42007.PubMed/NCBI
|
|
10
|
Huh JW, Lee JH and Kim HR: Prognostic
significance of tumor-infiltrating lymphocytes for patients with
colorectal cancer. Arch Surg. 147:366–372. 2012. View Article : Google Scholar : PubMed/NCBI
|
|
11
|
Kang WB, Seo NA, Yoon S, Bae HI, Jeon SW,
Kwon OK, Chung HY, Yu W, Kang H and Kim JG: Prognostic value of
tumor-infiltrating lymphocytes in Epstein-Barr virus-associated
gastric cancer. Ann Oncol. 27:494–501. 2016. View Article : Google Scholar : PubMed/NCBI
|
|
12
|
Zhang D, He W, Wu C, Tan Y, He Y, Xu B,
Chen L, Li Q and Jiang J: Scoring system for tumor-infiltrating
lymphocytes and its prognostic value for gastric cancer. Front
Immunol. 10:712019. View Article : Google Scholar : PubMed/NCBI
|
|
13
|
Lu G, Chen L, Wu S, Feng Y and Lin T:
Comprehensive analysis of tumor-infiltrating immune cells and
relevant therapeutic strategy in esophageal cancer. Dis Markers.
2020:89747932020. View Article : Google Scholar : PubMed/NCBI
|
|
14
|
Giannakis M, Mu JX, Shukla AS, Qian ZR,
Cohen O, Nishihara R, Bahl S, Cao Y, Amin-Mansour A, Yamauchi M, et
al: Genomic correlates of immune-cell infiltrates in colorectal
carcinoma. Cell Rep. 15:857–865. 2016. View Article : Google Scholar : PubMed/NCBI
|
|
15
|
Tahara H, Shiozaki H, Kobayashi K, Yano T,
Yano H, Tamura S, Oku K, Miyata M, Wakasa K, Sakurai M, et al:
Phenotypic characteristics of tumour. infiltrating lymphocytes in
human oesophageal cancer tissues defined by quantitative two-colour
analysis with flow-cytometry. Virchows Arch A Pathol Anat
Histopathol. 416:329–334. 1990. View Article : Google Scholar : PubMed/NCBI
|
|
16
|
Woo EY, Yeh H, Chu CS, Schlienger K,
Carroll RG, Riley JL, Kaiser LR and June CH: Cutting edge:
Regulatory T cells from lung cancer patients directly inhibit
autologous T cell proliferation. J Immunol. 168:4272–4276. 2002.
View Article : Google Scholar : PubMed/NCBI
|
|
17
|
Ostrand-Rosenberg S: Immune surveillance:
A balance between protumor and antitumor immunity. Curr Opin Genet
Dev. 18:11–18. 2008. View Article : Google Scholar : PubMed/NCBI
|
|
18
|
Heilig SJ and Tonegawa S: Diversity of
murine gamma genes and expression in fetal and adult T lymphocytes.
Nature. 322:836–840. 1986. View
Article : Google Scholar : PubMed/NCBI
|
|
19
|
Postow MA, Manuel M, Wong P, Yuan J, Dong
Z, Liu C, Perez S, Tanneau I, Noel M, Courtier A, et al: Peripheral
T cell receptor diversity is associated with clinical outcomes
following ipilimumab treatment in metastatic melanoma. J Immunother
Cancer. 3:232015. View Article : Google Scholar : PubMed/NCBI
|
|
20
|
Cha E, Klinger M, Hou Y, Cummings C, Ribas
A, Faham M and Fong L: Improved survival with T cell clonotype
stability after anti-CTLA-4 treatment in cancer patients. Sci
Transl Med. 6:238ra702014. View Article : Google Scholar : PubMed/NCBI
|
|
21
|
Robert L, Tsoi J, Wang X, Emerson R, Homet
B, Chodon T, Mok S, Huang RR, Cochran AJ, Comin-Anduix B, et al:
CTLA4 blockade broadens the peripheral T-cell receptor repertoire.
Clin Cancer Res. 20:2424–2432. 2014. View Article : Google Scholar : PubMed/NCBI
|
|
22
|
Li C, Zhang Y, Zhang C, Chen J, Lou X,
Chen X, Kang L, Xu N, Li M, Tan J, et al: Comparation of CART19 and
autologous stem-cell transplantation for refractory/relapsed
non-Hodgkin's lymphoma. JCI Insight. 5:e1301952019. View Article : Google Scholar : PubMed/NCBI
|
|
23
|
Hu K, Kang N, Liu Y, Guo D, Jing W, Lu J,
Tan T, Lv C, Deng Y, Long J, et al: Proposed revision of N
categories to the 8th edition of the AJCC-TNM staging system for
non-surgical esophageal squamous cell cancer. Cancer Sci.
110:717–725. 2019. View Article : Google Scholar : PubMed/NCBI
|
|
24
|
Schneider AC, Rasband SW and Eliceiri WK:
NIH image to imageJ: 25 years of image analysis. Nat Methods.
9:671–675. 2012. View Article : Google Scholar : PubMed/NCBI
|
|
25
|
Yamaguchi-Kabata Y, Nakazono K, Takahashi
A, Saito S, Hosono N, Kubo M, Nakamura Y and Kamatani N: Japanese
population structure, based on SNP genotypes from 7003 individuals
compared to other ethnic groups: Effects on population-based
association studies. Am J Hum Genet. 83:445–456. 2008. View Article : Google Scholar : PubMed/NCBI
|
|
26
|
Armstrong SA, Staunton JE, Silverman LB,
Pieters R, den Boer ML, Minden MD, Sallan SE, Lander ES, Golub TR
and Korsmeyer SJ: MLL translocations specify a distinct gene
expression profile that distinguishes a unique leukemia. Nat Genet.
30:41–47. 2002. View
Article : Google Scholar : PubMed/NCBI
|
|
27
|
Matsutani T, Yoshioka T, Tsuruta Y,
Iwagami S and Suzuki R: Analysis of TCRAV and TCRBV repertoires in
healthy individuals by microplate hybridization assay. Hum Immunol.
56:57–69. 1997. View Article : Google Scholar : PubMed/NCBI
|
|
28
|
Kitaura K, Shini T, Matsutani T and Suzuki
R: A new high-throughput sequencing method for determining
diversity and similarity of T cell receptor (TCR) α and β
repertoires and identifying potential new invariant TCR α chains.
BMC Immunol. 17:382016. View Article : Google Scholar : PubMed/NCBI
|
|
29
|
McCarthy JD, Chen Y and Smyth KG:
Differential expression analysis of multifactor RNA-Seq experiments
with respect to biological variation. Nucleic Acids Res.
40:4288–4297. 2012. View Article : Google Scholar : PubMed/NCBI
|
|
30
|
Robinson DM, McCarthy JD and Smyth KG:
EdgeR: A bioconductor package for differential expression analysis
of digital gene expression data. Bioinformatics. 26:139–140. 2010.
View Article : Google Scholar : PubMed/NCBI
|
|
31
|
Bolen CR, Rubelt F, Vander Heiden JA and
Davis MM: The repertoire dissimilarity index as a method to compare
lymphocyte receptor repertoires. BMC Bioinformatics. 18:1552017.
View Article : Google Scholar : PubMed/NCBI
|
|
32
|
Rubelt F, Bolen CR, McGuire HM, Vander
Heiden JA, Gadala-Maria D, Levin M, Euskirchen GM, Mamedov MR, Swan
GE, Dekker CL, et al: Individual heritable differences result in
unique cell lymphocyte receptor repertoires of naive and
antigen-experienced cells. Nat Commun. 7:111122016. View Article : Google Scholar : PubMed/NCBI
|
|
33
|
Carreno MB, Magrini V, Becker-Hapak M,
Kaabinejadian S, Hundal J, Petti AA, Ly A, Lie WR, Hildebrand WH,
Mardis ER and Linette GP: Cancer immunotherapy. A dendritic cell
vaccine increases the breadth and diversity of melanoma
neoantigen-specific T cells. Science. 348:803–808. 2015. View Article : Google Scholar : PubMed/NCBI
|
|
34
|
Manuel M, Tredan O, Bachelot T, Clapisson
G, Courtier A, Parmentier G, Rabeony T, Grives A, Perez S, Mouret
JF, et al: Lymphopenia combined with low TCR diversity (divpenia)
predicts poor overall survival in metastatic breast cancer
patients. Oncoimmunology. 1:432–440. 2012. View Article : Google Scholar : PubMed/NCBI
|
|
35
|
Tan Q, Zhang C, Yang W, Liu Y, Heyilimu P,
Feng D, Xing L, Ke Y and Lu Z: Isolation of T cell receptor
specifically reactive with autologous tumour cells from
tumour-infiltrating lymphocytes and construction of T cell receptor
engineered T cells for esophageal squamous cell carcinoma. J
Immunother Cancer. 7:2322019. View Article : Google Scholar : PubMed/NCBI
|
|
36
|
Thorsson V, Gibbs LD, Brown DS, Wolf D,
Bortone DS, Ou Yang TH, Porta-Pardo E, Gao GF, Plaisier CL, Eddy
JA, et al: The Immune landscape of cancer. Immunity.
48:812–830.e14. 2018. View Article : Google Scholar : PubMed/NCBI
|
|
37
|
Saitoh H, Hirokawa M, Fujishima N,
Ichikawa Y, Kawabata Y, Miura I, Miura AB, Matsutani T, Suzuki R
and Sawada K: The presence and longevity of peripherally expanded
donor-derived TCRalphabeta+ mature T lymphocyte clones after
allogeneic bone marrow transplantation for adult myeloid leukemias.
Leukemia. 17:1626–1635. 2003. View Article : Google Scholar : PubMed/NCBI
|
|
38
|
Matsutani T, Yoshioka T, Tsuruta Y,
Shimamoto T, Ohyashiki JH, Suzuki R and Ohyashiki K: Determination
of T-cell receptors of clonal CD8-positive T-cells in
myelodysplastic syndrome with erythroid hypoplasia. Leuk Res.
27:305–312. 2003. View Article : Google Scholar : PubMed/NCBI
|
|
39
|
Matsutani T, Ohashi Y, Yoshioka T, Tsuruta
Y, Doi H, Satomi S and Suzuki R: Skew in T-cell receptor usage and
clonal T-cell expansion in patients with chronic rejection of
transplanted kidneys. Transplantation. 75:398–407. 2003. View Article : Google Scholar : PubMed/NCBI
|