Introduction
Renal cell carcinoma (RCC) is one of the most common
and aggressive malignant tumors of the urinary system, accounting
for 2–3% of adult malignancies (1,2). The
incidence of kidney cancer is rising, with a worldwide mortality
rate of 2/100,000 in 2012, ranking 16th with regard to the
mortality rate among malignant tumors (3). The number of deaths in Chinese patients
with kidney cancer in 2014 was ~26,000 (4). In 2018, in the United States, 65,340
people were diagnosed with RCC and 14,970 died from the disease,
and by 2030, an increase in the number of RCC-associated deaths of
≥20% is expected, compared with that in 2007 (5,6). An
early diagnosis of the disease allows patients to receive treatment
timely. An accurate diagnosis of the progress of the disease can
help to guide the adjuvant treatment intensity and postoperative
monitoring of patients, thereby improving their clinical outcomes
(7). However, the treatment strategy
would be incomplete and have limited accuracy unless a molecular
diversity of RCC cases, such as the combination of T stage, grade
and patient performance status, was used to evaluate the prognosis
of patients (8–10). In order to improve the classification
of patients with RCC into different risk groups, molecular
biomarkers should be included in the prognostic algorithm since
they can capture the molecular diversity of the disease. In
addition, vascular endothelial growth factor receptor inhibitors
and mTOR inhibitors have been used in the treatment of RCC
(11). Although patients have
exhibited significant clinical responses, the therapeutic effects
of these inhibitors are limited due to the drug-resistant phenotype
(12). Therefore, there is an urgent
need for more effective and specific treatment strategies for
RCC.
Regulator of G protein signaling 20 (RGS20) belongs
to the RZ family and is highly expressed in the brain, especially
in the caudate nucleus and the temporal lobe (13–16).
There is increasing evidence that increased expression levels of
RGS20 are associated with the occurrence and progression of
different types of cancer, including bladder cancer, breast cancer,
oral squamous cell carcinoma (OSCC) and metastatic melanoma
(17–20). For example, the overexpression of
RGS20 increases the protein expression levels of cyclin D1,
vimentin and N-cadherin in OSCC cells, but decreases the protein
expression levels of E-cadherin, indicating that RGS20 promotes
epithelial-mesenchymal transformation and cell cycle progression in
OSCC cells (17). Moreover, in
bladder cancer, upregulated RGS20 expression promotes cell
proliferation and migration by activating NF-κB signaling (20). In addition, a study has indicated
that after the overexpression of RGS20 in HeLa, MDA-MB-231, H1299
and A549 cells, the abilities of the cells to aggregate, migrate,
invade and adhere are enhanced, suggesting that RGS20 may promote
tumor metastasis (21).
To the best of our knowledge, there are no studies
on the association between RGS20 and RCC. Therefore, the present
study aimed to investigate the importance and clinical significance
of RGS20 in RCC.
Materials and methods
Cell lines and cell culture
The human renal epithelial cell line (HK-2) and RCC
cell lines, including 786-O, A-498 and Caki-1 cells, were purchased
from the American Type Culture Collection. The RCC SN12-PM6 cell
line was obtained from XIAMEN Anti-HeLa Biological Technology Trade
Co. Ltd.. Cells were cultured at 37°C in a humidified atmosphere
with 5% CO2 using DMEM (Gibco; Thermo Fisher Scientific,
Inc.) supplemented with 10% FBS (Gibco; Thermo Fisher Scientific,
Inc.), 100 U/ml penicillin and 100 U/ml streptomycin.
Construction of stable RGS20-knockout
cell lines
The pLV-sh-puro vector was purchased from XIAMEN
Anti-HeLa Biological Technology Trade Co., Ltd., and used to
prepare the lentiviruses for short hairpin (sh)RGS20 (Gene ID,
8601) or scrambled control (shctrl) transfection. The corresponding
primer sequences of shRNAs were designed and synthesized according
to the pLV-sh-puro vector specifications (Table I).
 | Table I.Primer sequences used to generate
shRGS20 lentiviruses. |
Table I.
Primer sequences used to generate
shRGS20 lentiviruses.
| Name | Sequence
(5′-3′) |
|---|
| shRGS20-1 | Forward:
CCGGGCTCGTGTCTCACTGTTAGAACTCGAGTTCTAACAGTGAGACACGAGCTTTTT |
|
| Reverse:
AATTAAAAAGCTCGTGTCTCACTGTTAGAACTCGAGTTCTAACAGTGAGACACGAGC |
| shRGS20-2 | Forward:
CCGGCCATCCCAACACATATTCGATCTCGAGATCGAATATGTGTTGGGATGGTTTTT |
|
| Reverse:
AATTAAAAACCATCCCAACACATATTCGATCTCGAGATCGAATATGTGTTGGGATGG |
| shctrl | Forward:
CCGGTTCTCCGAACGTGTCACGTCTCGAGACGTGACACGTTCGGAGAATTTTT |
|
| Reverse:
AATTAAAAATTCTCCGAACGTGTCACGTCTCGAGACGTGACACGTTCGGAGAA |
To prepare the lentiviral particles, 9 µg of shRGS20
and the suitable packaging plasmids (3 µg of pMD2G and 6 µg of
pspax2) were co-transfected into 293T cells (Xiamen Immocell
Biotechnology Co., Ltd.) using Lipofectamine® 2000
(Invitrogen; Thermo Fisher Scientific, Inc.). After 48 h, the
supernatant was collected, which contained the lentivirus, and then
the lentivirus was enriched and the titer was determined as
described previously (22). In the
presence of 8 µg/ml polypropylene, the lentivirus was transduced
into A-498 cells at a multiplicity of infection (MOI) of 30. After
48 h, the medium was replaced with fresh medium, and puromycin was
added at a final concentration of 1.0 µg/ml. After 72 h, cells were
collected for RGS20 expression analysis.
Quantitative PCR (qPCR)
RNA was isolated from cells using an RNA isolation
kit (Omega Bio-Tek, Inc.) and reverse transcribed using a HiScript
II 1st Strand cDNA Synthesis kit (Vazyme Biotech Co., Ltd.)
according to the manufacturer's instructions. qPCR analysis was
performed using the iQ5 Real-Time PCR Detection System (Bio-Rad
Laboratories, Inc.) and a ChamQ SYBR qPCR Master Mix kit (Vazyme
Biotech Co., Ltd.) to determine the mRNA expression levels of the
genes of interest. The thermocycling conditions of qPCR were 95°C
for 3 sec, followed by 40 cycles at 95°C for 10 sec and 60°C for 30
sec. The relative expression levels of genes were normalized to the
18S rRNA levels using the 2−ΔΔCq method (23). The primers used for qPCR are shown in
Table II.
| Table II.Primers used for quantitative
PCR. |
Table II.
Primers used for quantitative
PCR.
| Name | Sequence
(5′-3′) |
|---|
| RGS20-F |
CTTCCCACGAACTCAGAGCAGA |
| RGS20-R |
TCCTTCCTGCTGGAGTGACCAT |
| CCNB1-F |
GACCTGTGTCAGGCTTTCTCTG |
| CCNB1-R |
GGTATTTTGGTCTGACTGCTTGC |
| CDC20-F |
CGGAAGACCTGCCGTTACATTC |
| CDC20-R |
CAGAGCTTGCACTCCACAGGTA |
| PTTG1-F |
GCTTTGGGAACTGTCAACAGAGC |
| PTTG1-R |
CTGGATAGGCATCATCTGAGGC |
| 18S-F |
CGACGACCCATTCGAACGTCT |
| 18S-R |
CTCTCCGGAATCGAACCCTGA |
Western blotting
Cells were lysed in ice-cold RIPA buffer (Beyotime
Institute of Biotechnology) to extract protein, and protein
quantification was performed with a BCA protein concentration
determination kit (Beyotime Institute of Biotechnology). A total of
20 µg of protein/lane was separated via 10% SDS-PAGE. After the
separation, proteins were transferred to polyvinylidene difluoride
membranes. After being blocked with 5% skimmed milk in TBS-Tween
(0.05% Tween-20) buffer at 25°C for 1 h, the membranes were
incubated with the primary antibodies for 2 h at room temperature,
followed by incubation with the appropriate secondary antibody for
1 h at room temperature. The membranes were visualized using a
typically enhanced chemiluminescent kit (Thermo Fisher Scientific,
Inc.). ImageJ v1.48 (National Institutes of Health) was used for
densitometry. The following primary antibodies were used in the
present study: RGS20 (cat. no. YN1202, 1:1,000; ImmunoWay
Biotechnology Company) and GAPDH antibodies (cat. no. YM3029,
1:1,000; ImmunoWay Biotechnology Company). The secondary antibodies
conjugated with horseradish peroxidase were anti-mouse IgG (cat.
no. 7076; 1:2,000; Cell Signaling Technology, Inc.) and anti-rabbit
IgG (cat. no. 7074; 1:2,000; Cell Signaling Technology, Inc.).
MTT assay
A-498 cells stably expressing shctrl or shRGS20 were
seeded on 96-well plates at a density of 10,000 cells/well. After
24, 48 or 72 h of culture at 37°C, 20 µl of MTT (5 mg/ml) was added
to each well and the cells were incubated at 37°C for 4 h.
Subsequently, the supernatant in the wells was carefully aspirated,
150 µl of DMSO was added to each well, and the cell culture plate
was shaken for 10 min to dissolve the crystals. Subsequently, the
light absorption value of each well was measured at 490 nm using a
microplate reader (Thermo Fisher Scientific, Inc.), and the results
were recorded. The cell growth curve, with time as the x-axis and
absorbance as the y-axis, was plotted.
EdU assay
A-498 cells stably expressing shctrl or shRGS20 were
seeded on 96-well plates at a density of 100,000 cells/well. After
24 h of culture at 37°C, the cells were incubated at 37°C for 4 h
with DMEM containing EdU (50 µM; Guangzhou RiboBio Co., Ltd.).
Subsequently, cells were fixed with 4% formaldehyde for 20 min at
room temperature, followed by the addition of 2 mg/ml of glycine
for 5 min at room temperature. After treatment with 0.5% Triton
X-100 at room temperature for 10 min, the cells were washed twice
with PBS and treated with 200 µl of 1X Apollo reaction cocktail
from a Cell-Light EdU Apollo488 In Vitro kit (Guangzhou
RiboBio Co., Ltd.) for 20 min at room temperature, according to the
manufacturer's protocol. The nuclear DNA was stained with DAPI (5
µg/ml) for 10 min at room temperature. Images were obtained using a
fluorescence microscope (Motic Incorporation, Ltd.; magnification,
×100).
Cell cycle assay
A-498 cells stably expressing shctrl or shRGS20 were
seeded onto 6-well plates at a density of 3×10⁵
cells/well. After 24 h of culture at 37°C, the cells were harvested
and fixed in 70% ethanol at 4°C overnight. After washing twice with
PBS, the fixed cells were incubated in PBS containing 0.2% Triton
X-100 and 10 µg/ml RNase at 37°C for 30 min. Subsequently, the
cells were incubated with 20 µg/ml propidium iodide (PI;
Invitrogen; Thermo Fisher Scientific, Inc.) at room temperature for
30 min in the dark and analyzed using the NovoCyte setup (ACEA
Bioscience Inc.; Agilent Technologies, Inc.) and
NovoExpress® software 1.4.1 (ACEA Bioscience Inc.;
Agilent Technologies, Inc.).
Apoptosis assay
A total of 1×10⁶ A-498 cells stably
expressing shctrl or shRGS20 were seeded onto 6-well plates. After
48 h of culture at 37°C, adherent and floating cells were collected
by centrifugation at 200 × g for 5 min at room temperature, washed
with PBS and detected using an Annexin V-FITC/PI Apoptosis
Detection kit (cat. no. A211-02; Vazyme Biotech Co., Ltd.)
according to the manufacturer's protocol. The results were analyzed
using the NovoCyte setup (ACEA Bioscience Inc.; Agilent
Technologies, Inc.) and NovoExpress® software 1.4.1
(ACEA Bioscience Inc.; Agilent Technologies, Inc.). The results
were presented as the percentage of apoptotic cells (including
early and late apoptotic cells) relative to the total number of
analyzed cells.
Wound healing assay
A-498 cells infected with shctrl or shRGS20 virus
were seeded onto 6-well plates at 100% confluence. A straight-line
wound was created by scratching the culture using a 2-µl pipette
tip. The cells were continuously cultured in medium without serum
for 48 h at 37°C and observed using a light microscope (Motic
Incorporation, Ltd.; magnification, ×40). The percentage of the
wound healing was quantified using ImageJ 1.8.0 software (National
Institutes of Health).
Transwell assay
Migration was measured using Matrigel-free Transwell
plates (Corning, Inc.) containing an 8-µm porous membrane, while
invasion was measured using Transwell plates precoated with 25%
Matrigel at 37°C for 30 min. In total, 1×10⁵ A-498 cells
stably expressing shRGS20 or shctrl were plated in the upper
chambers of the Transwell plates in 100 µl DMEM without FBS. A
total of 500 µl DMEM with 10% FBS was plated in the lower chambers
of the Transwell plates. After 24 h of incubation 37°C, migrating
or invading cells were stained with 0.5% crystal violet at room
temperature for 30 min, and then the cells in six random fields
were photographed and counted using a light microscope (Motic
Incorporation, Ltd.; magnification, ×100) and ImageJ v1.48
(National Institutes of Health), respectively.
Bioinformatics analysis
Clinical information and raw expression data from
539 patients with RCC were downloaded from The Cancer Genome Atlas
(TCGA) database (https://portal.gdc.cancer.gov/). Among them, there
were 340 patients with tumor stage 1 (T1) or T2, 190 patients with
T3 or T4, 239 cases with no lymph node metastasis (N0), 16 cases
with lymph node metastasis (N1), 420 cases with no distant
metastasis (M0) and 78 cases with distant metastasis (M1).
RGS20 expression in tumor and adjacent normal
tissues (ANTs) was compared using R Limma package (version 3.8)
(24). Univariate and multivariate
Cox proportional hazard regression, Kaplan-Meier survival analysis
and receiver operating characteristic (ROC) curve analysis were
performed. Gene set enrichment analysis (GSEA) was performed using
GSEA version 2.0 to further understand the biological pathway of
RGS20 in the pathogenesis of RCC, as previously described (25–27).
Pearson's correlation analysis was used for ranking genes.
The interaction network among proteins expressed by
RGS20-associated genes was established as previously described
(24). The minimum interaction score
required was 0.700 (high confidence), and the protein nodes that
did not interact with other proteins were deleted. Subsequently,
the Cytoscape software (http://www.cytoscape.org; version 3.7.1) was used to
construct the interaction network, and the top 10 hub genes were
identified according to the Cytoscape plug-in (degrees ranking of
cytoHubba). The co-expression gene network of RCC was analyzed as
previously described (24). The
cBioPortal database (http://www.cBioPortal.org/) was used to identify the
RGS20 co-expressed genes. The genes with a Spearman correlation
coefficient >0.5 or <-0.5 were selected to plot the gene
co-expression network. Additionally, the associations between RGS20
expression and various immune cell infiltration in RCC were
evaluated using CIBERSORT in R version 4.1.0, as previously
described (28), and plotted using
ggplot2 in R version 4.1.0. The associations between RGS20
expression and various immune cell markers in RCC were assessed
using the cBioPortal database (http://www.cBioPortal.org/), and plotted using ggplot2
in R version 4.1.0.
Statistical analysis
All assays were performed independently at least
three times. Data were presented as the mean ± SD. All statistical
analyses were performed using SPSS software 22.0 (IBM Corp.), and
GraphPad Prism 8.2.1 (GraphPad Software, Inc.) was used to plot the
graphs. Mann-Whitney test was performed for non-parametric data
between two groups. Wilcoxon signed rank test was used to compare
matched samples for non-parametric data. One-way ANOVA followed by
Tukey's post-hoc test was used to identify the significant
differences among multiple groups. P<0.05 was considered to
indicate a statistically significant difference.
Results
RGS20 mRNA expression is increased in
RCC tissues and cell lines
The high-throughput RNA sequencing data of the TCGA
RCC cohort was analyzed, revealing that RGS20 mRNA expression was
significantly increased in tumor tissues compared with in ANTs
(Fig. 1A and B).
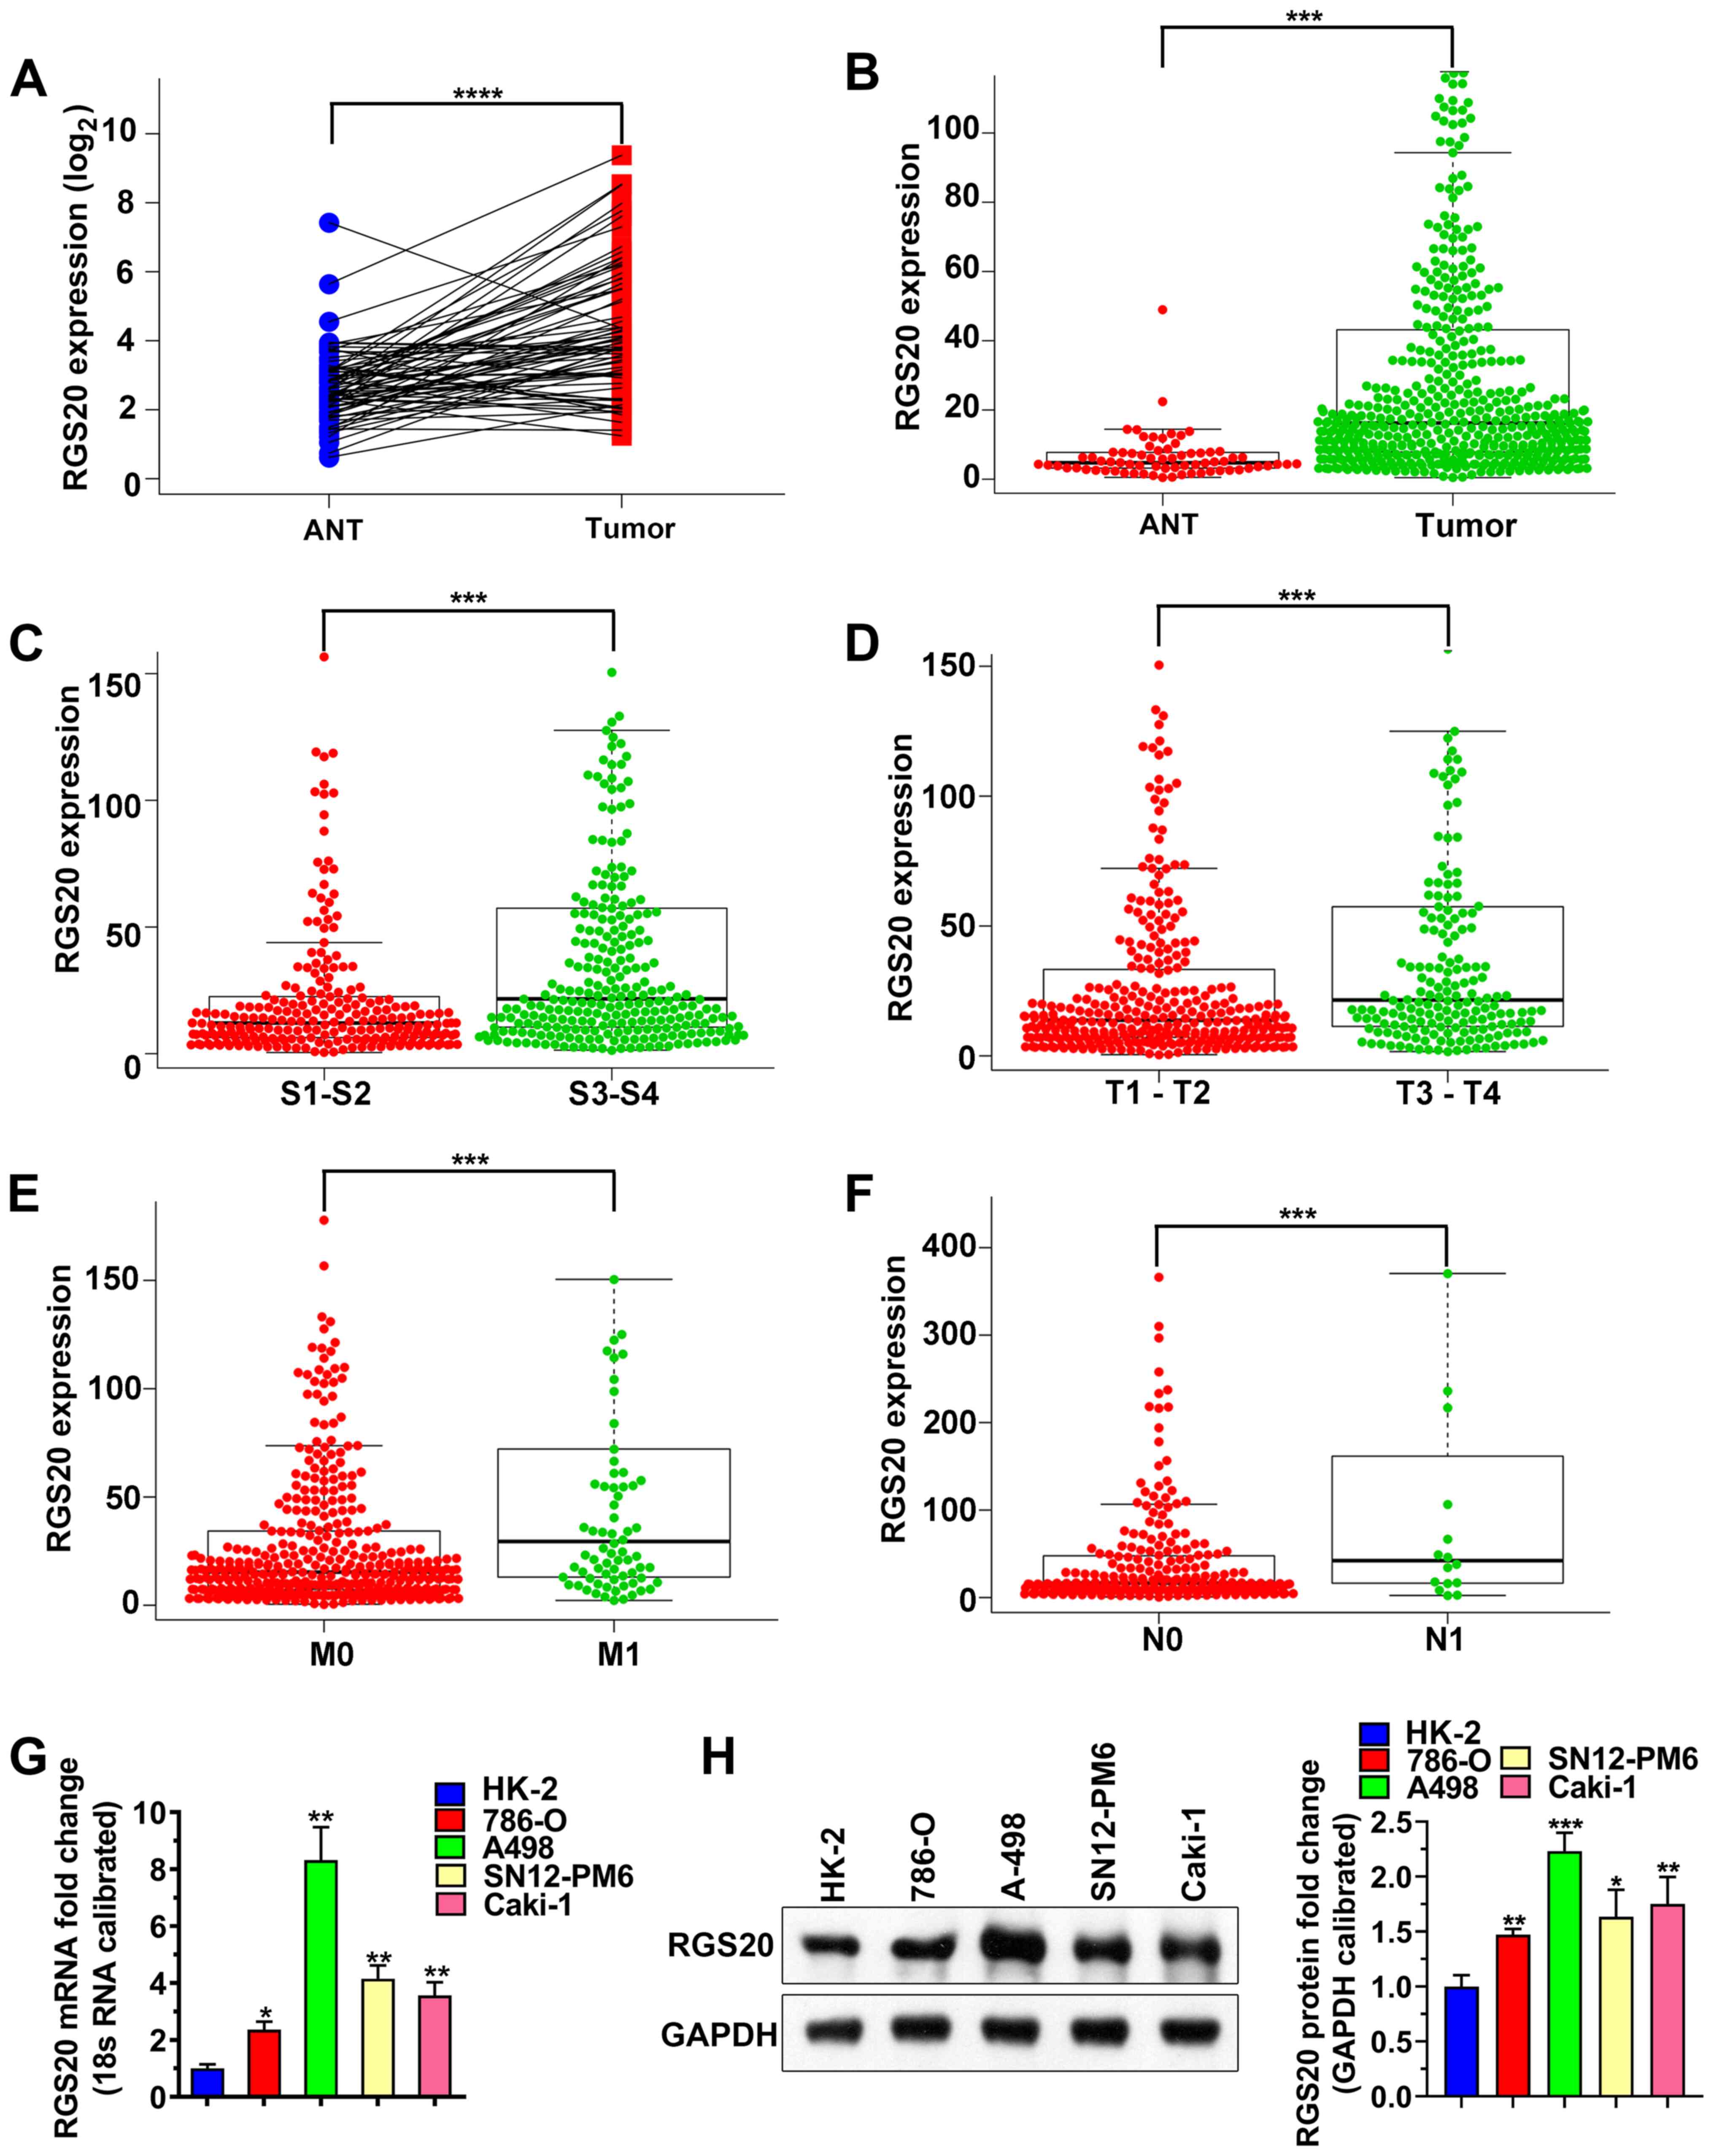 | Figure 1.RGS20 expression is upregulated in
RCC tissues. (A) RGS20 expression was significantly increased in
RCC tissues compared with in paired ANTs of patients from TCGA RCC
dataset. (B) Comparison between the RGS20 mRNA expression in ANTs
and unpaired RCC tissues from TCGA. Association between RGS20
expression and (C) TNM stage, (D) T stage, (E) M stage and (F) N
stage in RCC. ***P<0.001 and ****P<0.0001. RGS20 expression
in five cell lines (HK-2, 786-O, A-498, SN12-PM6 and Caki-1) was
analyzed using (G) quantitative PCR and (H) western blot analysis.
Data are representative of ≥3 independent experiments and shown as
mean ± SD. *P<0.05, **P<0.01 and ***P<0.001 vs. HK-2.
ANTs, adjacent normal tissues; S, TNM stage; T, tumor; M, distant
metastasis; N, lymph node metastasis; RGS20, regulator of G protein
signaling 20; TCGA, The Cancer Genome Atlas; RCC, renal cell
carcinoma. |
In addition, the association between RGS20 mRNA
expression and the TNM stage, tumor (T) stage, lymph node
metastasis or distant metastasis was analyzed. It was revealed that
RGS20 mRNA expression was significantly higher in RCC tissues at
stage III + IV than at stage I + II, as well as at T stage 3 + 4
than at T stage 1 + 2 (Fig. 1C and
D). Additionally, RGS20 mRNA expression in metastatic RCC (N1,
M1) was significantly higher than in non-metastatic RCC (N0, M0)
(Fig. 1E and F). These data
suggested that RGS20 may be involved in RCC progression.
This observation was validated by comparing RGS20
expression between RCC cell lines (786-O, A-498, SN12-PM6 and
Caki-1) and the normal renal tubular epithelial cell line, HK-2,
using qPCR and western blot analysis. As shown in Fig. 1G and H, both the mRNA and protein
expression levels of RGS20 were significantly higher in RCC cell
lines than in HK-2 cells. RGS20 expression was the highest in A-498
cells; thus, A-498 cells were chosen for subsequent
experiments.
In summary, the present results indicated that RGS20
mRNA, which was highly expressed in RCC tissues, may be closely
associated with the progression and metastasis of RCC. Moreover,
the mRNA and protein expression levels of RGS20 were high in RCC
cell lines.
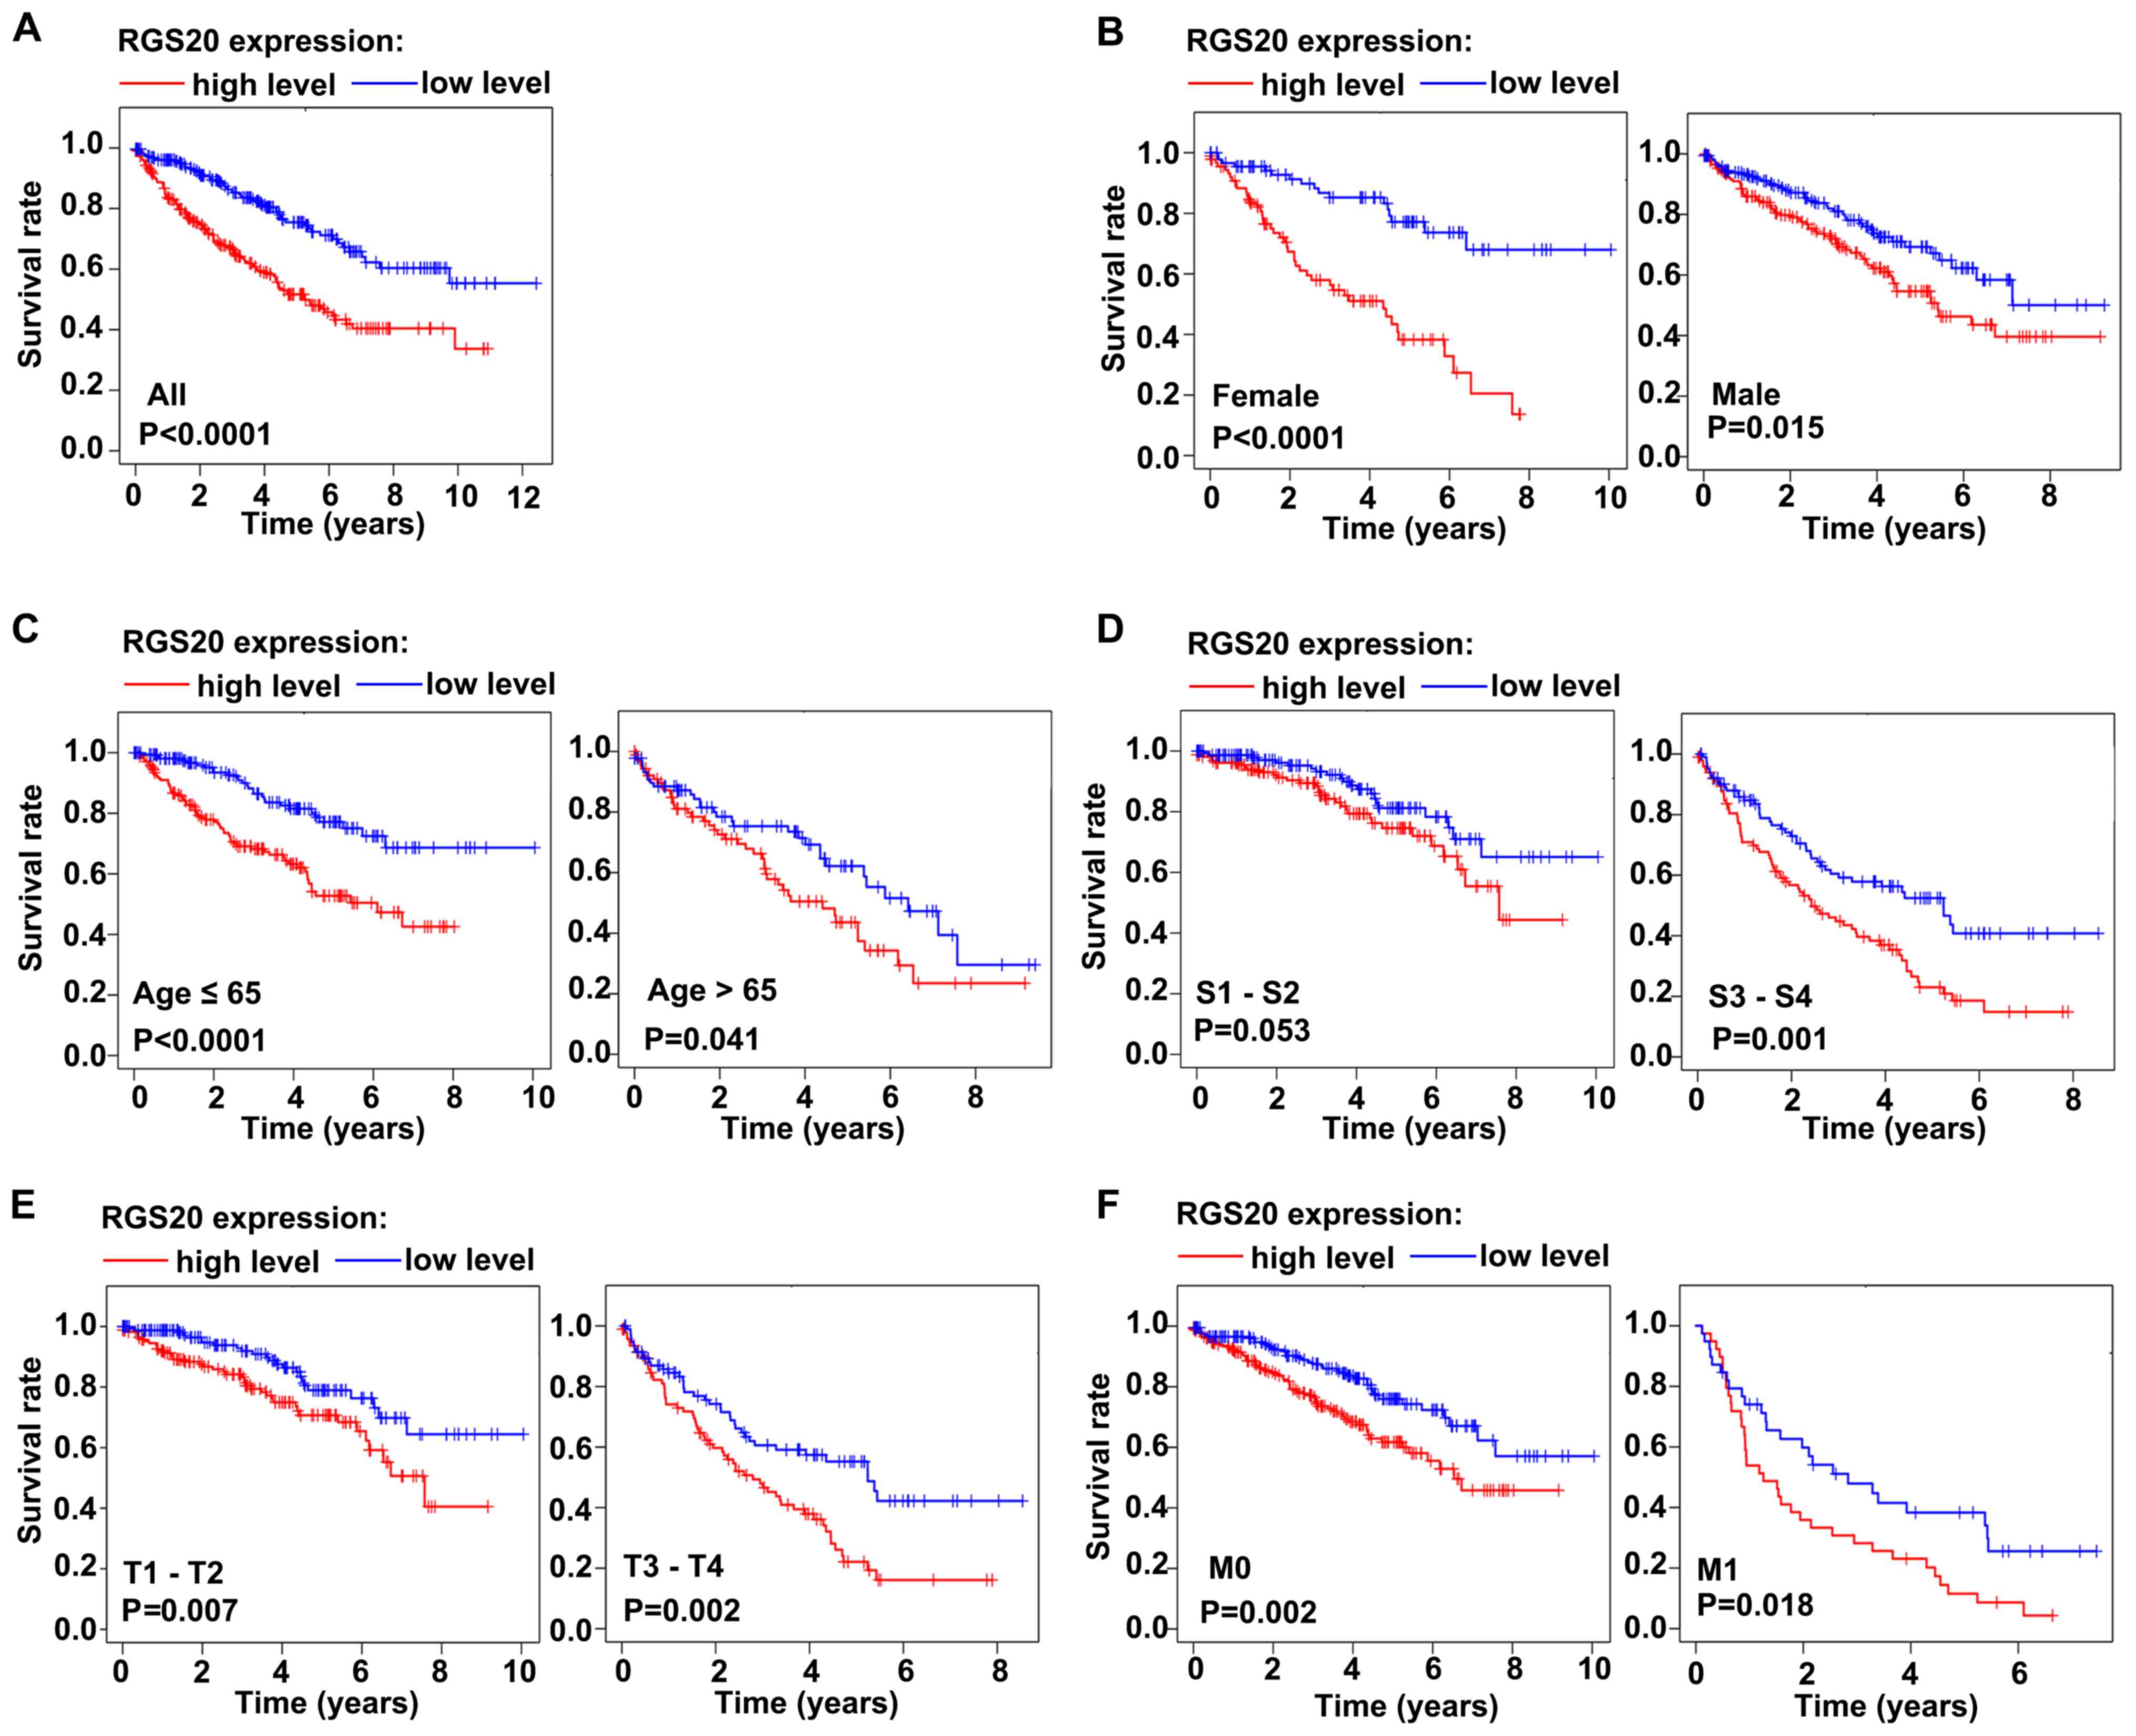
Patients with RCC with high RGS20 mRNA
expression have a poorer survival rate than those with low RGS20
mRNA expression
Next, the clinical outcome of patients with RCC from
TCGA database having low or high RGS20 mRNA expression was
investigated using Kaplan-Meier survival analysis. The patients
were divided into two groups, high and low level, based on the
median RGS20 mRNA expression value (median value, 16.17291467). The
survival rate of patients with RCC with high RGS20 mRNA expression
was significantly worse than that of patients with low RGS20 mRNA
expression (P<0.0001; Fig. 2A).
Among female patients, male patients, patients aged >65 years,
patients aged ≤65 years, patients with stage III and IV, T stage 1
and 2, T stage 3 and 4, M0 or M1, those with high RGS20 mRNA
expression had a significantly worse survival rate than those with
low RGS20 mRNA expression (Fig.
2B-F). These results indicated that the upregulation of RGS20
mRNA expression in RCC tissues is associated with a poor prognosis
in these patients.
In addition, the ROC curve analysis revealed that
RGS20 expression could not effectively distinguish patients at
different stages, including living/dead stage (Fig. S1A), grade 1 + grade 2/grade 3 +
grade 4 (Fig. S1B), stage I + stage
II/stage III + stage IV (Fig. S1C),
T stage 1 + T stage 2/T stage 3 + T stage 4 (Fig. S1D), and N0/N1 (Fig. S1E). However, the expression levels
of RGS20 may be used to distinguish M0 and M1 stage patients
(Fig. S1F, one year: AUC=0.769, 95%
CI: 0.694–0.844; five years: AUC=0.718, 95% CI: 0.634–0.803).
Moreover, univariate and multivariate Cox proportional hazard
regression analyses were performed. In the univariate analysis,
age, T stage, TNM stage, distant metastasis and RGS20 expression
were significantly associated with overall survival (OS) in RCC
(all P<0.05; Table III). The
subsequent multivariate analysis confirmed that RGS20 upregulation
(HR, 1.193; 95% CI, 1.092–1.304; P<0.001), age (HR, 1.6966; 95%
CI, 1.235–2.330; P=0.001) and TNM stage (HR, 1.660; 95% CI,
1.081–2.549; P=0.021) were independent indicator of unfavorable OS
in RCC after adjusting other prognostic indicators (Table III). In summary, these findings
suggested that the prognosis of patients with RCC with high RGS20
mRNA expression was poorer than that of patients with low RGS20
expression.
| Table III.Univariate and multivariate Cox
regression analyses for overall survival in patients with renal
cell carcinoma. |
Table III.
Univariate and multivariate Cox
regression analyses for overall survival in patients with renal
cell carcinoma.
|
| Univariate
analysis | Multivariate
analysis |
|---|
|
|
|
|
|---|
| Factors | Hazard ratio (95%
CI) | P-value | Hazard ratio (95%
CI) | P-value |
|---|
| RGS20 expression
(low vs. high) | 1.319
(1.214–1.432) | <0.001 | 1.193
(1.092–1.304) | <0.001 |
| Age (≤65 vs. >65
years) | 1.659
(1.216–2.263) | 0.001 | 1.6966
(1.235–2.330) | 0.001 |
| Sex (male vs.
female) | 0.931
(0.675–1.284) | 0.663 | 0.892
(0.643–1.238) | 0.494 |
| Stage (I+II vs.
III+IV) | 1.889
(1.649–2.164) | <0.001 | 1.660
(1.081–2.549) | 0.021 |
| T stage (T1+T2 vs.
T3+T4) | 1.941
(1.639–2.299) | <0.001 | 0.878
(0.593–1.298) | 0.513 |
| M stage (M0 vs.
M1) | 4.284
(3.106–5.908) | <0.001 | 1.275
(0.663–2.453) | 0.467 |
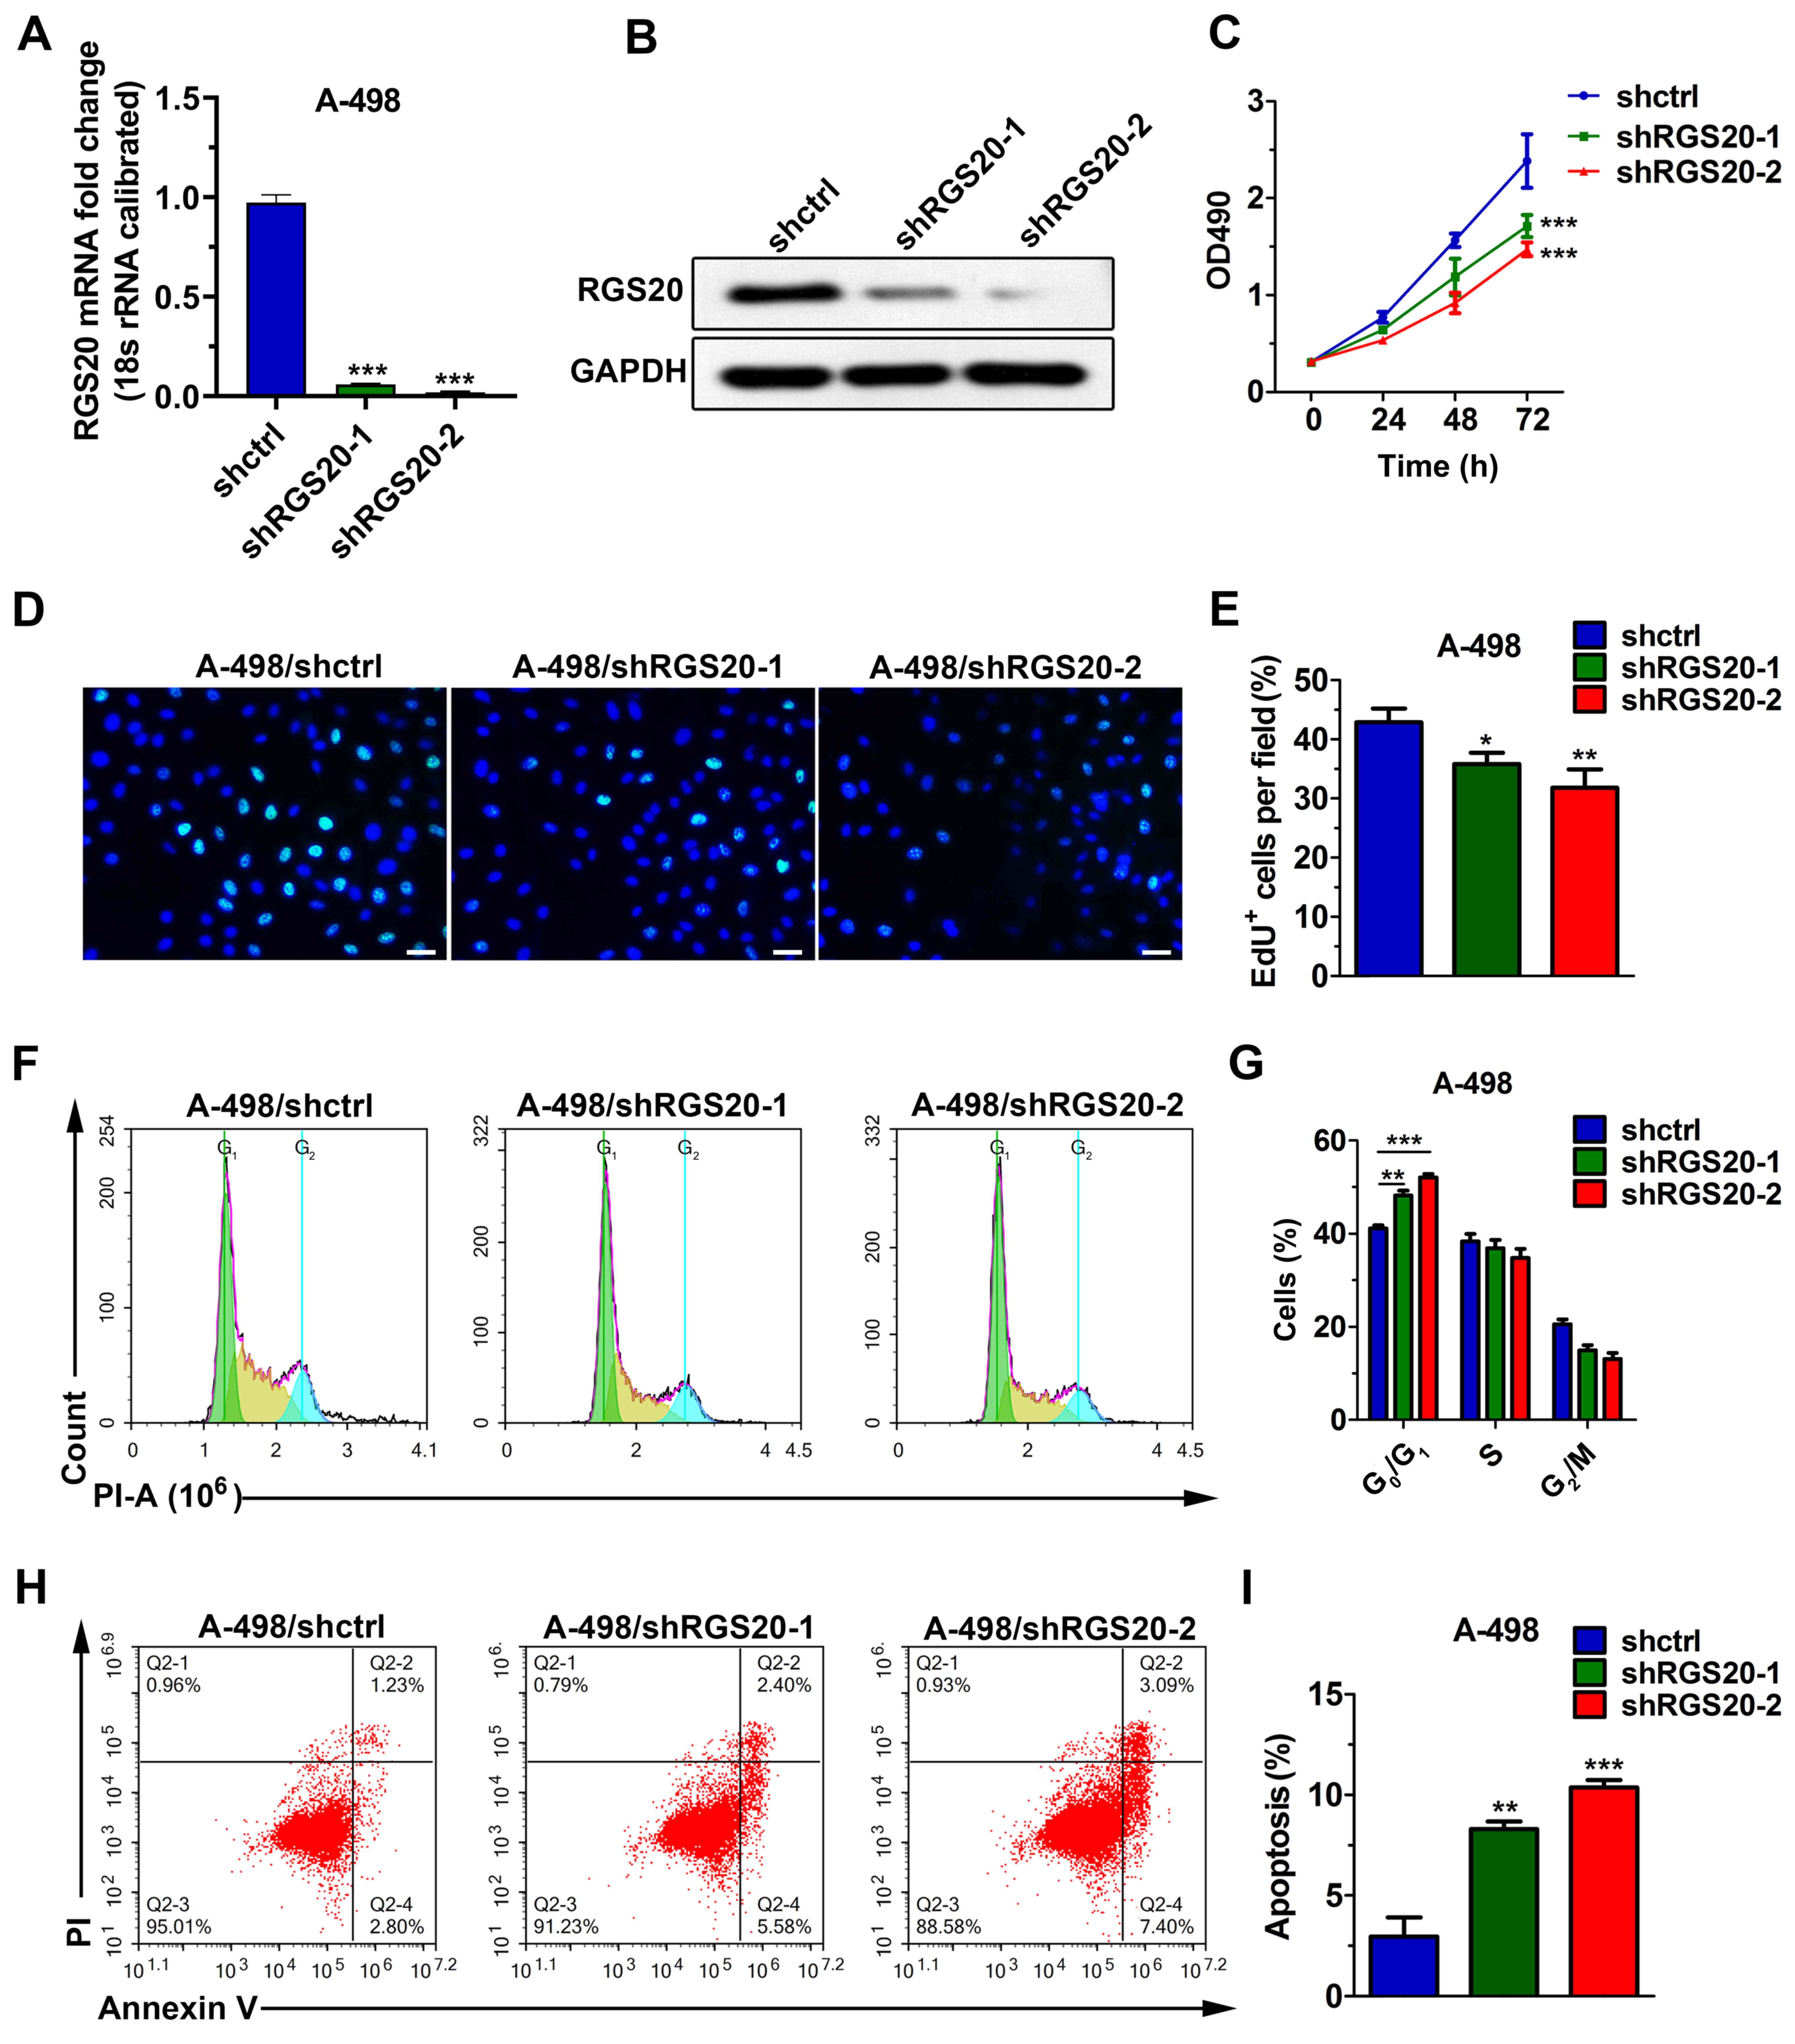
RGS20 enhances cell proliferation and
suppresses apoptosis
To study the function of RGS20 in RCC, a lentivirus
system was used to knock down its expression in A-498 cells. Two
lentiviruses targeting human RGS20 (shRGS20-1 and shRGS20-2) and a
negative control (shctrl) were generated and used to construct
A-498 stably transfected cell lines. The silencing effect was then
assessed using western blot analysis and qPCR. The results
indicated that shRGS20-1 and shRGS20-2 effectively inhibited the
expression levels of endogenous RGS20 in A-498 cells (Fig. 3A and B).
An MTT assay was used to study the effect of RGS20
on cell proliferation. The proliferation of A-498 cells stably
expressing shRGS20 was significantly lower than that of A-498 cells
stably expressing shctrl, indicating that RGS20 promoted cell
proliferation (Fig. 3C). Moreover,
the EdU proliferation assay revealed that the RGS20-knockdown cells
had a significantly lower EdU+ rate compared with
control cells, suggesting that RGS20 increased the percentage of
EdU+ cells (Fig. 3D and
E). In addition, the cell cycle assay results indicated that
RGS20-knockdown increased the percentage of cells in the
G0/G1 phase, which suggested that RGS20
promoted cell proliferation (Fig. 3F and
G). An Annexin V/PI staining assay using flow cytometry
revealed that RGS20-knockdown significantly increased the
proportion of apoptotic cells (Fig. 3H
and I). These results indicated that RGS20 normally inhibited
apoptosis.
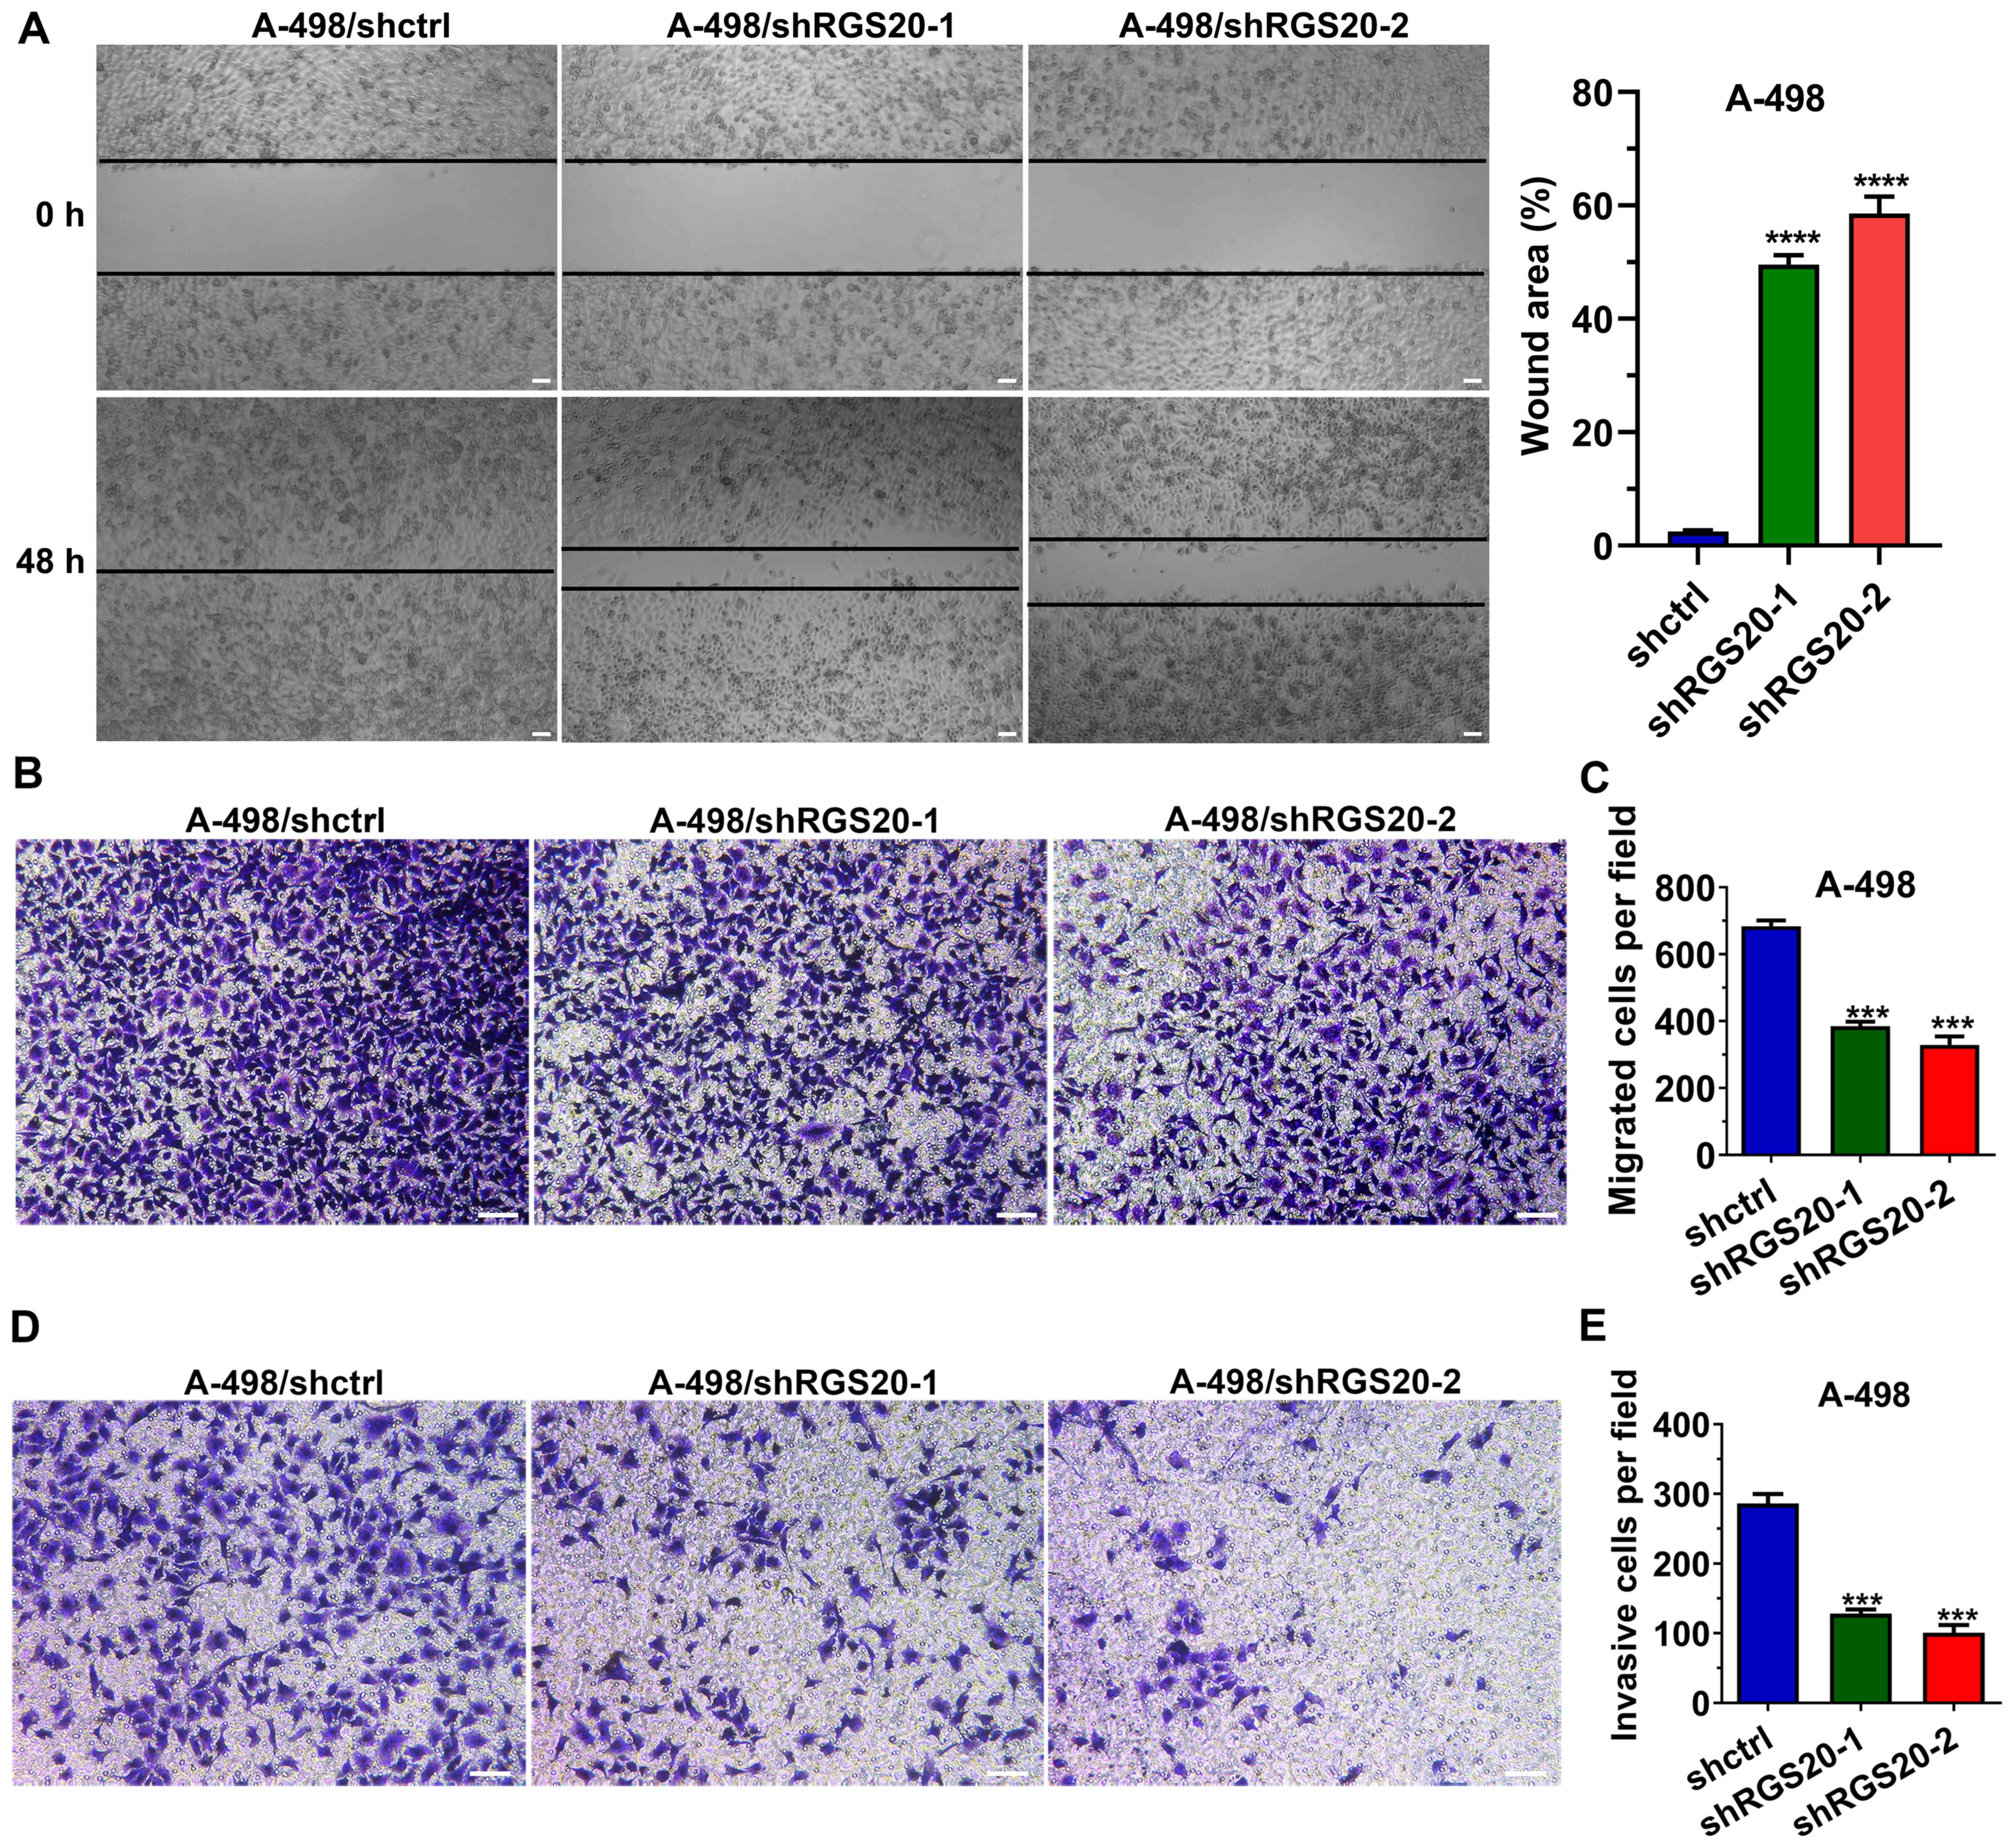
RGS20 promotes the migration and
invasion of RCC cells
A wound healing assay demonstrated that compared
with the shctrl group, the wound area of the shRGS20-1 group and
the shRGS20-2 group was significantly larger, indicating that the
wound healing capacity of A-498 cells was decreased with the
knockdown of RGS20 (Fig. 4A).
Moreover, a Transwell migration assay was used to evaluate the
effect of RGS20 on cell migration. The data revealed that the
knockdown of RGS20 significantly decreased the number of migrated
cells, indicating that RGS20 promoted cell migration (Fig. 4B and C). Consistent with these
findings, the Matrigel invasion assay revealed that RGS20-knockdown
also significantly decreased the number of invasive cells,
indicating that RGS20 normally promoted cell invasion (Fig. 4D and E).
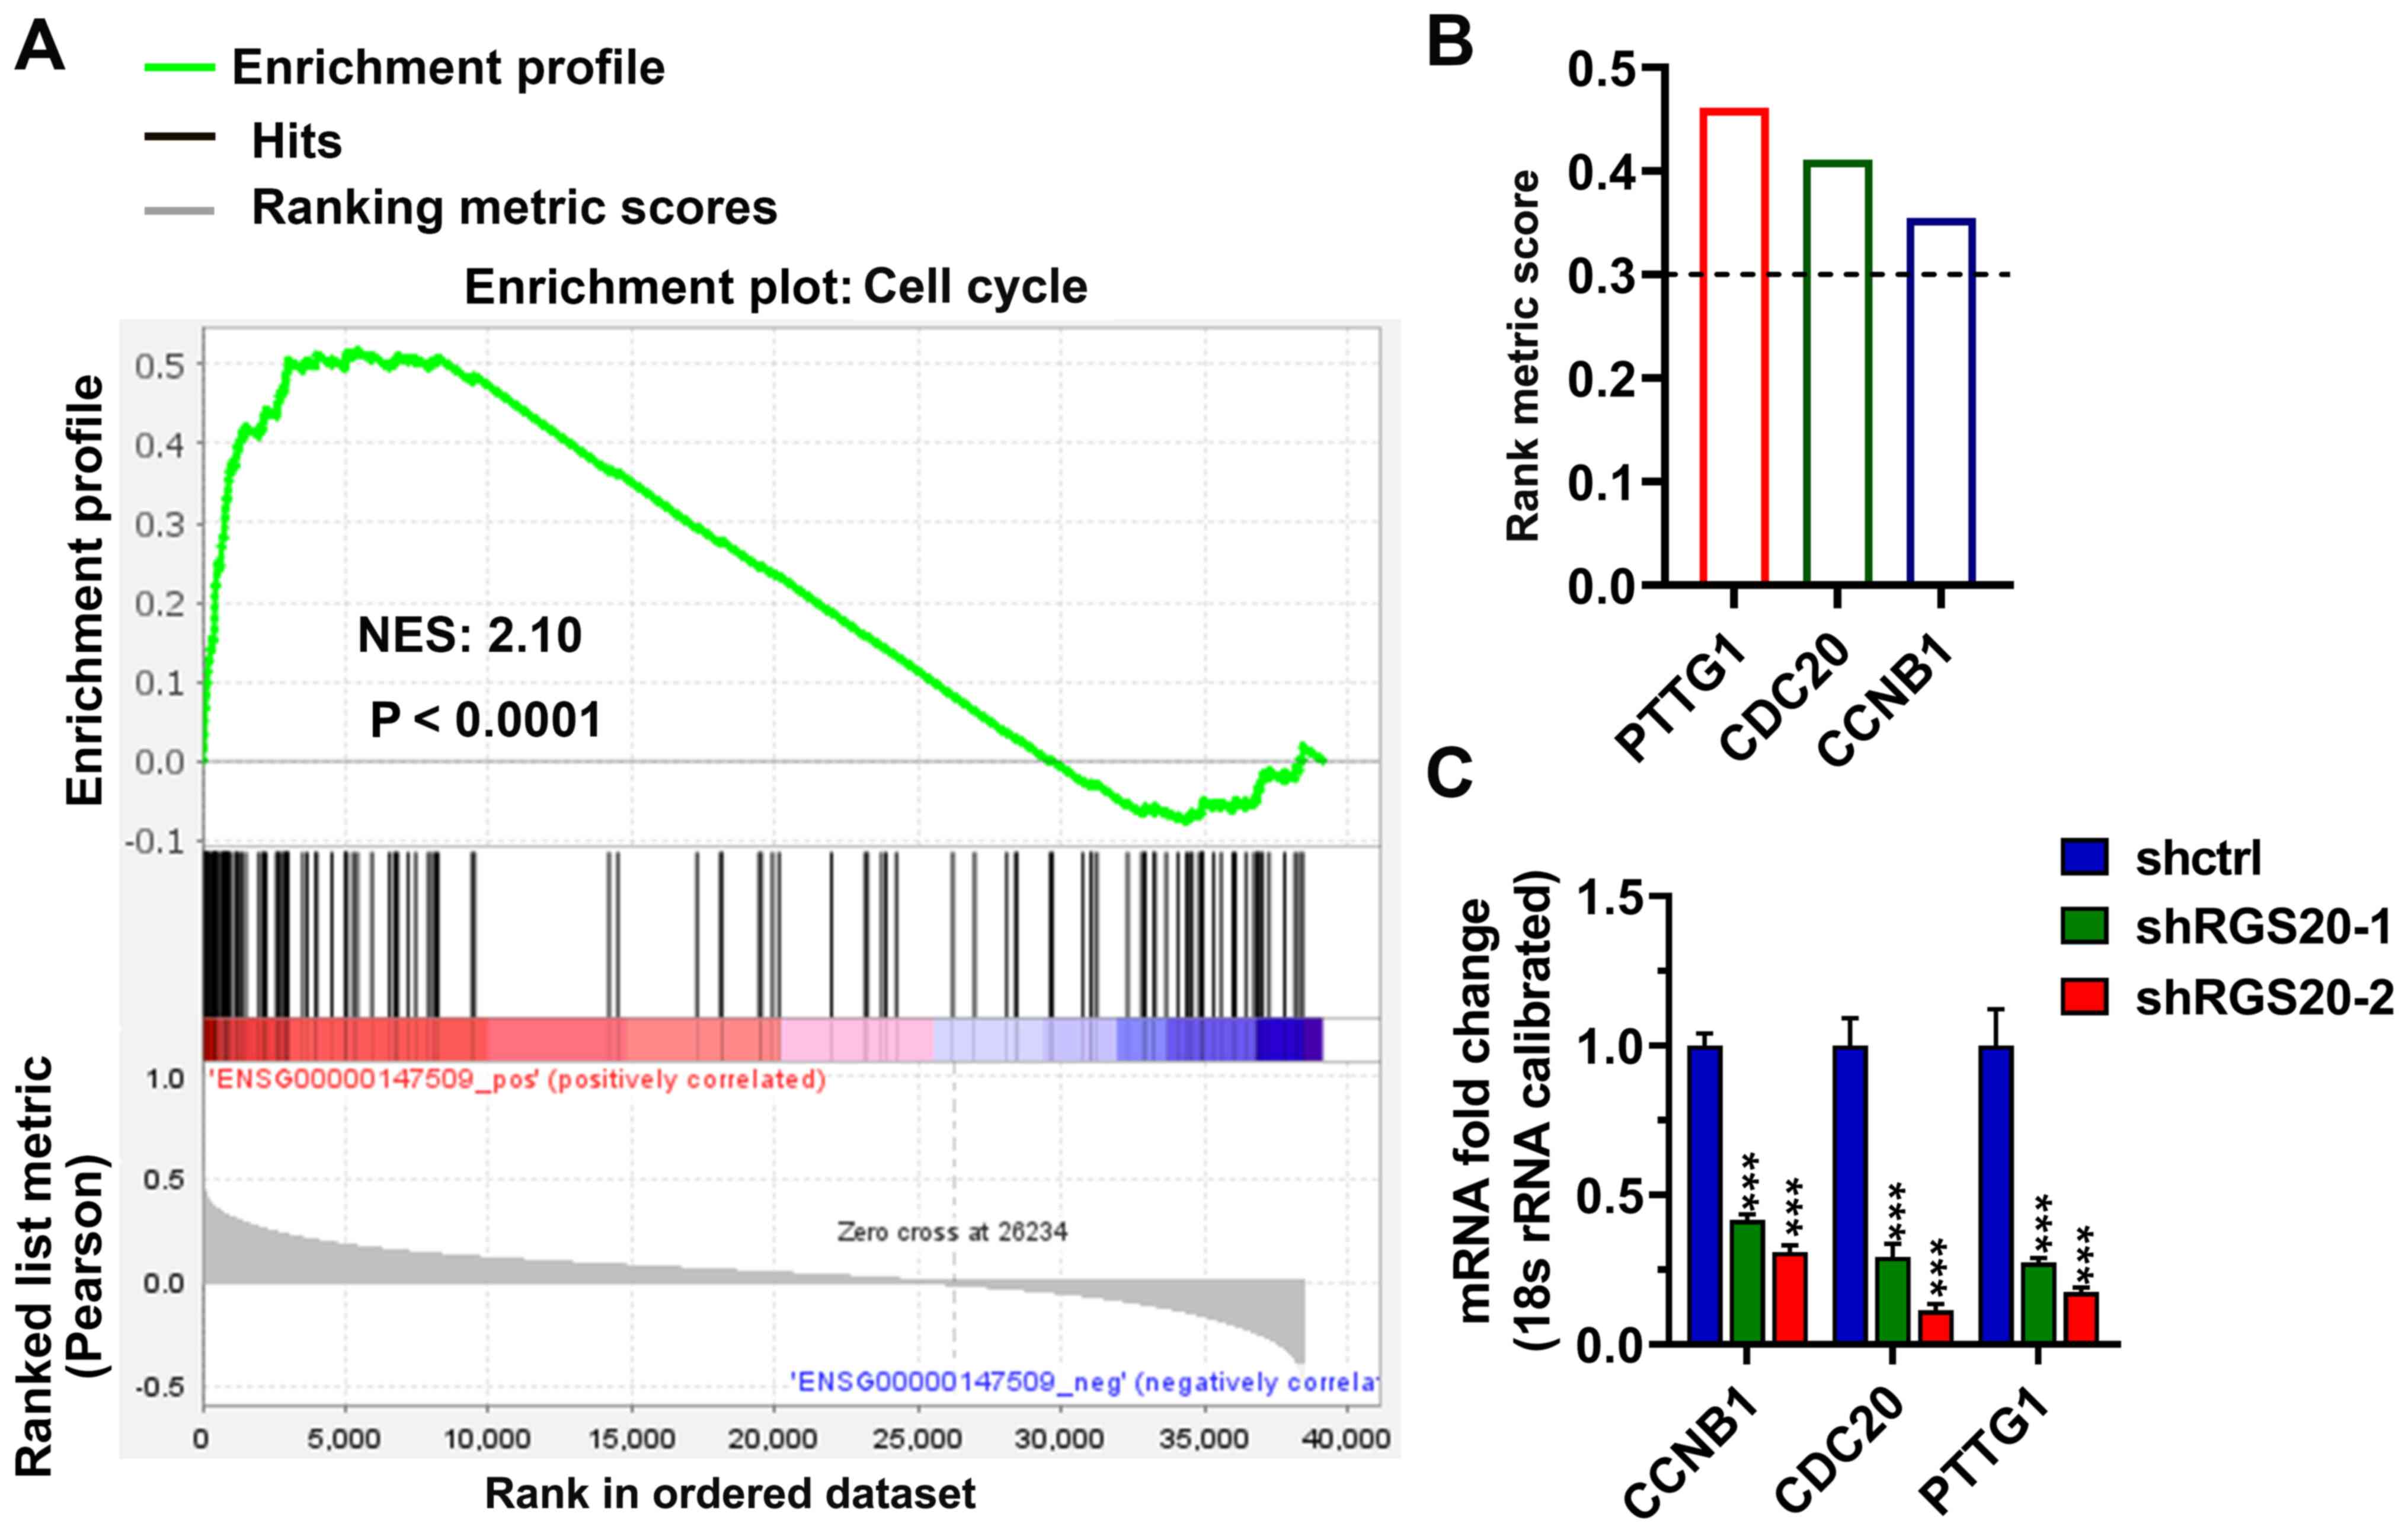
RGS20 regulates the expression levels
of securin (PTTG1), CDC20 and cyclin B1 (CCNB1) in RCC cells
A previous study has demonstrated that RGS20
regulates cell cycle-associated indicators in OSCC cells (17). Therefore, GSEA analysis was conducted
in the present study to investigate the effect of RGS20 mRNA
expression on cell cycle pathways in RCC. The data revealed that
there was significant correlation between RGS20 expression and the
cell cycle (Fig. 5A). The three
genes with the highest rank metric scores were PTTG1, CDC20 and
CCNB1 (Fig. 5B). This observation
was further evaluated using qPCR. As shown in Fig. 5C, the knockdown of RGS20
significantly decreased the mRNA expression levels of PTTG1, CDC20
and CCNB1.
Protein-protein interaction (PPI)
network and gene co-expression network
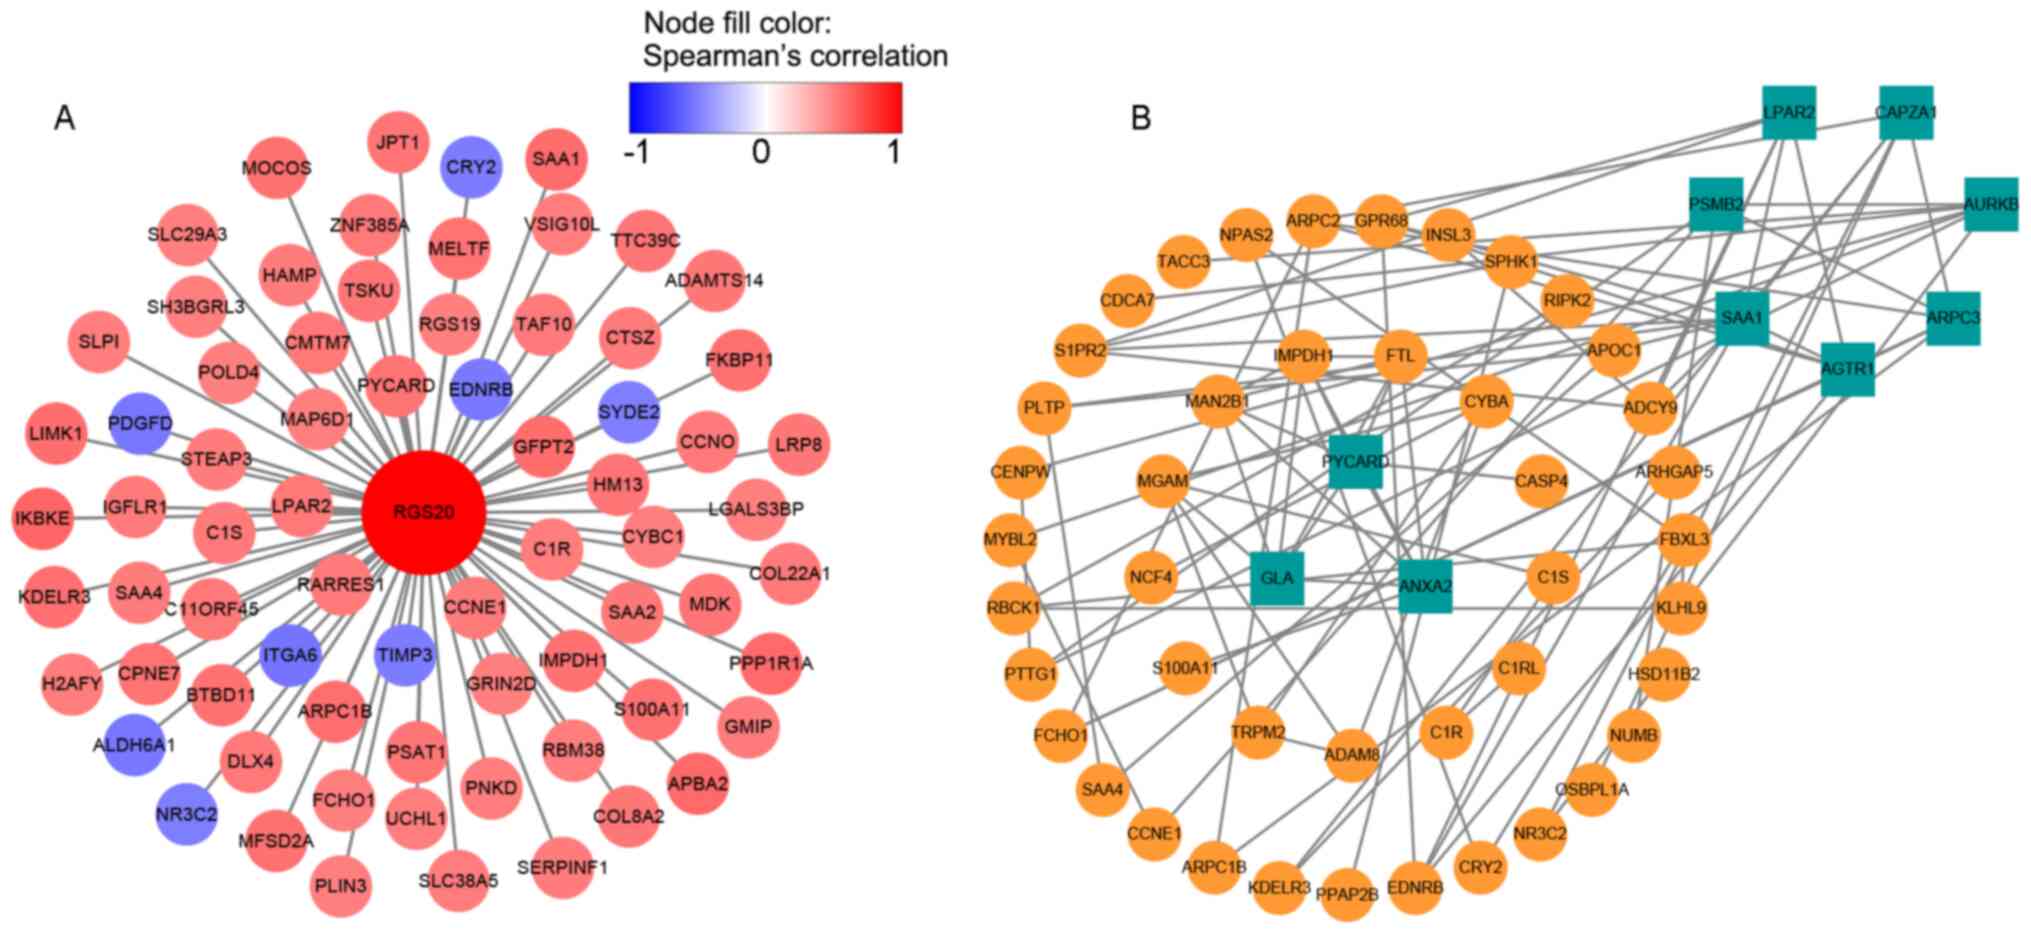
The cBioPortal database was used to identify the
RGS20 co-expressed genes, and a total of 72 genes with Spearman
correlation coefficients <-0.5 or >0.5 were selected for gene
co-expression network, which showed that RGS20 was positively
correlated with inhibitor of nuclear factor-κB kinase subunit ε
(IKBKE) (Fig. 6A). Subsequently,
genes with Spearman correlation coefficients <-0.3 or >0.3
were selected for the protein interaction networks. A total of 54
genes were filtered into the target gene PPI network, and 10 hub
genes (LPAR2, CAPZA1, AURKB, ARPC3, AGTR1, SAA1, PSMA2, PYCARD,
ANXA2 and GLA) were screened using Cytoscape 3.7.1 (Fig. 6B). The available data was not
sufficient to demonstrate that RGS20 interacts with these proteins;
thus, further investigation is required.
Correlations between RGS20 expression
and immune infiltration in RCC
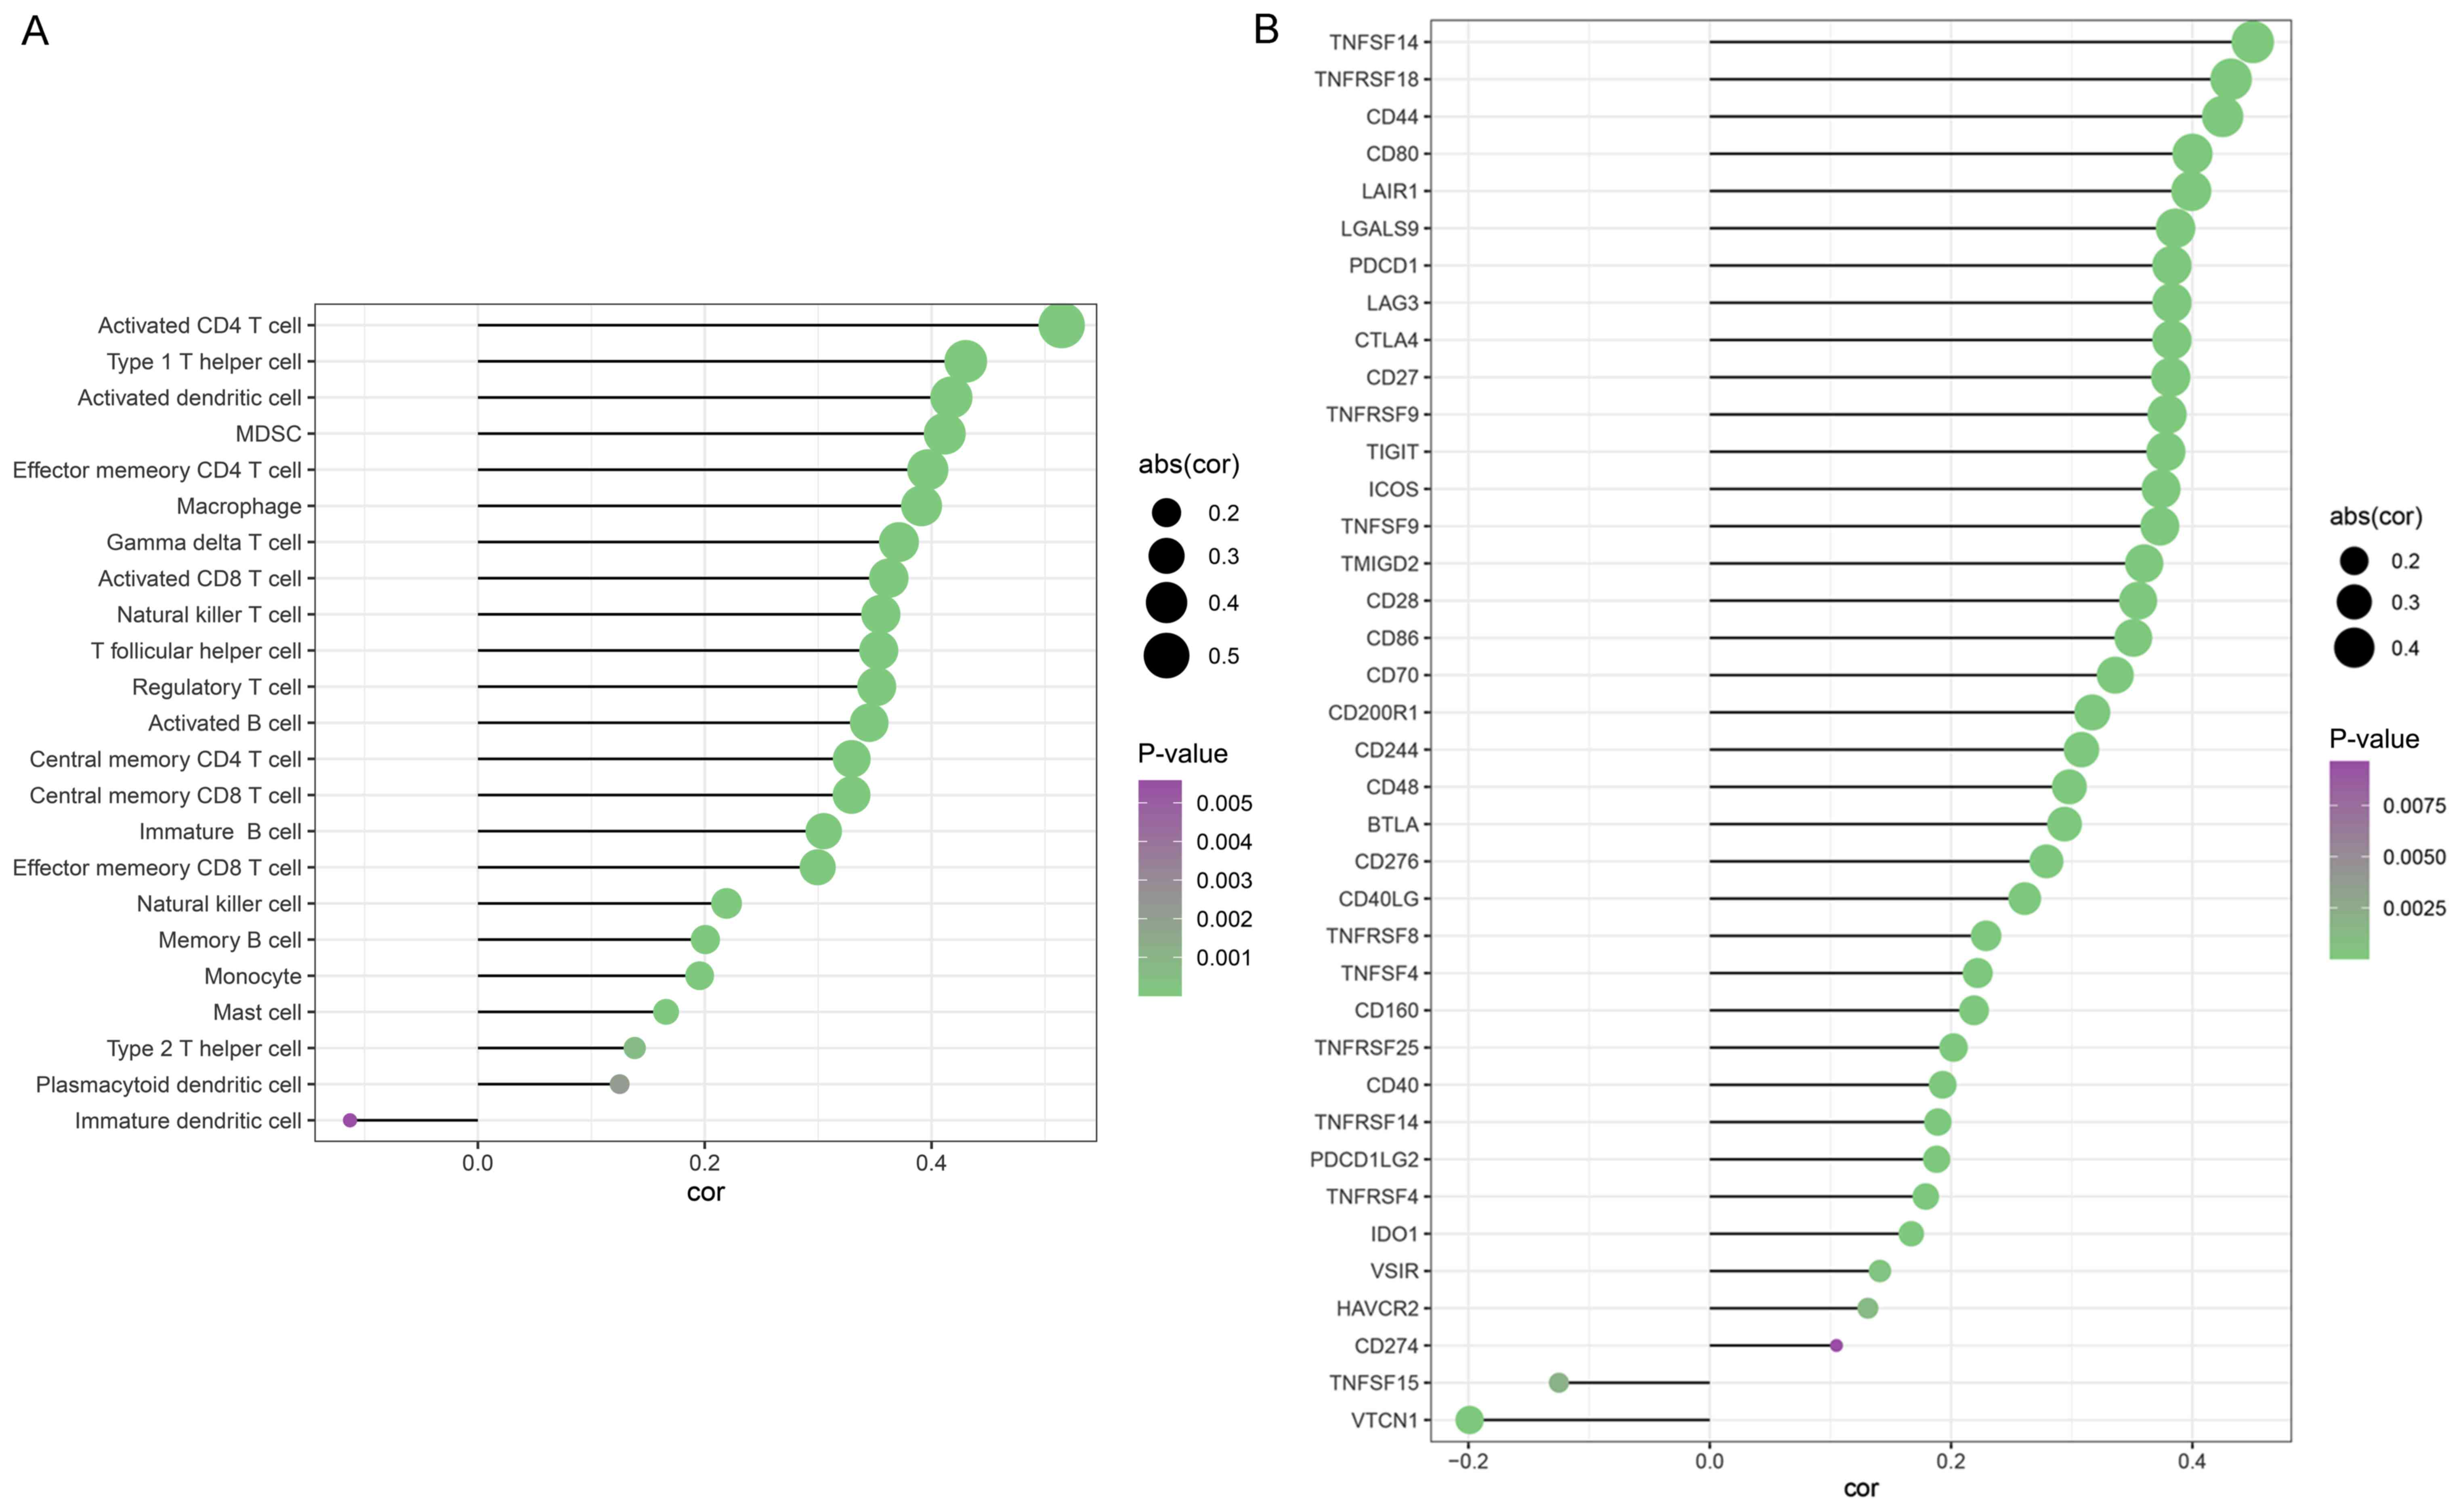
It has been previously shown that immune cells in
the tumor microenvironment can affect tumor progression (29). Moreover, the aforementioned findings
suggested the promoting role of RGS20 in RCC. Therefore, whether
RGS20 expression was associated with immune infiltration was
further investigated. The results revealed that RGS20 expression
was associated with the infiltration level of activated CD4 T
cells, type 1 T helper cells and activated dendritic cells
(Fig. 7A).
In order to further understand the potential
association between RGS20 and infiltrating immune cells, the
association between RGS20 and several immune cell markers was
studied, revealing that RGS20 expression was associated to a number
of immune cell markers in RCC, including TNFSF14, TNFRSF18 and CD44
(Fig. 7B). Overall, RGS20 may have
the potential to promote immune infiltration in RCC.
Discussion
It has been demonstrated that most RGS proteins are
involved in the occurrence and development of various types of
cancer, including breast, ovarian, lung and prostate cancer
(19,30–33);
therefore, targeting these proteins has great therapeutic
potential. The present study revealed that elevated RGS20 mRNA
expression was associated with a poor prognosis in patients with
RCC and that the knockdown of RGS20 inhibited the motility of RCC
cell lines. These data indicated the importance of RGS20 in the
diagnosis and treatment of RCC. A previous study has reported that
RGS20 expression is upregulated in various types of tumor, such as
triple-negative breast cancer and lung cancer (19). In the present study, TCGA database
was analyzed to demonstrate that RGS20 mRNA expression in RCC
tissues was higher than that in ANTs. Kaplan-Meier survival
analysis revealed that high mRNA expression levels of RGS20 were
associated with a decreased survival rate of patients. This
indicated that RGS20 may be a potential biomarker for the diagnosis
and prognosis estimation of patients with RCC.
A study has indicated that RGS20 can enhance the
aggregation, migration, invasion and adhesion of H1299, A549, HeLa
and MDA-MB-231 cell lines (21).
Consistent with these findings, knocking out RGS20 in RCC cell
lines in the present study severely impaired cell migration and
invasion. In addition, the knockdown of RGS20 induced G1
arrest and apoptosis in A-498 cells, which may contribute to cell
proliferation inhibition. Another study has identified that RGS20
is lowly expressed in luminal breast cancer tissues and highly
expressed in triple-negative breast cancer (TNBC) tissues by
analyzing the data from TCGA, indicating that the expression
patterns of RGS20 are different in different types of tumor
(19). Moreover, data from TCGA
indicated that RGS20 expression in TNBC with lymph node metastasis
was higher than that in TNBC without lymph node metastasis, and
immunohistochemistry revealed that TNBC tissues with high RGS20
expression had a risk of lymph node metastasis (19). Consistent with the aforementioned
studies, the present study revealed that RGS20 mRNA expression in
RCC tissues with lymph node metastasis and distant metastasis was
higher than that in RCC tissues without metastasis, suggesting that
RGS20 may promote RCC metastasis.
To elucidate the possible mechanism of
RGS20-mediated motility of RCC cells, GSEA was performed to
identify the associated biological processes and signaling pathways
using high throughput RNA sequencing data of TCGA RCC cohort. The
results revealed that the cell cycle-associated genes PTTG1, CDC20
and CCNB1 were associated with RGS20 expression. CDC20 acts as a
regulatory protein at multiple points in the cell cycle and is
involved in late nuclear movement and chromosome segregation
(34). CCNB1 is a regulatory protein
involved in mitosis and controls the G2/M transition
phase of the cell cycle (35).
PTTG1, which is highly expressed in various types of tumor,
including breast, ovarian and head and neck cancer, promotes sister
chromatid separation, in vitro transformation and in
vivo tumorigenic activities (36). The present study demonstrated that
following the knockdown of RGS20, the mRNA expression levels of
PTTG1, CDC20 and CCNB1 in RCC cells were significantly decreased,
suggesting that RGS20 may affect cell proliferation, migration and
invasion by regulating the expression levels of those three
genes.
Gene co-expression network analysis demonstrated
that RGS20 was highly positively correlated with IKBKE (Fig. 6A). Studies have confirmed that IKBKE
promotes the development of pancreatic cancer, non-small cell lung
cancer, epithelial squamous cell carcinoma and other types of
cancer (37–39). Therefore, the present study
speculated that RGS20 may play a synergistic role with IKBKE in
promoting tumor growth.
Overall, the current results highlight the role of
RGS20 in tumorigenesis and metastasis. However, the present study
has some limitations, including the lack of immunohistochemical and
qPCR detection of RCC tissues, as well as related animal
experiments. Another limitation of the study was that ROC curve
analysis indicated that RGS20 expression could not be used to
predict patient status, grade, TNM stage and T stage of tumor.
In summary, the present study demonstrated that
RGS20 may serve a vital role in the proliferation and metastasis of
RCC cells, opening new avenues for targeted therapy of RCC.
Furthermore, these biological processes may be regulated by RGS20
via regulating the expression levels of PTTG1, CDC20 and CCNB1.
Since high RGS20 expression was associated with a poor prognosis in
patients with RCC, inhibiting RGS20 expression in tumor tissues may
constitute an effective treatment strategy.
Supplementary Material
Supporting Data
Acknowledgements
Not applicable.
Funding
The present study was supported by the Academic
research project of academician expert workstation of Xiamen Fifth
Hospital (grant no. 2018YJ005).
Availability of data and materials
The datasets used and/or analyzed during the current
study are available from the corresponding author on reasonable
request.
Authors' contributions
LJ, YH and ZW designed and coordinated the study.
LJ, JS and NZ performed the experiments, and acquired and analyzed
data. LJ, JS, NZ, YH and ZW interpreted the data. LJ, YH and ZW
wrote the manuscript. YH and ZW were responsible for confirming the
authenticity of all the raw data. All authors read and approved the
final version of the manuscript.
Ethics approval and consent to
participate
Not applicable.
Patient consent for publication
Not applicable.
Competing interests
The authors declare that they have no competing
interests.
References
|
1
|
Khalil Ibrahim A: Trends of adult primary
malignant renal tumors over 6 years. Pak J Med Sci. 29:1385–1388.
2013.PubMed/NCBI
|
|
2
|
Zhai W, Zhu R, Ma J, Gong D, Zhang H,
Zhang J, Chen Y, Huang Y, Zheng J and Xue W: A positive
feed-forward loop between LncRNA-URRCC and EGFL7/P-AKT/FOXO3
signaling promotes proliferation and metastasis of clear cell renal
cell carcinoma. Mol Cancer. 18:812019. View Article : Google Scholar : PubMed/NCBI
|
|
3
|
Ferlay J, Soerjomataram I, Dikshit R, Eser
S, Mathers C, Rebelo M, Parkin DM, Forman D and Bray F: Cancer
incidence and mortality worldwide: Sources, methods and major
patterns in GLOBOCAN 2012. Int J Cancer. 136:E359–E386. 2015.
View Article : Google Scholar : PubMed/NCBI
|
|
4
|
Chen W, Sun K, Zheng R, Zeng H, Zhang S,
Xia C, Yang Z, Li H, Zou X and He J: Cancer incidence and mortality
in China, 2014. Chin J Cancer Res. 30:1–12. 2018. View Article : Google Scholar : PubMed/NCBI
|
|
5
|
Wong MCS, Goggins WB, Yip BHK, Fung FDH,
Leung C, Fang Y, Wong SYS and Ng CF: Incidence and mortality of
kidney cancer: Temporal patterns and global trends in 39 countries.
Sci Rep. 7:156982017. View Article : Google Scholar : PubMed/NCBI
|
|
6
|
Siegel RL, Miller KD and Jemal A: Cancer
statistics, 2018. CA Cancer J Clin. 68:7–30. 2018. View Article : Google Scholar : PubMed/NCBI
|
|
7
|
Ravaud A, Motzer RJ, Pandha HS, George DJ,
Pantuck AJ, Patel A, Chang YH, Escudier B, Donskov F, Magheli A, et
al: Adjuvant sunitinib in high-risk renal-cell carcinoma after
nephrectomy. N Engl J Med. 375:2246–2254. 2016. View Article : Google Scholar : PubMed/NCBI
|
|
8
|
Frank I, Blute ML, Cheville JC, Lohse CM,
Weaver AL, Leibovich BC and Zincke H: A multifactorial
postoperative surveillance model for patients with surgically
treated clear cell renal cell carcinoma. J Urol. 170:2225–2232.
2003. View Article : Google Scholar : PubMed/NCBI
|
|
9
|
Patard JJ, Kim HL, Lam JS, Dorey FJ,
Pantuck AJ, Zisman A, Ficarra V, Han KR, Cindolo L, De La Taille A,
et al: Use of the University of California Los Angeles integrated
staging system to predict survival in renal cell carcinoma: An
international multicenter study. J Clin Oncol. 22:3316–3322. 2004.
View Article : Google Scholar : PubMed/NCBI
|
|
10
|
Sorbellini M, Kattan MW, Snyder ME, Reuter
V, Motzer R, Goetzl M, McKiernan J and Russo P: A postoperative
prognostic nomogram predicting recurrence for patients with
conventional clear cell renal cell carcinoma. J Urol. 173:48–51.
2005. View Article : Google Scholar : PubMed/NCBI
|
|
11
|
Calvo E, Schmidinger M, Heng DY, Grünwald
V and Escudier B: Improvement in survival end points of patients
with metastatic renal cell carcinoma through sequential targeted
therapy. Cancer Treat Rev. 50:109–117. 2016. View Article : Google Scholar : PubMed/NCBI
|
|
12
|
Chen Z, Zhu R and Zheng J, Chen C, Huang
C, Ma J, Xu C, Zhai W and Zheng J: Cryptotanshinone inhibits
proliferation yet induces apoptosis by suppressing STAT3 signals in
renal cell carcinoma. Oncotarget. 8:50023–50033. 2017. View Article : Google Scholar : PubMed/NCBI
|
|
13
|
Wang Y, Ho G, Zhang JJ, Nieuwenhuijsen B,
Edris W, Chanda PK and Young KH: Regulator of G protein signaling
Z1 (RGSZ1) interacts with Galpha i subunits and regulates Galpha
i-mediated cell signaling. J Biol Chem. 277:48325–48332. 2002.
View Article : Google Scholar : PubMed/NCBI
|
|
14
|
De Vries L, Elenko E, Hubler L, Jones TL
and Farquhar MG: GAIP is membrane-anchored by palmitoylation and
interacts with the activated (GTP-bound) form of G alpha i
subunits. Proc Natl Acad Sci USA. 93:15203–15208. 1996. View Article : Google Scholar : PubMed/NCBI
|
|
15
|
Nunn C, Mao H, Chidiac P and Albert PR:
RGS17/RGSZ2 and the RZ/A family of regulators of G-protein
signaling. Semin Cell Dev Biol. 17:390–399. 2006. View Article : Google Scholar : PubMed/NCBI
|
|
16
|
Wang J, Ducret A, Tu Y, Kozasa T,
Aebersold R and Ross EM: RGSZ1, a Gz-selective RGS protein in
brain. Structure, membrane association, regulation by Galphaz
phosphorylation, and relationship to a Gz gtpase-activating protein
subfamily. J Biol Chem. 273:26014–26025. 1998. View Article : Google Scholar : PubMed/NCBI
|
|
17
|
Huang G, He X and Wei XL: lncRNA NEAT1
promotes cell proliferation and invasion by regulating
miR-365/RGS20 in oral squamous cell carcinoma. Oncol Rep.
39:1948–1956. 2018.PubMed/NCBI
|
|
18
|
Riker AI, Enkemann SA, Fodstad O, Liu S,
Ren S, Morris C, Xi Y, Howell P, Metge B, Samant RS, et al: The
gene expression profiles of primary and metastatic melanoma yields
a transition point of tumor progression and metastasis. BMC Med
Genomics. 1:132008. View Article : Google Scholar : PubMed/NCBI
|
|
19
|
Li Q, Jin W, Cai Y, Yang F, Chen E, Ye D,
Wang Q and Guan X: Regulator of G protein signaling 20 correlates
with clinicopathological features and prognosis in triple-negative
breast cancer. Biochem Biophys Res Commun. 485:693–697. 2017.
View Article : Google Scholar : PubMed/NCBI
|
|
20
|
Li G, Wang M, Ren L, Li H, Liu Q, Ouyang
Y, He L and Li F: Regulator of G protein signaling 20 promotes
proliferation and migration in bladder cancer via NF-κB signaling.
Biomed Pharmacother. 117:1091122019. View Article : Google Scholar : PubMed/NCBI
|
|
21
|
Yang L, Lee MM, Leung MM and Wong YH:
Regulator of G protein signaling 20 enhances cancer cell
aggregation, migration, invasion and adhesion. Cell Signal.
28:1663–1672. 2016. View Article : Google Scholar : PubMed/NCBI
|
|
22
|
Li J, Hu L, Liu Y, Huang L, Mu Y, Cai X
and Weng C: DDX19A senses viral RNA and mediates NLRP3-dependent
inflammasome activation. J Immunol. 195:5732–5749. 2015. View Article : Google Scholar : PubMed/NCBI
|
|
23
|
Livak KJ and Schmittgen TD: Analysis of
relative gene expression data using real-time quantitative PCR and
the 2(-Delta Delta C(T)) method. Methods. 25:402–408. 2001.
View Article : Google Scholar : PubMed/NCBI
|
|
24
|
Yao X, Hu W, Zhang J, Huang C, Zhao H and
Yao X: Application of cAMP-dependent catalytic subunit β (PRKACB)
low expression in predicting worse overall survival: A potential
therapeutic target for colorectal carcinoma. J Cancer.
11:4841–4850. 2020. View Article : Google Scholar : PubMed/NCBI
|
|
25
|
Subramanian A, Kuehn H, Gould J, Tamayo P
and Mesirov JP: GSEA-P: A desktop application for gene set
enrichment analysis. Bioinformatics. 23:3251–3253. 2007. View Article : Google Scholar : PubMed/NCBI
|
|
26
|
Chen H, Xu J, Hong J, Tang R, Zhang X and
Fang JY: Long noncoding RNA profiles identify five distinct
molecular subtypes of colorectal cancer with clinical relevance.
Mol Oncol. 8:1393–1403. 2014. View Article : Google Scholar : PubMed/NCBI
|
|
27
|
Kapoor A, Yao W, Ying H, Hua S, Liewen A,
Wang Q, Zhong Y, Wu CJ, Sadanandam A, Hu B, et al: Yap1 activation
enables bypass of oncogenic kras addiction in pancreatic cancer.
Cell. 179:12392019. View Article : Google Scholar : PubMed/NCBI
|
|
28
|
Xu ZY, Zhao M, Chen W, Li K, Qin F, Xiang
WW, Sun Y, Wei J, Yuan LQ, Li SK and Lin SH: Analysis of prognostic
genes in the tumor microenvironment of lung adenocarcinoma. PeerJ.
8:e95302020. View Article : Google Scholar : PubMed/NCBI
|
|
29
|
Yuan Q, Sun N, Zheng J, Wang Y, Yan X, Mai
W, Liao Y and Chen X: Prognostic and immunological role of FUN14
domain containing 1 in pan-cancer: Friend or foe? Front Oncol.
9:15022020. View Article : Google Scholar : PubMed/NCBI
|
|
30
|
Hurst JH and Hooks SB: Regulator of
G-protein signaling (RGS) proteins in cancer biology. Biochem
Pharmacol. 78:1289–1297. 2009. View Article : Google Scholar : PubMed/NCBI
|
|
31
|
Hurst JH, Mendpara N and Hooks SB:
Regulator of G-protein signalling expression and function in
ovarian cancer cell lines. Cell Mol Biol Lett. 14:153–174. 2009.
View Article : Google Scholar : PubMed/NCBI
|
|
32
|
James MA, Lu Y, Liu Y, Vikis HG and You M:
RGS17, an overexpressed gene in human lung and prostate cancer,
induces tumor cell proliferation through the cyclic AMP-PKA-CREB
pathway. Cancer Res. 69:2108–2116. 2009. View Article : Google Scholar : PubMed/NCBI
|
|
33
|
Wiechec E, Overgaard J and Hansen LL: A
fragile site within the HPC1 region at 1q25.3 affecting RGS16,
RGSL1, and RGSL2 in human breast carcinomas. Genes Chromosomes
Cancer. 47:766–780. 2008. View Article : Google Scholar : PubMed/NCBI
|
|
34
|
Fang G, Yu H and Kirschner MW: The
checkpoint protein MAD2 and the mitotic regulator CDC20 form a
ternary complex with the anaphase-promoting complex to control
anaphase initiation. Genes Dev. 12:1871–1883. 1998. View Article : Google Scholar : PubMed/NCBI
|
|
35
|
Brown NR, Lowe ED, Petri E, Skamnaki V,
Antrobus R and Johnson LN: Cyclin B and cyclin A confer different
substrate recognition properties on CDK2. Cell Cycle. 6:1350–1359.
2007. View Article : Google Scholar : PubMed/NCBI
|
|
36
|
Zou H, McGarry TJ, Bernal T and Kirschner
MW: Identification of a vertebrate sister-chromatid separation
inhibitor involved in transformation and tumorigenesis. Science.
285:418–422. 1999. View Article : Google Scholar : PubMed/NCBI
|
|
37
|
Rajurkar M, Dang K, Fernandez-Barrena MG,
Liu X, Fernandez-Zapico ME, Lewis BC and Mao J: IKBKE is required
during KRAS-induced pancreatic tumorigenesis. Cancer Res.
77:320–329. 2017. View Article : Google Scholar : PubMed/NCBI
|
|
38
|
Yang W, Qu Y, Tan B, Jia Y, Wang N, Hu P
and Wang J: Prognostic significance of preoperative IKBKE
expression in esophageal squamous cell carcinoma. Onco Targets
Ther. 11:1305–1314. 2018. View Article : Google Scholar : PubMed/NCBI
|
|
39
|
Wang X, Teng F, Lu J, Mu D, Zhang J and Yu
J: Expression and prognostic role of IKBKE and TBK1 in stage I
non-small cell lung cancer. Cancer Manag Res. 11:6593–6602. 2019.
View Article : Google Scholar : PubMed/NCBI
|