Introduction
Non-small cell lung cancer (NSCLC) is one of the
most common causes of cancer-associated mortality, affecting ~1.5
million individuals annually worldwide (1,2). Notable
progress has been made in the treatment of patients with NSCLC,
while the 5-year survival rate is <30%, and thus, it remains a
key challenge to public health (3).
The poor prognosis of patients with NSCLC is generally attributed
to a lack of effective treatments for advanced-stage cancer and
metastases (4). Notably, the bone is
the preferred site of metastasis from NSCLC due to its abundant
blood flow and high expression levels of adhesion molecules on
tumor cells (5,6). Clinically, bone metastases often
manifest in patients with malignant tumors, and are observed in
14–40% of patients with advanced-stage NSCLC (4,7,8). Furthermore, bone metastases in patients
with NSCLC often result in skeletal-associated morbidities, such as
debilitating pain, fracture and spinal compression, which
contribute to a poor prognosis and a low survival rate (9). Thus, early detection of bone metastasis
is crucial for improving the clinical management of patients with
advanced stage NSCLC. However, only a small proportion of cases of
bone metastasis are accurately diagnosed, as the underlying
molecular mechanisms are poorly understood (10).
NSCLC metastasis to the bone is a multifaceted
biological process that involves several genes and signaling
pathways, such as the Wnt/β-catenin pathway (11), MAPK/ERK pathway (12) and p53 pathway (13). A clearer understanding of the key
roles of these genes and signaling pathways in NSCLC bone
metastasis is critical for identifying novel diagnostic markers or
therapeutic targets. Advances in bioinformatics analysis in recent
years have led to new approaches for disease therapy and diagnosis.
Microarray analysis has increasingly become a promising tool for
characterizing the molecular mechanisms of several types of cancer
(14). In addition, determination of
gene expression profiles combined with bioinformatics analysis have
revealed numerous underlying molecular mechanisms implicated in the
development of NSCLC (15,16).
The present study aimed to use high-throughput
transcriptome expression microarray analysis technology to identify
the differentially expressed genes (DEGs) between NSCLC tissue
samples with or without bone metastases. Furthermore, enriched
functional categories were analyzed to reveal the altered signaling
pathways between the two groups. Finally, the expression levels of
collagen family collagen 6A1 (COL6A1) at the mRNA and protein
levels were determined in order to determine whether COL6A1 may
serve as a potential diagnostic marker or therapeutic target for
patients with NSCLC with bone metastases.
Materials and methods
Patients and sample collection
A total of 17 squamous cell carcinoma including 13
bone metastasis patients (age range, 41–76 years; median age, 56
years) and 23 adenocarcinoma including 6 bone metastasis patients
(age range, 32–71 years; median age, 53 years) tissues were
collected through resection at The Third Hospital of Hebei Medical
University (Shijiazhuang, China) between February and September
2019. Normal tissues in this study were the paired adjacent tissue
samples (2 cm from the lesion). None of the patients had received
radiotherapy or chemotherapy prior to surgery (resection). Samples
were immediately frozen in liquid nitrogen and stored at −80°C
further use. The study protocol was approved by the Ethics
Committee of the Third Hospital of Hebei Medical University
(approval no. 2019-027-1), and all patients provided written
informed consent.
RNA extraction and purification
Total RNA was extracted and purified using an RNeasy
mini kit (cat. no. 74106; Qiagen GmbH) according to the
manufacturer's protocol, and the RNA integrity number (RIN) was
assessed to determine the quality of the RNA using an Agilent
Bioanalyzer 2100 (Agilent Technologies, Inc.). RNA samples with a
RIN value of 7.0 or 28s/18s ≥0.7 were used for subsequent
analysis.
RNA amplification and labeling
Total RNA was amplified and labeled using a Low
Input Quick Amp Labeling kit, One-Color (cat. no. 5190-2305;
Agilent Technologies, Inc.) according to the manufacturer's
protocol. Labeled complementary (c)RNA was purified using an RNeasy
mini kit (cat. no. 74106; Qiagen GmbH).
Microarray hybridization analysis
Each slide of labeled cDNA was hybridized with 1.65
µg Cy3-labeled cRNA using the Gene Expression Hybridization kit
(cat. no. 5188-5242; Agilent Technologies, Inc.) and a
hybridization oven (cat. no. G2545A; Agilent Technologies, Inc.).
Following a 17-h hybridization at 42°C, the slides were washed in
staining dishes (Thermo Fisher Scientific, Inc.) using a Gene
Expression Wash Buffer kit (cat. no. 5188-5327; Agilent
Technologies, Inc.).
Signal detection and data
acquisition
The slides were scanned using an Agilent Microarray
Scanner (cat. no. G2565CA; Agilent Technologies, Inc.) with the
default settings (dye channel, green; scan resolution, 3 µm; photo
multiplier tube, 100%; 20-bit scan mode). Data were extracted using
Feature Extraction software (version 10.7; Agilent Technologies,
Inc.). Raw data were normalized using the Quantile algorithm of the
‘limma’ package in R software v.2.15.0 (17). All procedures were performed as
previously described (18,19).
Data analysis
Raw data were subjected to quality control and
preprocessing, and GeneChip Robust Multichip Average normalization
hierarchical clustering analysis was used to categorize the data
into two groups of different expression patterns (20). Statistical analysis of gene
expression was performed using a paired Student's t-test, and gene
expression was expressed as the log2-fold change
(logFC). The degree of gene dispersion was determined using
principal components analysis (21).
DEGs were identified with the following cut-off criteria: False
discovery rate-corrected P-value <0.05 and |logFC|>2 (using
the Benjamini and Hochberg method). Functional groups and
biological pathway enrichment analyses for the common DEGs were
performed using Gene Ontology (GO) and Kyoto Encyclopedia of Genes
and Genomes (KEGG) pathway enrichment analyses (22).
Ingenuity pathway analysis (IPA)
DEGs were functionally analyzed using the IPA
software version 2.3 (Qiagen Inc.), which uses computational
algorithms that analyze the functional connectivity of the genes
from information obtained within the IPA database to describe
functional relationships amongst genes or proteins. Canonical
pathway analysis was performed using IPA. Networks were ranked
according to their biological relevance to the provided gene list.
The P-value calculated using a Fisher's exact test was used to
determine the probability.
Reverse transcription-quantitative
(RT-q)PCR
RT-qPCR was used to verify changes in the expression
levels determined by the microarray analysis. Total RNA from
pulmonary tumor tissue samples with and without bone metastases
were extracted using TRIzol® reagent (Invitrogen; Thermo
Fisher Scientific, Inc.). The quantity and purity of RNA was
assessed by measuring the absorbance at 260 and 280 nm. A total of
1 µg total RNA was used as a template for cDNA synthesis using a
Reverse Transcription system kit (Takara Bio, Inc.) based on the
manufacturer's instructions. The conditions for reverse
transcription were as follows: 95° for 30 sec and 60°C for 30 mins.
qPCR was performed using DNA Master SYBR® Green (Roche
Diagnostics) on ABI PRISM 7500 system (Applied Biosystems; Thermo
Fisher Scientific, Inc.). The thermocycling conditions for qPCR
were as follows: 95°C for 10 min; followed by 40 cycles of 95°C for
10 sec, 60°C for 15 sec and 72°C for 10 sec. The mean cycle
quantification (Cq) values from triplicate analyses were normalized
to the mean Cq values of GAPDH, and the data were analyzed using
the 2−∆∆Cq method (23).
The primer sequences are listed in Table
I.
 | Table I.Sequences of primers used in the
present study. |
Table I.
Sequences of primers used in the
present study.
| Gene | Sequence
(5′-3′) | Product length,
bp |
|---|
| GAPDH | F:
TGTTCGTCATGGGTGTGAAC | 154 |
|
| R:
ATGGCATGGACTGTGGTCAT |
|
| ALP | F:
ACTGGGGCCTGAGATACCC | 185 |
|
| R:
TCGTGTTGCACTGGTTAAAGC |
|
| RUNX2 | F:
TGGTTACTGTCATGGCGGGTA | 101 |
|
| R:
TCTCAGATCGTTGAACCTTGCTA |
|
| COA3 | F:
CTGGATTCTAAGCGTGGAGAG | 236 |
|
| R:
AGCTCATCTAGGAAACGCTC |
|
| APPL1 | F:
GACAGCCCGCAGACAAG | 136 |
|
| R:
GGTGTGTTGCTGCACTTAAT |
|
| COL6A1 | F:
ACACCGACTGCGCTATCAAG | 90 |
|
| R:
CGGTCACCACAATCAGGTACTT |
|
| TERF1 | F:
ACAGCGCAGAGGCTATTATTC | 121 |
|
| R:
TCAAACTGTGCATCAAGGGT |
|
| TST | F:
TATCAGTGCTCAATGGTGGC | 104 |
|
| R:
GTCCAGTGTGGCTTTGAAGA |
|
| CD133 | F:
AAACCTGCAACAGCATCAGA | 150 |
|
| R:
GGGATTGATAGCCCTGTTGG |
|
| RALY | F:
CCCAAGTCCATCAACTCTCG | 268 |
|
| R:
CTGCTCTCTTTAGCCCCTTG |
|
| Prominin2 | F:
CTCCGTGAAGGTGAATGAGG | 159 |
|
| R:
TTGTGCTCTGTCTTCACTCG |
|
Western blotting
Total protein was extracted from tissue samples
using RIPA lysis buffer (cat. sc-24948; Santa Cruz Biotechnology
Inc.), and the protein concentration was determined using a
Bradford protein assay. Total protein (40 µg/lane) was loaded on a
10% SDS gel, resolved using SDS-PAGE, and transferred to a PDVF
membrane (MilliporeSigma). The PVDF membranes were blocked for 1 h
with 4% milk at room temperature and subsequently incubated at 4°C
overnight with anti-COL6A1 (1:500; cat. no. ab151422),
anti-alkaline phosphatase (ALP; 1:1,000; cat. no. ab83259) or
anti-RUNX family transcription factor 2 (RUNX2; 1:1,000; cat. no.
ab23981) (all Abcam) primary antibodies. After washing with 0.1% 1X
Tris-buffered saline-Tween (TBST) for 3 times, the membranes were
incubated with an HRP-conjugated goat anti-rabbit IgG H&L
secondary antibody (1:2,000; cat. no. ab6721; Abcam) at room
temperature for 2 h prior to detection using an ECL substrate
(Beyotime Institute of Biotechnology). GAPDH (1:3,000; cat. no.
ab8245; Abcam) was used as the loading control for normalization.
Densitometry analysis was performed using ImageJ version 1.50b
(National Institutes of Health).
Immunohistochemistry (IHC)
analysis
Surgically excised pulmonary tumor tissue samples
(with or without bone metastases) were fixed in 4% paraformaldehyde
at 4°C for 1 h and embedded in paraffin. The tissue samples were
sliced into 4-µm thick slices, which then were dehydrated using
xylene for 15 min and 100, 95, 90, 80 and 70% ethanol for 5 min,
and incubated in 0.01 M sodium sulphate buffer (pH=6.0) at 100°C
for 2 min. Following washing the samples with PBS, the anti-COL6A1
primary antibody (1:100; cat. no. ab151422; Abcam) was added and
incubated at 4°C overnight. After washing the samples with PBS,
Goat Anti-Rabbit IgG H&L (1:1,000; cat. no. ab6721; Abcam) was
added and incubated for 30 min at 37°C. Following staining with DAB
at room temperature for 10 min, the slides were then counterstained
with hematoxylin at room temperature for 20 sec and observed with 5
fields under a light microscope (magnification, ×100).
Cell culture and osteogenic
induction
A549 (cat. no. CCL-185; lung adenocarcinoma), HARA
(cat. no. 80005; lung squamous cell carcinoma) and NCI-H226 (cat.
no. CRL-5826; lung squamous cell carcinoma) cells were obtained
from the American Type Culture Collection. HARA-B4 (cat. no. 1552;
lung squamous cell carcinoma) cells were obtained from the JCRB
Cell Bank. HPAEpic cells (cat. no. 3200) were obtained from
ScienCell Research Laboratories, Inc.; NCI-H1395 cells (cat. no.
CL-0275; lung adenocarcinoma) and M-7 cells (cat. no. CL-0539) were
obtained from Procell Life Science & Technology Co., Ltd.; HOB
cells (cat. no. 406-05A) were obtained from Sigma-Aldrich; Merck
KGaA; and hES-MP 002.5 cells (cat. no. Y10090) were obtained from
Cellartis (24). HPAEpic, A549,
HARA, NCI-H226, HARA-B4 and NCI-1395 cells were cultured in DMEM
(Thermo Fisher Scientific, Inc.) with 10% FBS (Hyclone; Cytiva).
HOB, hES-MP 002.5 and M-7 cells were maintained in high-glucose
DMEM (Hyclone; Cytiva) with 10% FBS. All cells were incubated at
37°C with 5% CO2 in a humidified incubator. HOB, hES-MP
002.5 and M-7 cells were induced using osteoblast inducing
conditional media (cat. no. CTCC Y001; Wuxi Puhe Biomedical
Technology Co., Ltd.) for 14 days.
Cell transfection
COL6A1 pcRNA3.1(+) overexpression plasmid (3,105
bp), empty vector pcDNA3.1(+), COL6A1 short hairpin (sh)RNA
(sh-COL6A1) and sh-negative control (sh-NC) were purchased from
Synbio Technologies. The sequences of the shRNAs targeting COL6A1
were 5′-GCCTGCAGAACTTCGAGATTG-3′ and 5′-CAATCTCGAAGTTCTGCAGGC-3′;
the sequence of sh-NC was 5′-CCTTCTGTTCGTGGTACACCG-3′. HARA cells
(5×10⁴ cells/well) in a 6-well plate were transfected
with COL6A1-overexpression plasmid (500 ng/µl) or the empty vector
(500 ng/µl); HARA-B4 cells (5×10⁴ cells/well) in a
6-well plate were transfected with sh-COL6A1 (40 ng/µl) or sh-NC
(40 ng/µl). All transfections were performed using
Lipofectamine® 2000 (Invitrogen; Thermo Fisher
Scientific, Inc.) at 37°C for 48 h according to the manufacturer's
protocol. After transfection for 48 h, the transfection efficiency
was determined using RT-qPCR and the subsequent experiments were
also conducted.
Cell proliferation assay
The Cell Counting Kit-8 (CCK-8) assay was used to
assess cell proliferation. HARA and HARA-B4 cells (2×10³
cells/well) were plated in 96-well plates and transfected as
aforementioned for 24 h. After additional cultures for 0, 24, 48 or
72 h at 37°C, each well was added with a total of 10 µl CCK-8
solution (Dojindo Molecular Technologies, Inc.). After incubation
for 3 h at 37°C, the optical density was measured at 450 nm. For
the colony formation assays, the transfected HARA and HARA-B4 cells
(1×10³ cells/well) were plated in a 6-well plate and
routinely cultured for 14 days. Cell colonies were fixed with 4%
paraformaldehyde (Beyotime, cat. no. P0099) at room temperature for
15 min and stained using 0.1% crystal violet at room temperature
for 10 min. The colonies (comprising >50 cells) were observed
and calculated using a light microscope (DP72; Olympus Corporation)
(magnification, ×100).
Transwell assay
Transwell invasion assays were performed as
previously described (25), using
Transwell inserts (BD Biosciences) pre-coated with Matrigel at 37°C
for 30 min. Briefly, the transfected HARA and HARA-B4 cells
(3×10⁴ cells) in serum-free medium were added into the
top of Transwell chambers, while medium with 15% FBS was added to
the lower chamber. After a 24 h incubation, we removed the
non-invading cells, and the invaded cells were fixed with 95%
ethanol for 15 min and stained with 0.1% crystal violet for 5 min.
The invaded cells in 5 fields were obtained under a light
microscope (DP72; Olympus Corporation) (magnification, ×100).
Alizarin red and ALP staining
A total of 1×10³ HOB, hES-MP 002.5 or M-7
cells were plated per a well in a 96-well plate. Following
osteogenic induction for 14 days, the cells were stained using an
Alizarin Red Staining kit (cat. no. CTCC JD001; Wuxi Puhe
Biomedical Technology Co., Ltd.), and ALP staining was performed
using a specific kit (cat. no. CTCC JD002; Wuxi Puhe Biomedical
Technology Co., Ltd.). Both kits were used according to the
manufacturer's instructions.
Cell adhesion assay
As described in a previous study (26), HOB, hES-MP 002.5 and M-7 cells were
cultured in 6-well plates. A total of 1×10³ HARA-B4
cells expressing COL6A1 overexpression plasmid were co-cultured
with HOB, hES-MP 002.5 or M-7 cells for 30 min at 37°C with 5%
CO2. The treated HARA-B4 cells (1×10³
cells/well) were overlaid directly in a dish and incubated for 30
min at 37°C with 5% CO2. The cells were subsequently
washed with PBS and fixed with 4% paraformaldehyde at room
temperature for 15 min. The adherent GFP-expressing cells in 5
fields were observed and counted under a fluorescence microscope
(magnification, ×100).
Statistical analysis
All measurement data are represented as mean ± SD of
3 experimental repeats. Statistical analysis was performed using
GraphPad Prism version 8 (GraphPad Software, Inc.). Differences
between groups were compared using paired or unpaired Student's
t-test or one-way ANOVA followed by Bonferroni's correction. Data
were derived from at least three independent experiments. P<0.05
was considered to indicate a statistically significant
difference.
Results
DEGs between NSCLC tissue samples with
or without bone metastases
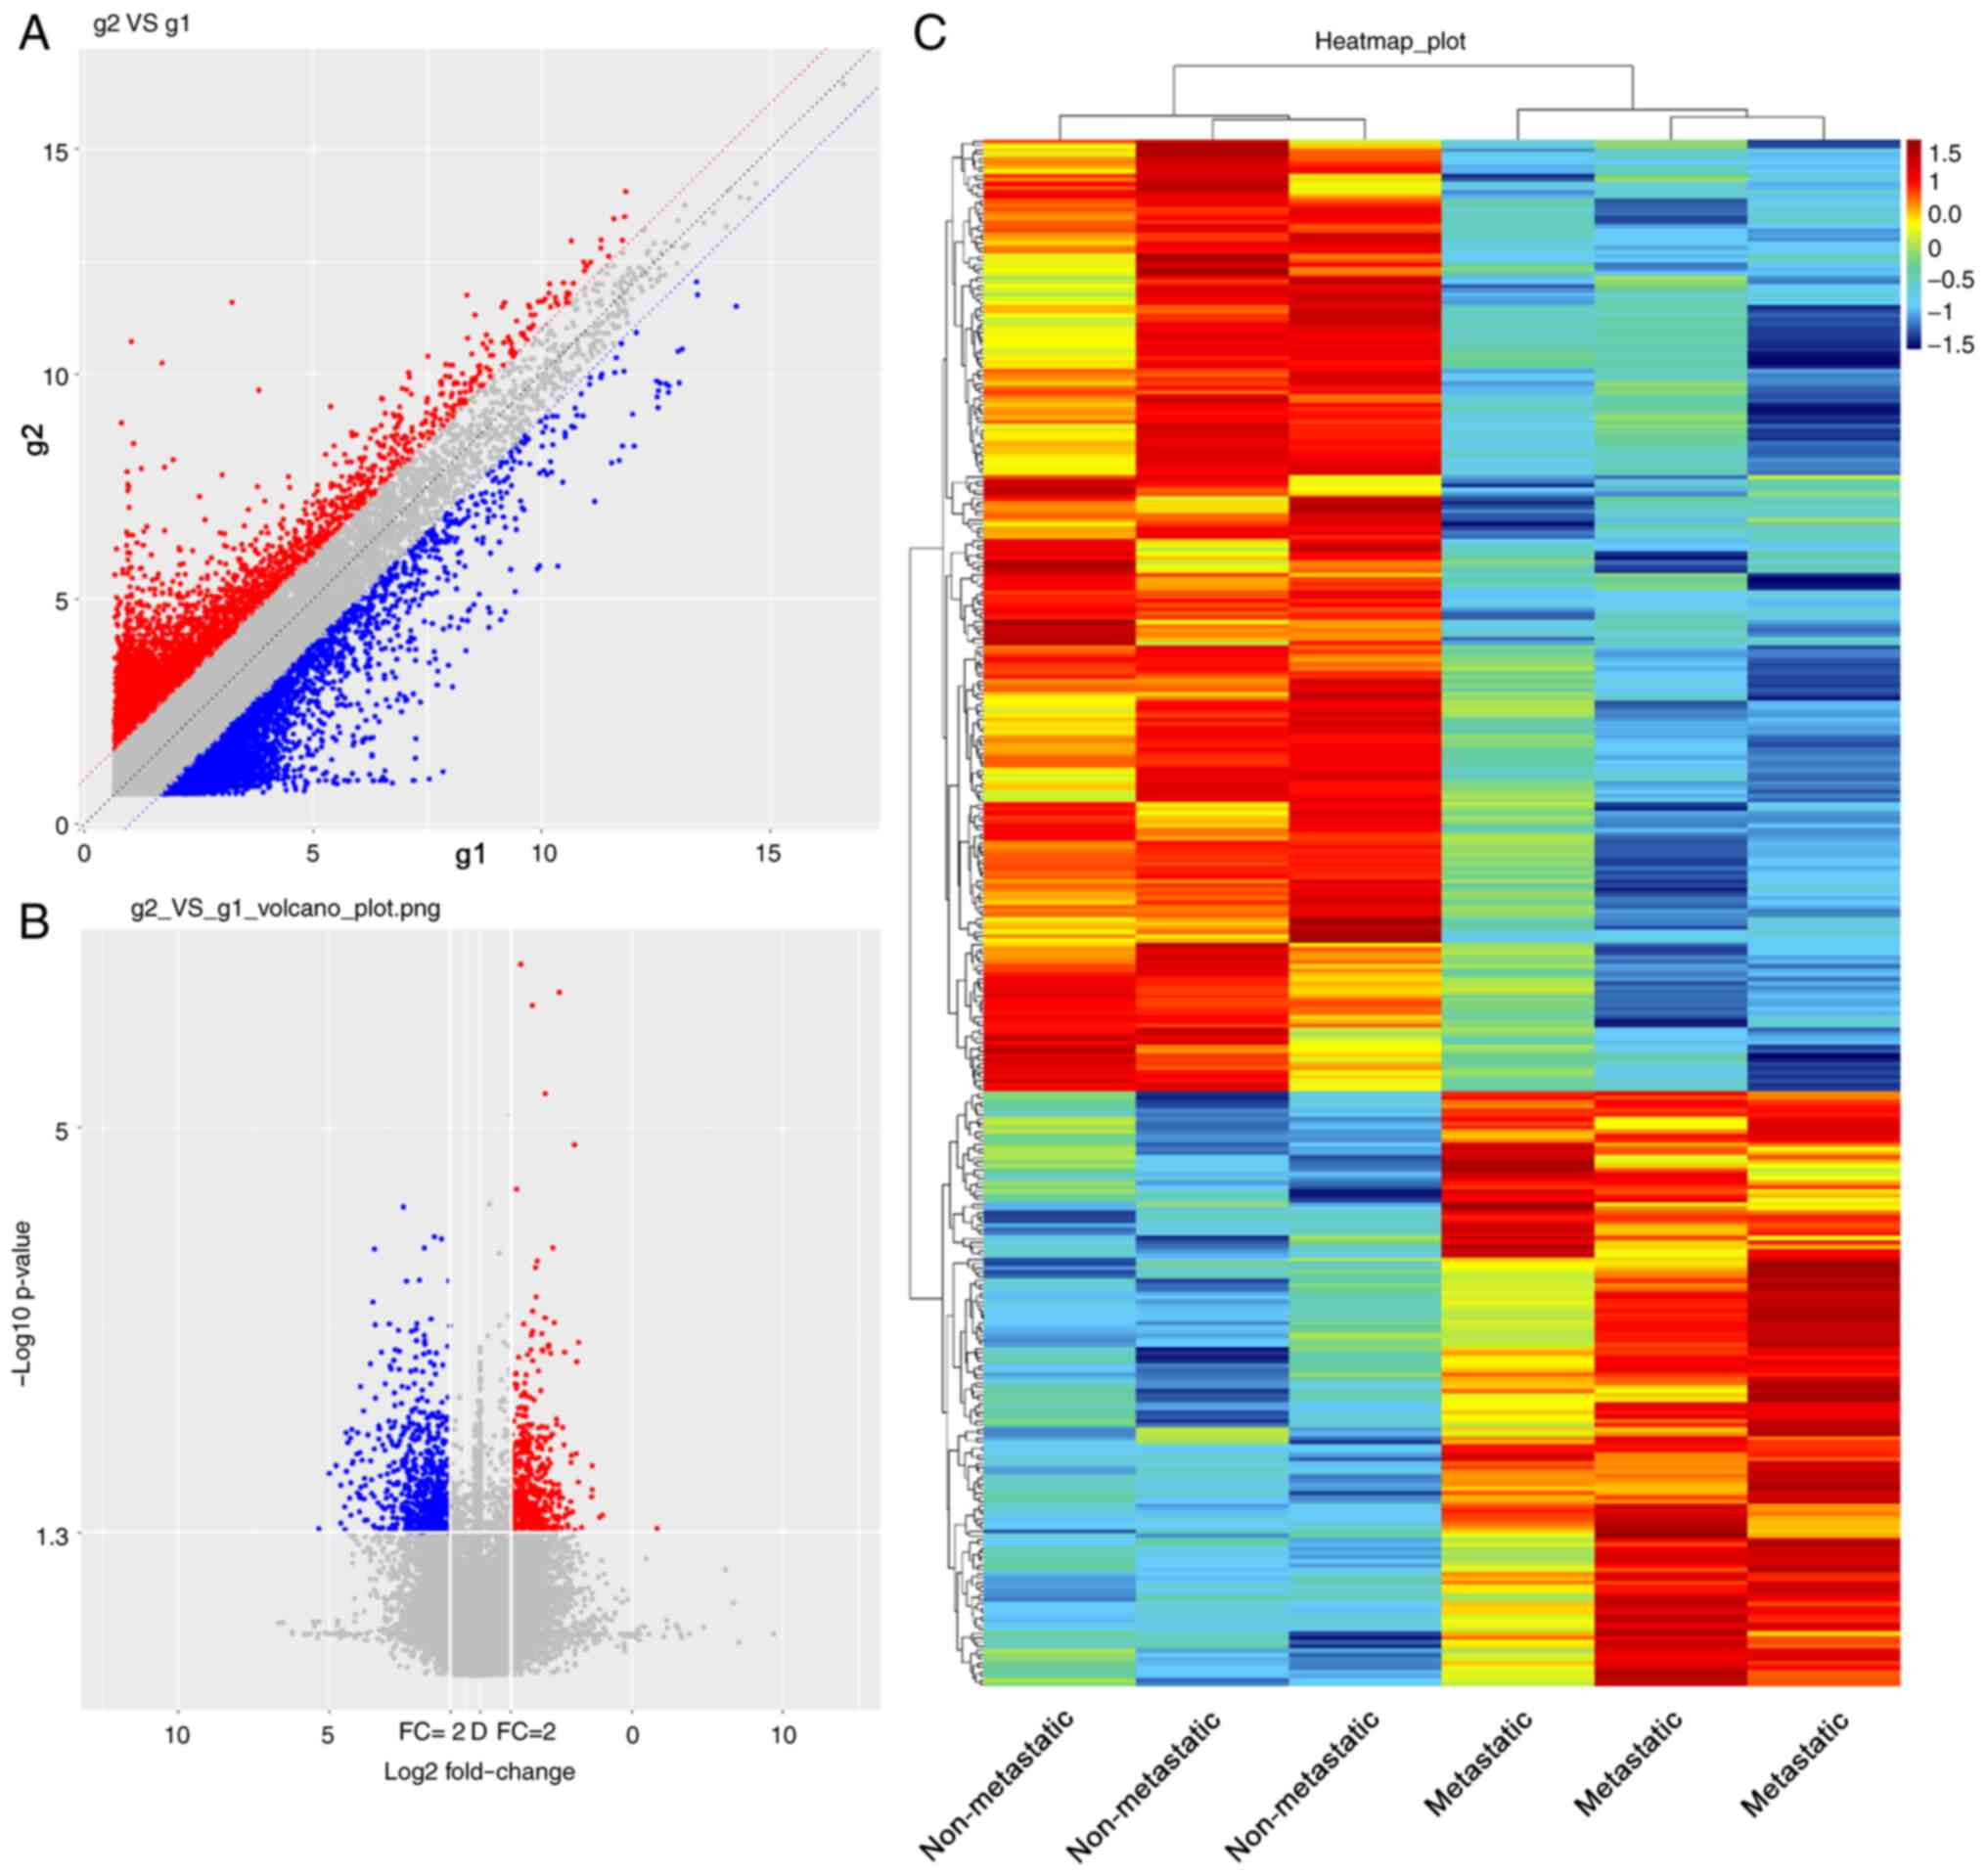
In order to analyze the expression profile of genes
in NSCLC with bone metastasis, microarray analysis was performed on
NSCLC tissue samples with and without bone metastases. First,
principal components analysis (21)
demonstrated a segregation between the non-metastatic and
metastatic NSCLC tissue samples (Fig.
S1). Scatter plot analysis of the overall distribution of data
for the upregulated (red), downregulated (blue) and unchanged
(gray) genes in Fig. 1A further
highlighted the differences between the samples. A volcano plot was
generated to display the significant DEGs between NSCLC tissue
samples with or without bone metastases (Fig. 1B). A total of 364 DEGs were
identified, including 140 upregulated and 224 downregulated genes
in NSCLC tissue samples with bone metastases using the cut-off
criteria |log2FC|>2.0 and P<0.05. The expression
profile of the DEGs is presented as a heatmap (Fig. 1C). Additional detailed information on
the 140 upregulated genes is presented in Table SI, and the detailed information on
the 224 downregulated genes is presented in Table SII.
GO and KEGG analyses of DEGs between
NSCLC tissue samples with or without bone metastases
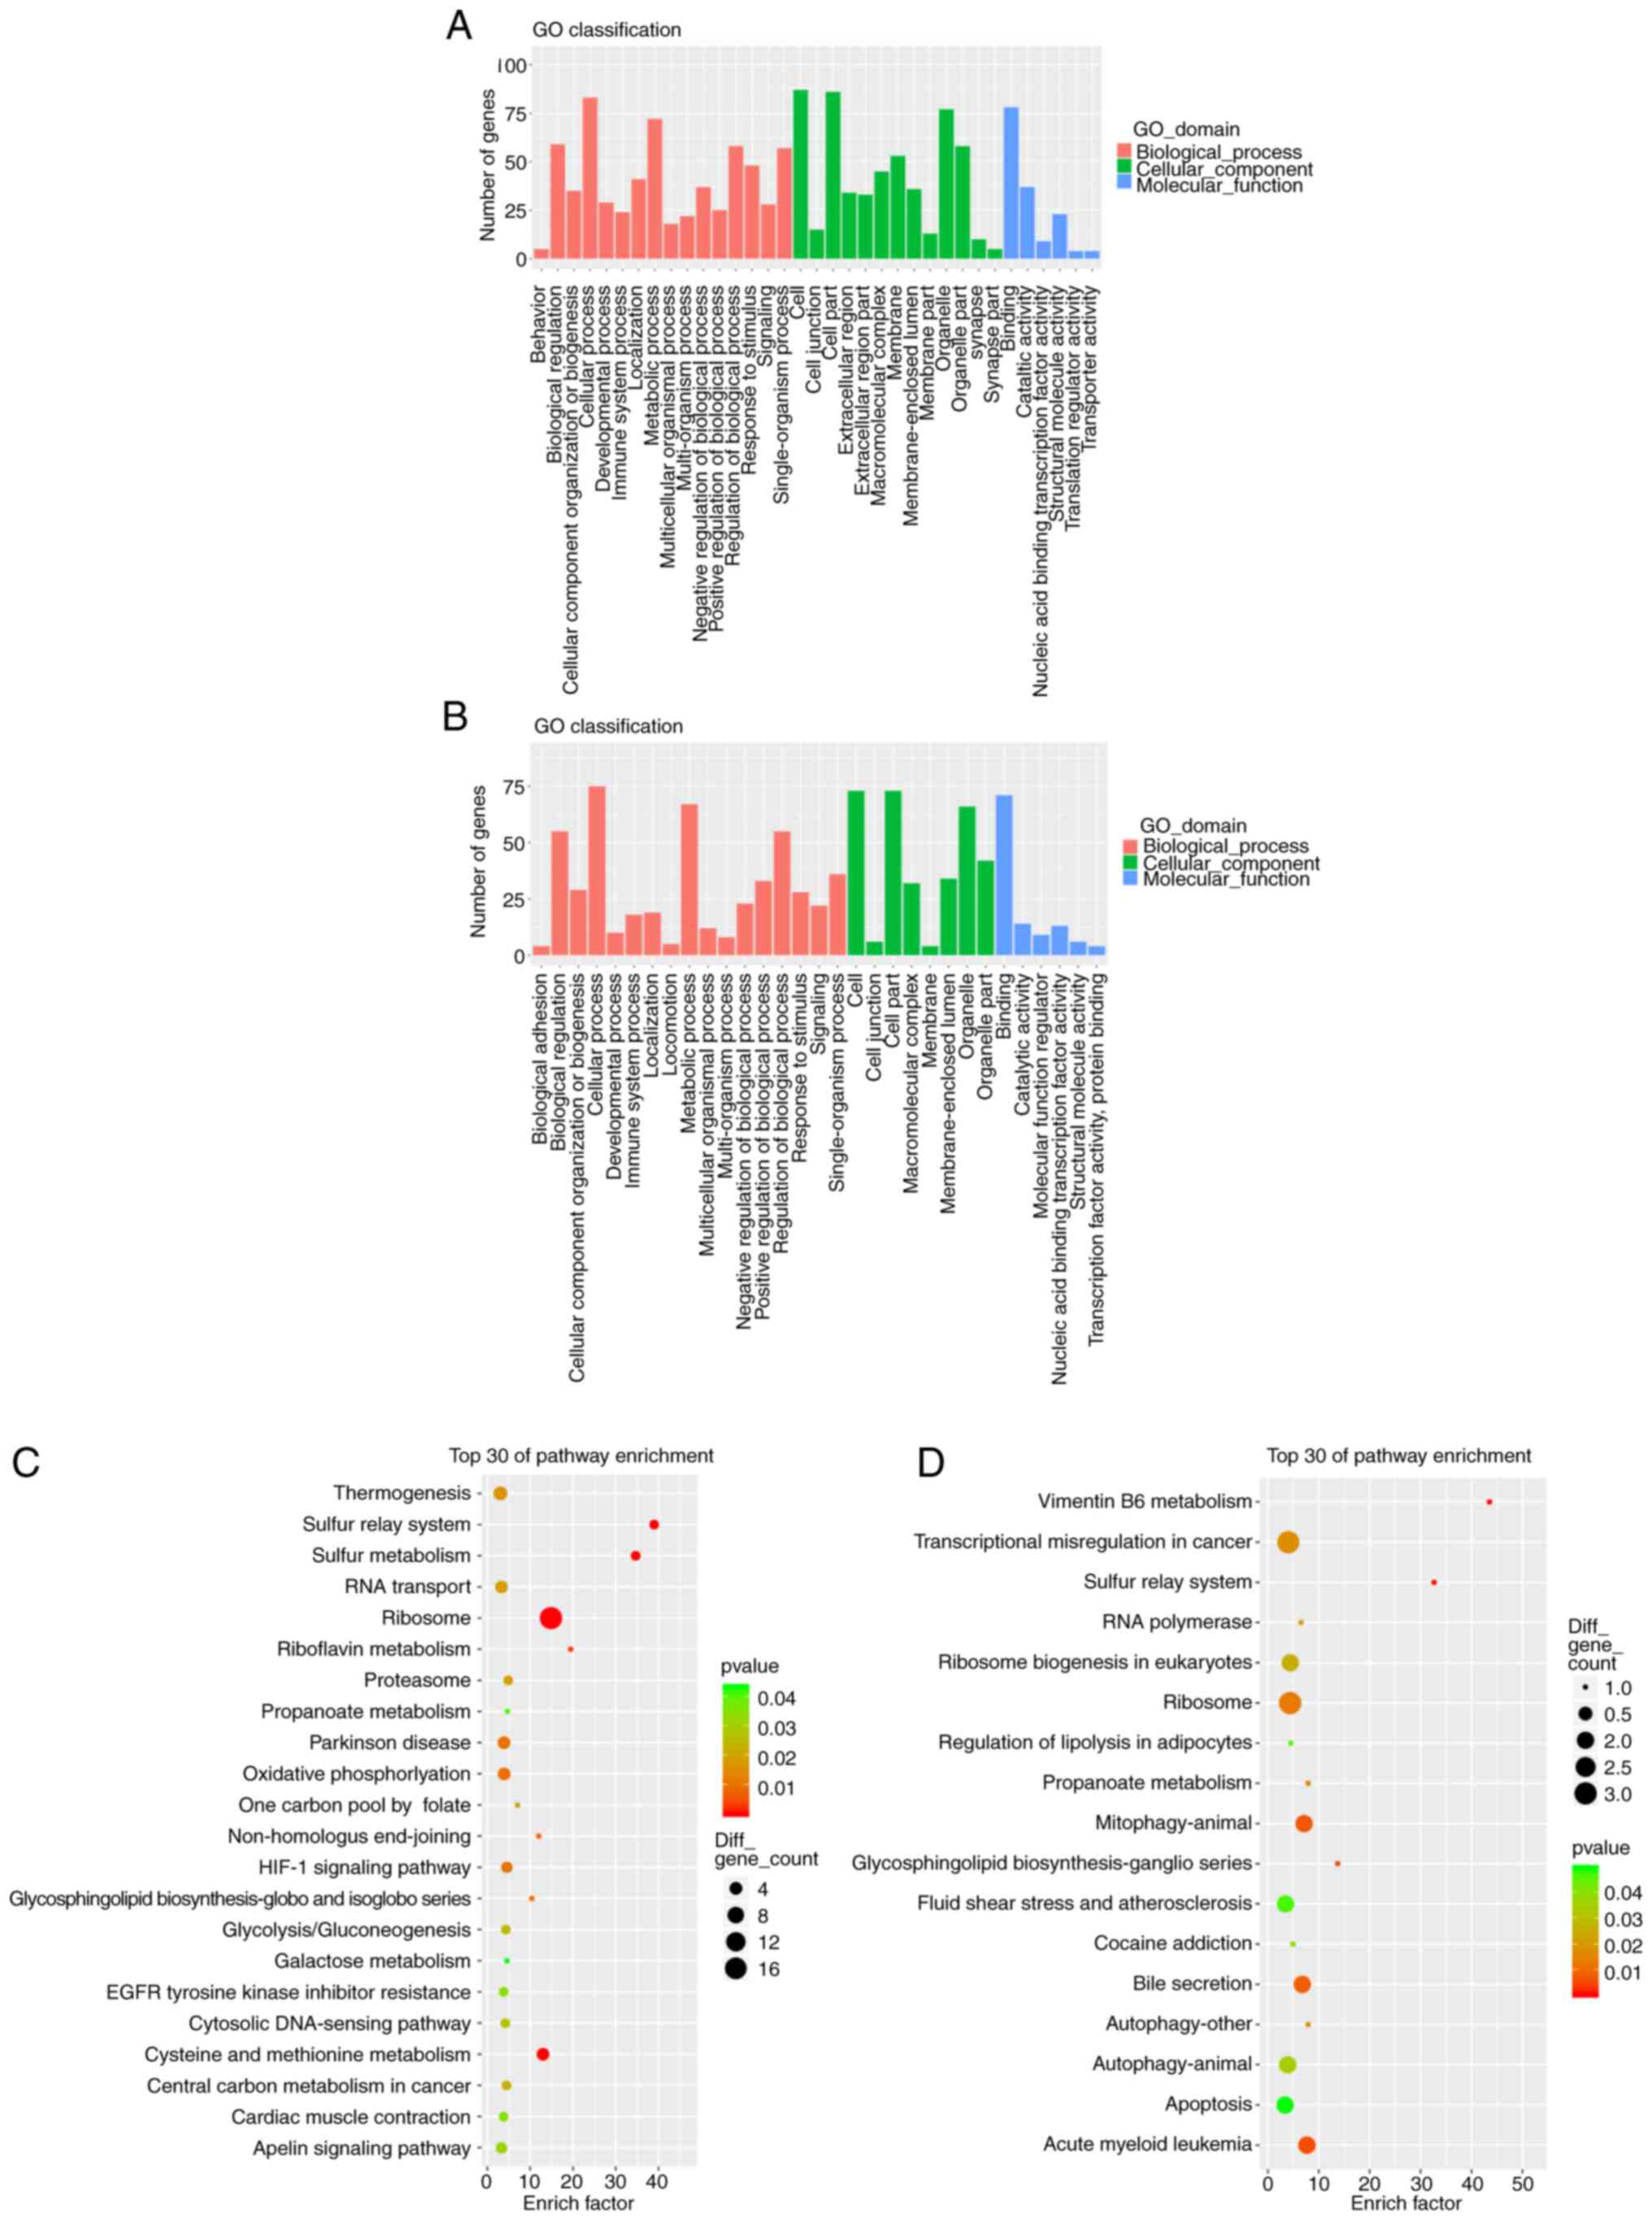
GO and KEGG analyses of the DEGs were performed.
Comparing the NSCLC tissue samples with and without bone
metastases, the GO analysis of the upregulated genes exhibited
significant enrichment of 16 biological processes (BPs), 13
cellular components (CCs) and six molecular functions (MFs). The
top three BPs included ‘cellular process’, ‘metabolic process’ and
‘biological regulation’; the top three CCs included ‘cell’, ‘cell
part’ and ‘organelle’; and the top three MFs included ‘binding’,
‘catalytic activity’ and ‘structural molecule activity’ (Fig. 2A). GO analysis of the downregulated
genes revealed significant enrichment of 17 BPs, eight CCs and six
MFs. The top three BPs included ‘cellular process’, ‘metabolic
process’ and ‘biological regulation’; the top 3 CCs included
‘cell’, ‘cell part’ and ‘organelle’; and the top three MFs included
‘binding’, ‘catalytic activity’ and ‘nucleic acid binding
transcription factor activity’ (Fig.
2B). The upregulated genes were primarily concentrated in five
KEGG pathways: ‘Ribosome’, ‘Cysteine and methionine metabolism’,
‘oxidative phosphorylation’, ‘Parkinson's disease’, and
‘thermogenesis’ (Fig. 2C). The
downregulated genes were primarily concentrated in ‘transcriptional
misregulation in cancer’, ‘ribosome’, ‘mitophagy-animal’, ‘bile
secretion’ and ‘apoptosis’ pathways (Fig. 2D).
Network analysis using IPA
IPA analysis was used to analyze the DEGs of the two
NSCLC group samples. The top five pathways that were functionally
associated with diseases and biofunctions included ‘Synthesis of
protein’, ‘Translation’, ‘Expression of protein’, ‘Translation of
protein’ and ‘Nonsense-mediated mRNA decay’ (Table SIII). The top-ranked ingenuity
canonical pathway was ‘EIF2 Signaling’, which contains several key
molecules, including eukaryotic initiation factor 3 subunit
(EIF3)E, EIF3I, phosphoinositide-3-kinase regulatory subunit 5,
ribosomal protein L (RPL)10A and RPL12 (Table SIV). Furthermore, upstream
transcript regulators including HR lysine demethylase and nuclear
receptor corepressor, SAM pointed domain-containing ETS
transcription factor (SPDEF), JunD proto-oncogene AP-1
transcription factor subunit, SMAD7, twist family bHLH
transcription factor 1, sterol regulatory element binding
transcription factor 1, SMAD3, Fos proto-oncogene AP-1
transcription factor subunit and huntingtin were also identified
(Table SV). As presented in
Fig. 3A, the networks of DEGs of the
two groups of samples contained several key genes implicated in
cell proliferation (α-tubulin, hypoxia-inducible factor 1 subunit α
and Myc), signaling [clock circadian regulator, RNA polymerase I
and III subunit D (POLR1D), RNA polymerase II subunit (POLR2)A,
POLR2C, POLR2D, POLR2E, POLR2F, POLR2H, POLR2J and POLR2K] and
metabolism (COL6A2, collagen type VI α 3 chain, GPN-loop GTPase 3,
MAF bZIP transcription factor B, RELA proto-oncogene NF-κB subunit,
SPDEF, small ubiquitin like modifier 1, WASH complex subunit 1 and
WT1 transcription factor).
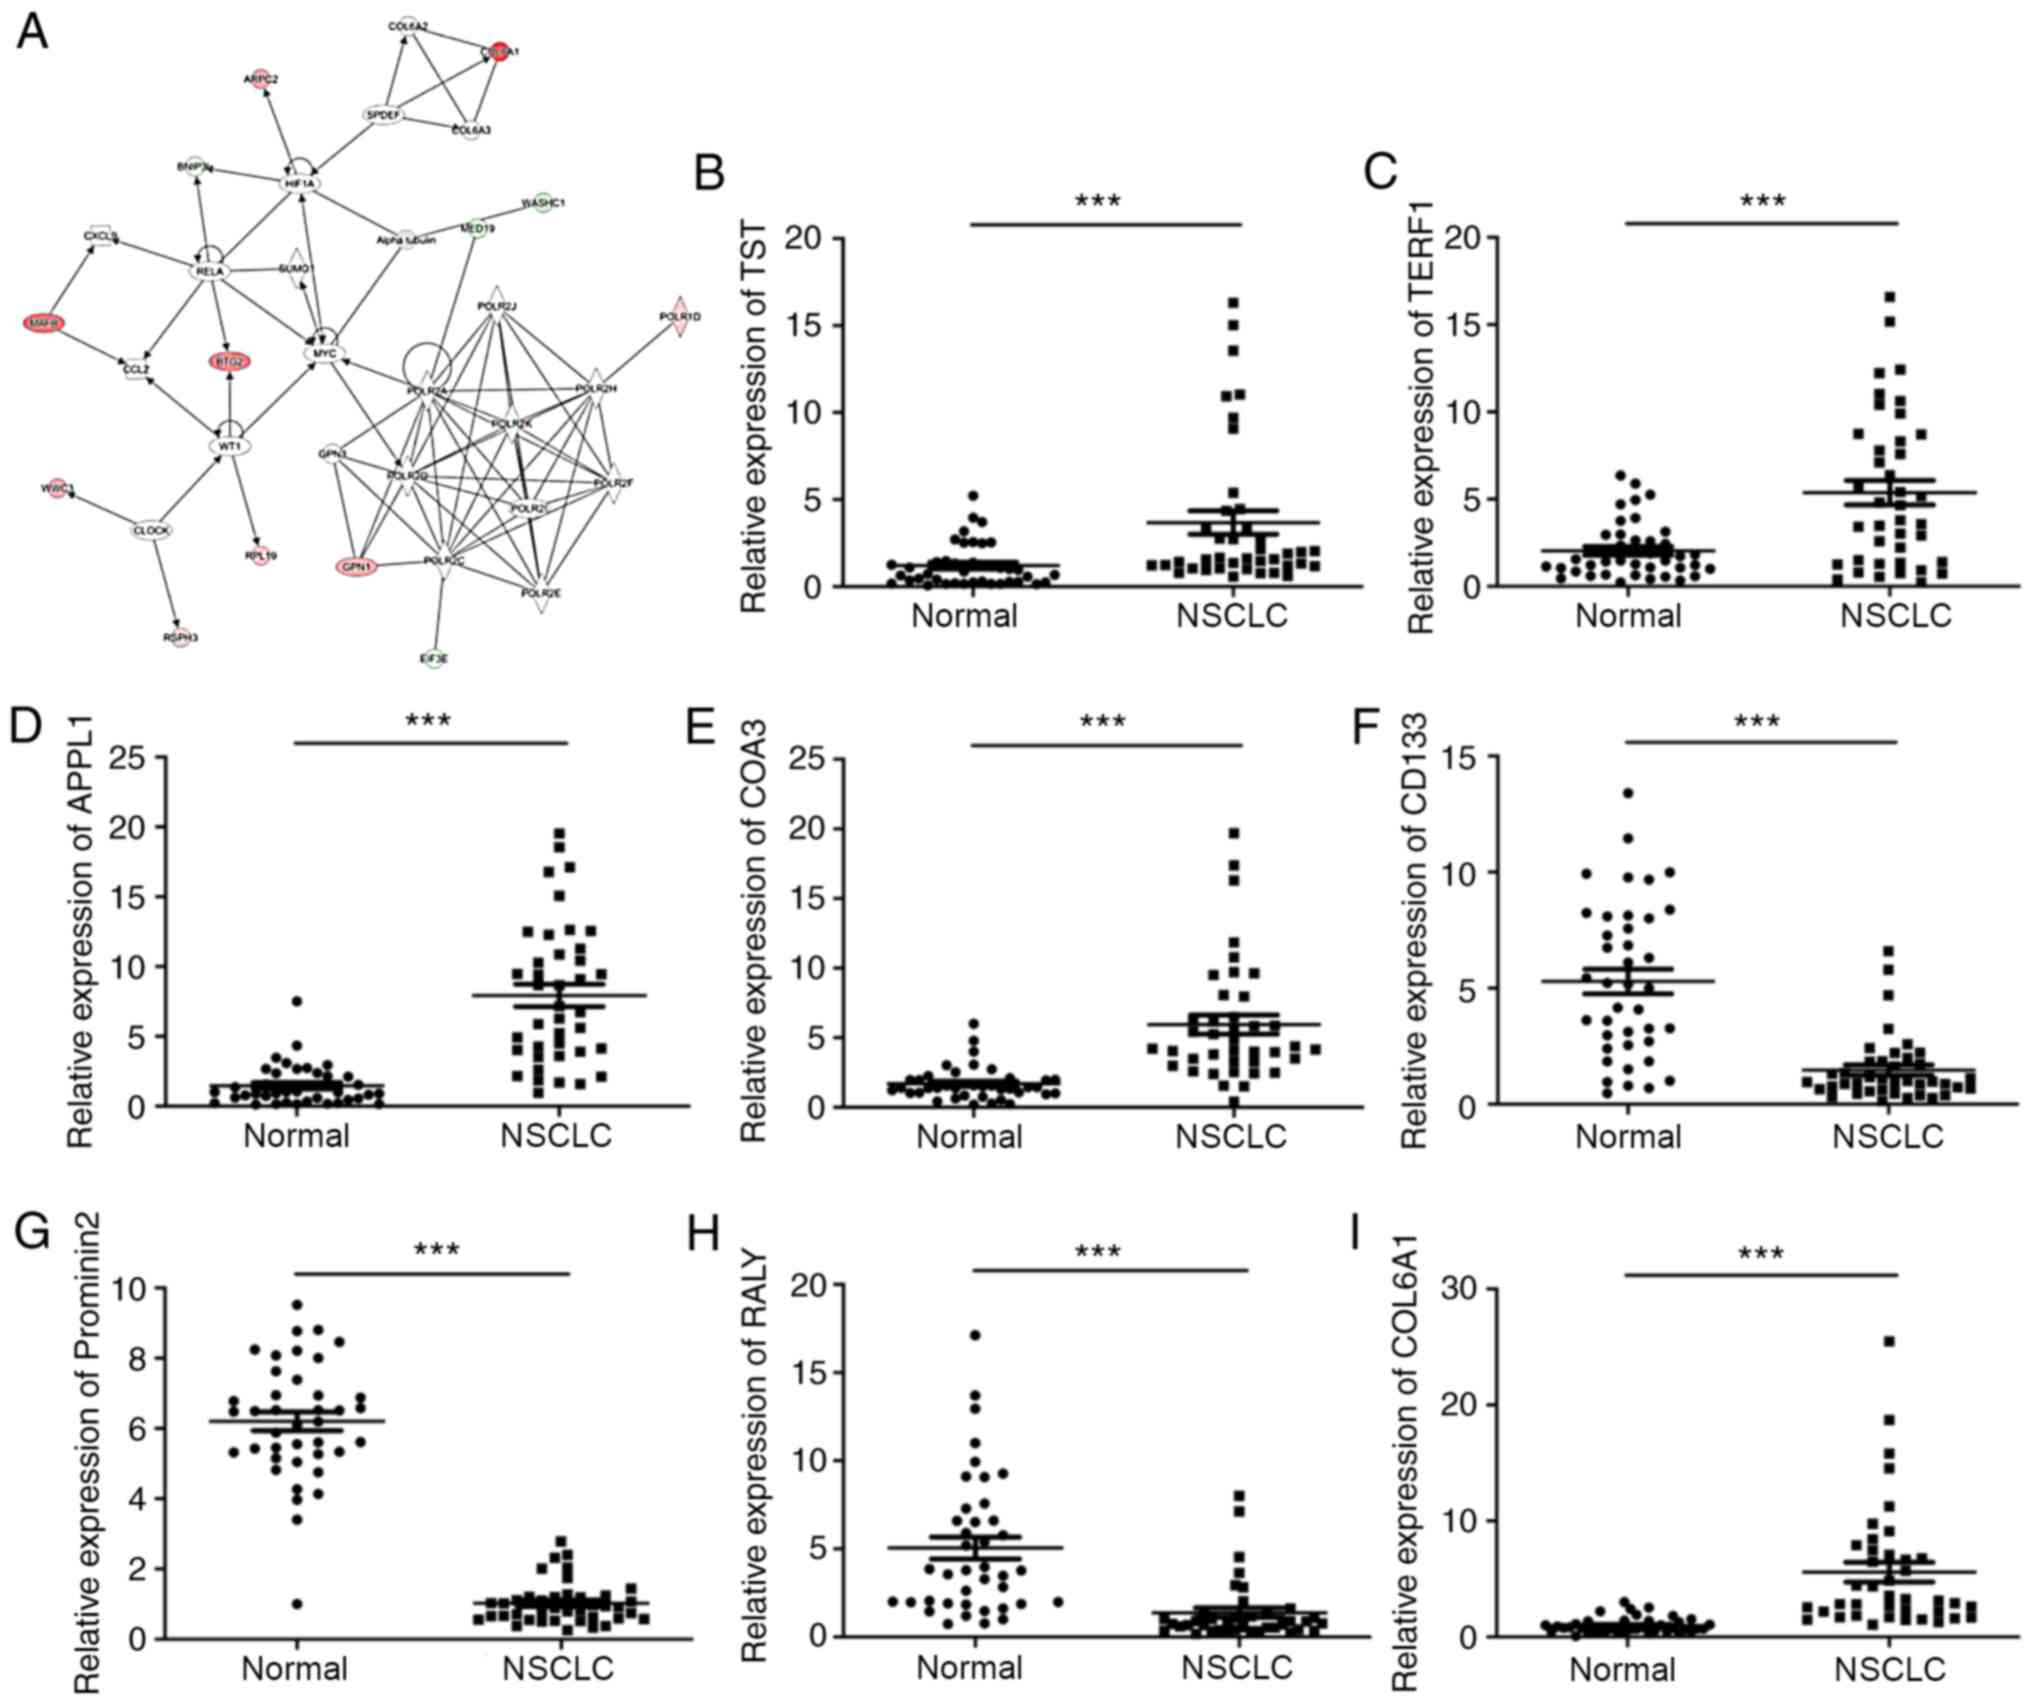 | Figure 3.Network analysis using IPA and
verification of the eight most differentially expressed genes using
RT-qPCR in NSCLC. (A) Top networks of genes were displayed using
IPA of NSCLC tissue samples with bone metastases. (B-I) RT-qPCR
analysis was performed to confirm the expression levels of (B) TST,
(C) TERF1, (D) APPL1, (E) COA3, (F) CD133, (G) Prominin 2, (H) RALY
and (I) COL6A1 in NSCLC tissues and normal tissues. ***P<0.001.
IPA, Ingenuity Pathway Analysis; RT-qPCR, reverse
transcription-quantitative PCR; COL6A1, collagen type 6A1; TST,
thiosulfate sufurtransferase; APPL1, adaptor protein
phosphotyrosine interacting with PH domain and leucine zipper 1;
COA3, cytochrome c oxidase assembly factor 3; TERF1, telomeric
repeat-binding factor 1; RALY, RALY heterogenous nuclear
ribonucleoprotein. |
Identification of eight genes with the
greatest differences in expression
To validate the accuracy of the microarray data, the
expression levels of COL6A1, thiosulfate sulfurtransferase (TST),
adaptor protein phosphotyrosine interacting with PH domain and
leucine zipper 1 (APPL1), cytochrome c oxidase assembly
factor 3 (COA3), telomeric repeat binding factor 1 (TERF1),
Prominin 2, RALY heterogenous nuclear ribonucleoprotein (RALY) and
CD133 were evaluated in NSCLC tissues and normal tissues using
RT-qPCR analysis. The expression levels of COL6A1, TST, APPL1, COA3
and TERF1 were significantly increased, whereas the levels of
Prominin 2, RALY and CD133 were significantly reduced in NSCLC
tissues compared with those in the normal tissues (Fig. 3B-I).
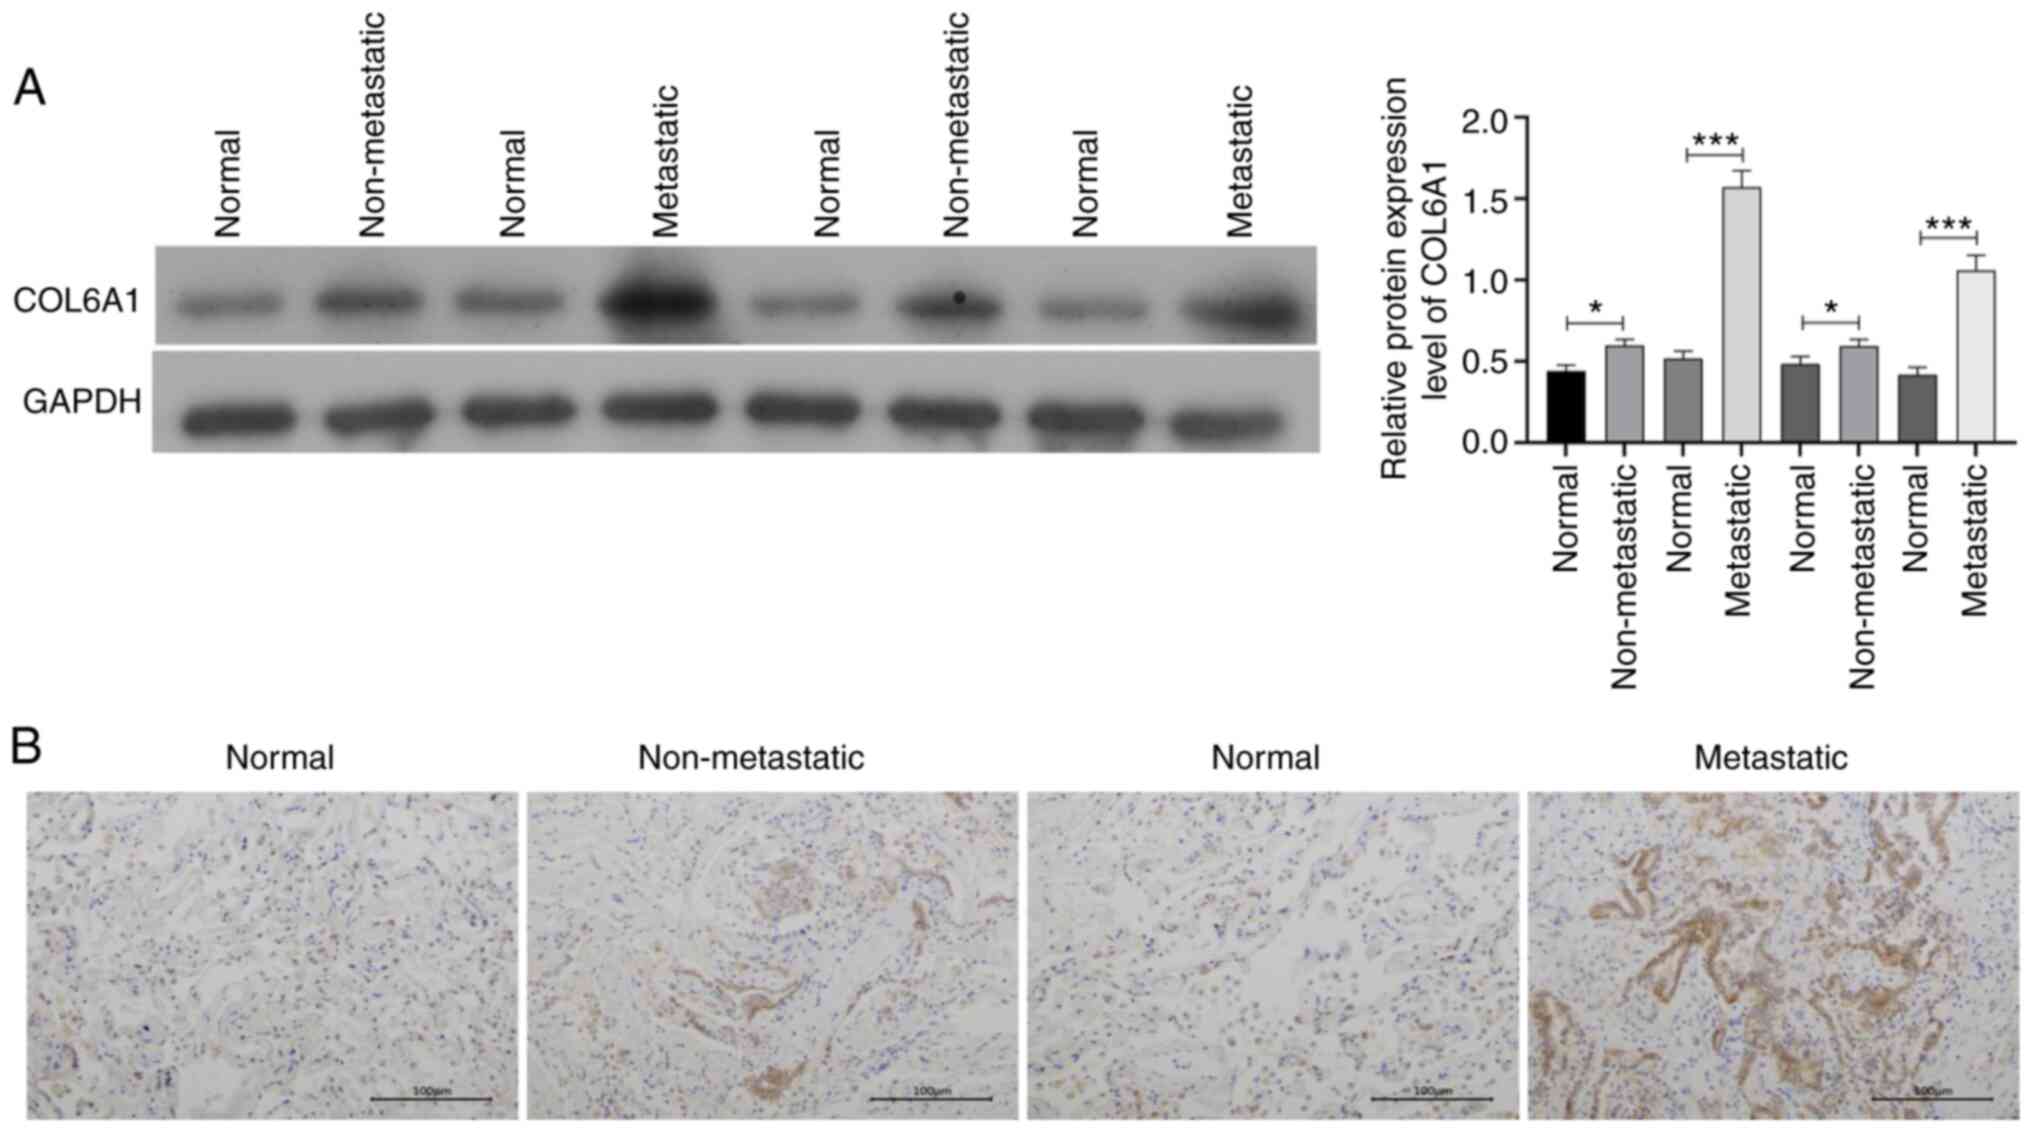
COL6A1 expression is upregulated in
NSCLC tissue samples with bone metastases
COL6A1 was the most highly expressed gene in samples
with bone metastases compared with those without bone metastases.
As presented in Fig. 4A, compared
with those in normal lung tissues, the expression levels of COL6A1
were significantly increased in NSCLC tissues without or with bone
metastasis, and COL6A1 level appeared to be upregulated in
metastatic NSCLC tissues compared with those in the non-metastatic
NSCLC tissues. High expression levels of COL6A1 were associated
with the Tumor-Node-Metastasis stage and with metastasis to the
bone and other organs (Table II).
Consistent with these results, the IHC analysis revealed that high
protein expression levels of COL6A1 were also observed in the
metastatic NSCLC tissues (Fig. 4B),
suggesting that COL6A1 may serve an important role in the process
of bone metastasis.
| Table II.Associations between COL6A1
expression levels and clinicopathological characteristics in NSCLC
patients (n=40). |
Table II.
Associations between COL6A1
expression levels and clinicopathological characteristics in NSCLC
patients (n=40).
|
| COL6A1
expression |
|
|
|---|
|
|
|
|
|
|---|
| Characteristic | High (n=20) | Low (n=20) | χ2 | P-value |
|---|
| Sex |
|
| 0.4167 | 0.5186 |
| Male | 13 | 11 |
|
|
|
Female | 7 | 9 |
|
|
| Age, years |
|
| 1.026 | 0.3112 |
|
≥60 | 15 | 12 |
|
|
|
<60 | 5 | 8 |
|
|
| Smoking |
|
| 0.4396 | 0.5073 |
|
Yes | 12 | 14 |
|
|
| No | 8 | 6 |
|
|
| Tumor size, cm |
|
| 1.29 | 0.256 |
| ≥3 | 6 | 3 |
|
|
|
<3 | 14 | 17 |
|
|
|
Tumor-Node-Metastasis stage (8th edition)
(45,46) |
|
| 5.227 | 0.0222 |
|
I–II | 4 | 11 |
|
|
|
III–IV | 16 | 9 |
|
|
| Bone
metastasis |
|
| 4.912 | 0.0267 |
|
Yes | 13 | 6 |
|
|
| No | 7 | 14 |
|
|
| Other
metastasis |
|
| 5.013 | 0.0252 |
|
Yes | 12 | 5 |
|
|
| No | 8 | 15 |
|
|
| Tumor type |
|
| 0.9207 | 0.3373 |
|
Squamous | 7 | 10 |
|
|
|
Adenocarcinoma | 13 | 10 |
|
|
Effects of COL6A1 overexpression and
knockdown on the proliferation and invasion of HARA and HARA-B4
cells
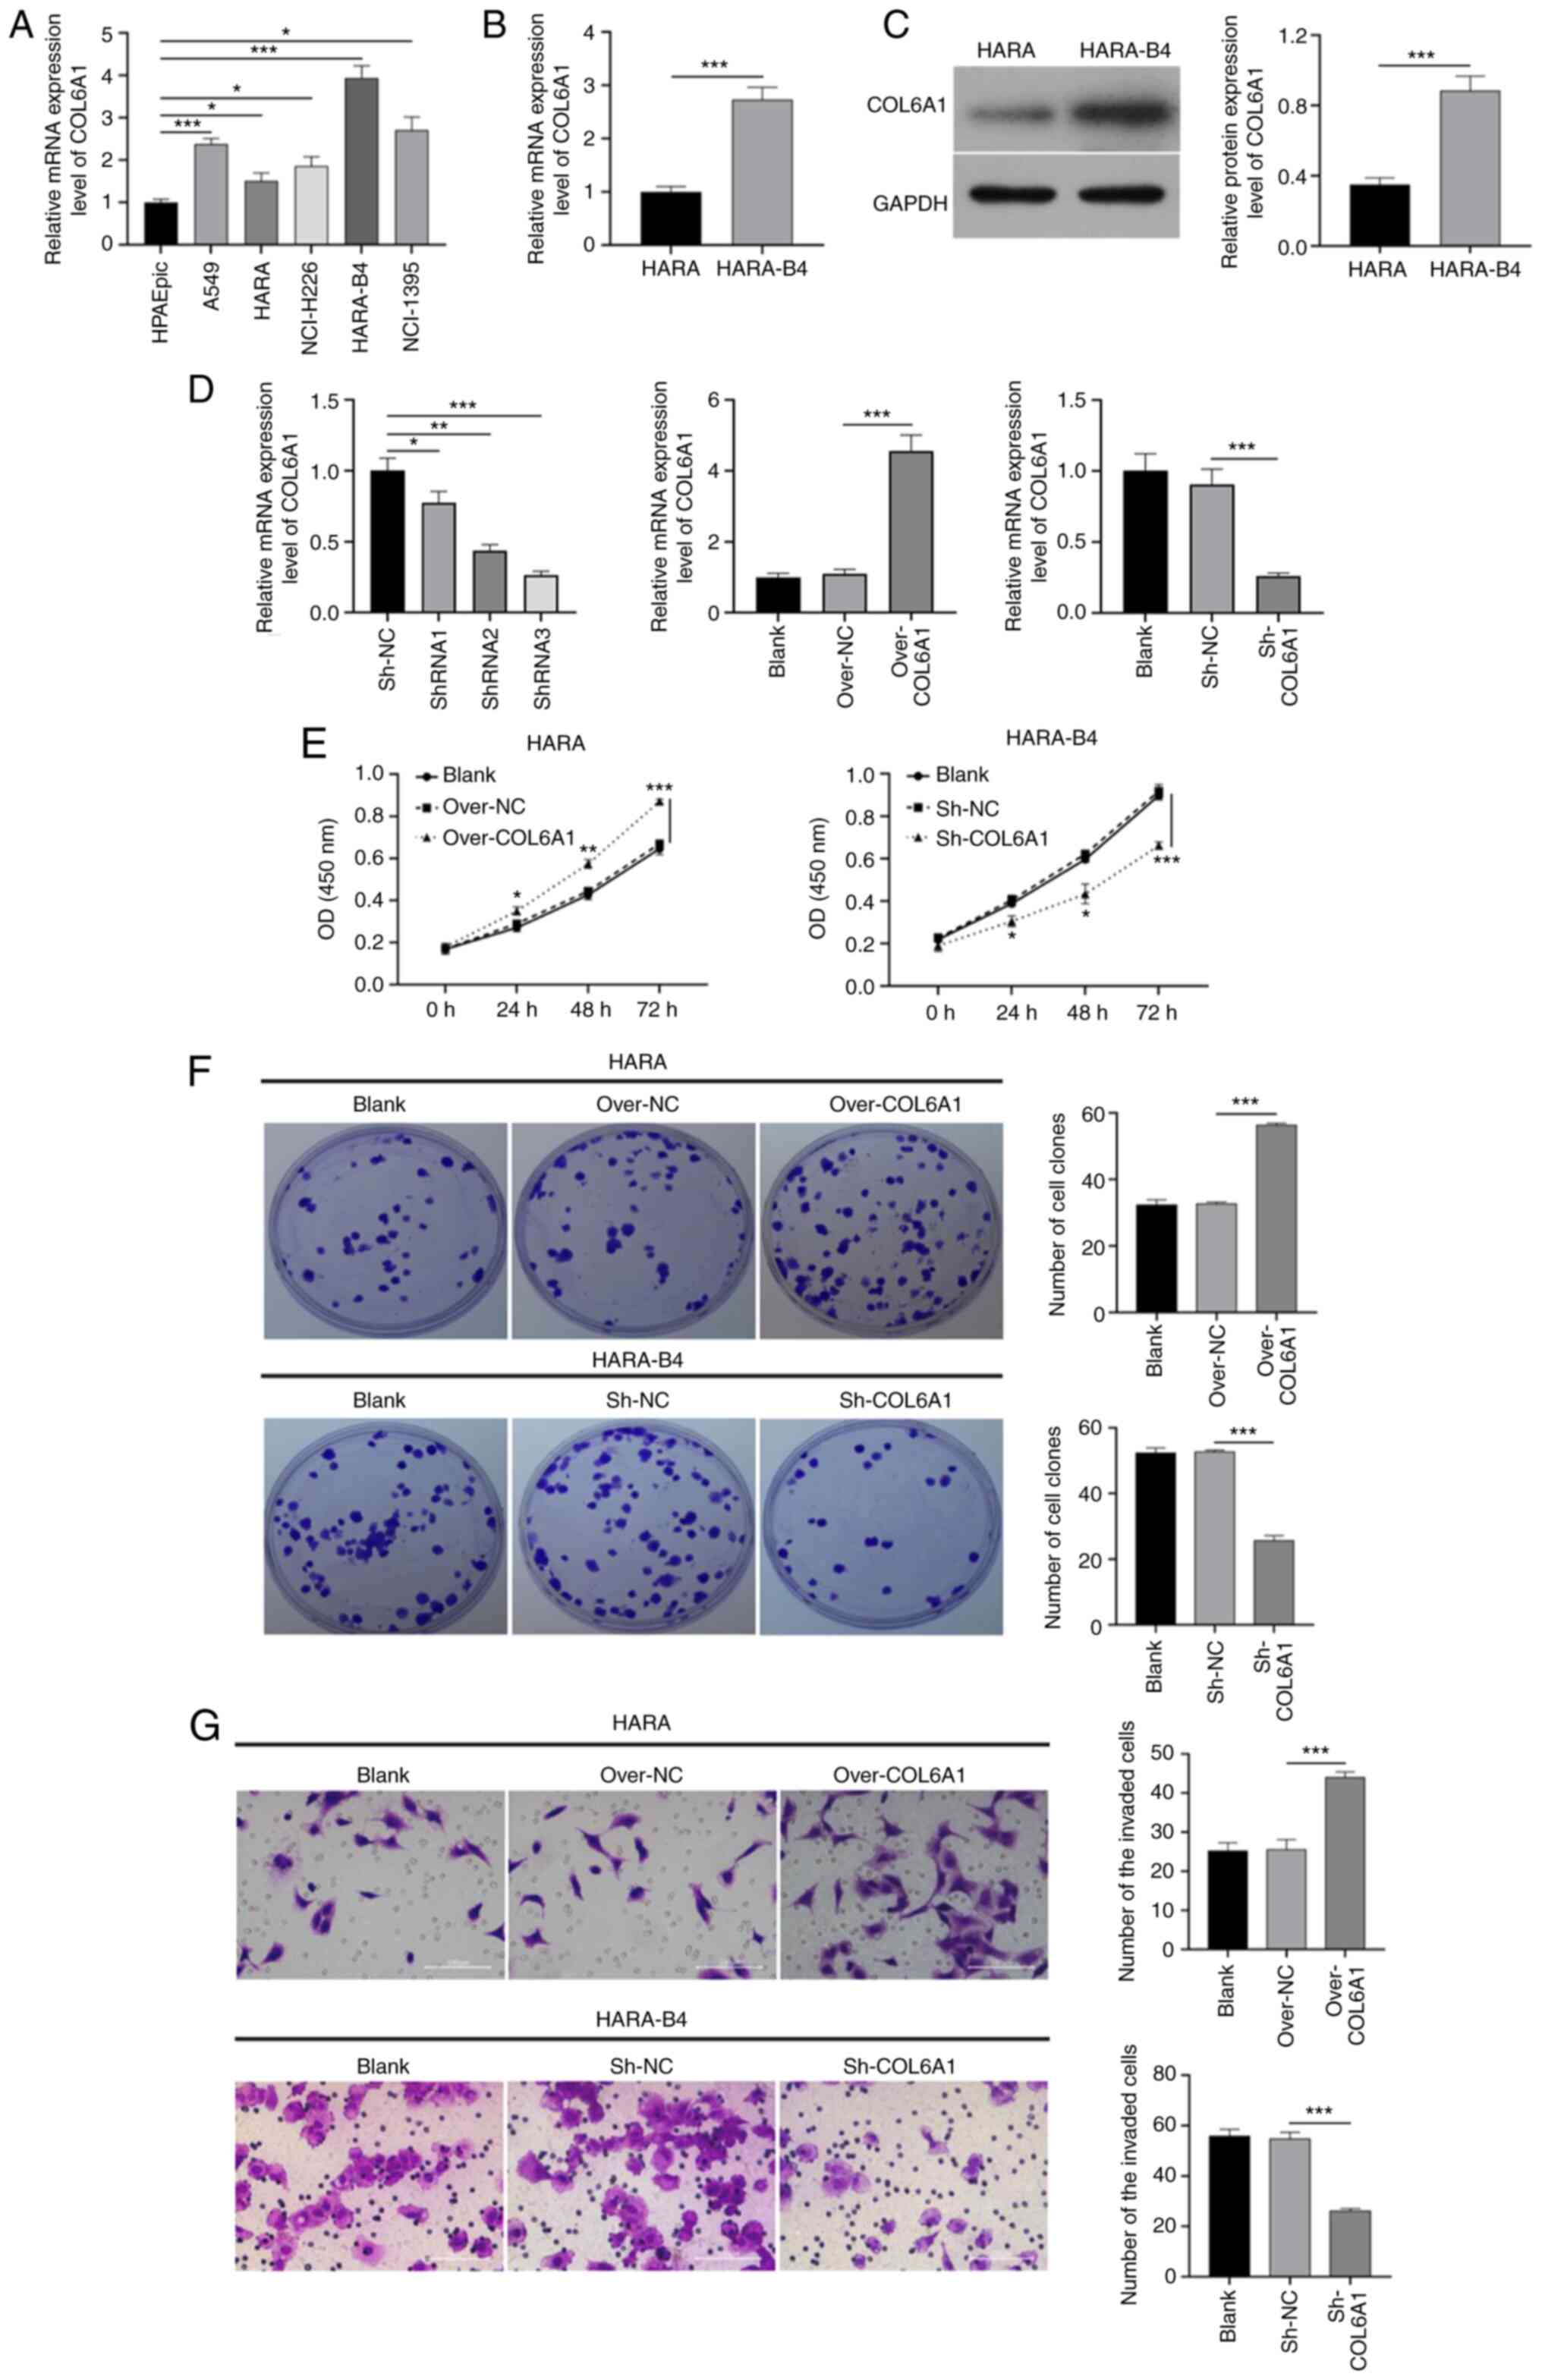
To further analyze the roles of COL6A1 on NSCLC
cells, COL6A1 expression in normal lung epithelial cells (HPAEpic)
and five NSCLC cancer cell lines was examined. As demonstrated in
Fig. 5A, the expression of COL6A1
was higher in the five NSCLC cell lines (A549, HARA, NCI-H226,
HARA-B4 and NCI-1395) compared with those in the HPAEpic cells.
Amongst the five NSCLC cell lines, HARA-B4 cells exhibited the
highest levels of COL6A1 expression, whereas HARA cells exhibited
the lowest levels.
Compared with those in the HARA cells, the mRNA and
protein expression levels of COL6A1 were notably higher in the
HARA-B4 cells (Fig. 5B and C).
COL6A1 expression was thus overexpressed in HARA and knocked down
in HARA-B4 cells using an overexpression plasmid and shRNA,
respectively. The results of the CCK-8 assays demonstrated that
overexpression of COL6A1 significantly enhanced the proliferation
of HARA cells, whereas knockdown of COL6A1 notably reduced the
proliferation of HARA-B4 cells compared with that in the
corresponding control groups (Fig.
5D). Similarly, the colony formation assays revealed that
overexpression of COL6A1 significantly increased the number of
colonies formed by HARA cells compared with that in the control
group, whereas the reverse effect was observed in the COL6A1
knockdown HARA-B4 cells (Fig. 5E).
In addition, COL6A1 overexpression contributed to a significant
increase in HARA cell invasion, and COL6A1 knockdown significantly
reduced HARA-B4 cell invasion compared with that in the control
groups (Fig. 5F). Therefore, COL6A1
may induce the proliferation and invasion of NSCLC cells.
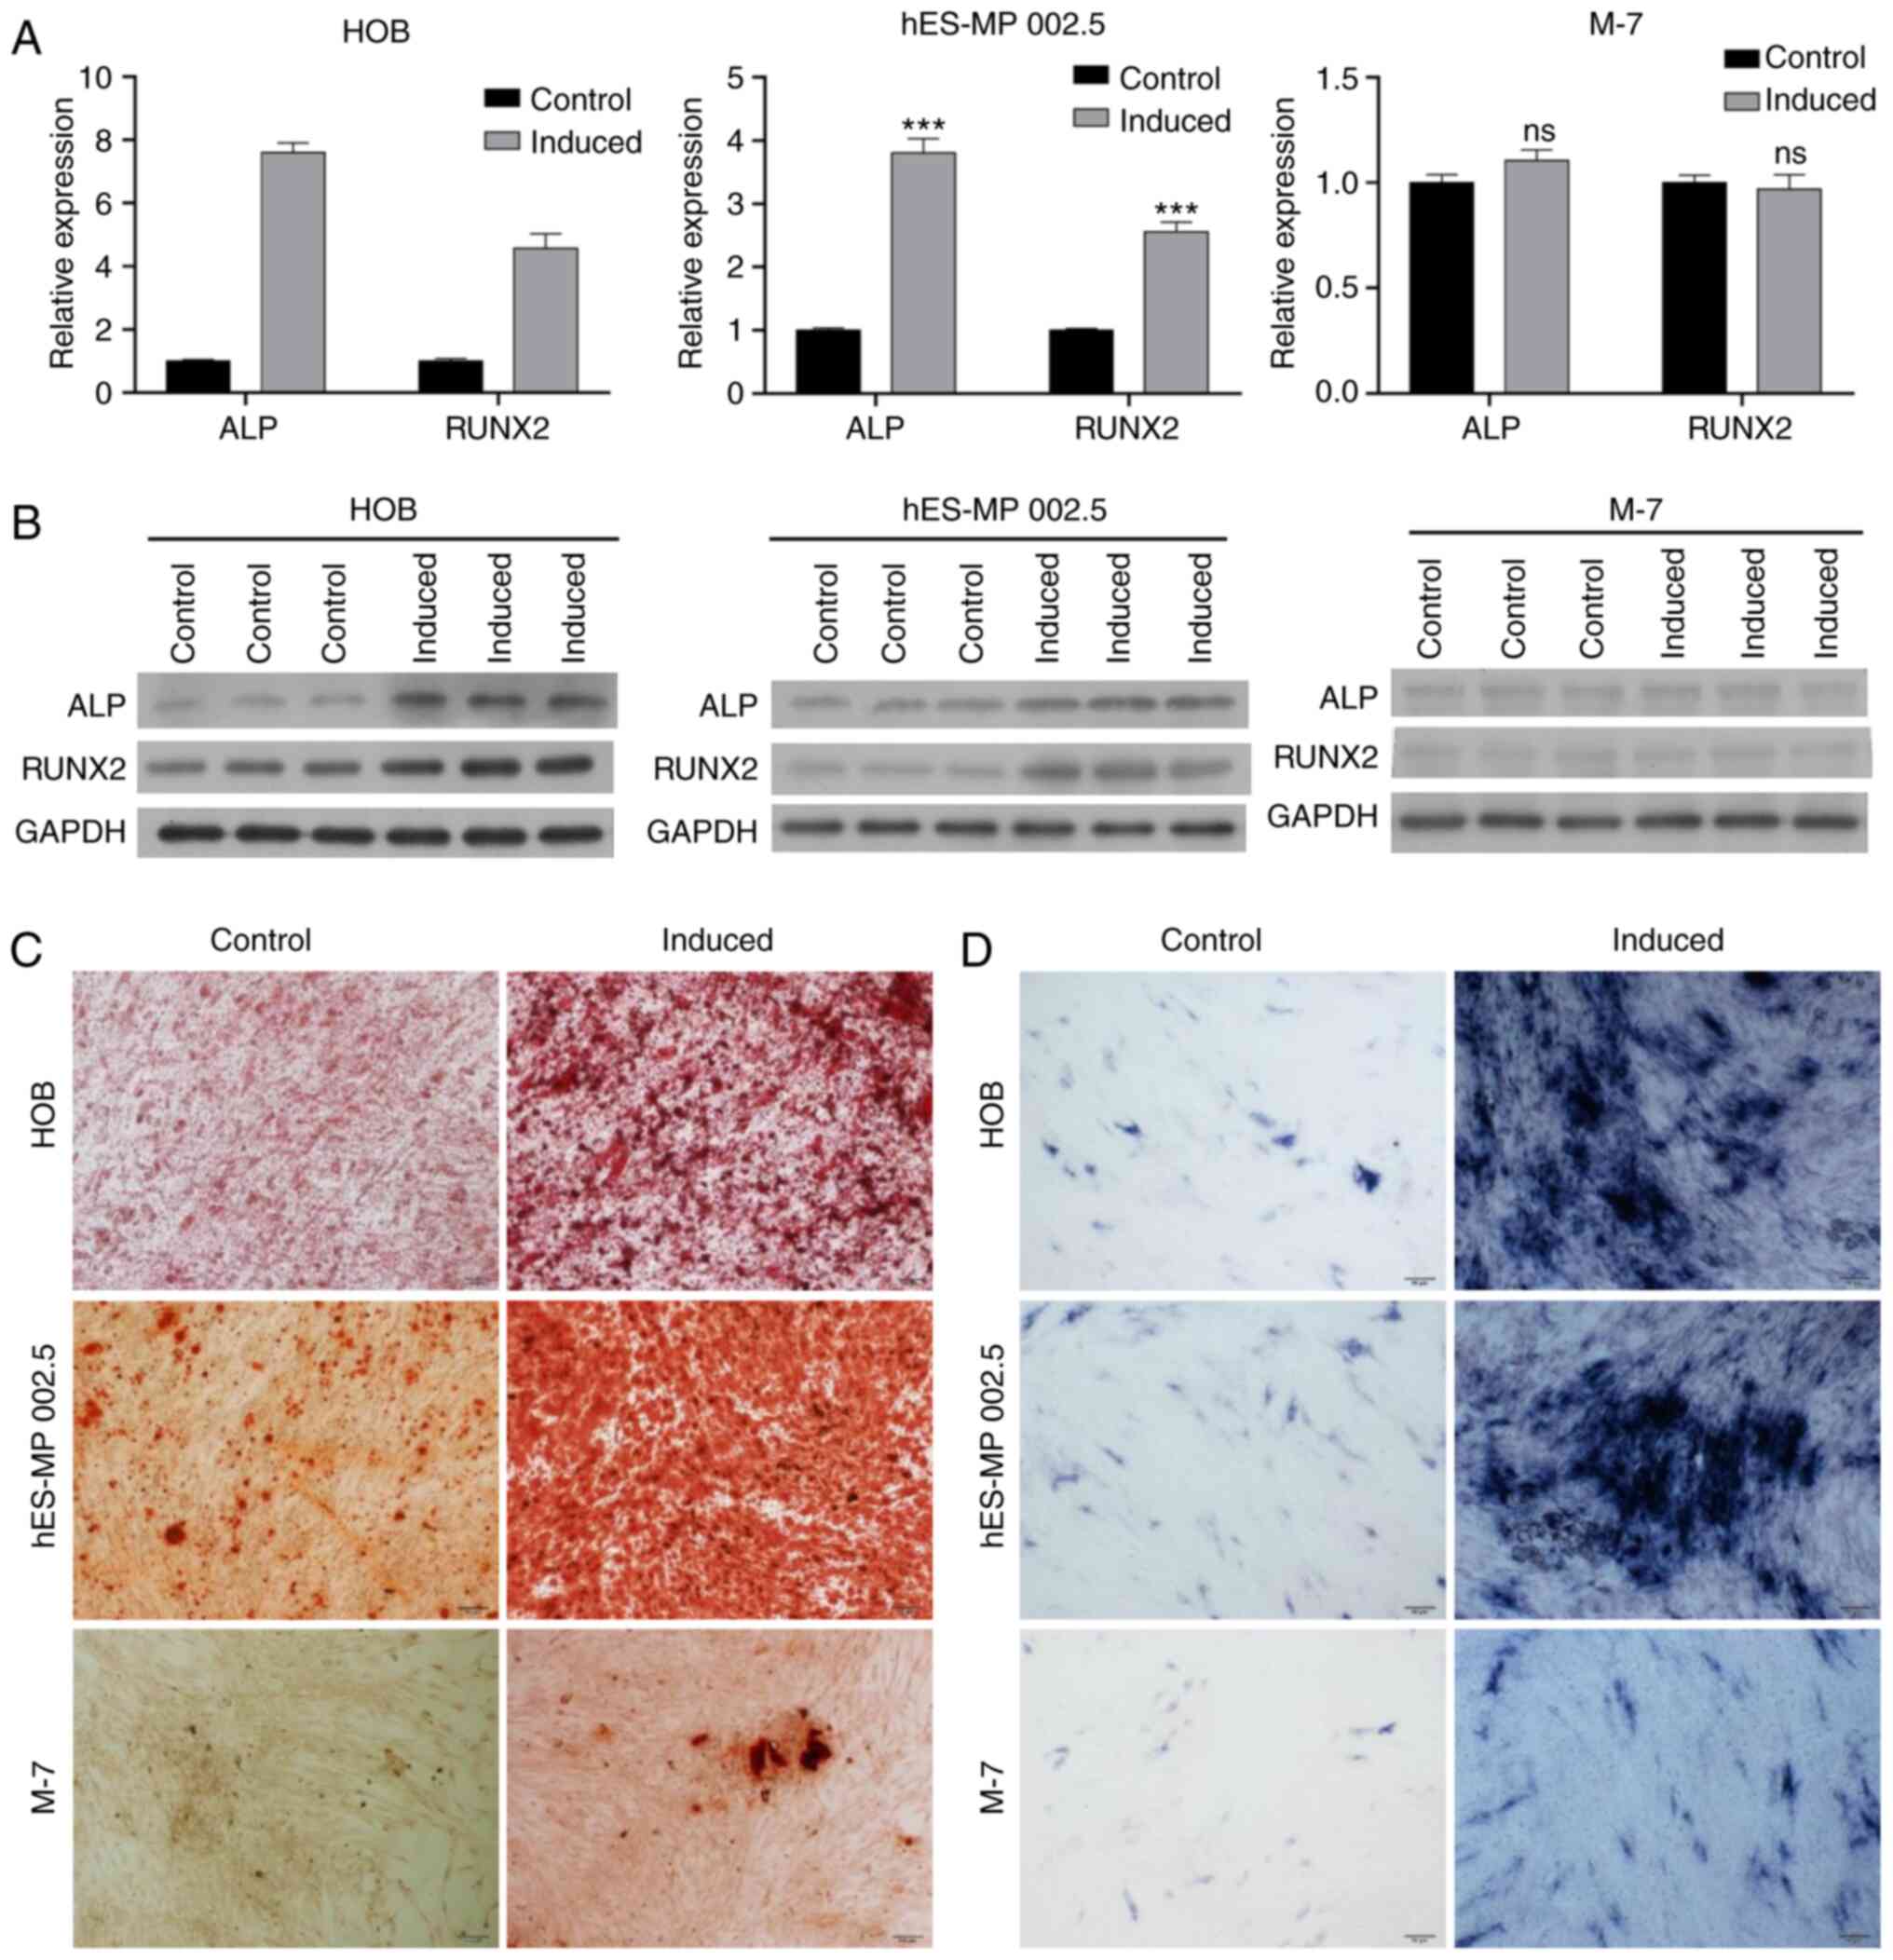
Identification of the osteogenic
ability of various cell lines
In order to establish a model for the in
vitro analysis of bone metastasis, the osteogenic abilities of
HOB, hES-MP 002.5 and M-7 cells were investigated.
Osteoblast-inducing conditional media was added to induce HOB,
hES-MP 002.5 and M-7 cells for 14 days. RT-qPCR analysis results
demonstrated that the expression levels of ALP and RUNX2 were
notably increased in HOB- and hES-MP 002.5-induced cells compared
with those in the respective control cells, whereas ALP and RUNX2
expression levels were not altered in the M-7 cells following
induction (Fig. 6A). In addition,
western blotting analysis also revealed that the levels of ALP and
RUNX2 were higher in the osteogenic-induced HOB and hES-MP 002.5
cells compared with those in the control cells; in the M-7 cells,
ALP and RUNX2 expression levels were low and were not altered
(Fig. 6B). The degree of osteogenic
differentiation was estimated in HOB, hES-MP 002.5 and M-7 cells.
Firstly, Alizarin Red staining was used to assess calcium
deposition in these cells. As demonstrated in Fig. 6C, HOB and hES-MP 002.5 cells
exhibited weak osteoblastic activity under normal culture
conditions, and a large number of osteoblasts were observed
following osteogenic induction. No osteoblasts were present in the
M-7 cells under normal culture conditions, and few osteoblasts were
observed following induction. ALP staining was used to determine
the ALP activity of HOB, hES-MP 002.5 and M-7 cells. ALP activity
was enhanced in HOB and hES-MP 002.5 cells following osteogenic
induction compared with that in the normally cultured cells.
Following osteogenic induction, the ALP activity was slightly
increased in the M-7 cells compared with that in uninduced cells
(Fig. 6D).
COL6A1 promotes bone metastasis in
vitro
To investigate the effect of COL6A1 on osteogenic
differentiation and identify the effects of COL6A1 on cell
adhesion, HOB, hES-MP 002.5 and M-7 cells were co-cultured with
COL6A1-overexpressing HARA cells and COL6A1-knockdown HARA-B4
cells, and the number of GFP-expressing cells were counted.
Compared with that in the negative control-transfected cells,
overexpression of COL6A1 enhanced the adhesive capacity of HARA
cells following co-culture with HOB and hES-MP 002.5 cells, whereas
knockdown of COL6A1 significantly attenuated the adhesive capacity
of HARA-B4 cells after co-culture with HOB and hES-MP 002.5 cells.
However, COL6A1 did not alter the adhesive capacity of HARA-B4
cells following co-culture with M-7 cells (Fig. 7).
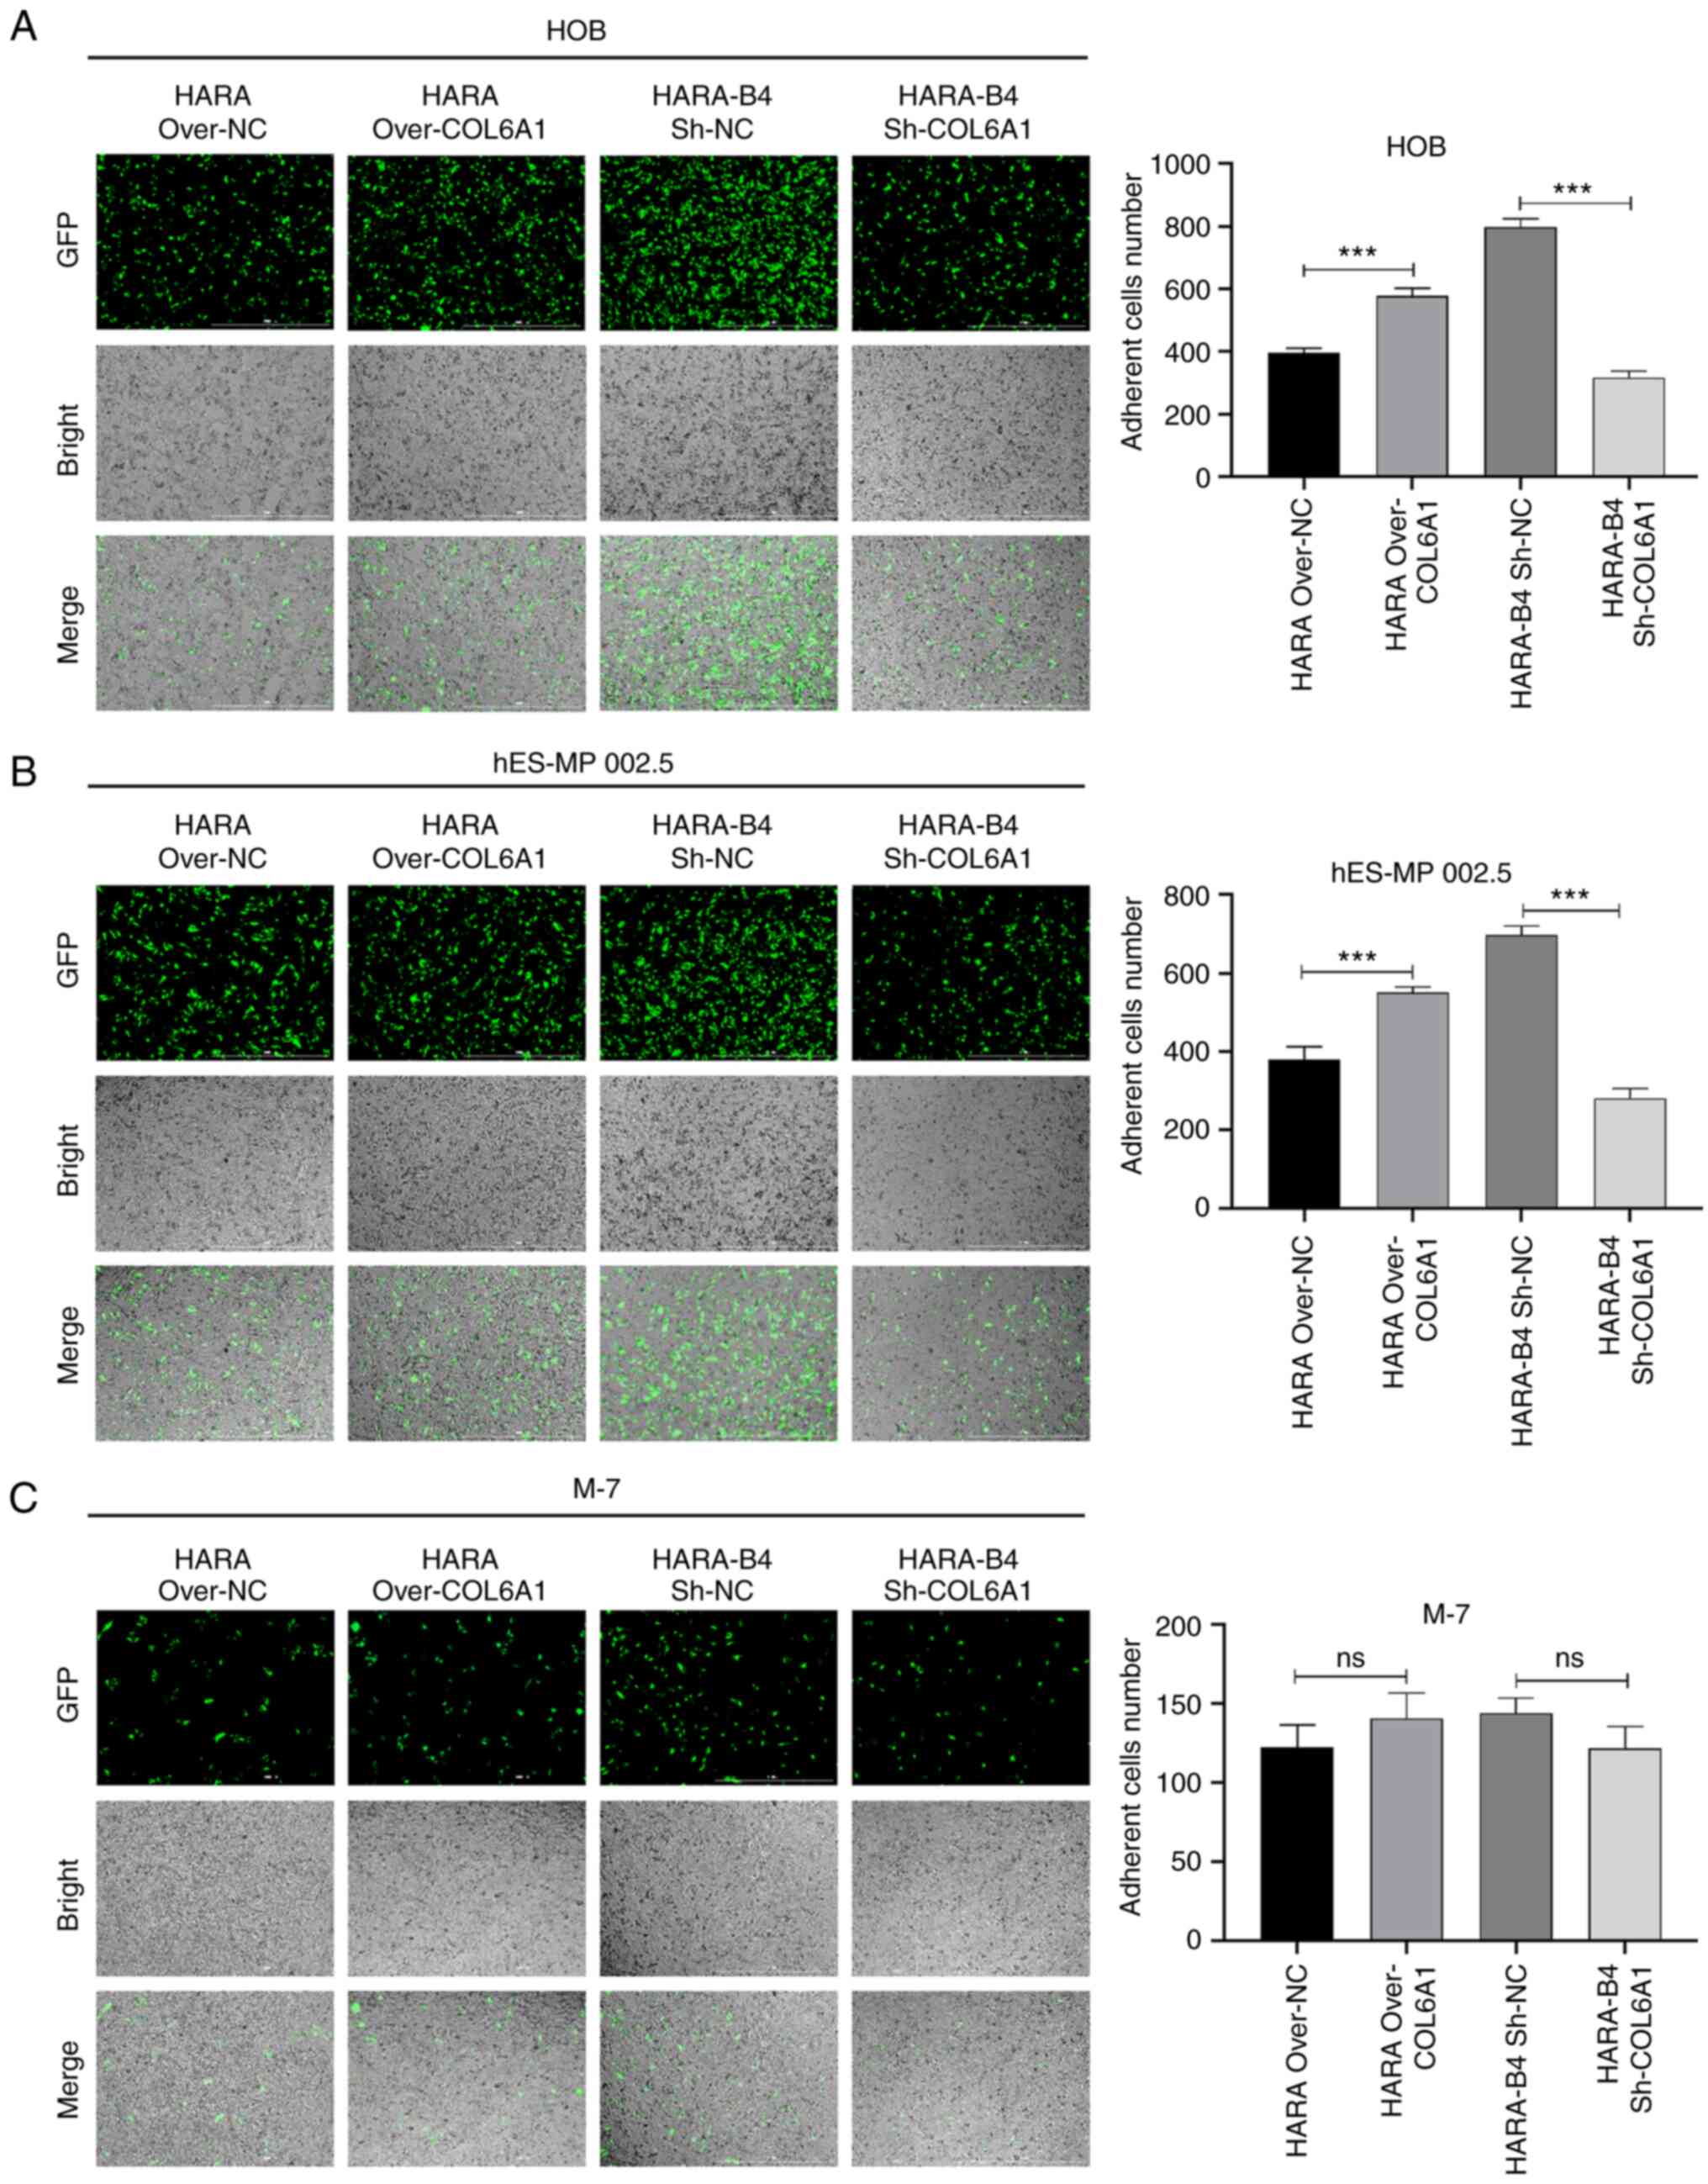 | Figure 7.COL6A1 increases the adhesive ability
of HARA and HARA-B4 cells after co-culture with HOB or hES-MP 002.5
cells. (A-C) The adhesive capacities of HARA cells transfected with
the COL6A1 overexpression plasmid or empty vector and HARA-B4 cells
transfected with sh-COL6A1 or sh-NC were assessed by counting the
number of GFP-positive cells following co-culture with (A) HOB, (B)
hES-MP 002.5 or (C) M-7 cells for 30 min. Magnification, ×100;
scale bar, 100 µm. ***P<0.001, COL6A1, collagen type 6A1; over,
overexpression vector; sh, short hairpin RNA; NC, negative control;
GFP, green fluorescent protein; ns, no statistical
significance. |
Discussion
NSCLC is a common malignant tumor, and the rates of
morbidity and mortality are increasing (27). Tumor stage, lymph node and bone
metastasis have been reported to be the primary factors negatively
affecting the prognosis of patients with NSCLC (28,29). To
examine the gene markers and regulatory pathways associated with
bone metastasis in patients with NSCLC, whole transcriptome
expression microarray analysis was performed in the present study,
and the gene expression profiles between NSCLC tissue samples with
and without bone metastases were compared. Bioinformatics analysis
was performed to identify the key genes and pathways associated
with the development of bone metastasis. By comparing the
differences in gene expression between the two groups of samples,
364 DEGs were identified, including 140 upregulated and 224
downregulated genes in NSCLC tissue samples relative to the
non-metastatic tissue.
GO and KEGG analysis are commonly used methods to
predict and identify target molecules and regulatory networks
associated with disease occurrence (30–32). To
determine the molecular regulatory network of DEGs and the
biological functions of DEGs in NSCLC in the present study, GO and
KEGG pathway enrichment analysis was performed. GO analysis
revealed that the crucial biological processes of the DEGs in NSCLC
tissue samples with bone metastases were primarily associated with
‘cellular process’, ‘metabolic process’ and ‘biological
regulation’. ‘Binding’ and ‘catalytic activity’ were also
associated with bone metastasis in patients with NSCLC. In
addition, KEGG enrichment analysis demonstrated that the DEGs in
NSCLC tissue samples with bone metastases were primarily enriched
in ‘ribosome’, ‘apoptosis’, ‘cysteine and methionine metabolism’
and ‘transcriptional misregulation in cancer’. Additionally, the
expression levels of COL6A1, TST, APPL1, COA3 and TERF1 were
upregulated, whereas Prominin 2, RALY and CD133 were significantly
downregulated in NSCLC tissue samples with bone metastases compared
with those in non-metastatic samples. Amongst these DEGs, COL6A1
was the most significantly differentially expressed in NSCLC tissue
samples with bone metastasis (33,34).
COL6A1, which is located on chromosome 21, is a
crucial gene of the collagen family and encodes the α1 (VI) chain
of type VI collagen. Type VI collagen is an extracellular matrix
protein that serves crucial roles in maintaining the integrity of
several types of tissues, prostate cancer tissues (35), cervical cancer tissues (36) and clear cell renal cell carcinoma
tissues (37). COL6A1 has been
demonstrated to regulate cellular functions such as migration,
differentiation and survival by participating in various processes,
including apoptosis, proliferation, angiogenesis, fibrosis and
inflammation (38). Mutations of
COL6A1 are associated with several musculoskeletal disorders, such
as Bethlam myopathy and Ulrich congenital muscular dystrophy
(39). Although COL6A1 is widely
distributed in various tissues, its expression levels are markedly
higher in pancreatic cancer tumor tissues with bone metastases
compared with those in tissues without bone metastases (34). These findings suggest that COL6A1 may
be involved in the progression of several types of cancer (34,36,37,40,41). For
example, a recent study has reported that the mRNA and protein
expression levels of COL6A1 are high in lung tissues of patients
with pulmonary fibrosis (42),
suggesting an association between COL6A1 expression and NSCLC
development. In addition, by utilizing quantitative secretome
analysis, expression of COL6A1 has been demonstrated to be high in
metastatic NSCLC cells, whereas COL6A1 knockdown inhibited the
metastatic activity of cancer cells compared with the control group
(43). Global secretome analysis of
cell lines with varying bone metastatic ability from multiple types
of cancer has identified COL6A1 as a secreted mediator of bone
metastasis (44). The results of the
present study further confirmed that the levels of COL6A1 were
significantly upregulated in NSCLC tissues with bone metastases
compared with those in tissues from patients without bone
metastases. Additionally, it was demonstrated that COL6A1
accelerated the proliferation and invasion of NSCLC cells and
significantly increased the adhesive ability of HARA-B4 cells to
osteoblasts. Therefore, COL6A1 may be strongly associated with
metastasis to the bone in patients with NSCLC.
In conclusion, based on the comprehensive whole
transcriptome expression microarray analysis, the present study
revealed crucial genes and pathways that may be associated with the
features of NSCLC with bone metastases. In particular, COL6A1 was
demonstrated to increase the adhesive ability of HARA-B4 cells to
osteoblasts. It is therefore hypothesized that COL6A1 may
potentially serve as a novel therapeutic target for the treatment
of patients with advanced NSCLC with bone metastases.
Supplementary Material
Supporting Data
Supporting Data
Supporting Data
Supporting Data
Supporting Data
Supporting Data
Acknowledgements
Not applicable.
Funding
No funding was received.
Availability of data and materials
The datasets generated for this study are available
on the GEO database with the accession number GSE175601 (https://www.ncbi.nlm.nih.gov/geo/query/acc.cgi?acc=GSE175601).
Authors' contributions
NL, ZMZ conceived and designed the study. NL, ZMZ,
ML, XHC and YFL performed the experiments. NL, ZMZ and ML confirmed
the authenticity of all the raw data. NL, WL and YFL analyzed and
interpretated the data. NL wrote the manuscript. All authors read
and approved the final manuscript.
Ethics approval and consent to
participate
The study protocol used in the present study was
approved by the Ethics Committee of the Third Hospital of Hebei
Medical University. All patients signed the informed consent
forms.
Patient consent for publication
Not applicable.
Competing interests
The authors declare that they have no competing
interests.
Glossary
Abbreviations
Abbreviations:
|
NSCLC
|
non-small cell lung cancer
|
|
DEGs
|
differentially expressed genes
|
|
GO
|
Gene Ontology
|
|
KEGG
|
Kyoto Encyclopedia of Genes and
Genomes
|
|
IPA
|
Ingenuity Pathway Analysis
|
|
COL6A1
|
collagen type 6A1
|
References
|
1
|
Parkin DM, Bray F, Ferlay J and Pisani P:
Global cancer statistics, 2002. CA Cancer J Clin. 55:74–108. 2005.
View Article : Google Scholar : PubMed/NCBI
|
|
2
|
Ferlay J, Colombet M, Soerjomataram I,
Mathers C, Parkin DM, Piñeros M, Znaor A and Bray F: Estimating the
global cancer incidence and mortality in 2018: GLOBOCAN sources and
methods. Int J Cancer. 144:1941–1953. 2019. View Article : Google Scholar : PubMed/NCBI
|
|
3
|
Ni Y, Ye X, Yang X, Huang G, Li W, Wang J,
Han X, Wei Z, Meng M and Zou Z: Microwave ablation for non-small
cell lung cancer with synchronous solitary extracranial metastasis.
J Cancer Res Clin Oncol. 146:1361–1367. 2020. View Article : Google Scholar : PubMed/NCBI
|
|
4
|
Nakahara Y, Hosomi Y, Shibuya M, Mitsufuji
H, Katagiri M, Naoki K, Soejima K, Nogami N, Nagase S, Nishikawa M,
et al: Multicenter study of zoledronic acid administration in
non-small-cell lung cancer patients with bone metastasis: Thoracic
oncology research group (TORG) 1017. Mol Clin Oncol. 11:349–353.
2019.PubMed/NCBI
|
|
5
|
Oster G, Lamerato L, Glass AG, Richert-Boe
KE, Lopez A, Chung K, Richhariya A, Dodge T, Wolff GG, Balakumaran
A and Edelsberg J: Natural history of skeletal-related events in
patients with breast, lung, or prostate cancer and metastases to
bone: A 15-year study in two large US health systems. Support Care
Cancer. 21:3279–3286. 2013. View Article : Google Scholar : PubMed/NCBI
|
|
6
|
Katakami N, Kunikane H, Takeda K, Takayama
K, Sawa T, Saito H, Harada M, Yokota S, Ando K, Saito Y, et al:
Prospective study on the incidence of bone metastasis (BM) and
skeletal-related events (SREs) in patients (pts) with stage IIIB
and IV lung cancer-CSP-HOR 13. J Thorac Oncol. 9:231–238. 2014.
View Article : Google Scholar : PubMed/NCBI
|
|
7
|
Zhang L and Gong Z: Clinical
characteristics and prognostic factors in bone metastases from lung
cancer. Med Sci Monit. 23:4087–4094. 2017. View Article : Google Scholar : PubMed/NCBI
|
|
8
|
Lang J, Zhao Q, He Y and Yu X: Bone
turnover markers and novel biomarkers in lung cancer bone
metastases. Biomarkers. 23:518–526. 2018. View Article : Google Scholar : PubMed/NCBI
|
|
9
|
Pontarollo G, Confavreux CB, Pialat JB,
Isaac S, Forest F, Yvorel V, Maury JM, Girard N and Brevet M: Bone
decalcification to assess programmed cell death ligand 1 expression
in bone metastases of non-small cell lung cancers. J Bone Oncol.
21:1002752020. View Article : Google Scholar : PubMed/NCBI
|
|
10
|
Zhao H, Han KL, Wang ZY, Chen Y, Li HT,
Zeng JL, Shen Z and Yao Y: Value of C-telopeptide-cross-linked Type
I collagen, osteocalcin, bone-specific alkaline phosphatase and
procollagen Type I N-terminal propeptide in the diagnosis and
prognosis of bone metastasis in patients with malignant tumors. Med
Sci Monit. 17:CR626–CR633. 2011. View Article : Google Scholar : PubMed/NCBI
|
|
11
|
Yang S, Liu Y, Li MY, Ng CSH, Yang SL,
Wang S, Zou C, Dong Y, Du J, Long X, et al: FOXP3 promotes tumor
growth and metastasis by activating Wnt/β-catenin signaling pathway
and EMT in non-small cell lung cancer. Mol Cancer. 16:1242017.
View Article : Google Scholar : PubMed/NCBI
|
|
12
|
Wei CH, Wu G, Cai Q, Gao XC, Tong F, Zhou
R, Zhang RG, Dong JH, Hu Y and Dong XR: MicroRNA-330-3p promotes
cell invasion and metastasis in non-small cell lung cancer through
GRIA3 by activating MAPK/ERK signaling pathway. J Hematol Oncol.
10:1252017. View Article : Google Scholar : PubMed/NCBI
|
|
13
|
Yuan J, Zhang G, Li X, Ma Q, Cheng W, Wang
W, Zhang B, Hu T and Song G: Knocking down USP39 inhibits the
growth and metastasis of non-small-cell lung cancer cells through
activating the p53 pathway. Int J Mol Sci. 21:89492020. View Article : Google Scholar : PubMed/NCBI
|
|
14
|
Ge L, Shao GR, Wang HJ, Song SL, Xin G, Wu
M and Zhang FX: Integrated analysis of gene expression profile and
genetic variations associated with ovarian cancer. Eur Rev Med
Pharmacol Sci. 19:2703–2710. 2015.PubMed/NCBI
|
|
15
|
Shi WY, Liu KD, Xu SG, Zhang JT, Yu LL, Xu
KQ and Zhang TF: Gene expression analysis of lung cancer. Eur Rev
Med Pharmacol Sci. 18:217–228. 2014.PubMed/NCBI
|
|
16
|
Liao Y, Yin G, Wang X, Zhong P, Fan X and
Huang C: Identification of candidate genes associated with the
pathogenesis of small cell lung cancer via integrated
bioinformatics analysis. Oncol Lett. 18:3723–3733. 2019.PubMed/NCBI
|
|
17
|
Ritchie ME, Belinda P, Wu D, Hu Y, Law CW,
Shi W and Smyth GK: limma powers differential expression analyses
for RNA-sequencing and microarray studies. Nucleic Acids Res.
43:e472015. View Article : Google Scholar : PubMed/NCBI
|
|
18
|
Püffeld M, Seiler C, Kuhlmann M,
Sreenivasulu N and Butardo VM Jr: Analysis of developing rice grain
transcriptome using the agilent microarray platform. Methods Mol
Biol. 1892:277–300. 2019. View Article : Google Scholar : PubMed/NCBI
|
|
19
|
Eadie A, Vásquez I, Liang X, Wang X,
Souders CL II, Chehouri JE, Hoskote R, Feswick A, Cowie AM,
Loughery JR and Martyniuk CJ: Transcriptome network data in larval
zebrafish (Danio rerio) following exposure to the
phenylpyrazole fipronil. Data Brief. 33:1064132020. View Article : Google Scholar : PubMed/NCBI
|
|
20
|
Bolstad BM, Irizarry RA, Astrand M and
Speed TP: A comparison of normalization methods for high density
oligonucleotide array data based on variance and bias.
Bioinformatics. 19:185–193. 2003. View Article : Google Scholar : PubMed/NCBI
|
|
21
|
Groth D, Hartmann S, Klie S and Selbig J:
Principal components analysis. Methods Mol Biol. 930:527–547. 2013.
View Article : Google Scholar : PubMed/NCBI
|
|
22
|
Dennis G Jr, Sherman BT, Hosack DA, Yang
J, Gao W, Lane HC and Lempicki RA: DAVID: Database for annotation,
visualization, and integrated discovery. Genome Biol. 4:P32003.
View Article : Google Scholar : PubMed/NCBI
|
|
23
|
Livak KJ and Schmittgen TD: Analysis of
relative gene expression data using real-time quantitative PCR and
the 2(-Delta Delta C(T)) method. Methods. 25:402–408. 2001.
View Article : Google Scholar : PubMed/NCBI
|
|
24
|
Li O, Tormin A, Sundberg B, Hyllner J, Le
Blanc K and Scheding S: Human embryonic stem cell-derived
mesenchymal stroma cells (hES-MSCs) engraft in vivo and support
hematopoiesis without suppressing immune function: Implications for
off-the shelf ES-MSC therapies. PLoS One. 8:e553192013. View Article : Google Scholar : PubMed/NCBI
|
|
25
|
Liao S, Yang Y, Chen S, Bi Y, Huang Q, Wei
Z, Qin A and Liu B: IL-24 inhibits endometrial cancer cell
proliferation by promoting apoptosis through the mitochondrial
intrinsic signaling pathway. Biomed Pharmacother. 124:1098312020.
View Article : Google Scholar : PubMed/NCBI
|
|
26
|
Zheng Y, Wang Q, Li T, Qian J, Lu Y, Li Y,
Bi E, Reu F, Qin Y, Drazba J, et al: Role of myeloma-derived MIF in
myeloma cell adhesion to bone marrow and chemotherapy response. J
Natl Cancer Inst. 108:djw1312016. View Article : Google Scholar : PubMed/NCBI
|
|
27
|
Rotow J and Bivona TG: Understanding and
targeting resistance mechanisms in NSCLC. Nat Rev Cancer.
17:637–658. 2017. View Article : Google Scholar : PubMed/NCBI
|
|
28
|
Hui W, Yan Z, Hui Z and Yu J: Risk factors
for bone metastasis in completely resected non-small-cell lung
cancer. Future Oncol. 13:695–704. 2017. View Article : Google Scholar : PubMed/NCBI
|
|
29
|
Yang XY, Liao JJ and Xue WR: FMNL1
down-regulation suppresses bone metastasis through reducing TGF-β1
expression in non-small cell lung cancer (NSCLC). Biomed
Pharmacother. 117:1091262019. View Article : Google Scholar : PubMed/NCBI
|
|
30
|
Chen L, Zhang YH, Lu G, Huang T and Cai
YD: Analysis of cancer-related lncRNAs using gene ontology and KEGG
pathways. Artif Intell Med. 76:27–36. 2017. View Article : Google Scholar : PubMed/NCBI
|
|
31
|
Ding J and Zhang Y: Analysis of key GO
terms and KEGG pathways associated with carcinogenic chemicals.
Comb Chem High Throughput Screen. Dec 18–2017.(Online ahead of
print).
|
|
32
|
Wang R, Yin C, Fu L, Liu J, Li J and Yin
L: Expression profile analysis for epithelial-mesenchymal
transition of breast cancer cell line DKTA based on microarray
data. Eur J GynaecolOncol. 40:579–584. 2019.
|
|
33
|
Fujita A, Sato JR, Festa F, Gomes LR,
Oba-Shinjo SM, Marie SK, Ferreira CE and Sogayar MC: Identification
of COL6A1 as a differentially expressed gene in human astrocytomas.
Genet Mol Res. 7:371–378. 2008. View Article : Google Scholar : PubMed/NCBI
|
|
34
|
Owusu-Ansah KG, Song G, Chen R, Edoo MIA,
Li J, Chen B, Wu J, Zhou L, Xie H, Jiang D and Zheng S: COL6A1
promotes metastasis and predicts poor prognosis in patients with
pancreatic cancer. Int J Oncol. 55:391–404. 2019.PubMed/NCBI
|
|
35
|
Zhu YP, Wan FN, Shen YJ, Wang HK, Zhang GM
and Ye DW: Reactive stroma component COL6A1 is upregulated in
castration-resistant prostate cancer and promotes tumor growth.
Oncotarget. 6:14488–14496. 2015. View Article : Google Scholar : PubMed/NCBI
|
|
36
|
Hou T, Tong C, Kazobinka G, Zhang W, Huang
X, Huang Y and Zhang Y: Expression of COL6A1 predicts prognosis in
cervical cancer patients. Am J Transl Res. 8:2838–2844.
2016.PubMed/NCBI
|
|
37
|
Wan F, Wang H, Shen Y, Zhang H, Shi G, Zhu
Y, Dai B and Ye D: Upregulation of COL6A1 is predictive of poor
prognosis in clear cell renal cell carcinoma patients. Oncotarget.
6:27378–27387. 2015. View Article : Google Scholar : PubMed/NCBI
|
|
38
|
Frka K, Facchinello N, Del Vecchio C,
Carpi A, Curtarello M, Venerando R, Angelin A, Parolin C, Bernardi
P, Bonaldo P, et al: Lentiviral-mediated RNAi in vivo silencing of
Col6a1, a gene with complex tissue specific expression pattern. J
Biotechnol. 141:8–17. 2009. View Article : Google Scholar : PubMed/NCBI
|
|
39
|
Llacua LA, Hoek A, de Haan BJ and de Vos
P: Collagen type VI interaction improves human islet survival in
immunoisolating microcapsules for treatment of diabetes. Islets.
10:60–68. 2018. View Article : Google Scholar : PubMed/NCBI
|
|
40
|
Lamandé SR and Bateman JF: Collagen VI
disorders: Insights on form and function in the extracellular
matrix and beyond. Matrix Biol. 71-72:348–367. 2018. View Article : Google Scholar : PubMed/NCBI
|
|
41
|
Sato T, Takano R, Tokunaka K, Saiga K,
Tomura A, Sugihara H, Hayashi T, Imamura Y and Morita M: Type VI
collagen α1 chain polypeptide in non-triple helical form is an
alternative gene product of COL6A1. J Biochem. 164:173–181. 2018.
View Article : Google Scholar : PubMed/NCBI
|
|
42
|
Åhrman E, Hallgren O, Malmström L,
Hedström U, Malmström A, Bjermer L, Zhou XH, Westergren-Thorsson G
and Malmström J: Quantitative proteomic characterization of the
lung extracellular matrix in chronic obstructive pulmonary disease
and idiopathic pulmonary fibrosis. J Proteomics. 189:23–33. 2018.
View Article : Google Scholar : PubMed/NCBI
|
|
43
|
Xin S, Fang W, Li J, Li D, Wang C, Huang
Q, Huang M, Zhuang W, Wang X and Chen L: Impact of STAT1
polymorphisms on crizotinib-induced hepatotoxicity in ALK-positive
non-small cell lung cancer patients. J Cancer Res Clin Oncol.
147:725–737. 2021. View Article : Google Scholar : PubMed/NCBI
|
|
44
|
Blanco MA, LeRoy G, Khan Z, Alečković M,
Zee BM, Garcia BA and Kang Y: Global secretome analysis identifies
novel mediators of bone metastasis. Cell Res. 22:1339–1355. 2012.
View Article : Google Scholar : PubMed/NCBI
|
|
45
|
Goldstraw P, Chansky K, Crowley J,
Rami-Porta R, Asamura H, Eberhardt WE, Nicholson AG, Groome P,
Mitchell A, Bolejack V, et al: The IASLC lung cancer staging
project: Proposals for revision of the TNM stage groupings in the
forthcoming (Eighth) Edition of the TNM classification for lung
cancer. J Thorac Oncol. 11:39–51. 2016. View Article : Google Scholar : PubMed/NCBI
|
|
46
|
Akhurst T: Staging of non-small cell lung
cancer. PET Clin. 13:1–10. 2018. View Article : Google Scholar : PubMed/NCBI
|