Introduction
Chronic kidney disease is ubiquitous and associated with significant morbidity and mortality, and is caused by hypertension, infection, diabetes and the excess of complement activation (1). Complement activation accelerates progressive kidney diseases by stimulating the synthesis and release of pro-inflammatory cytokines, including TNFα and interleukins, and reactive oxygen species, as well as increasing the synthesis of matrix proteins (2).
Uromodulin (UMOD) is the most abundant protein in normal human urine and is selectively expressed by epithelial cells of the thick ascending limb of Henle's loop and the early distal renal tubule (3,4). Previous studies have revealed that UMOD serves an important role in patients with acute and chronic kidney diseases (5,6). The levels of UMOD in urine and blood are closely associated with the estimated glomerular filtration rate (eGFR) in patients with chronic kidney disease (7–9). Our previous studies have suggested that the levels of UMOD were decreased in urine and were associated with interstitial fibrosis, tubular atrophy and low eGFR in patients with IgA nephropathy (IgAN) (10–12). Furthermore, UMOD-knockout mice exhibit more serious injury compared with wild-type mice after ischemia-reperfusion injury (13,14); however, the potential underlying mechanism requires to be elucidated.
Complement is an important component of the innate immune system that consists of >30 types of proteins that widely exist in the circulation, tissues and cell membrane surface (15–17). Abnormal complement activation exists in a variety of kidney diseases, including lupus nephritis (LN) (18), IgAN (19) and membranoproliferative glomerulonephritis (20). Previous studies have reported that numerous types of kidney cells present a variety of complement components and complement receptors, such as C2, C3, C4, factor B, factor H, CR1, CR3 and C3aR (21,22). Moreover, Schiano et al (23) revealed that mice with complement factor H gene-knockout exhibited renal tubulointerstitial damage due to excessive complement activation. However, the exact mechanism remains unknown.
The present study aimed to investigate the potential clinical significance of UMOD, and its association with complement activation and histopathological characteristics in patients with kidney disease.
Materials and methods
Patients and samples
The present study was approved by the Ethical Committee of Qi Lu Hospital of Shandong University (Jinan, China). Written informed consent was obtained from all patients and healthy controls involved in the study. The study population included 58 patients with IgAN composed of 38 men and 20 women with a median age of 33 years (range, 27–48 years) and 36 patients with LN composed of 7 men and 29 women with a median age of 34 years (range, 28–46 years) between January 2014 and December 2018 at Qi Lu Hospital of Shandong University. Patients were included in the study according to the following requirements: i) Age of ≥18 years; and ii) biopsy-confirmed primary IgAN or LN. Additionally, 30 healthy volunteers (median age, 41 years; range, 25–61 years) were enrolled as controls, including 15 males and 15 females. Plasma samples (0.5 ml) were collected on the day of renal biopsy and stored at −80°C until assay. Clinical pathological parameters were also collected. eGFR was calculated using the Chronic Kidney Disease Epidemiology Collaboration equation (24).
UMOD, C3a, membrane attack complex (MAC), C1q, C3 and C4 measurements
The plasma UMOD levels were measured using a commercial human uromodulin ELISA kit (cat. no. RD191163200R; BioVendor R&D) according to the manufacturer's protocol as described previously (25). Based on median expression levels of plasma UMOD in the IgAN (217 ng/ml) and LN (169 ng/ml) groups, patients were classified into low and high expression subgroups. The plasma concentrations of C3a and MAC were determined using by ELISA (cat. no. A031 and A020, respectively; Quidel Corporation) according to the manufacturer's instructions. The plasma concentrations of C1q, C3 and C4 were measured using immunoturbidimetric assays (Shanghai BeiJi Biochemical reagent Co., Ltd.) according to the manufacturer's instructions.
Renal biopsy
All renal perforation specimens were collected and fixed in 4% paraformaldehyde at room temperature for 24 h. Following fixation, the samples were embedded in paraffin and cut into 4-µm-thick sections, which were then dewaxed in xylene (80–90°C), rehydrated using a descending ethanol series (100, 85 and 75% ethanol) and washed in water. Following antigen retrieval, the spontaneous fluorescence quencher (Wuhan Servicebio Technology Co., Ltd; cat. no. G1221) was added for 5 min at room temperature, and the samples were rinsed with water for 10 min. The sections were subsequently blocked using bovine serum albumin (Wuhan Servicebio Technology Co., Ltd.) for 30 min at room temperature and stained for IgA, IgG, IgM, C3, fibrinogen and C1q for immunofluorescence analysis (data not shown). Fluorescence results were determined using a semi-quantitative scale of 0–3: 0, No staining (−); 1, weakly positive (+); 2, positive (++); and 3, strongly positive (+++). Specimens from patients with IgAN were evaluated according to the following Oxford classification (26): Mesangial hypercellularity ≤0.5 (M0) or >0.5 (M1); segmental glomerulosclerosis absent (S0) or present (S1); endocapillary hypercellularity absent (E0) or present (E1); and tubular atrophy and interstitial fibrosis ≤25% (T0), 26–50% (T1) or >50% (T2). Specimens from patients with LN were analyzed using light microscopy according to the World Health Organization classification (27), and were then assessed for NIH activity index (AI) and chronicity index (CI).
Cell culture and simulated hypoxia-reoxygenation (H/R) ischemia model
Mouse inner medullary collecting duct (mIMCD3) cells were provided by Professor Chen Yuqing (Department of Nephrology of Peking University; Beijing, China). The cells were cultured in DMEM/F12 medium (HyClone; Cytiva) with 10% FBS (Gibco; Thermo Fisher Scientific, Inc.) in a humidified chamber with 5% CO2 at 37°C. According to a previously described method (28), cells were seeded into 60-mm culture dishes. After reaching ~60% confluency, the sugar-free and serum-free DMEM/F12 medium was changed and cells were cultured for 24 h. Subsequently, an appropriate amount of sterilized mineral oil (Sigma-Aldrich; Merck KGaA; cat. no. M5310) was added to the culture dishes, cells were blocked with sterilized mineral oil for 1, 6 and 12 h to simulate hypoxia at 37°C. After hypoxia, the mineral oil was aspirated, the plates were washed five times with sterilized PBS, and DMEM/F12 culture medium containing 10% FBS was added. The cells were then cultured in a 5% CO2 incubator at 37°C for 24 h for reoxygenation. Cells without any treatment were used as the control group.
Western blotting
Total proteins from 106 cells were extracted using RIPA cell lysis buffer (Beijing Solarbio Science & Technology Co., Ltd.) with phosphatase inhibitor and proteinase inhibitor (dilution, 100:10:1) and quantified using the Bradford method. The samples (20 µg/lane) were separated via 8% SDS-PAGE and transferred to PVDF membranes. The membranes were blocked with 5% skim milk for 1 h at 4°C, and then incubated with primary antibodies overnight at 4°C, followed by incubation with horseradish peroxidase-labelled secondary antibodies (1:500; cat. no. ZF-0316; OriGene Technologies, Inc.) at room temperature for 1 h. The primary antibodies used in the present study were as follows: Anti-β-actin (used as reference; 1:1,000; cat. no. TA-09; OriGene Technologies, Inc.), anti-UMOD (1:500; cat. no. 8595-0054; Bio-Rad Laboratories, Inc.) and anti-C1qA (1:500; cat. no. 11602-1-AP; ProteinTech Group, Inc.). The membrane was visualized using BeyoECL Plus (Shanghai Biyuntian Biotechnology Co., Ltd.), according to the manufacturer's protocol, and routine procedures using a gel imaging analyzer (Chemidoc XRS+; Bio-Rad Laboratories, Inc.). Relative signal intensity of protein expression was normalized to β-actin and quantified using ImageJ software (V1.8.0; National Institutes of Health).
Immunofluorescence assays
The cells in each group were seeded on a coverslip and cultured as aforementioned. Subsequently, cells were fixed with 4% paraformaldehyde for 30 min at room temperature, treated with 0.1% Triton X-100 for 15 min (at room temperature) and blocked with 5% fetal bovine serum (Gibco; Thermo Fisher Scientific, Inc.) for 30 min at room temperature. The cells were incubated with anti-C3d primary antibody (1:50; cat. no. AF2655-SP; R&D Systems, Inc.) overnight at 4°C. After washing, cells were incubated with secondary antibodies (1:200; cat. no. 34312ES60; Shanghai Yeasen Biotechnology Co., Ltd.) at room temperature for 1 h and DAPI was added dropwise to completely cover the cells for nuclei staining. The coverslip with cells was inversely placed and mounted on a slide with anti-fluorescence quenching agent (Beijing Solarbio Science & Technology Co., Ltd.). Sections were evaluated under fluorescence microscopy (magnification, ×200).
Statistical analysis
Data were analyzed using SPSS 23.0 software (IBM Corp.). Data are presented as the mean ± SD of at least three experiments, median and interquartile range for continuous variables or numbers (proportions) for categorical variables. Kruskal-Wallis test was used for comparisons of UMOD and complement components levels in plasma of patients, and Dunn-Bonferroni test was used as the post-hoc test. The correlation between plasma UMOD levels and complement components levels or clinicopathological features were examined using Spearman's correlation analysis or χ2 test and Fisher's exact test, respectively. P<0.05 was considered to indicate a statistically significant difference.
Results
Clinical characteristics of patients
Demographic and clinicopathological characteristics of the patients are presented in Table I. The median age of the patients with IgAN (33 years) and patients with LN (34 years) was not markedly different compared with that of healthy controls (41 years). Sex distribution was markedly different among the three groups. The immunofluorescence staining results of IgA, IgG, C1q, C3, IgM and Fibrinogen are presented in Table II.; IgA expression (+++) occurred more frequently in IgAN than in LN. IgG (+++) and C1q (+++) were expressed in LN, but not in IgAN. The histopathological features of patients with IgAN and patients with LN are listed in Tables III and IV.
 |
Table I.
Demographic, clinical and laboratory characteristics of patients with IgAN (n=58), LN (n=36) and healthy volunteers(n=30).
|
Table I.
Demographic, clinical and laboratory characteristics of patients with IgAN (n=58), LN (n=36) and healthy volunteers(n=30).
| Characteristics |
Total |
IgAN |
LN |
Healthy volunteers |
| Males, n (%) |
45 (47.9) |
38 (65.5) |
7 (19.4) |
15 (50) |
| Females, n (%) |
49 (52.1) |
20 (34.5) |
29 (80.6) |
15 (50) |
| Age, years (range) |
33 (28–46) |
33 (27–48) |
34 (28–46) |
41 (25–61) |
| Height, cm (range) cm |
167.5 (150–192) |
170 (162–175) |
163 (160–167) |
164.6 (150–180) |
| Weight, kg (range) |
69 (60–75) |
71 (64–78) |
65 (59–70) |
64 (46.5–92) |
| SBP (range), mmHg |
137 (128–154) |
137 (128–153) |
137 (129–153) |
134.5 (107–184) |
| DBP ± SD, mmHg |
87.89±14.79 |
87 (77–95) |
90 (78–98) |
85.56 (69–114) |
| RBC ± SD, ×1012/l |
4.21±0.81 |
4.49±0.66 |
3.78±0.84 |
|
| HGB ± SD, g/l |
121±25.8 |
132±22.8 |
105±21.8 |
118±28 |
| ESR (range), mm/h |
19 (11–32) |
17 (10–23) |
26 (13–48) |
34 (18–55) |
| Total protein (range), g/l |
58.7 (47.9–66.3) |
61.2 (52.47–66.8) |
50.2 (37.28–64.57) |
59.6 (48.7–76.8) |
| Albumin (range), g/l |
33.25 (25.2–39.93) |
35.55 (30.7–42.03) |
27.95 (18.83–33.25) |
32.62 (15.7–41.4) |
| ALT (range), U/l |
15 (11–19) |
15 (11–18) |
15 (11–22) |
19.7 (5–35) |
| AST (range), U/l |
18 (15–22) |
18 (16–22) |
19 (15–26) |
20.2 (11–26) |
| Total cholesterol (range), mmol/l |
5.64 (4.47–6.63) |
5.48 (4.63–6.59) |
5.73 (3.77–7.19) |
5.16 (3.13–9.19) |
| HDL cholesterol ± SD, mmol/l |
1.32±0.34 |
1.32±0.30 |
1.31±0.40 |
1.32±0.39 |
| LDL cholesterol (range), mmol/l |
3.35 (2.41–4.13) |
3.30 (2.60–4.09) |
3.56 (2.20–4.23) |
3.15 (2.09–4.88) |
| Triglycerides (range), mmol/l |
2.02 (1.33–2.83) |
1.93 (1.22–2.72) |
2.17 (1.45–3.16) |
1.87 (0.97–3.17) |
| Creatinine (range), mg/dl |
95 (73.75–134.25) |
107 (79–139.5) |
91 (68.25–131.25) |
126.4 (77–287) |
| BUN (range), μmol/l |
6.57 (5.1–11.23) |
5.78 (4.79–7.83) |
9.38 (6–16.15) |
7.81 (5.1–13.21) |
| Cystatin C (range), mg/l |
1.43 (1.03–1.86) |
1.16 (0.94–1.67) |
1.67 (1.16–2.43) |
1.58 (0.74–2.42) |
| Uric acid (range), μmol/l |
393 (311–523) |
373 (294–470) |
430 (344–572) |
359.3 (239–420) |
| eGFR (range), ml/min/1.73 m2 |
92 (72–110) |
97 (82–110) |
86 (66–107) |
90 (64–112) |
| GLU ± SD, mmol/l |
4.56±0.69 |
4.56±0.58 |
4.56±0.84 |
4.44±0.75 |
| UACR (range), mg/g |
2.65 (1.28–3.82) |
2.16 (1.08–3.43) |
2.95 (1.73–7.45) |
2.49 (0.99–4.49) |
| C3a (range), ng/l |
157.6 (92.4–240.4) |
144.8 (79.2–233.9) |
175 (112.5–310.6) |
147 (60.9–277.1) |
| MAC (range), ng/l |
190.8 (135.5–364.9) |
150.7 (117.4–222.2) |
354.4 (179.8–491) |
281 (118.76–435.7) |
| C1q ± SD, mg/l |
157±41.4 |
165±42.1 |
143±36.5 |
169±43.4 |
| C3 (range), g/l |
0.98 (0.5–1.18) |
1.14 (0.96–1.29) |
0.4 (0.31–0.69) |
0.9 (0.26–1.57) |
| C4 (range), g/l |
0.22 (0.07–0.30) |
0.26 (0.14–0.32) |
0.14 (0.07–0.23) |
0.25 (0.067–0.533) |
| UMOD (range) ng/l |
149.88 (96.53–245.04) |
147.12 (96.53–230.44) |
156.79 (95.42–250.25) |
189.91 (80.27–231.23) |
| K ± SD, mmol/l |
4.19±0.56 |
4.16±0.50 |
4.23±0.71 |
8.58±0.24 |
| Na (range), mmol/l |
141 (139–143) |
142 (141–143) |
140 (138–142) |
138.3 (123–143) |
| Cl ± SD, mmol/l |
106±3.6 |
106±2.6 |
106±4.9 |
102±1.9 |
|
Table II.
Histological characteristics of patients with IgAN (n=58) and LN (n=36).
|
Table II.
Histological characteristics of patients with IgAN (n=58) and LN (n=36).
| Immuno-fluorescence staining |
Total, n (%) |
IgAN, n (%) |
LN, n (%) |
| IgA |
| − |
3 (3.2) |
0 (0.0) |
3 (8.3) |
| + |
13 (13.8) |
5 (8.6) |
8 (22.2) |
| ++ |
22 (23.4) |
10 (17.2) |
12 (33.3) |
| +++ |
56 (59.6) |
43 (74.1) |
13 (36.1) |
| IgG |
| − |
51 (54.3) |
48 (82.9) |
3 (8.3) |
| + |
17 (18.1) |
9 (15.5) |
8 (22.2) |
| ++ |
13 (13.8) |
1 (1.7) |
12 (33.3) |
| +++ |
13 (13.8) |
0 (0.0) |
13 (36.1) |
| C3 |
| − |
21 (22.3) |
19 (32.8) |
2 (5.6) |
| + |
17 (18.1) |
12 (20.7) |
3 (13.9) |
| ++ |
21 (22.3) |
11 (19.0) |
10 (27.8) |
| +++ |
35 (37.2) |
16 (27.6) |
19 (52.8) |
| C1q |
| − |
46 (48.9) |
44 (75.9) |
2 (5.6) |
| + |
18 (19.1) |
11 (19.0) |
7 (19.4) |
| ++ |
13 (13.8) |
3 (5.2) |
10 (27.8) |
| +++ |
17 (18.1) |
0 (0.0) |
17 (47.2) |
| IgM |
| − |
32 (34) |
27 (46.6) |
5 (13.9) |
| + |
23 (24.5) |
16 (27.6) |
7 (19.4) |
| ++ |
28 (29.8) |
11 (19.0) |
17 (47.2) |
| +++ |
11 (11.7) |
4 (6.9) |
7 (19.4) |
| Fibrinogen |
| − |
51 (54.3) |
44 (75.9) |
7 (19.4) |
| + |
10 (10.6) |
2 (3.4) |
8 (22.2) |
| ++ |
20 (21.3) |
7 (12.1) |
13 (36.1) |
| +++ |
13 (13.8) |
5 (8.6) |
8 (22.2) |
|
Table III.
Pathological characteristics of 58 patients with IgA nephropathy with high (n=29) and low (n=29) uromodulin expression according to the Oxford classification.
|
Table III.
Pathological characteristics of 58 patients with IgA nephropathy with high (n=29) and low (n=29) uromodulin expression according to the Oxford classification.
| |
|
Uromodulin expression, n (%) |
|
| |
|
|
|
| Characteristics |
N |
High |
Low |
P-value |
| Mesangial hypercellularity |
| M0 |
34 |
18 (52.9) |
16 (47.1) |
0.7901 |
| M1 |
24 |
11 (45.8) |
13 (54.2) |
|
| Endocapillary hypercellularity |
| E0 |
26 |
15 (57.7) |
11 (42.3) |
0.4287 |
| E1 |
32 |
14 (43.8) |
18 (56.2) |
|
| Segmental glomerulosclerosis |
| S0 |
8 |
3 (37.5) |
5 (62.5) |
0.7057 |
| S1 |
50 |
26 (52.0) |
24 (48.0) |
|
| Tubular atrophy/interstitial fibrosis |
| T0 |
33 |
21 (63.6) |
12 (36.4) |
0.0219 |
| T1 |
21 |
8 (38.1) |
13 (61.9) |
|
| T2 |
4 |
0 (0.0) |
4 (100.0) |
|
|
Table IV.
Pathological characteristics of 36 patients with lupus nephritis with high (n=18) and low (n=18) uromodulin expression.
|
Table IV.
Pathological characteristics of 36 patients with lupus nephritis with high (n=18) and low (n=18) uromodulin expression.
| |
|
Uromodulin expression, n (%) |
|
| |
|
|
|
| Characteristics |
N |
High |
Low |
P-value |
| Histological classification |
| II+III |
7 |
6 (85.7) |
1 (14.3) |
0.0877 |
| IV+V |
29 |
12 (41.4) |
17 (58.6) |
|
| Activity index |
| <10 |
23 |
15 (65.2) |
8 (34.8) |
0.0354 |
| ≥10 |
13 |
3 (23.1) |
10 (76.9) |
|
| Chronicity index |
| <3 |
24 |
14 (58.3) |
10 (41.6) |
0.2890 |
| ≥3 |
12 |
4 (33.3) |
8 (66.7) |
|
Levels of plasma UMOD and complement components in healthy controls, patients with IgAN and patients with LN
To investigate the potential association between UMOD and complement components, the levels of plasma UMOD, C3a, MAC, C1q, C3 and C4 in patients with IgAN or LN and healthy controls were analyzed in plasma samples using ELISA. It was revealed that the plasma UMOD concentration was significantly decreased in patients with IgAN or LN compared with in healthy controls (P<0.0001; Fig. 1A). The plasma levels of C3a and MAC in the three groups are shown in Fig. 1B and C. Compared with in the control group, C3a and MAC levels were significantly higher in the IgAN and LN groups (P<0.05; Fig. 1B and C). Furthermore, the levels of C1q, C3 and C4 in plasma were significantly decreased in the LN group compared with in the control groups (P<0.05 and P<0.0001, respectively; Fig. 1D-F). However, there was no significant difference in the plasma levels of C1q, C3 and C4 between the IgAN and healthy control groups (P>0.05; Fig. 1D-F).
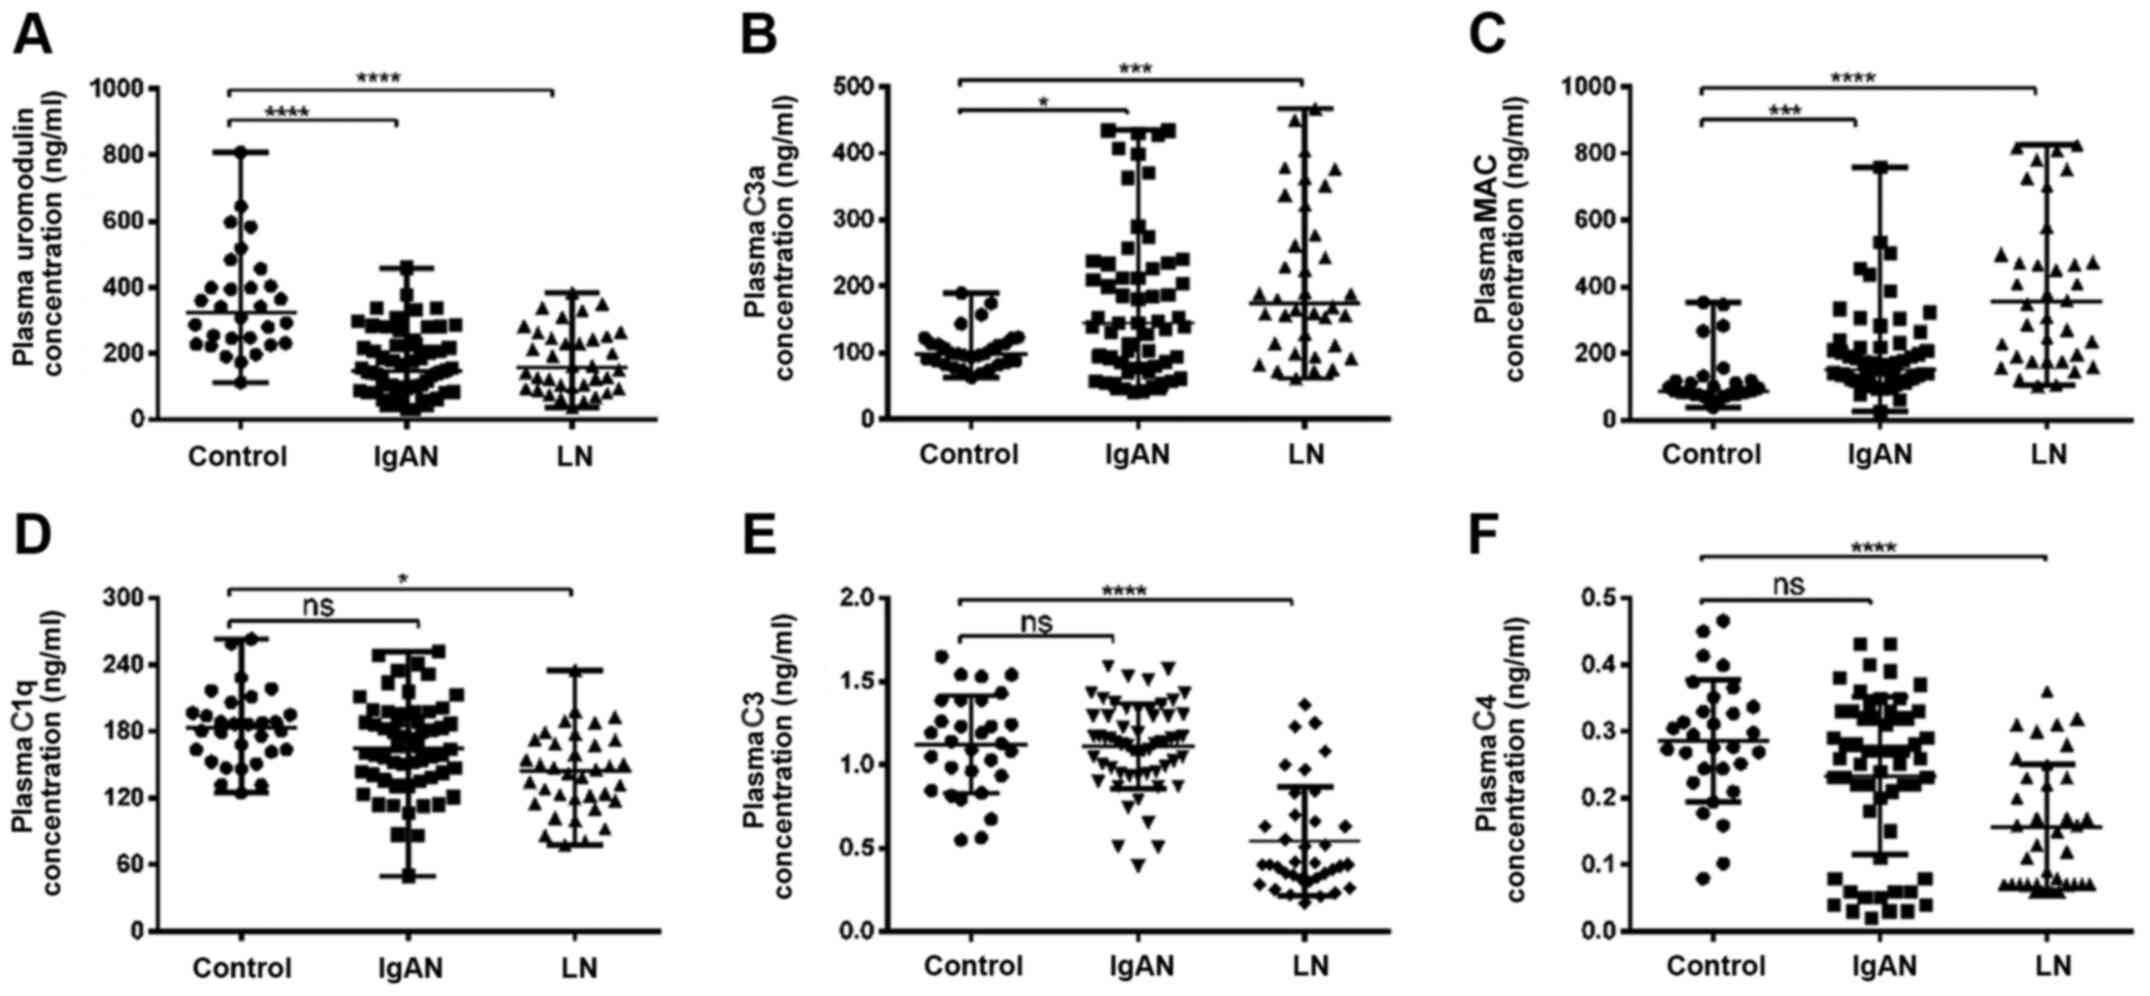 |
Figure 1.
Plasma levels of uromodulin and complement components in healthy controls, patients with IgAN and patients with LN. Plasma levels of (A) uromodulin, (B) C3a, (C) MAC, (D) C1q, (E) C3 and (F) C4 in healthy control (n=30), IgAN (n=58) and LN (n=36) groups were analyzed using ELISA. Data are presented as the median and interquartile range. *P<0.05, **P<0.01, ***P<0.001 and ****P<0.0001. ns, not significant; MAC, membrane attack complex; LN, lupus nephritis; IgAN, IgA nephropathy.
|
Correlation between UMOD levels and complement components
To further assess whether the levels of plasma UMOD were correlated with complement components, the Spearman correlation coefficients of all patients were calculated. The results indicated that the plasma levels of UMOD were significantly negatively correlated with the plasma concentration of C3a and MAC (r=−0.410 and P<0.001; r=−0.301 and P=0.003, respectively; Fig. 2A and B).
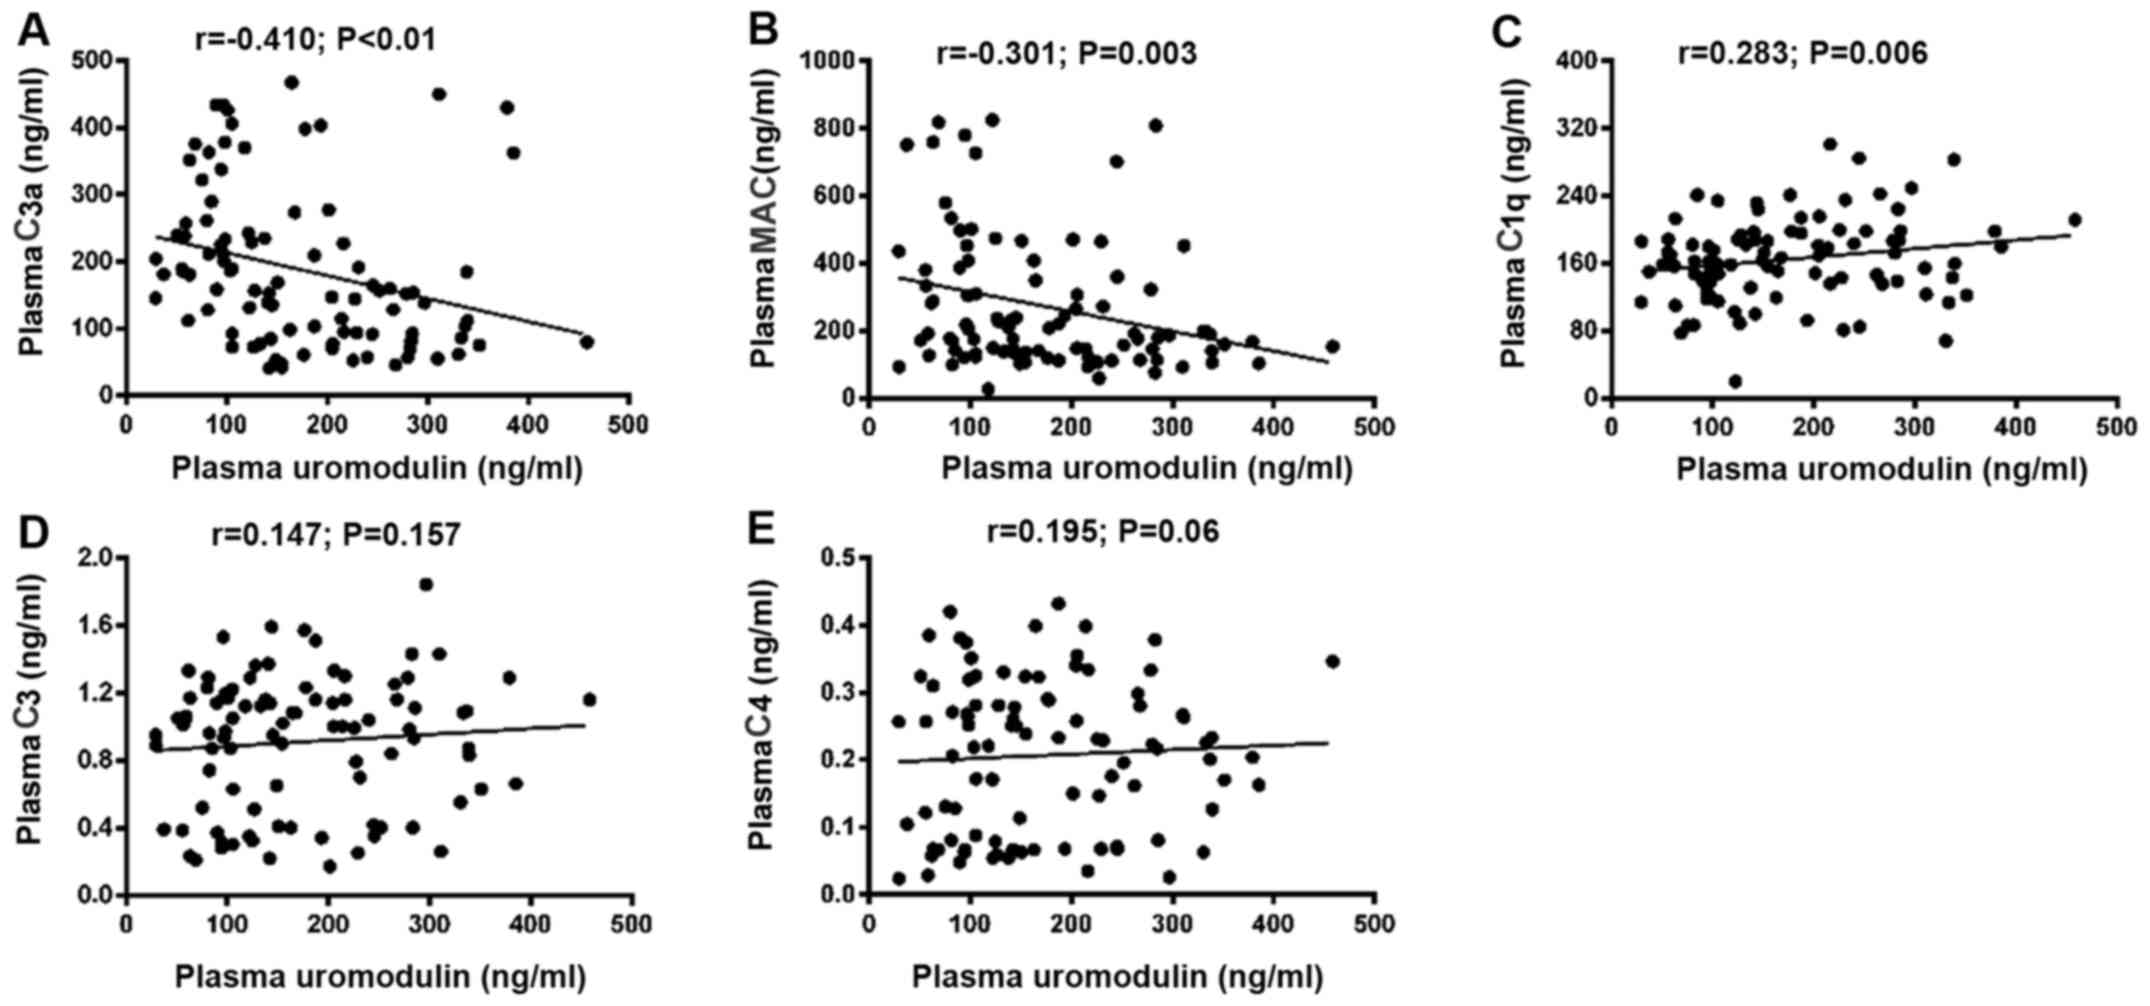 |
Figure 2.
Correlation between plasma uromodulin and complement components. Correlation between plasma uromodulin and plasma (A) C3a, (B) MAC, (C) C1q, (D) C3 and (E) C4. MAC, membrane attack complex.
|
Subsequently, the correlation of plasma levels of C1q, C3 and C4 with plasma UMOD was investigated in all patients. It was demonstrated that the plasma levels of UMOD were significantly positively correlated with the plasma concentration of C1q (r=0.283; P=0.006; Fig. 2C), However, plasma UMOD levels were not significantly correlated with C3 (r=0.147; P=0.157; Fig. 2D) and C4 (r=0.195; P=0.06; Fig. 2E). In addition, the simulated H/R model was used to assess these correlation coefficients in mIMCD3 cells. Compared with the control group, the protein expression levels of complement C1qA decreased at 1 h after H/R and began to increase at 6 h after H/R, but no significant change was observed a12 h after H/R compared with 6 h after H/R (Fig. 3A). On the other hand, the protein expression levels of UMOD started to increase at 1 h after H/R treatment, and continued to increase at 6 and 12 h after H/R (Fig. 3A and B). In addition, the expression levels of the complement activation product C3d on the surface of the cell membrane was measured via immunofluorescence staining, revealing that C3d expression was increased at 1 h and began to decrease at 6 h after H/R (Fig. 3C). No significant change was observed at 12 h compared with 6 h post H/R (data not shown).
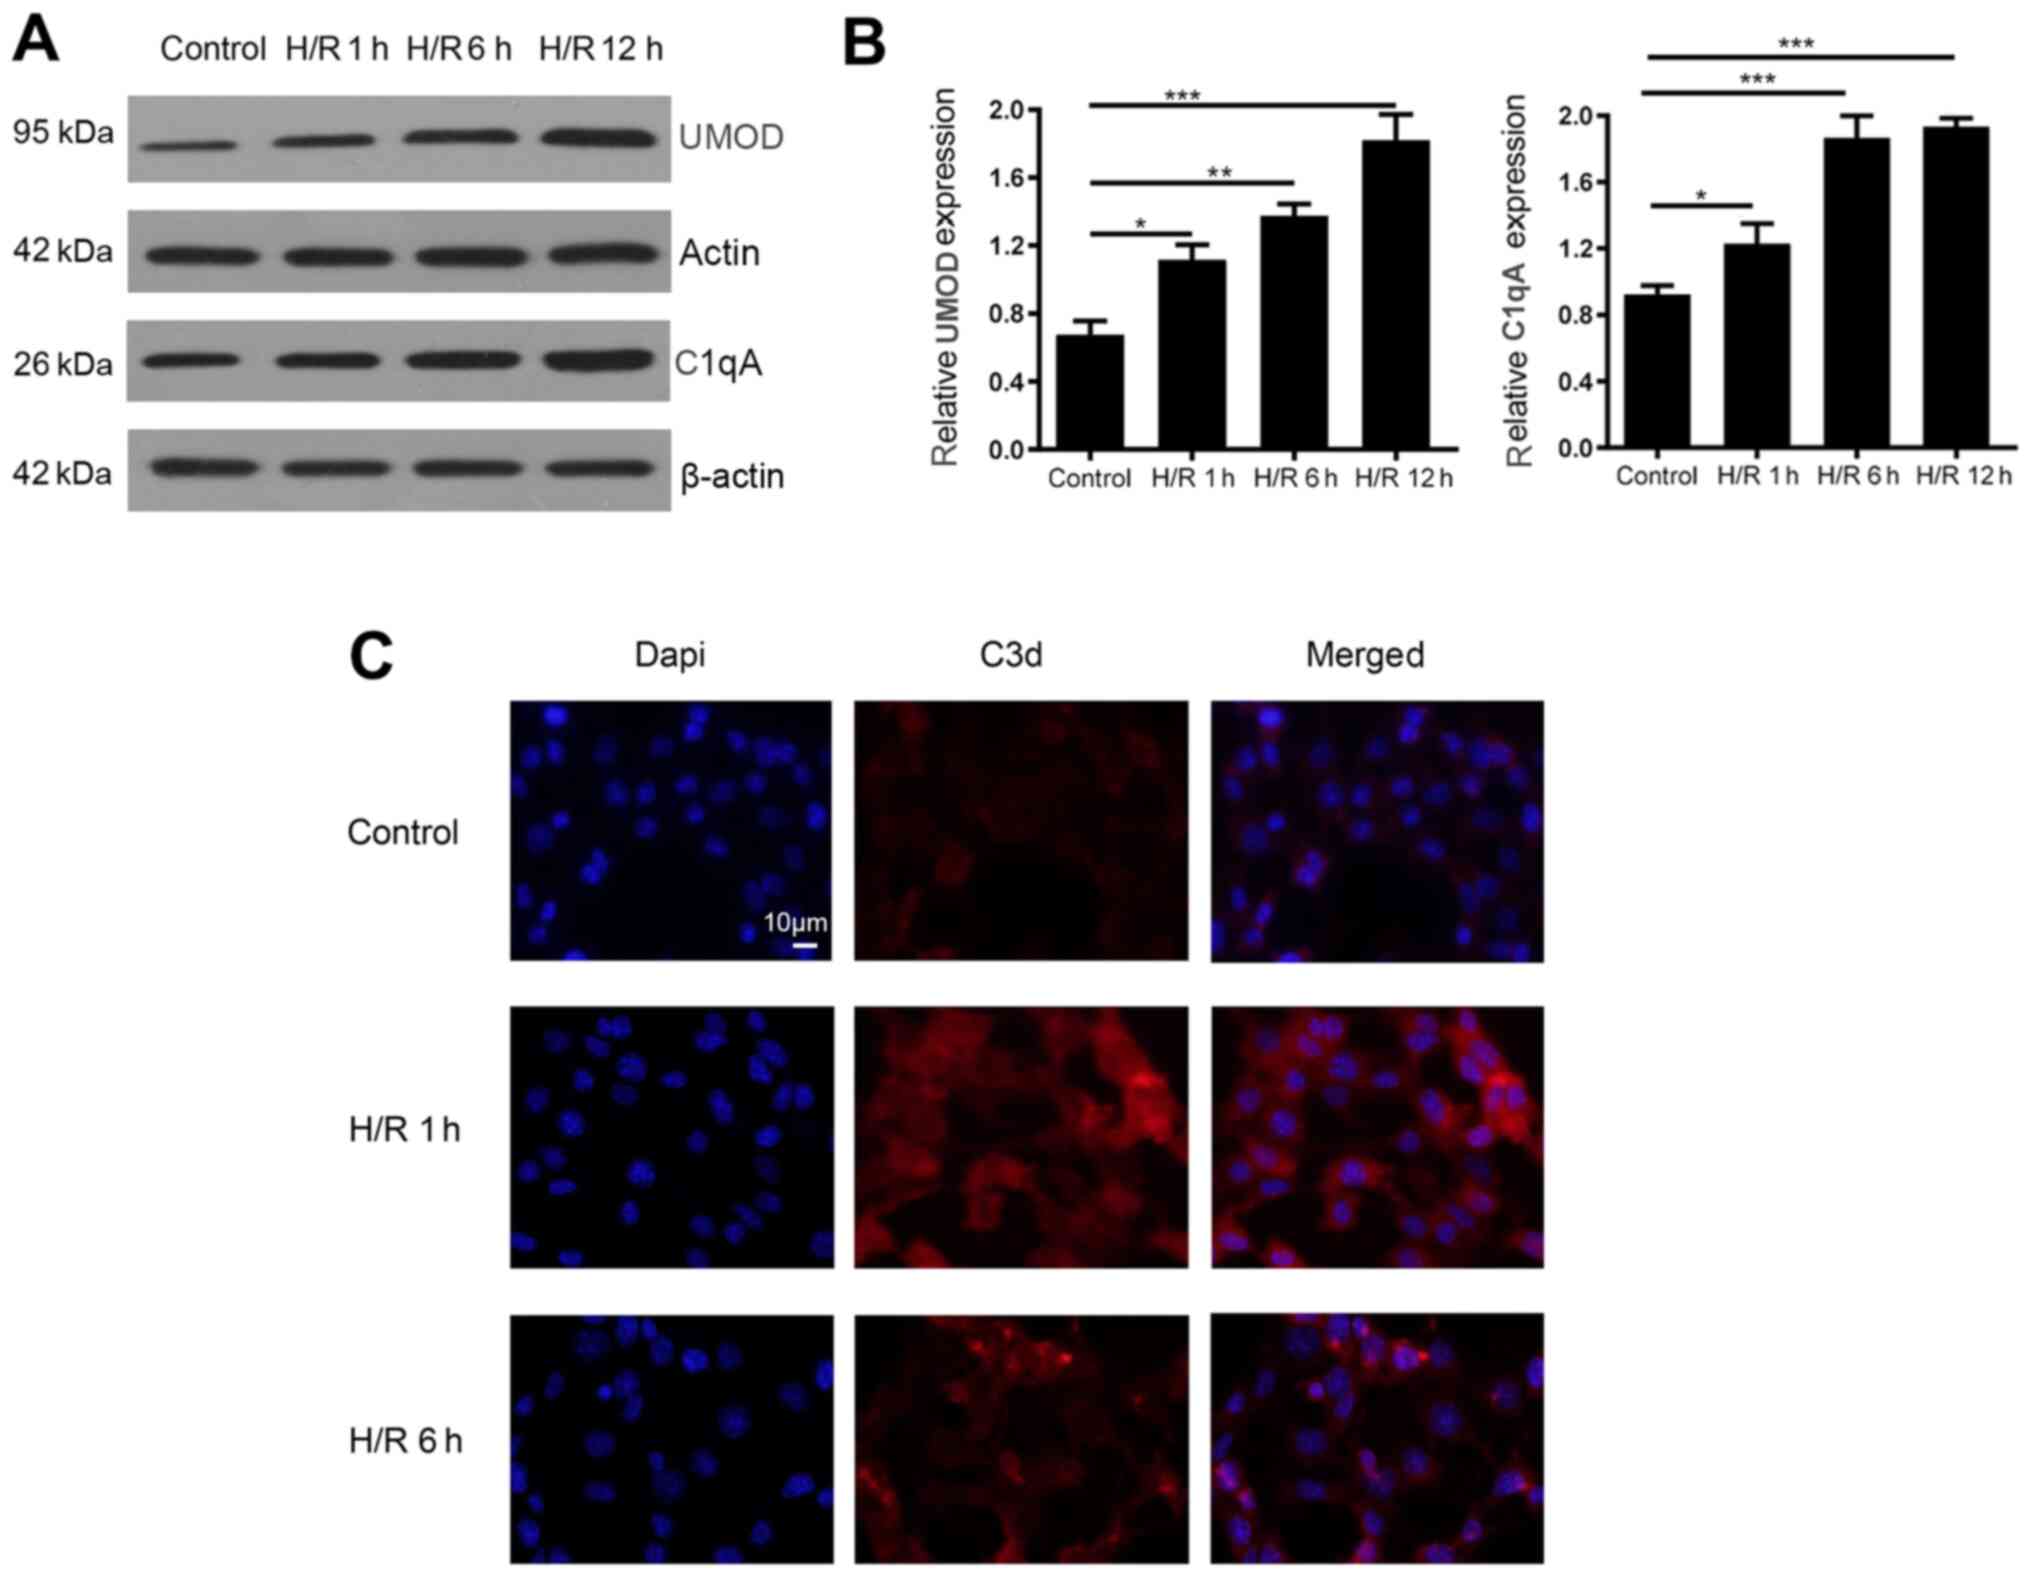 |
Figure 3.
H/R model stimulation of UMOD expression and its effect on complement C1qA and C3d expression in mouse inner medullary collecting duct cells. (A) Protein expression levels of complement C1qA and UMOD at different times after H/R exposure. (B) Relative signal intensity of UMOD protein expression was normalized to β-actin and quantified using ImageJ software. Data are presented as the mean ± SD from three individual experiments. (C) Expression of complement activation product C3d on the cell surface was detected using immunofluorescence. Magnification, ×200. *P<0.05; **P<0.01; ***P<0.001. H/R, hypoxia-reoxygenation; UMOD, uromodulin.
|
Association between plasma UMOD levels and clinicopathological variables
To determine whether plasma UMOD expression was associated with clinicopathological parameters, kidney function parameters and histopathological stage were analyzed in all patients. As shown in Fig. 4A-D, plasma UMOD concentration was closely correlated with the following kidney function biomarkers: eGFR (r=0.255; P=0.013; Fig. 4A), creatinine (r=−0.307; P=0.003; Fig. 4B), BUN (r=−0.359; P<0.001; Fig. 4C) and cystatin C (r=−0.294; P=0.004; Fig. 4D). Based on the median expression levels of plasma UMOD in the IgAN groups, patients were classified into two subgroups: Low and high expression group. In patients with IgAN, the plasma levels of UMOD were significantly associated with tubular atrophy and interstitial fibrosis (P=0.0219; Table III). In addition, it was revealed that in patients with LN plasma UMOD expression was significantly associated with AI (P=0.0354; Table IV). No other clinicopathological feature was identified to be associated with plasma UMOD expression.
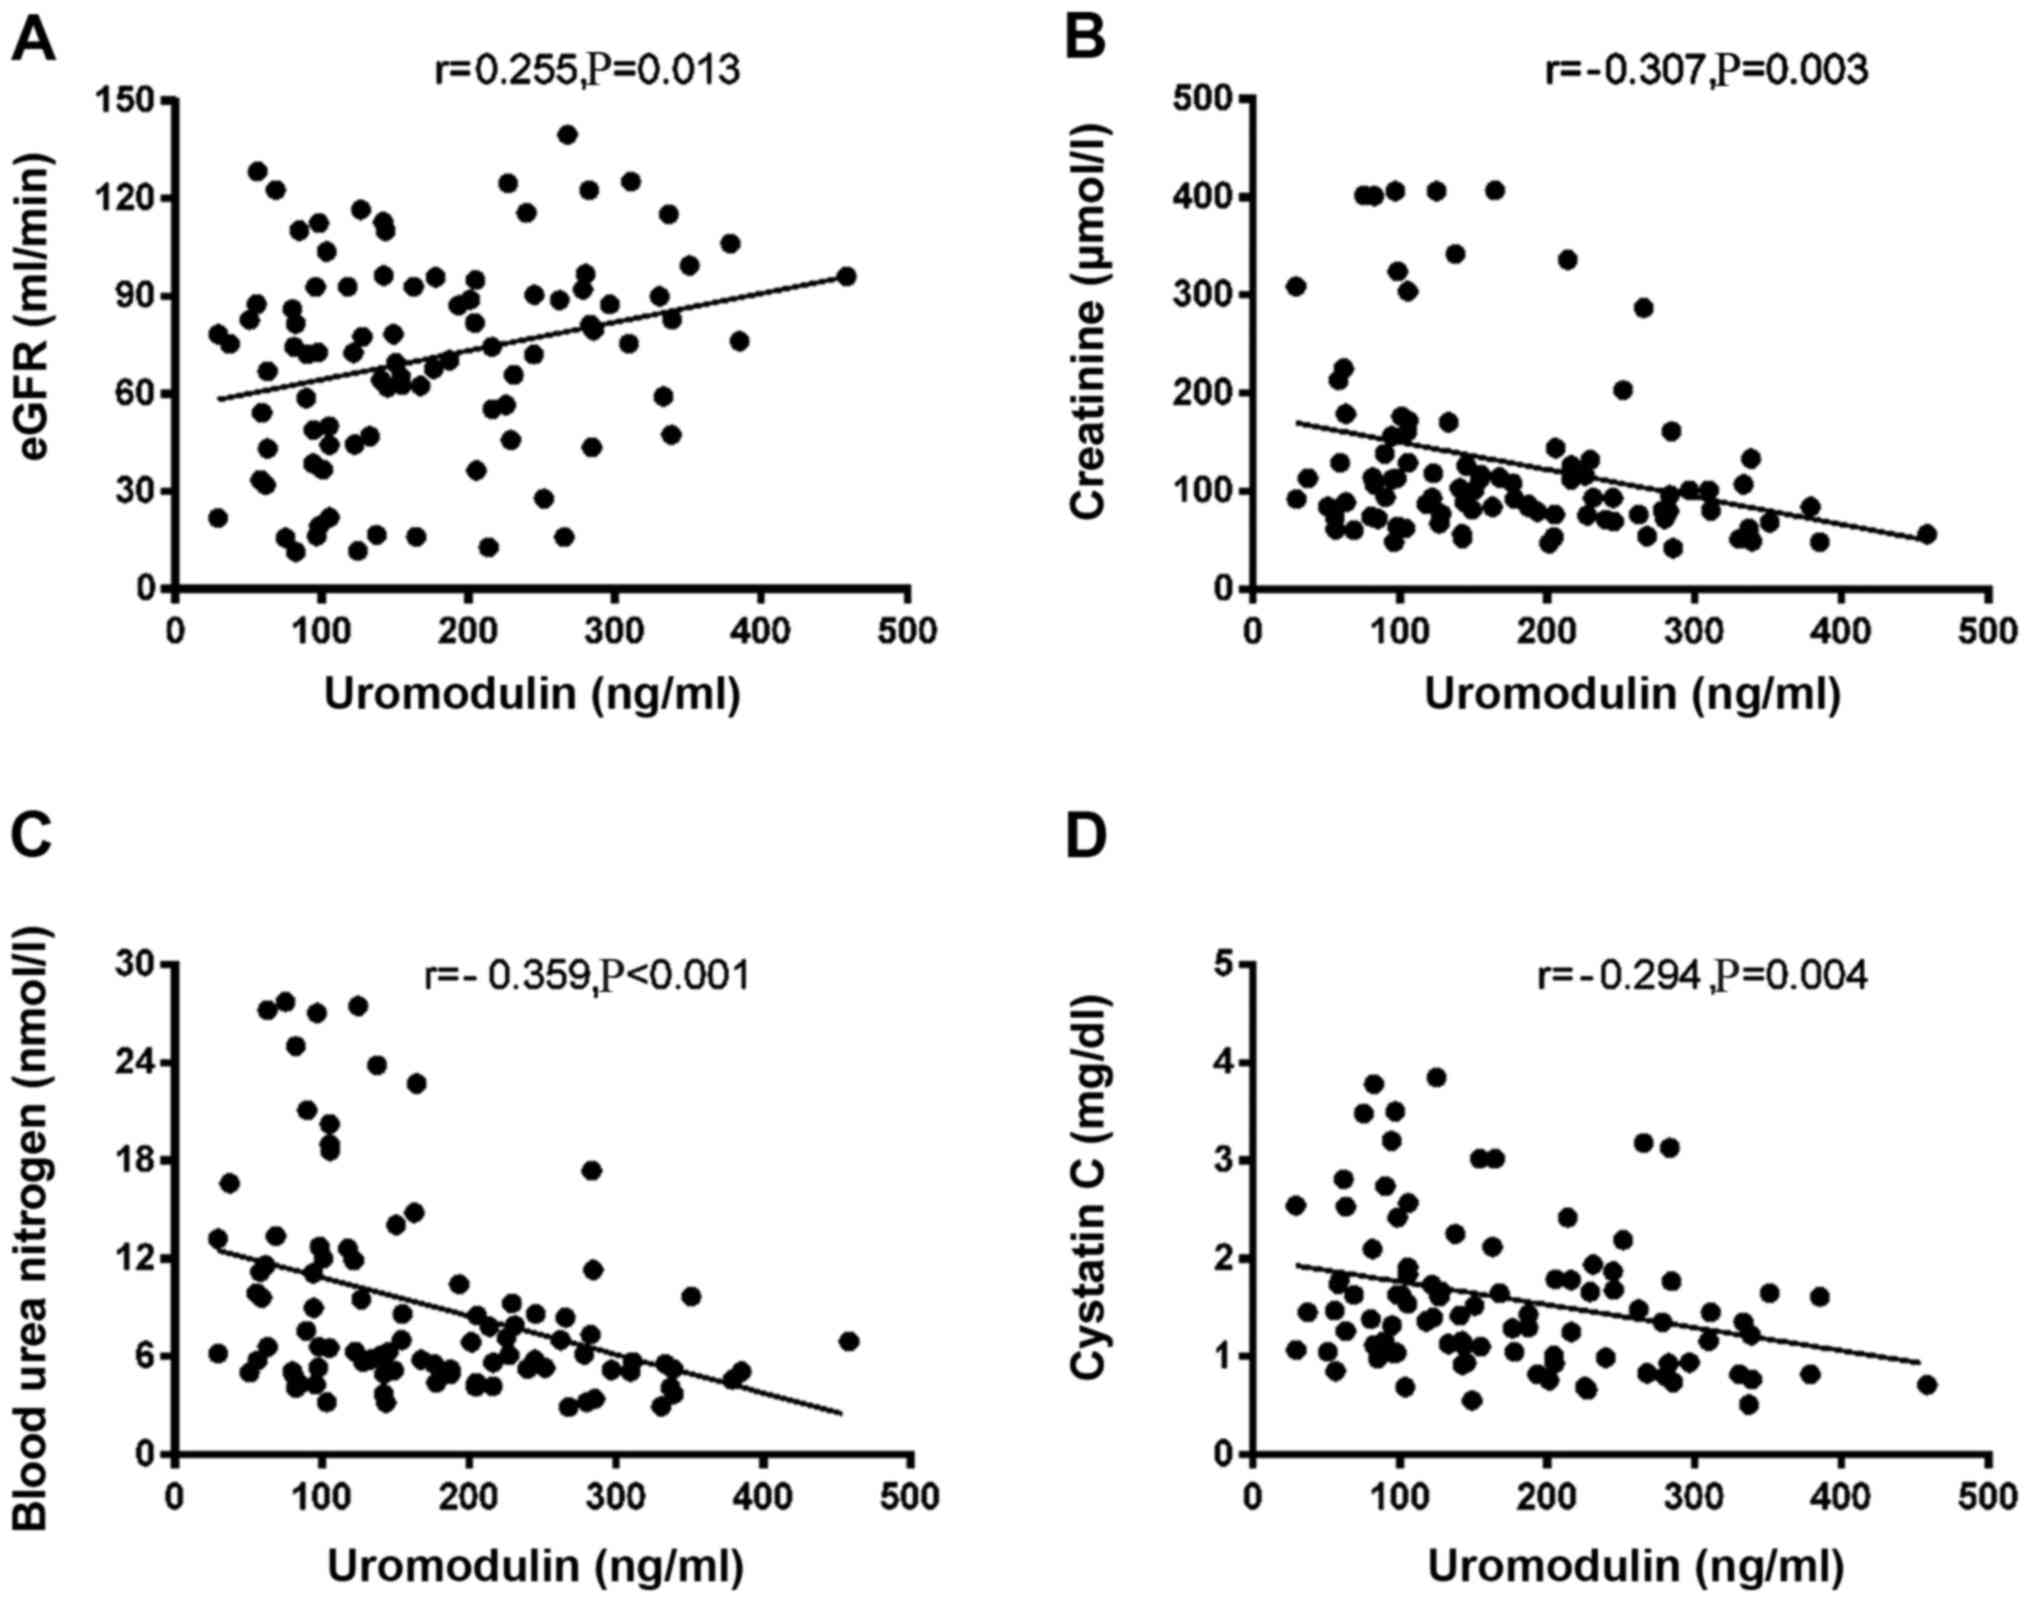 |
Figure 4.
Correlation between plasma uromodulin and kidney function parameters. Correlation between plasma uromodulin and (A) eGFR, (B) serum creatinine, (C) blood urea nitrogen and (D) serum cystatin C. eGFR, estimated glomerular filtration rate.
|
Discussion
In present study, it was demonstrated that UMOD was negatively and significantly correlated with complement activation product C3a and MAC in patients with IgAN and LN. Moreover, UMOD was positively correlated with complement components C1q in the IgAN group. This correlation was further assessed using a simulated H/R model in vitro.
Previous studies have reported that UMOD expression is closely associated with kidney diseases (3–9). It has been demonstrated that UMOD gene mutations result in familial juvenile hyperuricemic nephropathy, medullary cystic kidney disease type 2 and glomerulocystic kidney disease (8). Furthermore, UMOD-deficient mice are more susceptible to nephrolithiasis (9). Serum UMOD is a promising potential biomarker in the progression of renal disease (29). Mechanistically, the role of UMOD is associated with renal ion channel activity (9,30), urinary tract infections (31) and urinary cast formation (32). UMOD−/− mice exhibit a decrease in renal outer medullary potassium channel (ROMK) immunoreactivity in the plasma membrane-enriched fractions and an increase of ROMK accumulation in intracellular vesicular compartments compared with wild-type mice (33,34). Moreover, in a previous study, >100 µg/ml UMOD predominantly prevented the adherence of Escherichia coli to transitional cells (35,36). Additionally, UMOD is involved in the gel and potential cast formation in acute tubular necrosis partially via oligosaccharide residues (37). Consistent with previous studies (10–12), the present study identified the potential association between UMOD and kidney diseases, and revealed that plasma UMOD levels were decreased in patients with IgAN and LN. This may be associated with interstitial fibrosis, renal tubular atrophy and decreased EGFR, which is consistent with previous reports on the decrease of urinary UMOD levels in patients with IgAN (10–12).
Complement is an important component of the immune system, and complement components are produced by kidney parenchymal tissues, as well as the liver. Moreover, the complement system is involved in various renal disease, such as LN (38), IgAN (39) and diabetic nephropathy (40). Individuals with homozygous hereditary deficiency of the classical pathway components, such as C1q, C1r, C1s, C4 and C2, are more susceptible to systemic lupus erythematosus (41). In addition, complement activation promotes the pathogenesis of IgAN via alternative and lectin pathways, and likely occurs systemically on IgA-containing circulating immune complexes, as well as locally in glomeruli (42). A clinical study has reported that the C1q, mannose-binding lectin, Bb, C4d, C3a, C5a and sC5b-9 levels in the plasma of patients with diabetic nephropathy are significantly higher than in the plasma of patients with diabetes without renal disease (43). Mechanically, activation of the lectin and alternative pathways of the three possible complement pathways is associated with renal damage (21). In accordance with the aforementioned findings, the present results indicated that C3a and MAC levels were increased in the plasma of patients with IgAN and LN.
UMOD is considered to be a component of the innate immune system (42,43), and it has been revealed that UMOD binds with immune proteins, such as IgG28, complement factors, such as C1q (34,35), cytokines and TNFα (36). In addition, our previous study has reported that UMOD significantly enhances the function of complement H factor cleavage of C3b and inhibits complement activation (44). Collectively, the aforementioned findings suggest that UMOD is closely associated with complement activation. However, the association between UMOD and complement components remains unknown. In the present study, it was identified that UMOD participated in the progression of kidney disease, which was partially dependent on complement activation.
Although the clinical significance of UMOD and complement activation in renal disease has been clarified, there are several limitations to the present study that warrant discussion. Firstly, the number of patients enrolled in the current study was small. Secondly, the underlying mechanism is still unclear. The study confirmed that UMOD was involved in the progression of renal disease, which partly depended on the activation of complement. Whether UMOD promoted the activation of complement by binding to complement factor C1q protein and then promote the progress of IgAN and LN in renal disease, needed further investigated in future studies. In addition, functional studies should be performed to identify the biological mechanisms of UMOD in renal disease.
In conclusion, the present results suggested that low UMOD plasma levels were associated with severe complement activation and may be involved in complement-mediated immune protection by inhibiting complement activation in in renal disease.
Acknowledgements
Not applicable.
Funding
The present study was supported by the National Youth Science Foundation Project (grant no. 81700622).
Availability of data and materials
The datasets used and/or analyzed during the current study are available from the corresponding author on reasonable request.
Authors' contributions
XY designed the study and revised the manuscript. FS and ML performed the experiments. FP and LY analyzed the data. FP provided technical support. LY drafted the manuscript. XY and FP confirm the authenticity of all the raw data. All authors have read and approved the final manuscript.
Ethics approval and consent to participate
The present study was approved by the Ethics Committee of Qi Lu Hospital of Shandong University (Jinan, China; approval no. KYLL-2017-004), and written informed consent was obtained from all patients and healthy controls.
Patient consent for publication
Not applicable.
Competing interests
The authors declare that they have no competing interests.
References
|
1
|
Reindl J, Gröne HJ, Wolf G and Busch M: Uromodulin-related autosomal-dominant tubulointerstitial kidney disease-pathogenetic insights based on a case. Clin Kidney J. 12:172–179. 2018. View Article : Google Scholar : PubMed/NCBI
|
|
2
|
Vikulova OK, Zuraeva ZT, Mikhaleva OV, Nikankina LV, Shamkhalova MS, Shestakova MV and Dedov II: Renal effects of glucagon-like peptide receptor agonists in patients with type 1 diabetes mellitus. Ter Arkh. 90:59–64. 2018.PubMed/NCBI
|
|
3
|
Bennett MR, Pyles O, Ma Q and Devarajan P: Preoperative levels of urinary uromodulin predict acute kidney injury after pediatric cardiopulmonary bypass surgery. Pediatr Nephrol. 33:521–526. 2018. View Article : Google Scholar : PubMed/NCBI
|
|
4
|
Smirnov AV, Khasun M, Kayukov IG, Galkina OV, Sipovski VG, Parastaeva MM and Bogdanova EO: Serum uromodulin as an early biomarker of tubular atrophy and interstitial fibrosis in patients with glomerulopathies. Ter Arkh. 90:41–47. 2018.PubMed/NCBI
|
|
5
|
Devuyst O and Pattaro C: The UMOD Locus: Insights into the pathogenesis and prognosis of kidney disease. J Am Soc Nephrol. 29:713–726. 2018. View Article : Google Scholar : PubMed/NCBI
|
|
6
|
Lhotta K: Uromodulin and chronic kidney disease. Kidney Blood Press Res. 33:393–398. 2010. View Article : Google Scholar : PubMed/NCBI
|
|
7
|
Kuśnierz-Cabala B, Gala-Błądzińska A, Mazur-Laskowska M, Dumnicka P, Sporek M, Matuszyk A, Gil K, Ceranowicz P, Walocha J, Kucharz J, et al: Serum uromodulin levels in prediction of acute kidney injury in the early phase of acute pancreatitis. Molecules. 22:222017. View Article : Google Scholar : PubMed/NCBI
|
|
8
|
Leiherer A, Muendlein A, Saely CH, Brandtner EM, Geiger K, Fraunberger P and Drexel H: The value of uromodulin as a new serum marker to predict decline in renal function. J Hypertens. 36:110–118. 2018. View Article : Google Scholar : PubMed/NCBI
|
|
9
|
Micanovic R, LaFavers K, Garimella PS, Wu XR and El-Achkar TM: Uromodulin (Tamm-Horsfall protein): Guardian of urinary and systemic homeostasis. Nephrol Dial Transplant. 35:33–43. 2020. View Article : Google Scholar : PubMed/NCBI
|
|
10
|
Lv L, Wang J, Gao B, Wu L, Wang F, Cui Z, He K, Zhang L, Chen M and Zhao MH: Serum uromodulin and progression of kidney disease in patients with chronic kidney disease. J Transl Med. 16:3162018. View Article : Google Scholar : PubMed/NCBI
|
|
11
|
Micanovic R, Khan S, Janosevic D, Lee ME, Hato T, Srour EF, Winfree S, Ghosh J, Tong Y, Rice SE, et al: Tamm-horsfall protein regulates mononuclear phagocytes in the kidney. J Am Soc Nephrol. 29:841–856. 2018. View Article : Google Scholar : PubMed/NCBI
|
|
12
|
Skowron B, Baranowska A, Dobrek L, Ciesielczyk K, Kaszuba-Zwoinska J, Wiecek G, Malska-Wozniak A, Strus M and Gil K: Urinary neutrophil gelatinase-associated lipocalin, kidney injury molecule-1, uromodulin, and cystatin C concentrations in an experimental rat model of ascending acute kidney injury induced by pyelonephritis. J Physiol Pharmacol. 69:625–637. 2018.PubMed/NCBI
|
|
13
|
Martín-Gómez MA, Eliecer C, Caba Molina M, González Oller C and García Del Moral R: Familial hyperuricaemic nephropathy: New mutation in uromodulin gen. Nefrol Engl Ed. 39:309–311. 2019.PubMed/NCBI
|
|
14
|
Rhodes DCJ: Human Tamm-Horsfall protein, a renal specific protein, serves as a cofactor in complement 3b degradation. PLoS One. 12:e01818572017. View Article : Google Scholar : PubMed/NCBI
|
|
15
|
Lane BR, Babitz SK, Vlasakova K, Wong A, Noyes SL, Boshoven W, Pam Grady P, Zimmerman C, Engerman S, Gebben M, et al: Evaluation of urinary renal biomarkers for early prediction of acute kidney injury following partial nephrectomy: A feasibility study. Eur Urol Focus. 6:1240–1247. 2020. View Article : Google Scholar : PubMed/NCBI
|
|
16
|
Patidar KR, Garimella PS, Macedo E, Slaven JE, Ghabril MS, Weber RE, Anderson M, Orman ES, Nephew LD, Desai AP, et al: Admission plasma uromodulin and the risk of acute kidney injury in hospitalized patients with cirrhosis: A pilot study. Am J Physiol Gastrointest Liver Physiol. 317:G447–G452. 2019. View Article : Google Scholar : PubMed/NCBI
|
|
17
|
Tosukhowong P, Kulpradit P, Chaiyarit S, Ungjareonwattana W, Kalpongnukul N, Ratchanon S and Thongboonkerd V: Lime powder treatment reduces urinary excretion of total protein and transferrin but increases uromodulin excretion in patients with urolithiasis. Urolithiasis. 46:257–264. 2018. View Article : Google Scholar : PubMed/NCBI
|
|
18
|
Gast C, Marinaki A, Arenas-Hernandez M, Campbell S, Seaby EG, Pengelly RJ, Gale DP, Connor TM, Bunyan DJ, Hodaňová K, et al: Autosomal dominant tubulointerstitial kidney disease-UMOD is the most frequent non polycystic genetic kidney disease. BMC Nephrol. 19:3012018. View Article : Google Scholar : PubMed/NCBI
|
|
19
|
Tokonami N, Olinger E, Debaix H, Houillier P and Devuyst O: The excretion of uromodulin is modulated by the calcium-sensing receptor. Kidney Int. 94:882–886. 2018. View Article : Google Scholar : PubMed/NCBI
|
|
20
|
Bullen AL, Katz R, Lee AK, Anderson CAM, Cheung AK, Garimella PS, Jotwani V, Haley WE, Ishani A, Lash JP, et al: The SPRINT trial suggests that markers of tubule cell function in the urine associate with risk of subsequent acute kidney injury while injury markers elevate after the injury. Kidney Int. 96:470–479. 2019. View Article : Google Scholar : PubMed/NCBI
|
|
21
|
Scherberich JE, Gruber R, Nockher WA, Christensen EI, Schmitt H, Herbst V, Block M, Kaden J and Schlumberger W: Serum uromodulin-a marker of kidney function and renal parenchymal integrity. Nephrol Dial Transplant. 33:284–295. 2018. View Article : Google Scholar : PubMed/NCBI
|
|
22
|
Wiromrat P, Bjornstad P, Roncal C, Pyle L, Johnson RJ, Cherney DZ, Lipina T, Bishop F, Maahs DM and Wadwa RP: Serum uromodulin is associated with urinary albumin excretion in adolescents with type 1 diabetes. J Diabetes Complications. 33:648–650. 2019. View Article : Google Scholar : PubMed/NCBI
|
|
23
|
Schiano G, Glaudemans B, Olinger E, Goelz N, Müller M, Loffing-Cueni D, Deschenes G, Loffing J and Devuyst O: The urinary excretion of uromodulin is regulated by the potassium channel ROMK. Sci Rep. 9:195172019. View Article : Google Scholar : PubMed/NCBI
|
|
24
|
Cañadas-Garre M, Anderson K, McGoldrick J, Maxwell AP and McKnight AJ: Proteomic and metabolomic approaches in the search for biomarkers in chronic kidney disease. J Proteomics. 193:93–122. 2019. View Article : Google Scholar : PubMed/NCBI
|
|
25
|
Graham LA, Aman A, Campbell DD, Augley J, Graham D, McBride MW, Fraser NJ, Ferreri NR, Dominiczak AF and Padmanabhan S: Salt stress in the renal tubules is linked to TAL-specific expression of uromodulin and an upregulation of heat shock genes. Physiol Genomics. 50:964–972. 2018. View Article : Google Scholar : PubMed/NCBI
|
|
26
|
Song H, Hu H, Tang F, Cao C, Wan Q and He Y: Initial serum creatinine concentration affects clinical outcomes in patients with IgA nephropathy treated with mycophenolate mofetil combined with low-dose prednisone. Exp Ther Med. 19:3369–3376. 2020.PubMed/NCBI
|
|
27
|
Hwang J, Kim HJ, Oh JM, Ahn JK, Lee YS, Lee J, Kim YG, Huh WS, Seo J, Koh EM, et al: Outcome of reclassification of World Health Organization (WHO) class III under International Society of Nephrology-Renal Pathology Society (ISN-RPS) classification: Retrospective observational study. Rheumatol Int. 32:1877–1884. 2012. View Article : Google Scholar : PubMed/NCBI
|
|
28
|
Chen Y, Harty GJ, Zheng Y, Iyer SR, Sugihara S, Sangaralingham SJ, Ichiki T, Grande JP, Lee HC, Wang X, et al: CRRL269. Circ Res. 124:1462–1472. 2019. View Article : Google Scholar : PubMed/NCBI
|
|
29
|
Bostom A, Steubl D, Garimella PS, Franceschini N, Roberts MB, Pasch A, Ix JH, Tuttle KR, Ivanova A, Shireman T, et al: Serum uromodulin: A biomarker of long-term kidney allograft failure. Am J Nephrol. 47:275–282. 2018. View Article : Google Scholar : PubMed/NCBI
|
|
30
|
Steubl D, Buzkova P, Ix JH, Devarajan P, Bennett MR, Chaves PH, Shlipak MG, Bansal N, Sarnak MJ and Garimella PS: Association of serum and urinary uromodulin and their correlates in older adults-The Cardiovascular Health Study. Nephrology (Carlton). 25:522–526. 2020. View Article : Google Scholar : PubMed/NCBI
|
|
31
|
Nie M, Bal MS, Liu J, Yang Z, Rivera C, Wu XR, Hoenderop JG, Bindels RJ, Marciano DK and Wolf MT: Uromodulin regulates renal magnesium homeostasis through the ion channel transient receptor potential melastatin 6 (TRPM6). J Biol Chem. 293:16488–16502. 2018. View Article : Google Scholar : PubMed/NCBI
|
|
32
|
Tokonami N, Takata T, Beyeler J, Ehrbar I, Yoshifuji A, Christensen EI, Loffing J, Devuyst O and Olinger EG: Uromodulin is expressed in the distal convoluted tubule, where it is critical for regulation of the sodium chloride cotransporter NCC. Kidney Int. 94:701–715. 2018. View Article : Google Scholar : PubMed/NCBI
|
|
33
|
Maydan O, McDade PG, Liu Y, Wu XR, Matsell DG and Eddy AA: Uromodulin deficiency alters tubular injury and interstitial inflammation but not fibrosis in experimental obstructive nephropathy. Physiol Rep. 6:e136542018. View Article : Google Scholar : PubMed/NCBI
|
|
34
|
Yamamoto CM, Murakami T, Oakes ML, Mitsuhashi M, Kelly C, Henry RR and Sharma K: Uromodulin mRNA from urinary extracellular vesicles correlate to kidney function decline in type 2 diabetes mellitus. Am J Nephrol. 47:283–291. 2018. View Article : Google Scholar : PubMed/NCBI
|
|
35
|
Lin Z, Yang J, Liu H, Cai D, An Z, Yu Y and Chen T: A novel uromodulin mutation in autosomal dominant tubulointerstitial kidney disease: A pedigree-based study and literature review. Ren Fail. 40:146–151. 2018. View Article : Google Scholar : PubMed/NCBI
|
|
36
|
Olinger E, Lake J, Sheehan S, Schiano G, Takata T, Tokonami N, Debaix H, Consolato F, Rampoldi L, Korstanje R, et al: Hepsin-mediated processing of uromodulin is crucial for salt-sensitivity and thick ascending limb homeostasis. Sci Rep. 9:122872019. View Article : Google Scholar : PubMed/NCBI
|
|
37
|
Bus P, Chua JS, Klessens CQF, Zandbergen M, Wolterbeek R, van Kooten C, Trouw LA, Bruijn JA and Baelde HJ: Complement activation in patients with diabetic nephropathy. Kidney Int Rep. 3:302–313. 2017. View Article : Google Scholar : PubMed/NCBI
|
|
38
|
Tachibana S, Iyoda M, Suzuki T, Kanazawa N, Iseri K, Wada Y, Matsumoto K and Shibata T: Serum uromodulin is associated with the severity of clinicopathological findings in ANCA-associated glomerulonephritis. PLoS One. 14:e02246902019. View Article : Google Scholar : PubMed/NCBI
|
|
39
|
Sjaarda J, Gerstein HC, Yusuf S, Treleaven D, Walsh M, Mann JF, Hess S and Paré G: Blood HER2 and uromodulin as causal nediators of CKD. J Am Soc Nephrol. 29:1326–1335. 2018. View Article : Google Scholar : PubMed/NCBI
|
|
40
|
Bjornstad P, Wiromrat P, Johnson RJ, Sippl R, Cherney DZ, Wong R, Rewers MJ and Snell-Bergeon JK: Serum uromodulin predicts less coronary artery calcification and diabetic kidney disease over 12 years in adults with type 1 diabetes: The CACTI Study. Diabetes Care. 42:297–302. 2019. View Article : Google Scholar : PubMed/NCBI
|
|
41
|
Wang L, Peng SW and Liu Q: The relationship between interleukin 6 and periodontitis Chinese Journal of Conservative Dentistry. 1:53–56. 2003.(In Chinese).
|
|
42
|
LaFavers KA, Macedo E, Garimella PS, Lima C, Khan S, Myslinski J, McClintick J, Witzmann FA, Winfree S, Phillips CL, et al: Circulating uromodulin inhibits systemic oxidative stress by inactivating the TRPM2 channel. Sci Transl Med. 11:112019. View Article : Google Scholar : PubMed/NCBI
|
|
43
|
Then C, Then H, Lechner A, Huth C, Meisinger C, Heier M, Peters A, Koenig W, Rathmann W, Herder C, et al: Serum uromodulin is inversely associated with the metabolic syndrome in the KORA F4 study. Endocr Connect. 8:1363–1371. 2019. View Article : Google Scholar : PubMed/NCBI
|
|
44
|
Wheeler E and Thomas S: Diagnosis and long-term management of uromodulin kidney disease. Cureus. 11:e42702019.PubMed/NCBI
|


