Introduction
Despite being a highly preventable disease, cervical cancer is currently the fourth most common malignancy in women, accounting for almost 12% of all female cancers worldwide (1). The high public health burden of cervical cancer is further illustrated by the low 5-year survival rate of only 66% (2). Furthermore, if diagnosis is made at a late stage, the mean patient survival time does not surpass 1 year (3). Thus, it is important to develop accurate tests that facilitate early detection and individual risk stratification.
It is estimated that 90% of all cervical cancer cases are squamous cell carcinoma (SCC), which originates at the squamous-columnar junction of the cervix (4,5). The primary cause of almost all neoplastic lesions in the cervix is infection with carcinogenic human papilloma virus (HPV) strains (4–6), the primary transforming capacities of which stem from the E6 and E7 oncogenes (6). When transcribed, these two viral proteins deregulate the cell cycle and impede genomic stability in the host cell by rendering several putative tumor suppressors inactive, including tumor protein 53 (p53) and retinoblastoma (Rb) (6,7). In addition, activation of cyclin-dependent kinase (CDK)-4 and −6 induces replication stress in the cervical epithelium and promotes mitotic entry despite DNA damage (6,8–12). The p16 CDK inhibitor 2A (CDKN2A) protein is a principal cyclin-dependent kinase inhibitor that decelerates the cell cycle and regulates the DNA damage response (8). It accumulates extensively in HPV-transformed epithelium in a futile attempt to restrict CDK-4 and −6 activation (4,8,13). Thus, detection of p16 is widely used for diagnostic purposes as a surrogate marker of HPV-induced cell transformation (14). However, application of p16 protein as a diagnostic biomarker remains somewhat controversial (15–17), warranting the development of additional tests to ensure sufficient accuracy for the pre-symptomatic detection of cancer.
The present study performed an integrative meta-analysis of the transcriptomes from 10 cohorts of patients with SCC, with the aim of identifying novel biomarkers that are associated with malignant transformation of the cervical epithelium, and establish their clinical applicability. As a proof of concept, the present study validated the expression of flap structure-specific endonuclease 1 (FEN1) and poly (U)-specific endoribonuclease (ENDOU), which are among the top 30 differentially expressed genes (DEGs) in the meta transcriptome (18–27). FEN1 is a nuclear enzyme that plays a fundamental role in the DNA replication process and cell proliferation (28). In addition, it plays a central role in the DNA repair machinery responsible for maintaining genomic stability and protecting against tumorigenesis (29,30). FEN1 deregulation is associated with an increased mutation rate, poor differentiation and aggressive phenotype in common malignancies, including breast (31), gallbladder (32), ovarian (33), lung (34,35), prostate (36), esophageal (37), testicular (35), hepatocellular (37), gastric (37) and brain tumors (35,38). ENDOU is a soluble uridylate-specific endoribonuclease that was recently characterized as a potential tumor suppressor (39,40), with established prognostic significance in breast (41), ovarian (42) and head and neck carcinoma (40). To the best of our knowledge, the present study was the first to evaluate the clinical relevance of FEN1 and ENDOU proteins as biomarkers for the diagnosis of cervical carcinoma.
Materials and methods
Ethical considerations
All gene expression profiling was performed on genomic data deposited inthe publicly available dataset repositories, Gene Expression Omnibus (GEO) (https://www.ncbi.nlm.nih.gov/geo), ArrayExpress (https://www.ebi.ac.uk/arrayexpress) and The Cancer Genome Atlas (TCGA)(https://portal.gdc.cancer.gov).
Immunohistochemistry (IHC) staining was performed on commercial tissue arrays, for which the manufacturer collected the tissues after obtaining written consent, and according to the regulations protecting the privacy and security of health information prescribed by The Health Insurance Portability and Accountability Act of 1996 (HIPAA) issued by the Secretary of the U.S. Department of Health and Human Services. As the present study was performed entirely using de-identified material, it is not subjected to the Swedish Ethical Review Act (SFS 2003:460).
Microarray dataset identification and selection
A search using the keywords ‘cervical cancer’ and ‘microarray’ was performed in GEO and ArrayExpress, retrieving 129 and 184 records, respectively. Duplicate records between the two databases were deleted, resulting in 302 records being filtered further by manually reviewing each dataset. The datasets were required to fulfill the following criteria: i) Experiment type: mRNA expression profiling by commercial microarray assays; ii) performed in humans and involve cervical cancer as the main subject and iii) analysis performed in cervical biopsies obtained from at least two cohorts, normal and tumor. A total of 298 records were excluded as they failed to meet the predefined inclusion criteria. Datasets GSE39001 and GSE29570 were excluded as they overlapped with GSE52903, and GSE75132 was excluded as the analysis was performed using cervical swabs and not biopsies. Thus, 10 datasets were included in the meta-analysis (Fig. 1 and Table I). In total, the present study included gene expression profiles from 120 subjects with normal cervix histology and 257 patients with SCC.
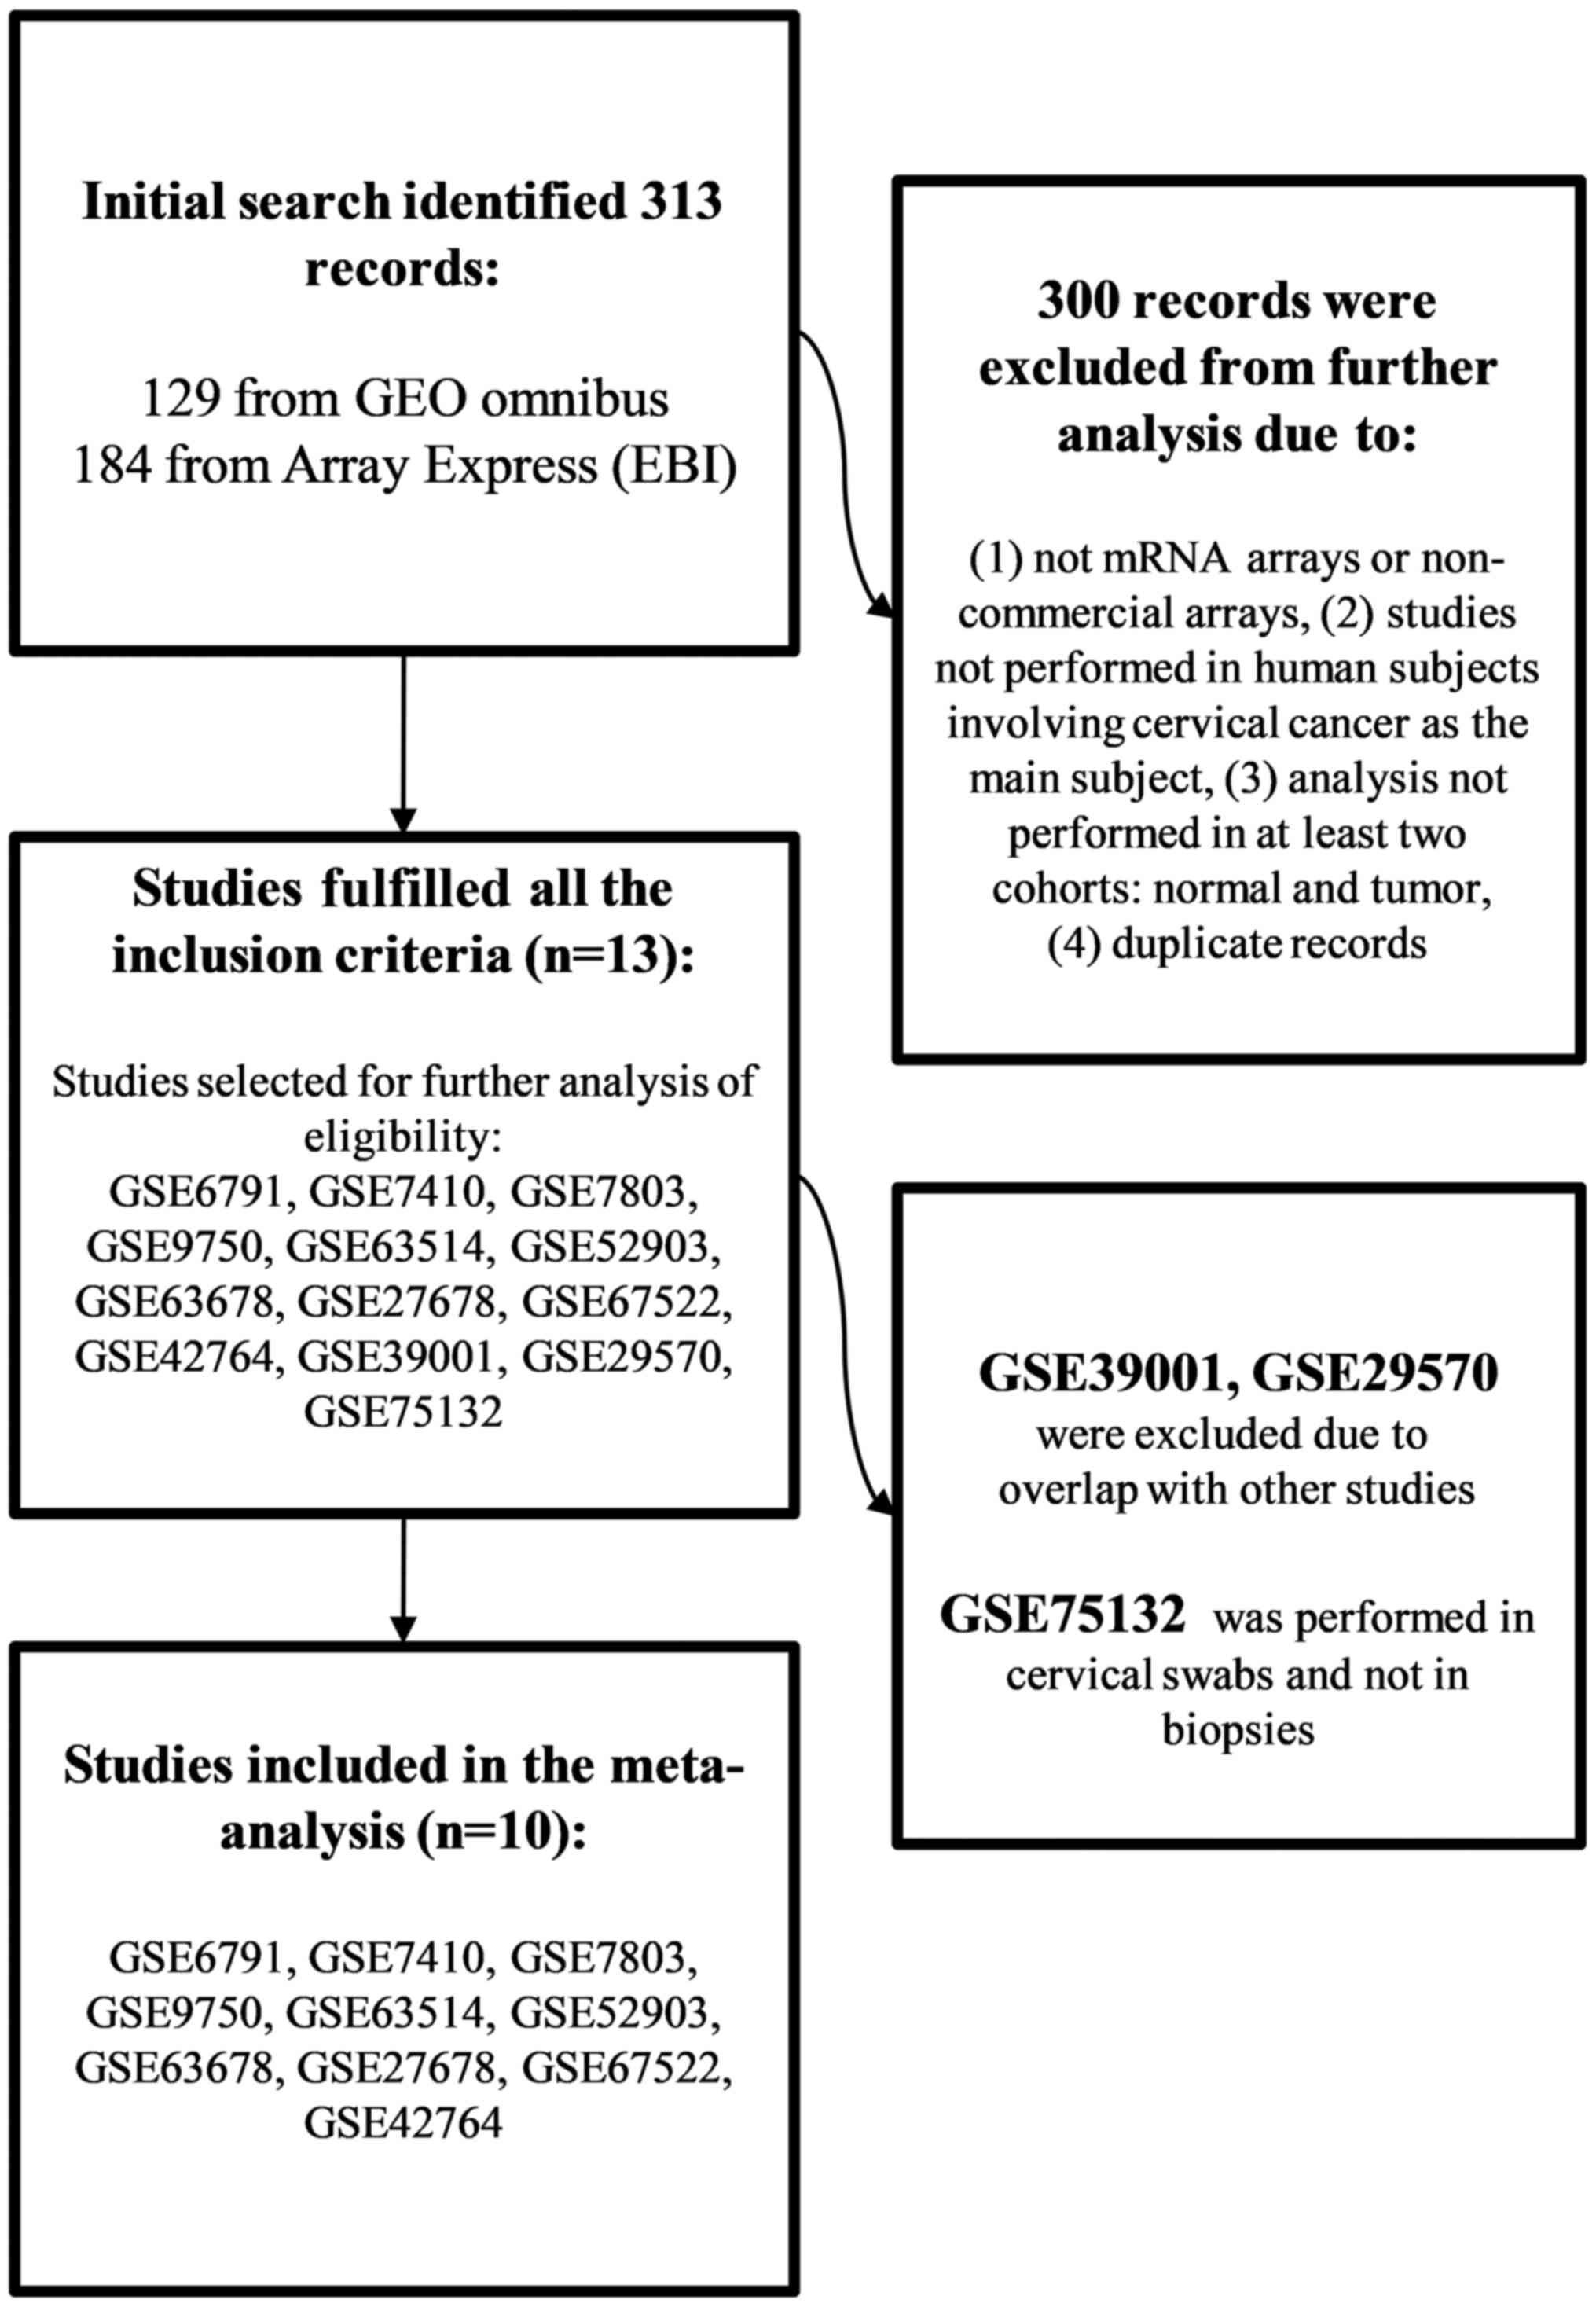 |
Figure 1.
Flow chart of the dataset selection process.
|
 |
Table I.
Microarray datasets included in the meta-analysis.
|
Table I.
Microarray datasets included in the meta-analysis.
| Dataset |
First author, year (Ref.) |
Platform |
Normal (n=120) |
SCC (n=257) |
| GSE6791 |
Pyeon et al, 2007 (20) |
Affymetrix U133 Plus 2.0 |
8 |
20 |
| GSE63514 |
den Boon et al 2015 (24) |
Affymetrix U133 Plus 2.0 |
24 |
28 |
| GSE27678 |
Winder et al, 2011 (23) |
Affymetrix U133A/U133 Plus 2.0 |
3 |
28 |
| GSE9750 |
Scotto et al, 2008 (19) |
Affymetrix U133A |
24 |
33 |
| GSE7803 |
Zhai et al, 2007 (18) |
Affymetrix U133A |
10 |
21 |
| GSE52903 |
Medina-Martinez et al, 2015 (25) |
Affymetrix HuGene 1.0 ST |
17 |
55 |
| GSE63678 |
Pappa et al, 2015 (21) |
Affymetrix U133 Plus 2.0 |
5 |
5 |
| GSE42764 |
Harding et al, 2014 (22) |
Affymetrix U133 Plus 2.0 |
2 |
12 |
| GSE7410 |
Biewenga et al, 2008 (26) |
Agilent-012391 Whole Human Genome Oligo Microarray G4112A |
5 |
35 |
| GSE67522 |
Sharma et al, 2015 (27) |
Illumina HumanHT-12 V4.0 |
22 |
20 |
Microarray data pre-processing and identification of DEGs
Raw intensity files from select gene expression profiling studies were downloaded from the GEO (https://www.ncbi.nlm.nih.gov/geo) or ArrayExpress EML-EBI (https://www.ebi.ac.uk/arrayexpress) public dataset repositories and loaded into the R/Bioconductor platform version 4.0.2 (R Foundation for Statistical Computing) for further analysis (43). Pre-processing and normalization of datasets obtained using standard 3′ probe based Affymetrix arrays (Affymetrix, Inc.) including GSE7803 (18), GSE9750 (19), GSE6791 (20), GSE63678 (21), GSE42764 (22), GSE27678 (23) and GSE63514 (24) was performed with the robust multi-array average (RMA) method and Affy package version 1.70.0 (R Foundation for Statistical Computing), as previously described (44). GSE52903 dataset (25) obtained using Affymetrix Whole-Transcript Human Gene 1.0 ST array was processed using the RMA method and the Oligo ST package version 1.56.0 (R Foundation for Statistical Computing), as previously reported (45). Lumi package (46) version 2.44.0 (R Foundation for Statistical Computing) was used to preprocess the GSE67522 dataset (27) obtained using HumanHT-12 v4.0 Expression BeadChip (Illumina, Inc.) GSE7410 dataset (26) created by the Agilent-012391 Whole Human Genome Oligo Microarray (Agilent Technologies, Inc.) was preprocessed using quantile normalization and the Linear Models for Microarray Data (LIMMA) package version 3.44.3 (47). DEGs were identified using LIMMA package version 3.44.3, as described by Smyth (47). Benjamini-Hochberg method was used to control the false discovery rate (FDR). Adjusted P<0.05 was used to determine significance.
Meta-analysis of selected mRNA profile studies
A meta-analysis of select mRNA expression profile studies was performed using a dual approach. In the first step, lists of DEGs obtained in the LIMMA analysis were loaded into the MetaVolcanoR package version 1.6.0 (R Foundation for Statistical Computing), which is designed to identify genes with consistently perturbed expression across several studies (48). Meta-analysis with the MetaVolcanoR package uses a random effect model to calculate the summary fold-change over investigated studies using a summary p-value that represents the probability that the summary fold-change is not different than zero (48). The metathr parameter was set to 0.01 to highlight the top 1% of the most consistently perturbed genes across all studies (49). Only genes consistently perturbed in at least eight studies were included in the subsequent analysis. Perturbation rankings were defined following the rank results of combined effect sizes, while maintaining the FDR and false coverage-statement rate control (Topconfects) approach (48,50). The threshold for the combined log2 fold change (effect size) was arbitrary and set to ≥±1.5. The meta-analysis results obtained by MetaVolcanoR were further validated using NetworkAnalyst 3.0, a visual analytics platform for comprehensive gene expression profiling and meta-analysis (51). Robust correction for batch effects between different microarray platforms was performed using the COMBAT algorithm (51,52). Database for Annotation, Visualization, and Integrated Discovery online software (https://david.ncifcrf.gov) was used to convert the probe IDs to Entrez IDs for unsupported probe platforms (53), whereas variance stabilizing normalization followed by quintile normalization and LIMMA was performed prior to the meta-analysis (47). After plotting the results of a Cochrane Q test, the most stringent method of performing meta-analysis (54), a random effects model estimating effect sizes (summary log2 fold changes) was chosen and the metathr parameter was set to 0.01 to highlight the top 1% of the most consistently perturbed genes across all studies (55). The threshold for the combined log2 fold change (effect size) was arbitrary and set to ≥±1.5, with a level of significance of FDR<0.01.
Pathway enrichment, Gene Ontology (GO), disease ontology and protein-protein interaction (PPI) analysis
Functional enrichment in Kyoto Encyclopedia of Genes and Genomes (KEGG) pathways, GO and disease ontology analyses were performed using clusterProfiler version 4.0.5 (R Foundation for Statistical Computing), Disease Ontology Semantic and Enrichment analysis (DOSE) version 3.18.2 (R Foundation for Statistical Computing) and Visualization of Functional Enrichment Result (Enrichplot) version 1.12.2 (R Foundation for Statistical Computing) packages for Bioconductor (56,57). FDR was set to <0.05. The PPI network of the deregulated genes was derived from the Search Tool for the Retrieval of Interacting Genes/Proteins database version 11.0 (58). In the PPI networks, known interactions from curated databases and experiments were presented, along with predicted interactions (maximum required interaction score = 0.900; FDR<0.05). Gene interaction analysis for inferring function was performed using the GeneAnswers package version 2.34.0 (R Foundation for Statistical Computing), as previously described (59).
Gene set enrichment analysis (GSEA)
GSEA was performed using GSEA software version 4.1.0 (60), obtained from the Broad Institute (University of San Diego and Broad Institute) (http://www.broadinstitute.org/gsea/downloads.jsp). Expression data sets (.GCT format), phenotype labels (.CLS format) and annotations (.CHIP format) were created according to GSEA specifications. The present study computed overlaps with the H (hallmark gene sets), C2 (curated gene sets) and C5 (GO gene sets) collections. To avoid the potential problem of a small sample size, gene set permutations were performed 1,000 times for each analysis, using the weighted enrichment statistic and signal to noise metric. Gene sets that met the FDR<25% criterion were considered significant. When necessary, enrichment maps were plotted to visualize the GSEA results and overcome gene set redundancy (60). The gene set variation analysis (GSVA) package version 1.40.1 (R Foundation for Statistical Computing)was used to obtain a GSVA score from gene expression data for the ‘HALLMARK_G2M_checkpoint’ gene set of the Molecular Signatures Database Hallmark geneset collection (61). Within each cohort, tumor samples were categorized into high and low G2M activity score groups, using the median GSVA score as the cut-off point.
Validation of the metatranscriptome in the independent cohorts of patients with SCC
For independent validation of the metatranscriptome, the present study used comprehensive genomic data from TCGA SCC and Endocervical Adenocarcinoma (TCGA-CESC) project and TCGAbiolinks package version 2.20.0 (R Foundation for Statistical Computing), as previously described (62,63). Expression profiles for selected biomarkers were validated using transcriptome and clinicopathological data from a cohort of 304 patients with cervical carcinoma and three healthy individuals. Information regarding HPV infection status and HPV genotype was obtained from the previous report (62). Significance was assessed using the Kruskal-Wallis test, followed by Bonferroni correction in the ggplot2 package version 3.3.5(R Foundation for Statistical Computing), with ggsignif extension (64). A Pearson's correlation matrix between candidate biomarkers and genes of interest in the TCGA-CESC-SCC transcriptome was constructed and visualized using the ggplot2 package (64). The transcriptomic data from TCGA-CESC-SCC were categorized into groups based on high and low expression of FEN1 and ENDOU levels, according to the first and third quartiles. GO and KEGG pathway enrichment analyses in high and low tumor phenotypes was performed using the Enrichplot package version 1.12.2 (R Foundation for Statistical Computing), as previously described (40,57).
Diagnostic accuracy and tumor infiltration analysis
The diagnostic accuracy for each candidate transcript was assessed individually by constructing receiver operating characteristic (ROC) curves and calculating the area under the curve (AUC), using an independent cohort, GSE138080 (65). The cohort was chosen due to the balanced number of subjects in the respective groups. ROC curves were calculated directly in Stats Direct Statistical Software version 3.3.4 demo (StatsDirect Ltd.), using an extended trapezoidal rule and a nonparametric method analogous to the Wilcoxon/Mann-Whitney test. A confidence interval was constructed using DeLong's variance estimate. Univariate survival analysis was performed using survival package version 3.2–13 (R Foundation for Statistical Computing) (66) as follows: The log-rank test was plotted to compare survival curves in two groups divided by the upper 50 percentiles of mRNA expression and lower 50 percentiles of mRNA expression, as previously described (67). A log-rank P<0.05 (Kaplan-Meier) was considered as the threshold for significance. The hazards in two groups were compared by calculating the hazard ratios and confidence intervals according to Altman and De Stavola (68). Pancancer TCGA expression and the correlation analysis of candidate biomarker expression with tumor infiltrating cells was performed using the TIMER database (https://cistrome.shinyapps.io/timer), as previously described (40).
Clinical specimens
Commercially available cervical cancer tissue microarrays (TMAs) and data on the TNM stage, histology grade and HPV16/18 and Ki67IHC scores (Biomax, CR1101-BX) were purchased from BioCat. The array consists of 110 cases/110 cores, including 10 tumor adjacent normal cervix tissues, two endocervical adenocarcinoma cases, two endometrial adenocarcinoma cases, one case of adenosquamous carcinoma and 95 cases of SCC of the cervix.
IHC
Surgically removed cervical samples were preserved in 10% neutral, phosphate buffered formalin for 24 h at the room temperature before they were dehydrated with gradient ethanol, cleared with xylene and embedded in paraffin with the help of a tissue processor (Leica Biosystems). Prior to staining, TMA slides were heated in an oven at 60°C for 2 h. IHC analysis was performed on 5-µm-thick TMA sections that were deparaffinized using EZ prep solution. The deparaffinization step was done for 8 min at 75°C in the Ventana Discovery XT platform (Ventana Medical System, Inc.). Antigen retrieval was performed with Tris-EDTA buffer pH 7.8 (Cell Conditioner #1; Ventana Medical System, Inc.) at 95°C for 44 min followed by blocking of endogenous peroxides and proteins with inhibitor CM (Ventana Medical System, Inc.; cat. no. 760-159) at 37°C for 4 min. IHC staining was performed as a fully automated assay in the BenchMark ULTRA automated slide stainer (Ventana Medical System, Inc.) using rabbit polyclonal antibody against FEN1 (1 ng/ml; Atlas antibodies cat. no. HPA006748; http://www.atlasantibodies.com), ENDOU (2 ng/ml; Atlas antibodies, cat. no. HPA012388; http://www.atlasantibodies.com), p16 (p16 CINtec® Histology kit; Roche Diagnostics GmbH; cat no. 06695256001; http://diagnostics.roche.com) and UltraView DAB IHC Detection kit (cat. no. 760-500; Ventana Medical System, Inc.). The slides were counterstained with hematoxylin at room temperature for 8 min and post counterstained with Bluing Reagent (Ventana Medical System, Inc.) at room temperature for 8 min. The negative controls were obtained by omitting the primary antibody, whereas TMA slides were complemented by an external positive control.
Evaluation of immunostaining
IHC staining for FEN1, ENDOU and p16 was evaluated and manually scored by a senior pathologist using a light microscope (BX45; Olympus) in 3–5 random high-power magnification microscopic fields, taking into account both the mean intensity of the staining (0, no staining; 1, weak intensity; 2, moderate intensity and 3, intense staining) and the mean proportion of stained tumor cells(0, 0% stained; 1, 1–10%; 2, 11–50% and 3, >50%). Obtained results were documented in an EXCEL sheet (Microsoft Inc.) and a comprehensive qualitative and semi-quantitative score was calculated as the sum of the corresponding category values for each tissue core (scores 0–4, negative; score 6, positive and score 9, strongly positive). For FEN1 staining, three cases of SCC were excluded from further analysis due to an absence of invasive carcinoma in the cores.
IHC scores for Ki67 and HPV16/18 staining were also calculated based on staining intensity (0, negative; 1, weak stain; 2, moderate and 3, strong stain) and positive cell count (0 points, ≤5%; 1 point, 6–25%; 2 points, 26–50% and 3 points, >50%). The positive cell score was multiplied by the staining intensity score for 3–5 randomly observed high-power magnification microscopic fields, and their mean value taken as the comprehensive qualitative and semi-quantitative result [0-1, negative (−); 2–3, weak positive (+); 4–6, medium positive (++); >6, strong positive (+++)].
The association between FEN1 expression and the clinicopathological characteristics of patients with SCC was assessed using the χ2 test.
Statistical analysis
Microarray datawere processed and visualized using R version 4.02 and Bioconductor 3.11 statistical software (R Foundation for Statistical Computing) (33). Additional illustrations and statistical analyses were performed using MedCalc version 19.4.1 Demo (MedCalc Software Ltd.) and Stats Direct Statistical Software 3.3.4 Demo (StatsDirect Ltd.).
Results
Metatranscriptome signature of cervical SCC
Pre-processed and normalized raw expression files from 10 individual studies (Fig. 1 and Table I) were analyzed using LIMMA and differential expression results integrated into a single data frame using the MetaVolcanoR package. A summary of the log2 fold changes of DEGs across integrated studies is presentedas a volcano plot in Fig. 2A. Briefly, 157 DEGs were identified (log2 fold change ≥ ±1.5, random FDR<0.01). The results of the meta-analysis using MetaVolcanoR were further validated using NetworkAnalyst 3.0, a meta-analysis platform that removes batch effects between individual studies and platforms using the COMBAT algorithm (51,52) (Fig. 2B). NetworkAnalyst 3.0 identified 246 significant DEGs across the 10 datasets (log2 fold change ≥ ±1.5, random FDR<0.01), and the top 40 DEGs were presented as a heatmap in Fig. 2F. The results obtained from the two methods were intersected to determine genes that were consistently differentially expressed between the two integration methods (Fig. 2C). A total of 42 downregulated and 54 upregulated genes were found to be consistently deregulated across the 10 studies and two integration methods (Fig. 2D). To perform external validation of the metatranscriptome, the present study intersected the expression of 96 DEGs with the gene expression profiles from patients with SCC characterized in TCGA-CESC project. After applying an identical cut-off, 58 commonly deregulated genes were observed (Fig. 2E).
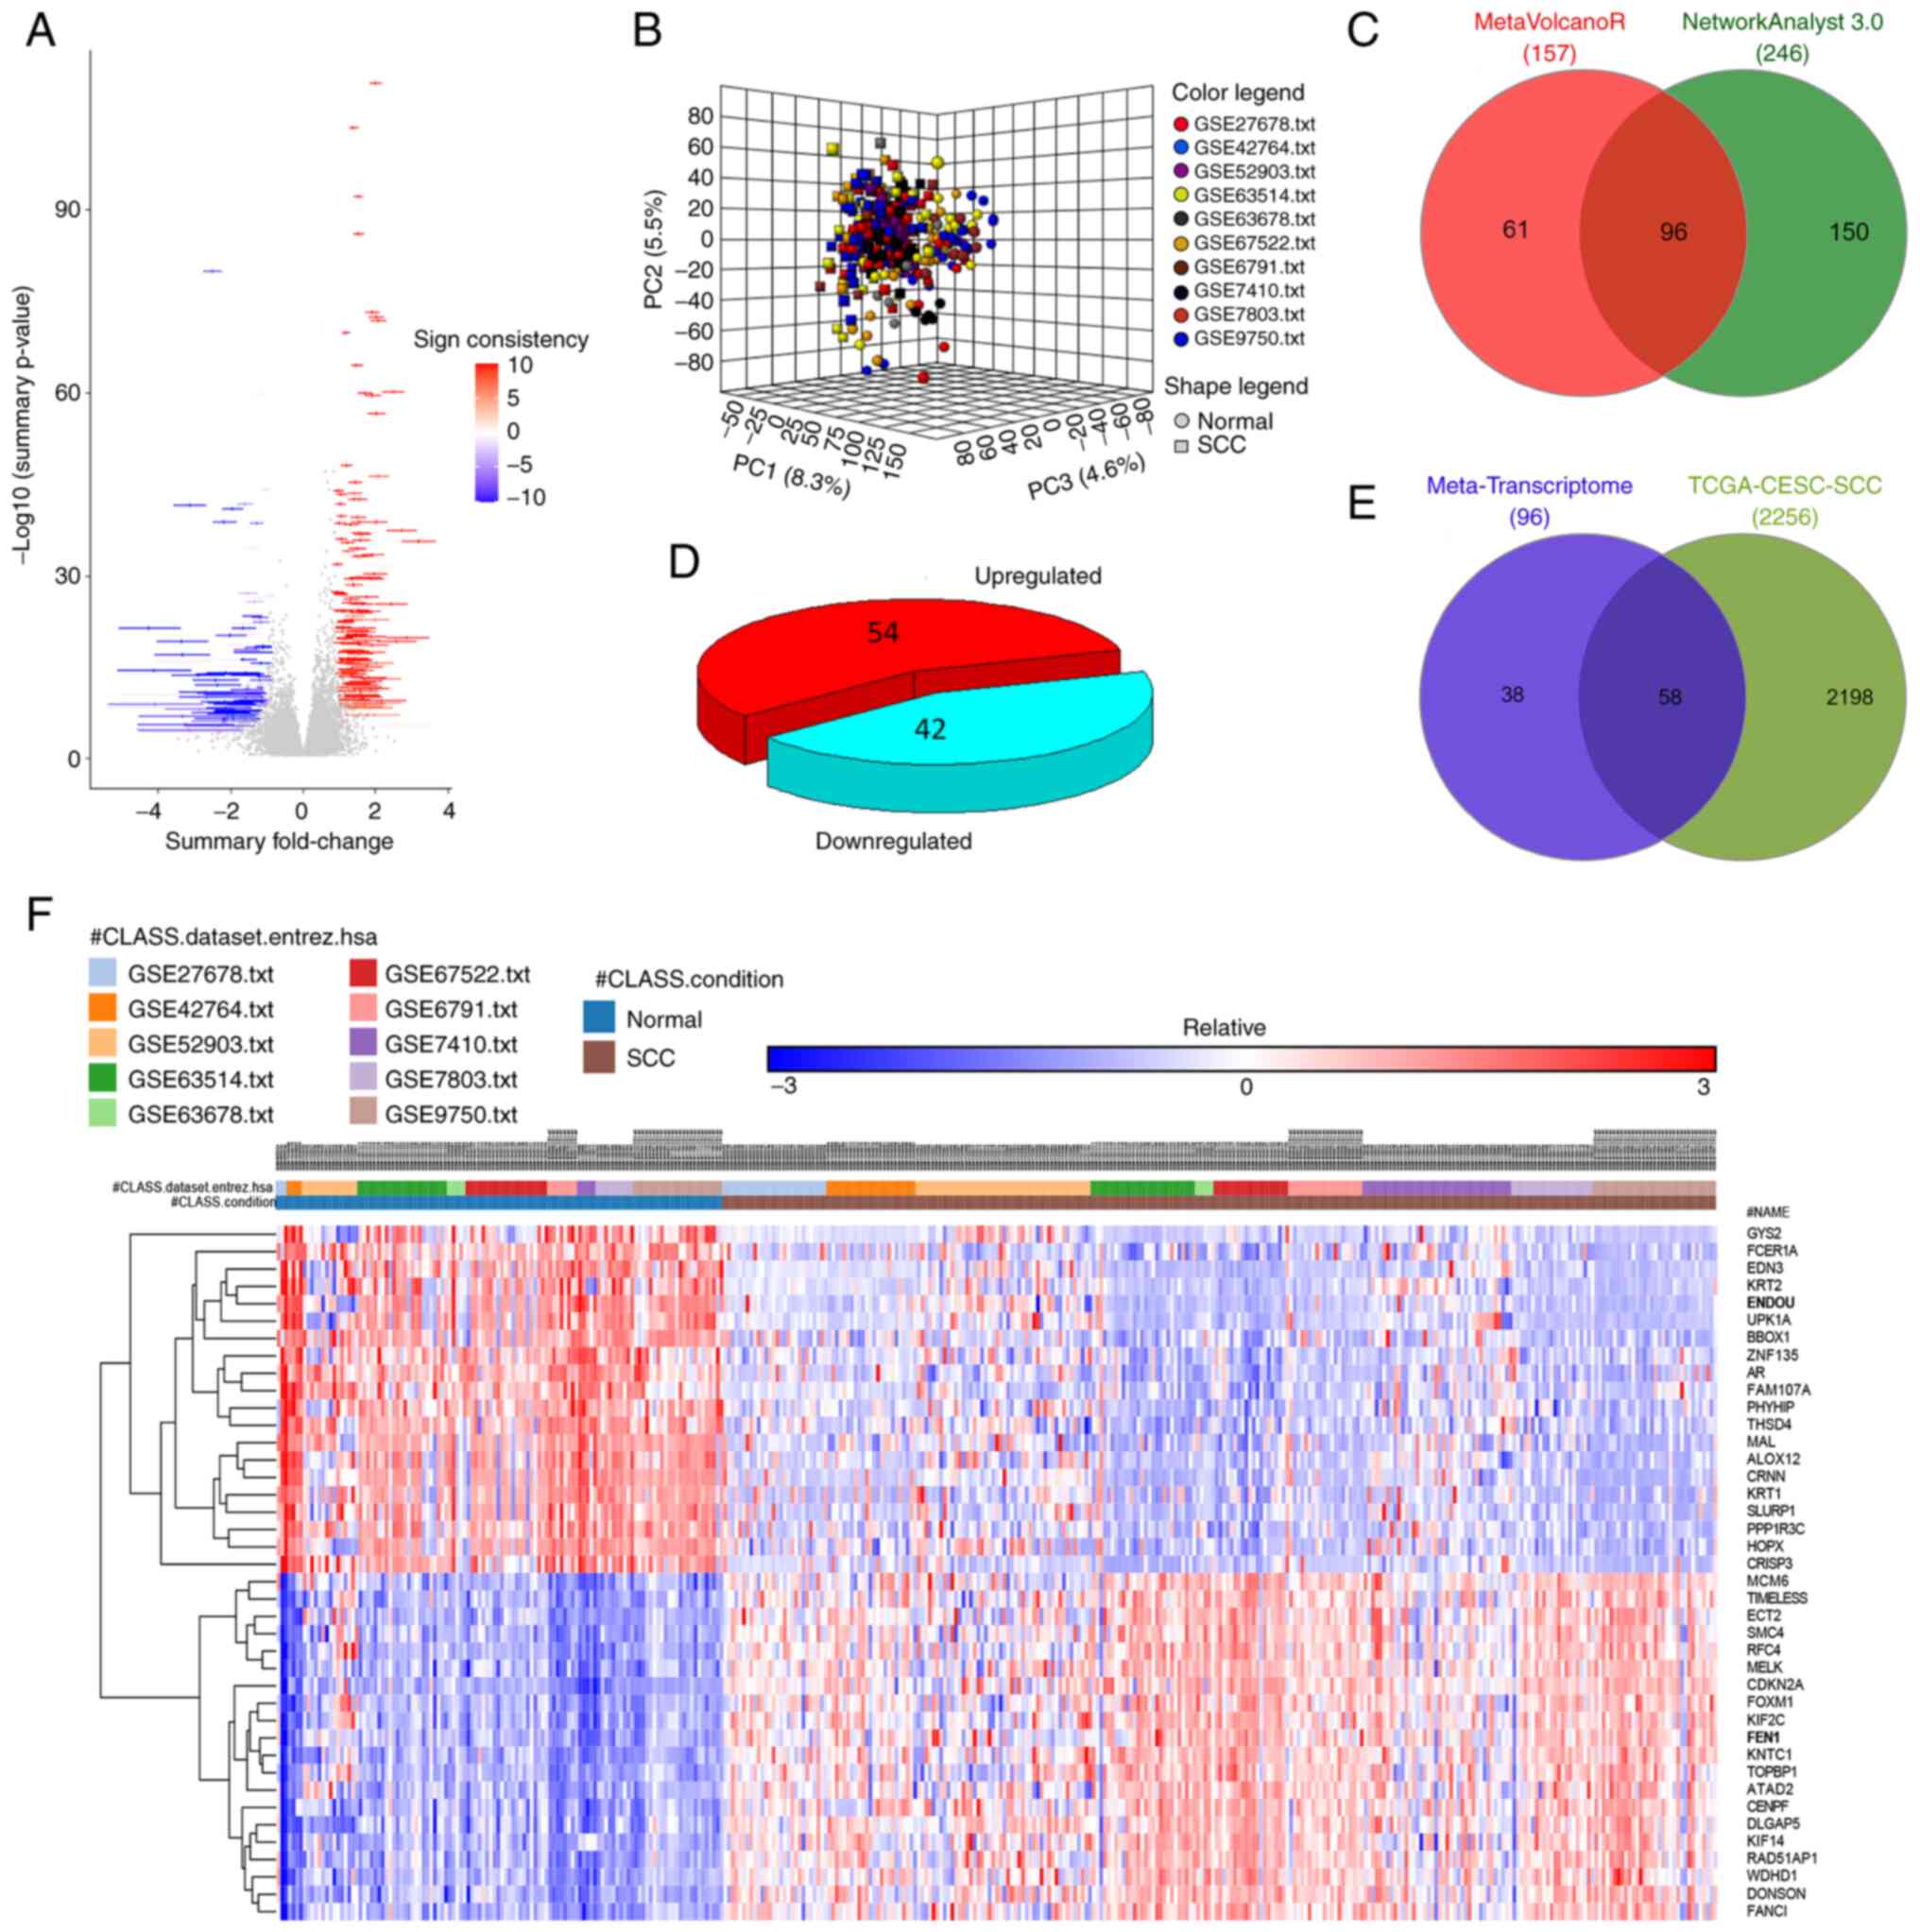 |
Figure 2.
Metatranscriptome signature of cervical SCC. (A) Summary plot illustrating the log2 fold-changes and the -log10 p-values of 157 DEGs obtained with MetaVolcanoR. Blue represents downregulated gene, while red represents upregulated genes. (B) Principal component analysis of the integrated studies after COMBAT correction in NetworkAnalyst 3.0. (C) Venn diagram illustrating the intersection of the MetaVolcanoR and NetworkAnalyst 3.0 results. (D) Pie chart depicting DEGs across 10 individual studies and two integration methods. (E) Venn diagram illustrating the intersection of the metatranscriptome and TCGA-CESC-SCC DEGs. (F) Heatmap illustrating the top 40 DEGs obtained viaNetworkAnalyst 3.0. SCC, squamous cell carcinoma; DEGs, differentially expressed genes.
|
Validation of the metatranscriptome signature using systems biology tools
To validate the metatranscriptome in the context of SCC pathobiology, the present study performed GSEA of the DEGs and computed overlaps with the H (hallmark gene sets), C2 (curated gene sets) and C5 (GO gene sets) collections. The most prominent overlap of DEGs was observed with the previously established cervical cancer proliferation cluster (69) composed of 163 transcripts that are notably associated with the E6/E7 mRNA levels in tumors (NES, 4.1; FDR<0.0001; Fig. 3A). In addition, the DEGs were significantly enriched in a subset of cell cycle genes that are associated exclusively with HPV-driven carcinogenesis (NES, 2.83; FDR<0.0001; Fig. 3B), E2F upregulated targets (NES, 2.56; FDR<0.0001; Fig. 3C), p53 downregulated targets (NES, 2.33; FDR<0.0001; Fig. 3D) and G2/M checkpoint markers (NES, 2.46; FDR<0.0001; Fig. 3E).
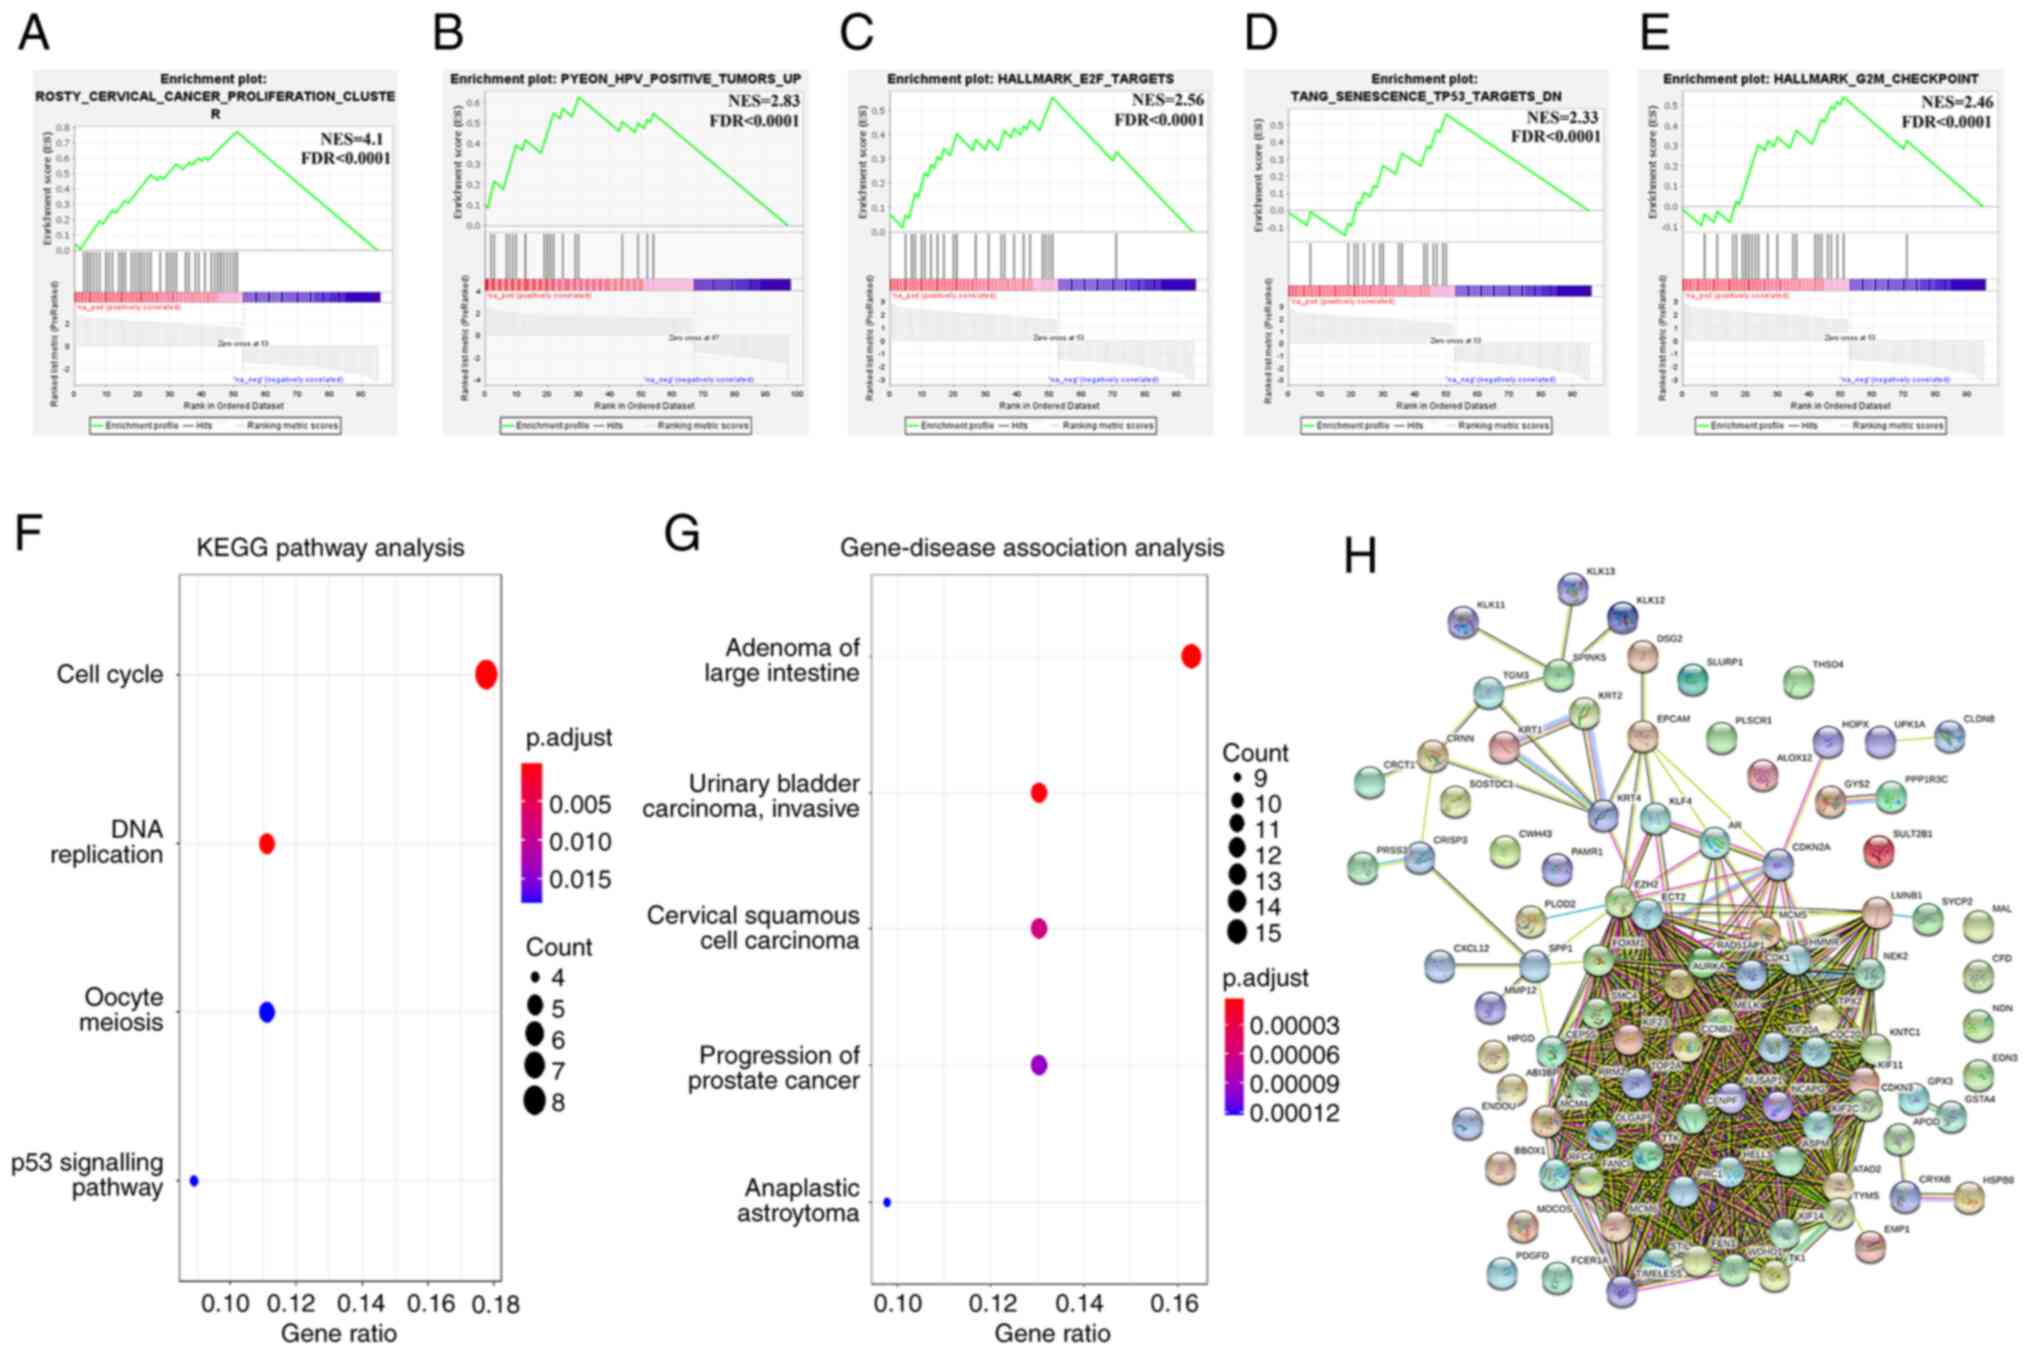 |
Figure 3.
Validation of the metatranscriptome signature using systems biology tools. (A) GSEA plot depicting enrichment of the metatranscriptome signature in the cervical cancer proliferation cluster from Rosty et al (69). (B) GSEA plot depicting enrichment of the metatranscriptome signature in the HPV positive tumors from Pyeon et al (20). (C) GSEA plot depicting enrichment of the metatranscriptome signature in the E2F target genes. (D) GSEA plot depicting enrichment of the metatranscriptome signature in the p53 downregulated target genes. (E) GSEA plot depicting enrichment of the metatranscriptome signature in the G2/M checkpoint. (F) KEGG pathway enrichment analysis of the metatranscriptome signature. (G) Gene-disease association analysis of the metatranscriptome signature. (H) Protein-protein interaction network of the metatranscriptome signature (96 nodes, 928 edges; FDR<0.0001). GSEA, Gene Set Enrichment Analysis; HPV, human papillomavirus;NES, normalized enrichment score; FDR, false discovery rate; KEGG, Kyoto Encyclopedia of Genes and Genomes.
|
In agreement with current knowledge regarding the molecular pathogenesis of SCC (6), KEGG pathway analysis demonstrated significant enrichment of DEGs in the ‘Cell cycle’, ‘DNA replication’, ‘Oocyte meiosis’ and ‘p53 signaling pathway’ (Fig. 3F). Gene-disease association analysis revealed a significant association between the DEGs and different malignancies, including ‘Cervical Squamous Cell Carcinoma’ (Fig. 3G). Finally, in agreement with GO analysis (Fig. S1A), the PPI network revealed a significant association between the DEGs and cell cycle-specific protein interactions (96 nodes, 928 edges; FDR<0.0001; Fig. 3H).
Proof of concept: Identification of candidate biomarkers for cervical SCC
To demonstrate the usefulness of the metatranscriptome for the detection of relevant diagnostic biomarkers, the present study chose to validate the expression of two top ranked DEGs, FEN1 and ENDOU, as potentially important regulators of cervical carcinogenesis (28,33,40). The selection of these candidates was based on an extensive literature review (28,34,37–40) and the availability ofspecific antibodies. Differential expression of FEN1 and ENDOU in cervical carcinoma was validated using an external TCGA-CESC dataset consisting of gene expression profiles from 254 SCC, 52 adenocarcinoma and three normal cervical tissues. In agreement with the metatranscriptome, FEN1 expression was significantly upregulated in patients with SCC in the TCGA-CESC project (P=0.0016; Fig. 4A and B), whereas ENDOU did not pass the arbitrary cut-off (±1.5 log2FC; FDR, 0.01; Fig. 4C and D). In contrast to p16, the expression levels of FEN1 or ENDOU were not significantly associated with HPV infection status or virus genotype (Fig. 5A and B). Furthermore, neither FEN1 (R, 0.17; P=0.0086; Fig. 5C) nor ENDOU (R, −0.02; P>0.05; data not shown) expressions were correlated with p16 expression. Conversely, FEN1 expression was significantly correlated with the Ki67 proliferation marker (R, 0.64; P<2.2×10⁻¹⁶; Fig. 5D).
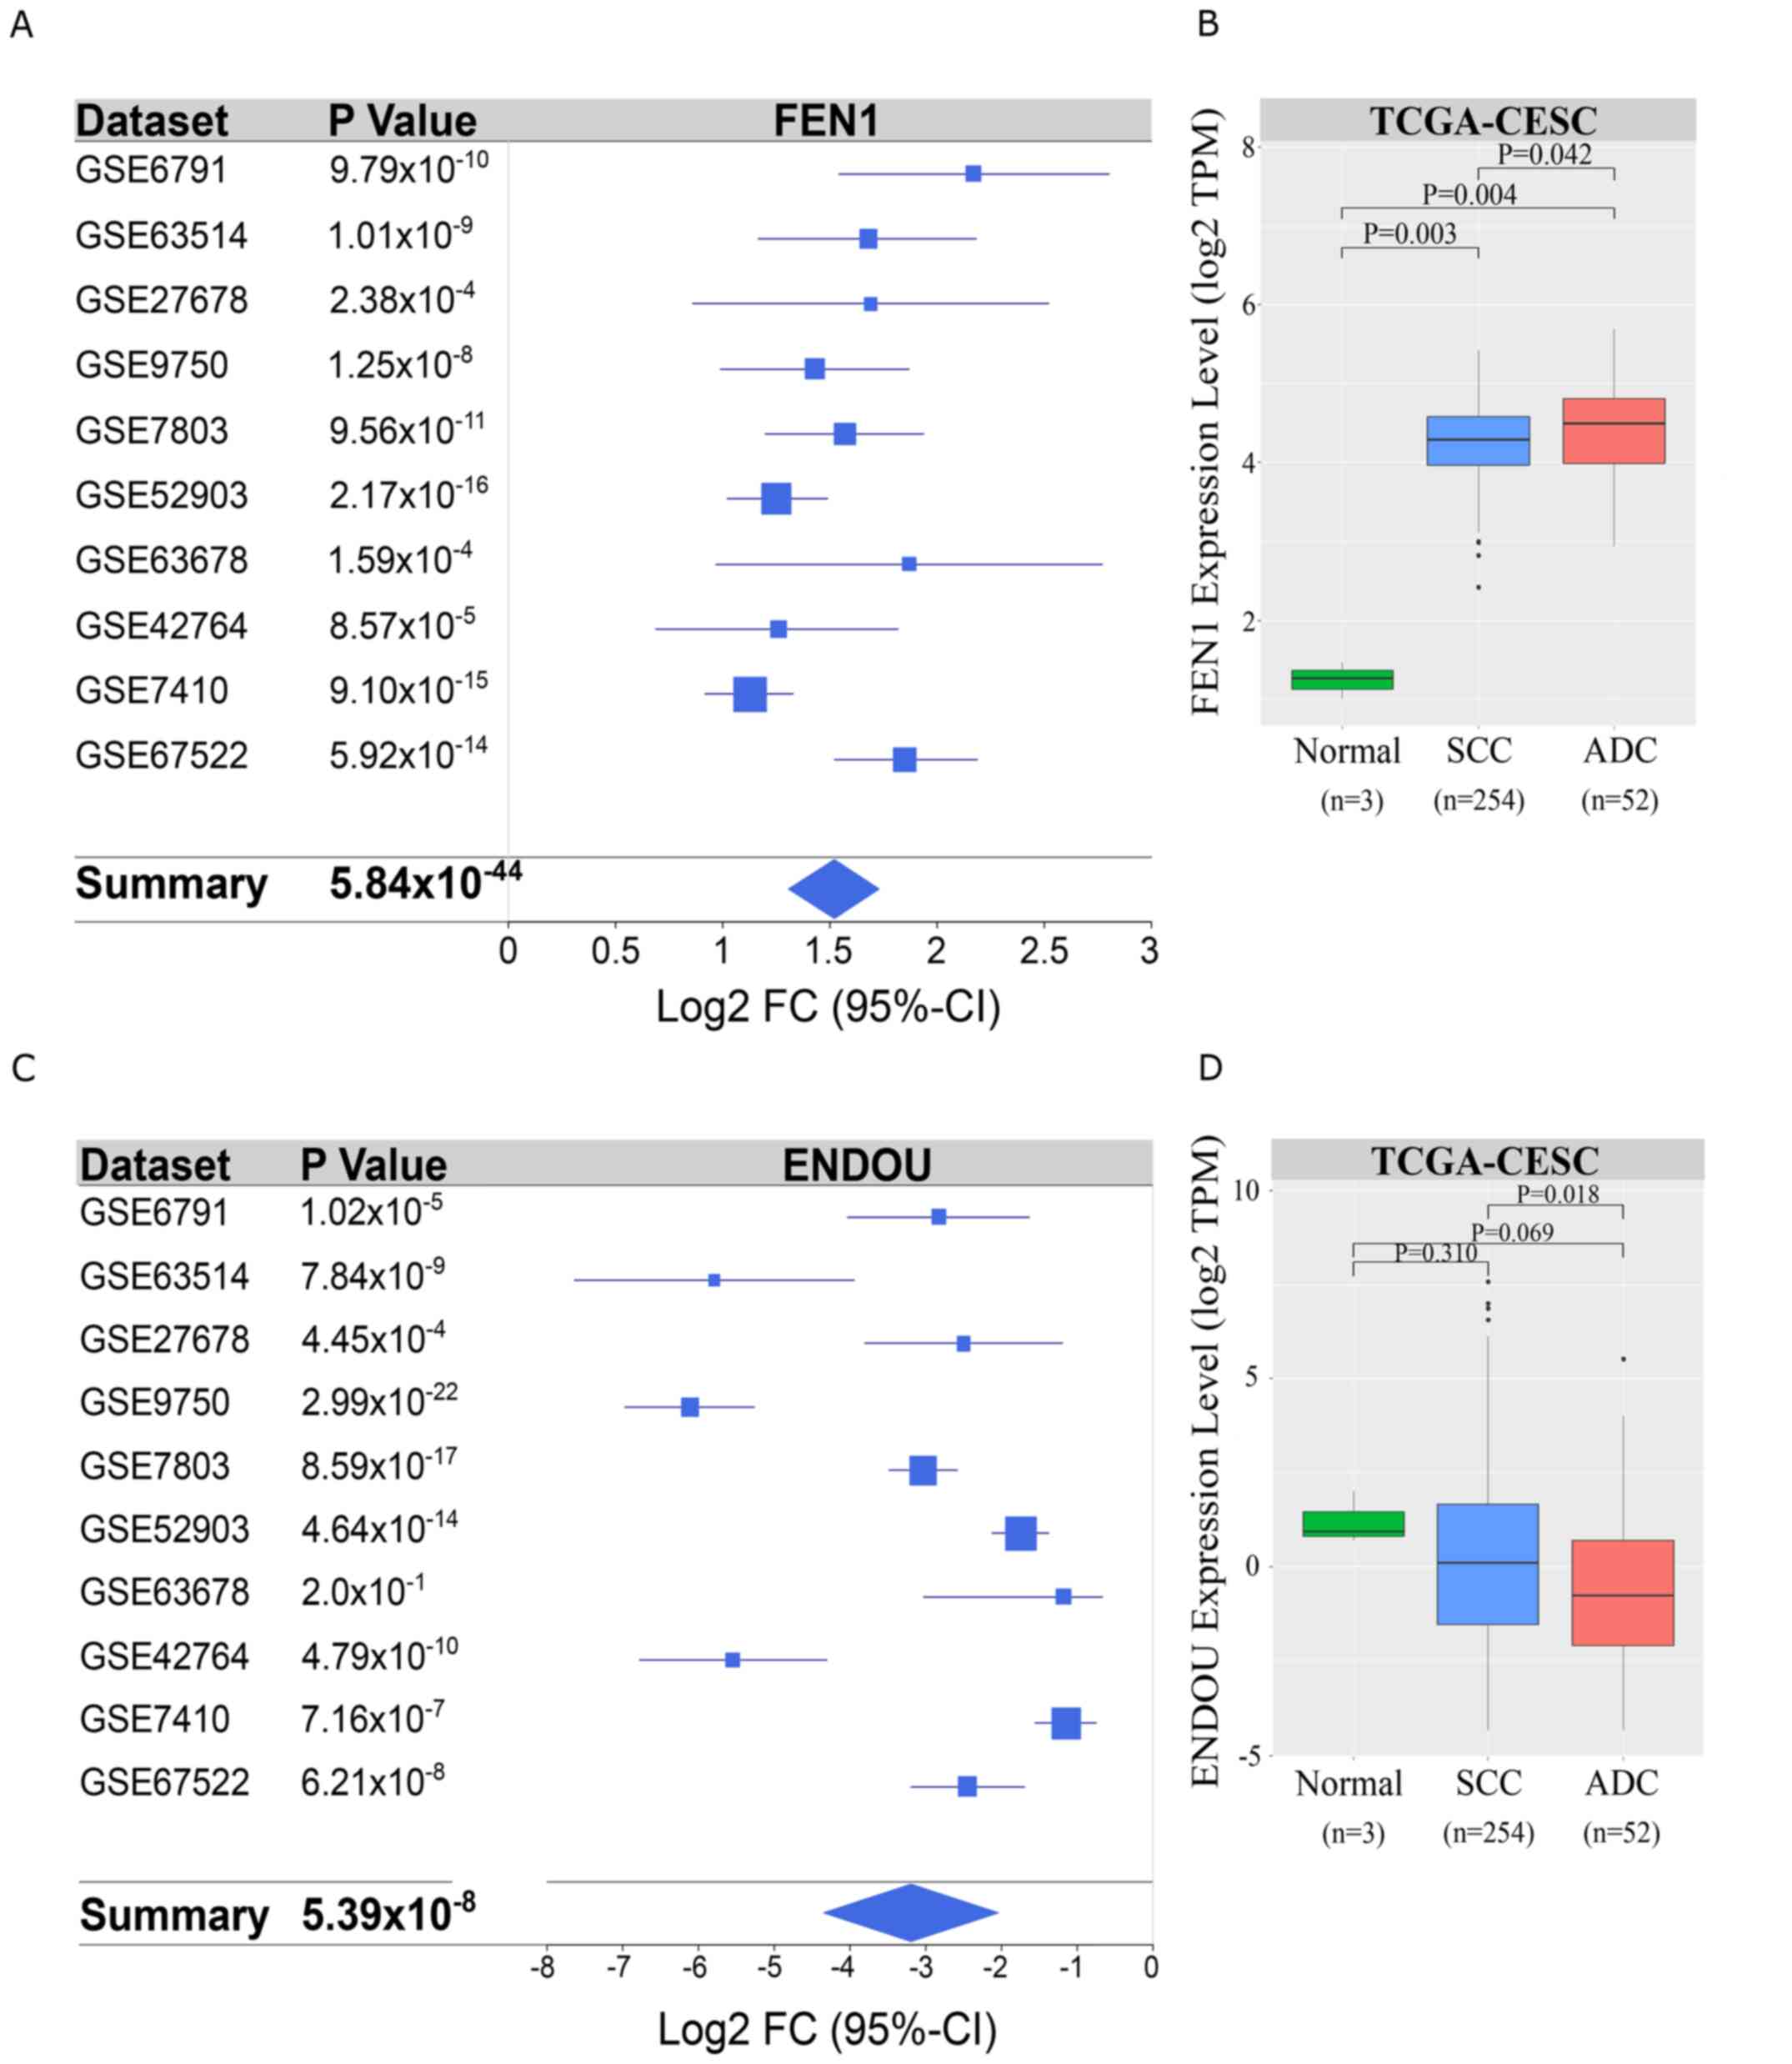 |
Figure 4.
Selection and validation of FEN1 and ENDOU as candidate biomarkers. (A) Forest plot illustrating differential expression of FEN1 across studies integrated using MetaVolcanoR. (B) FEN1 transcript expression in TCGA-CESC cohort. (C) Forest plot illustrating differential expression of ENDOU across studies integrated using MetaVolcanoR. (D) Validation of ENDOU expression in TCGA-CESC cohort. For each box plot and Kruskal-Wallis test, the central line represents the median; the outer black lines on the box represent the upper and lower quartiles; dots represent outliers; the black lines are the whiskers, which extend from the interquartile ranges to the maximum values that are not classed as outliers. FEN1, flap structure-specific endonuclease 1;ENDOU, poly (U)-specific endoribonuclease; TCGA, The Cancer Genome Atlas; CESC, cervical squamous cell carcinoma and endocervical adenocarcinoma; SCC, squamous cell carcinoma; ADC, adenocarcinoma; FC, fold change; CI, confidence interval.
|
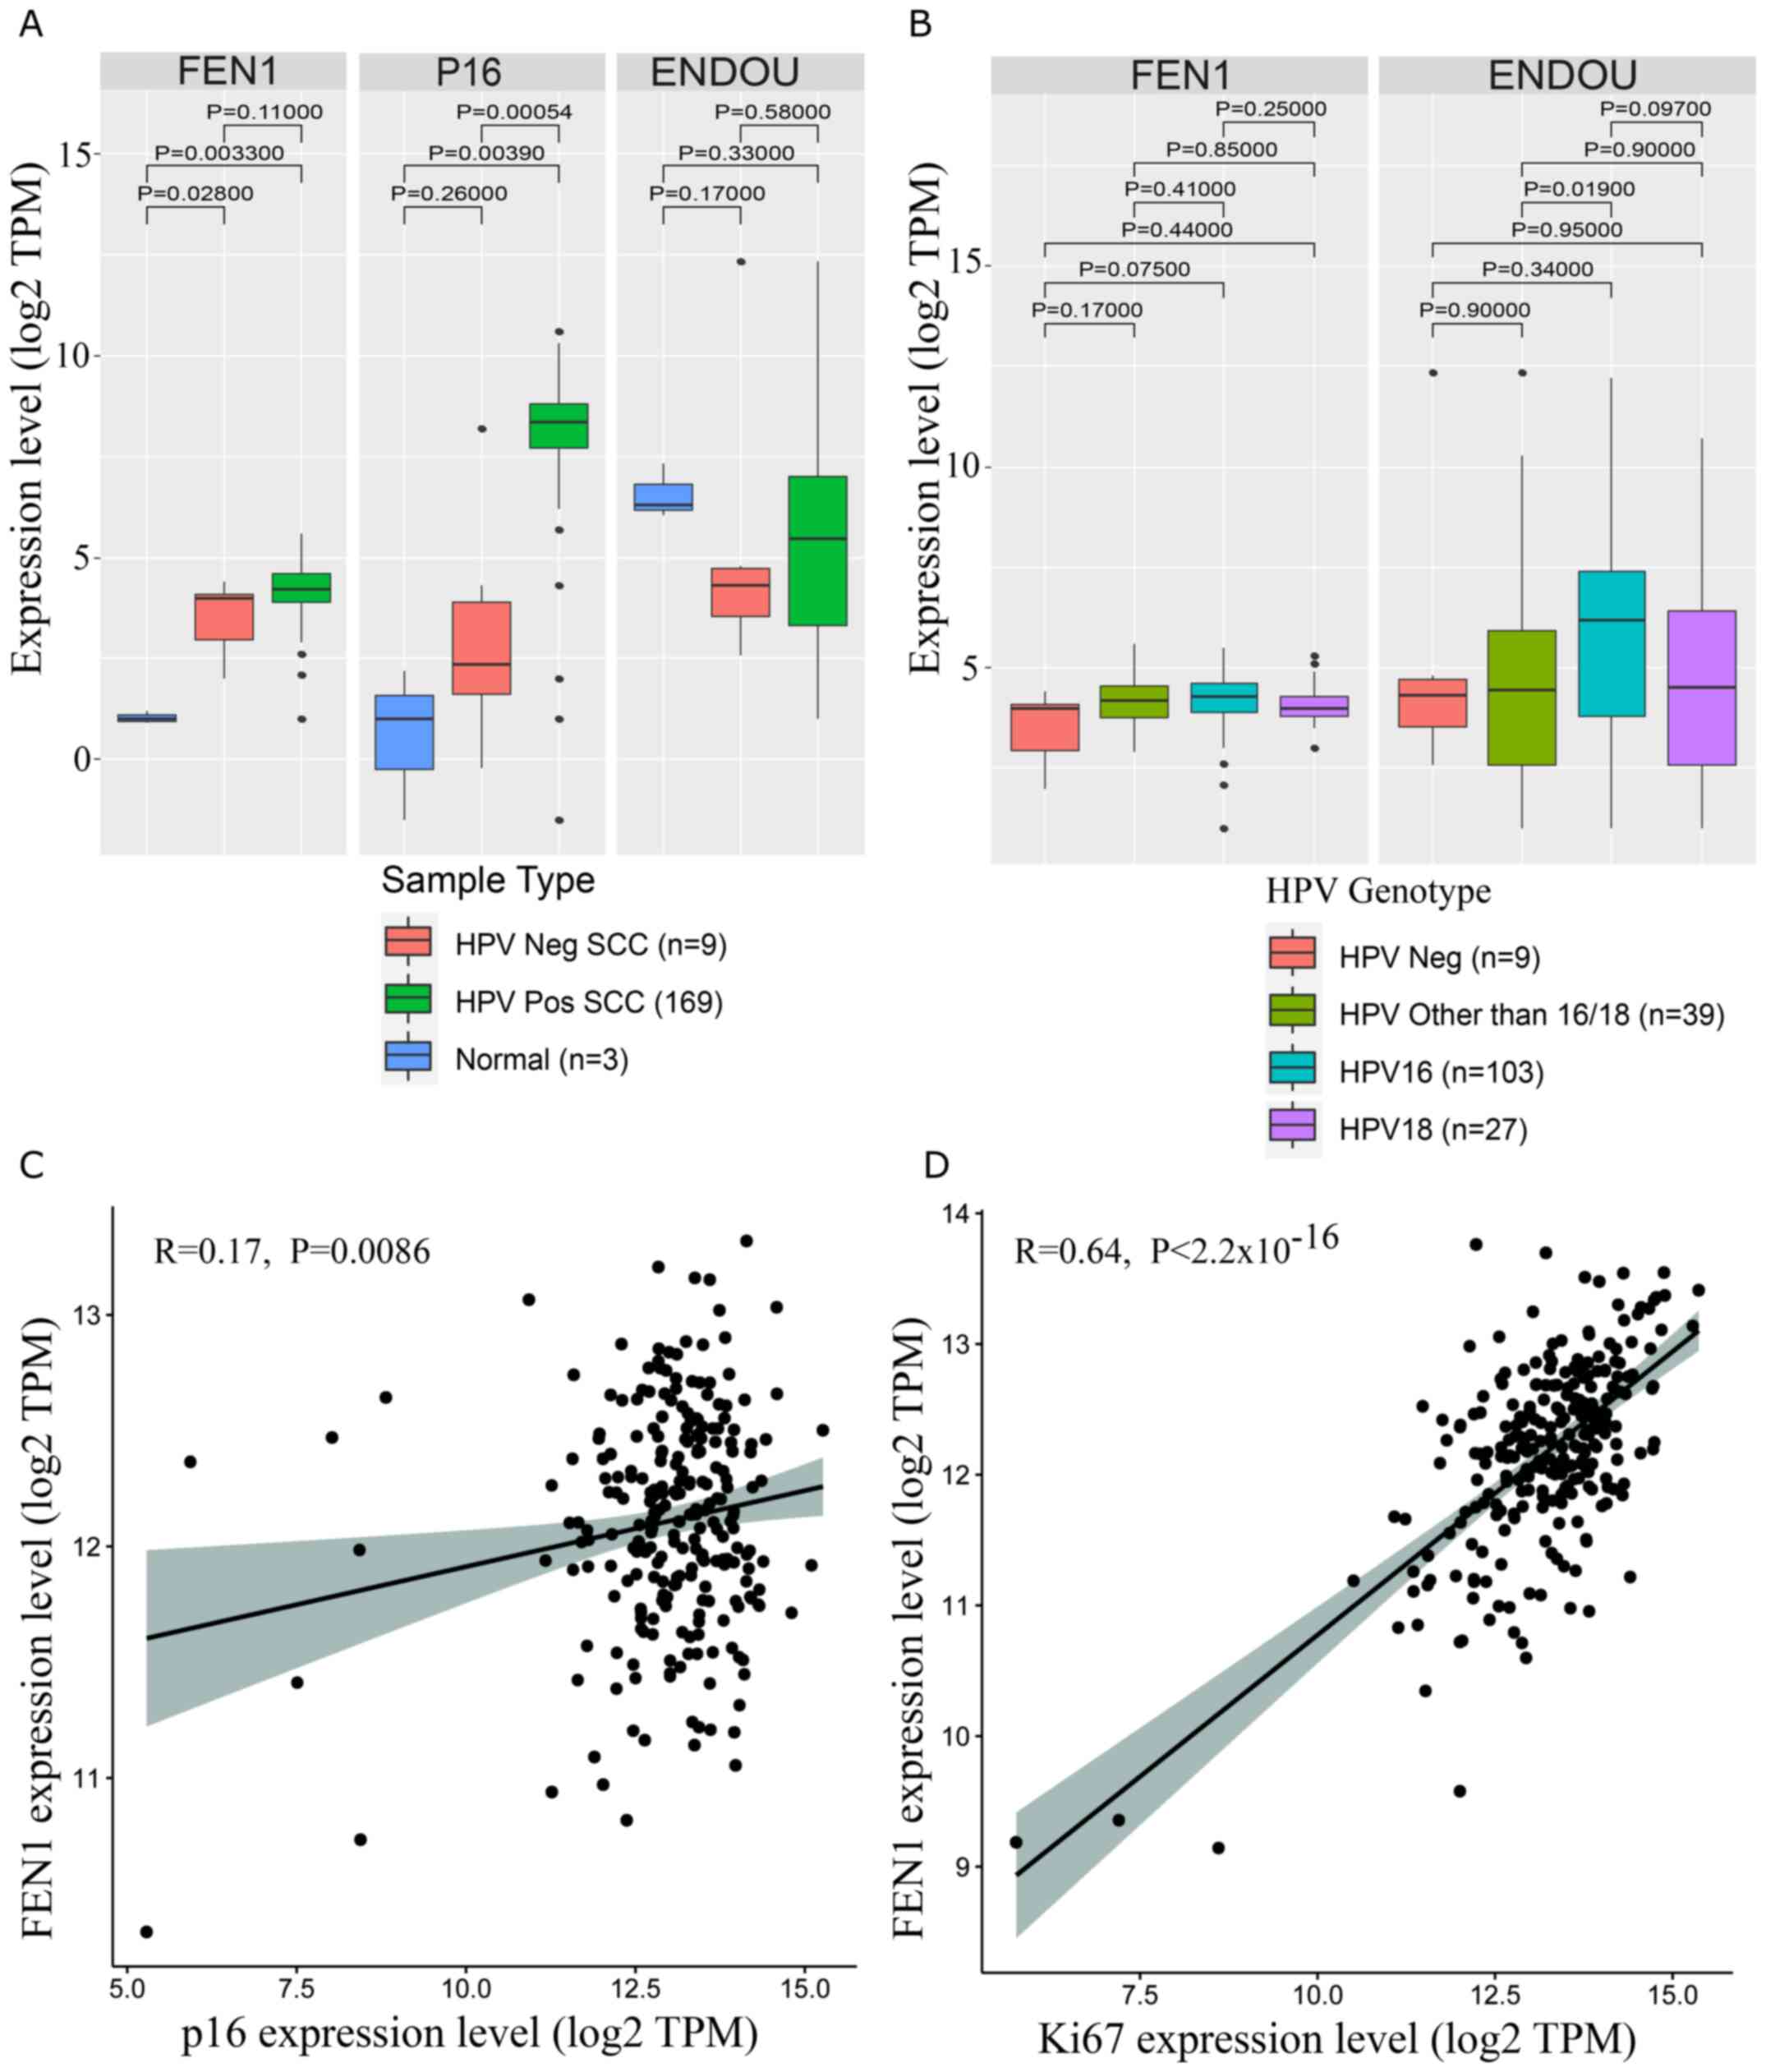 |
Figure 5.
Expression of candidate biomarkers associated with HPV status and genotype. (A) Clustering mRNA expression of the candidate biomarkers based on HPV infection status. (B) Clustering mRNA expression of the candidate biomarkers based on HPV genotype. (C) Pearson's correlation coefficient analysis plot of p16 score and FEN1 expression in SCC tissues. (D) Pearson's correlation coefficient analysis plot of Ki67 score and FEN1 expression in SCC tissues. For each box plot and Kruskal-Wallis test, the central line represents the median; the outer black lines on the box represent the upper and lower quartiles; dots represent outliers; the black lines are the whiskers, which extend from the interquartile ranges to the maximum values that are not classed as outliers. P-values for each Kruskal-Wallis test are given on the plot. HPV, human papillomavirus; FEN1, flap structure-specific endonuclease 1; SCC, squamous cell carcinoma; ENDOU, poly (U)-specific endoribonuclease; Neg, negative; Pos, positive.
|
The potentially universal roles of FEN1 and ENDOU deregulation in carcinogenesis were investigated by assessing their expression across TCGA PanCancer panel. Screening revealed significant deregulation of the candidate transcripts in several malignancies, which was prognostic in the case of FEN1 (Fig. S2A-C).
FEN1 and ENDOU as diagnostic biomarkers for cervical SCC
The role of FEN1 and ENDOU transcripts as potential diagnostic biomarkers was assessed via ROC curve analysis and calculating the AUC, using an independent SCC cohort (GSE138080). The results demonstrated good diagnostic precision of FEN1 (AUC, 0.87; 95% CI, 0.71–1; Fig. 6A) and excellent diagnostic precision of ENDOU (AUC, 0.98; 95% CI, 0.93–1; Fig. 6B) to distinguish between patients with SCC and healthy individuals. The prognostic value of candidate transcripts was analyzed via univariate analysis and the construction of overall survival curves. As presented in Fig. 6C and D, the candidate biomarkers were not significantly associated with the overall survival of patients with SCC. After clustering patients with SCC according to administrated treatment, a trend for favorable clinical outcome in patients with high FEN1 expression levels treated with adjuvant chemotherapy was observed (log-rank P=0.077; Fig S3C). This was also observed in HPV positive head and neck tumors (Fig. S2C). To further characterize FEN1 and ENDOU as potential diagnostic markers for SCC, the present study investigated the correlations between their expression levels and gene markers of tumor-infiltrating immune cells. The results demonstrated that FEN1 expression was significantly correlated with tumor purity, whereas ENDOU expression was weakly correlated with tumor infiltration, particularly CD8+ T cells (Fig. 6E and F).
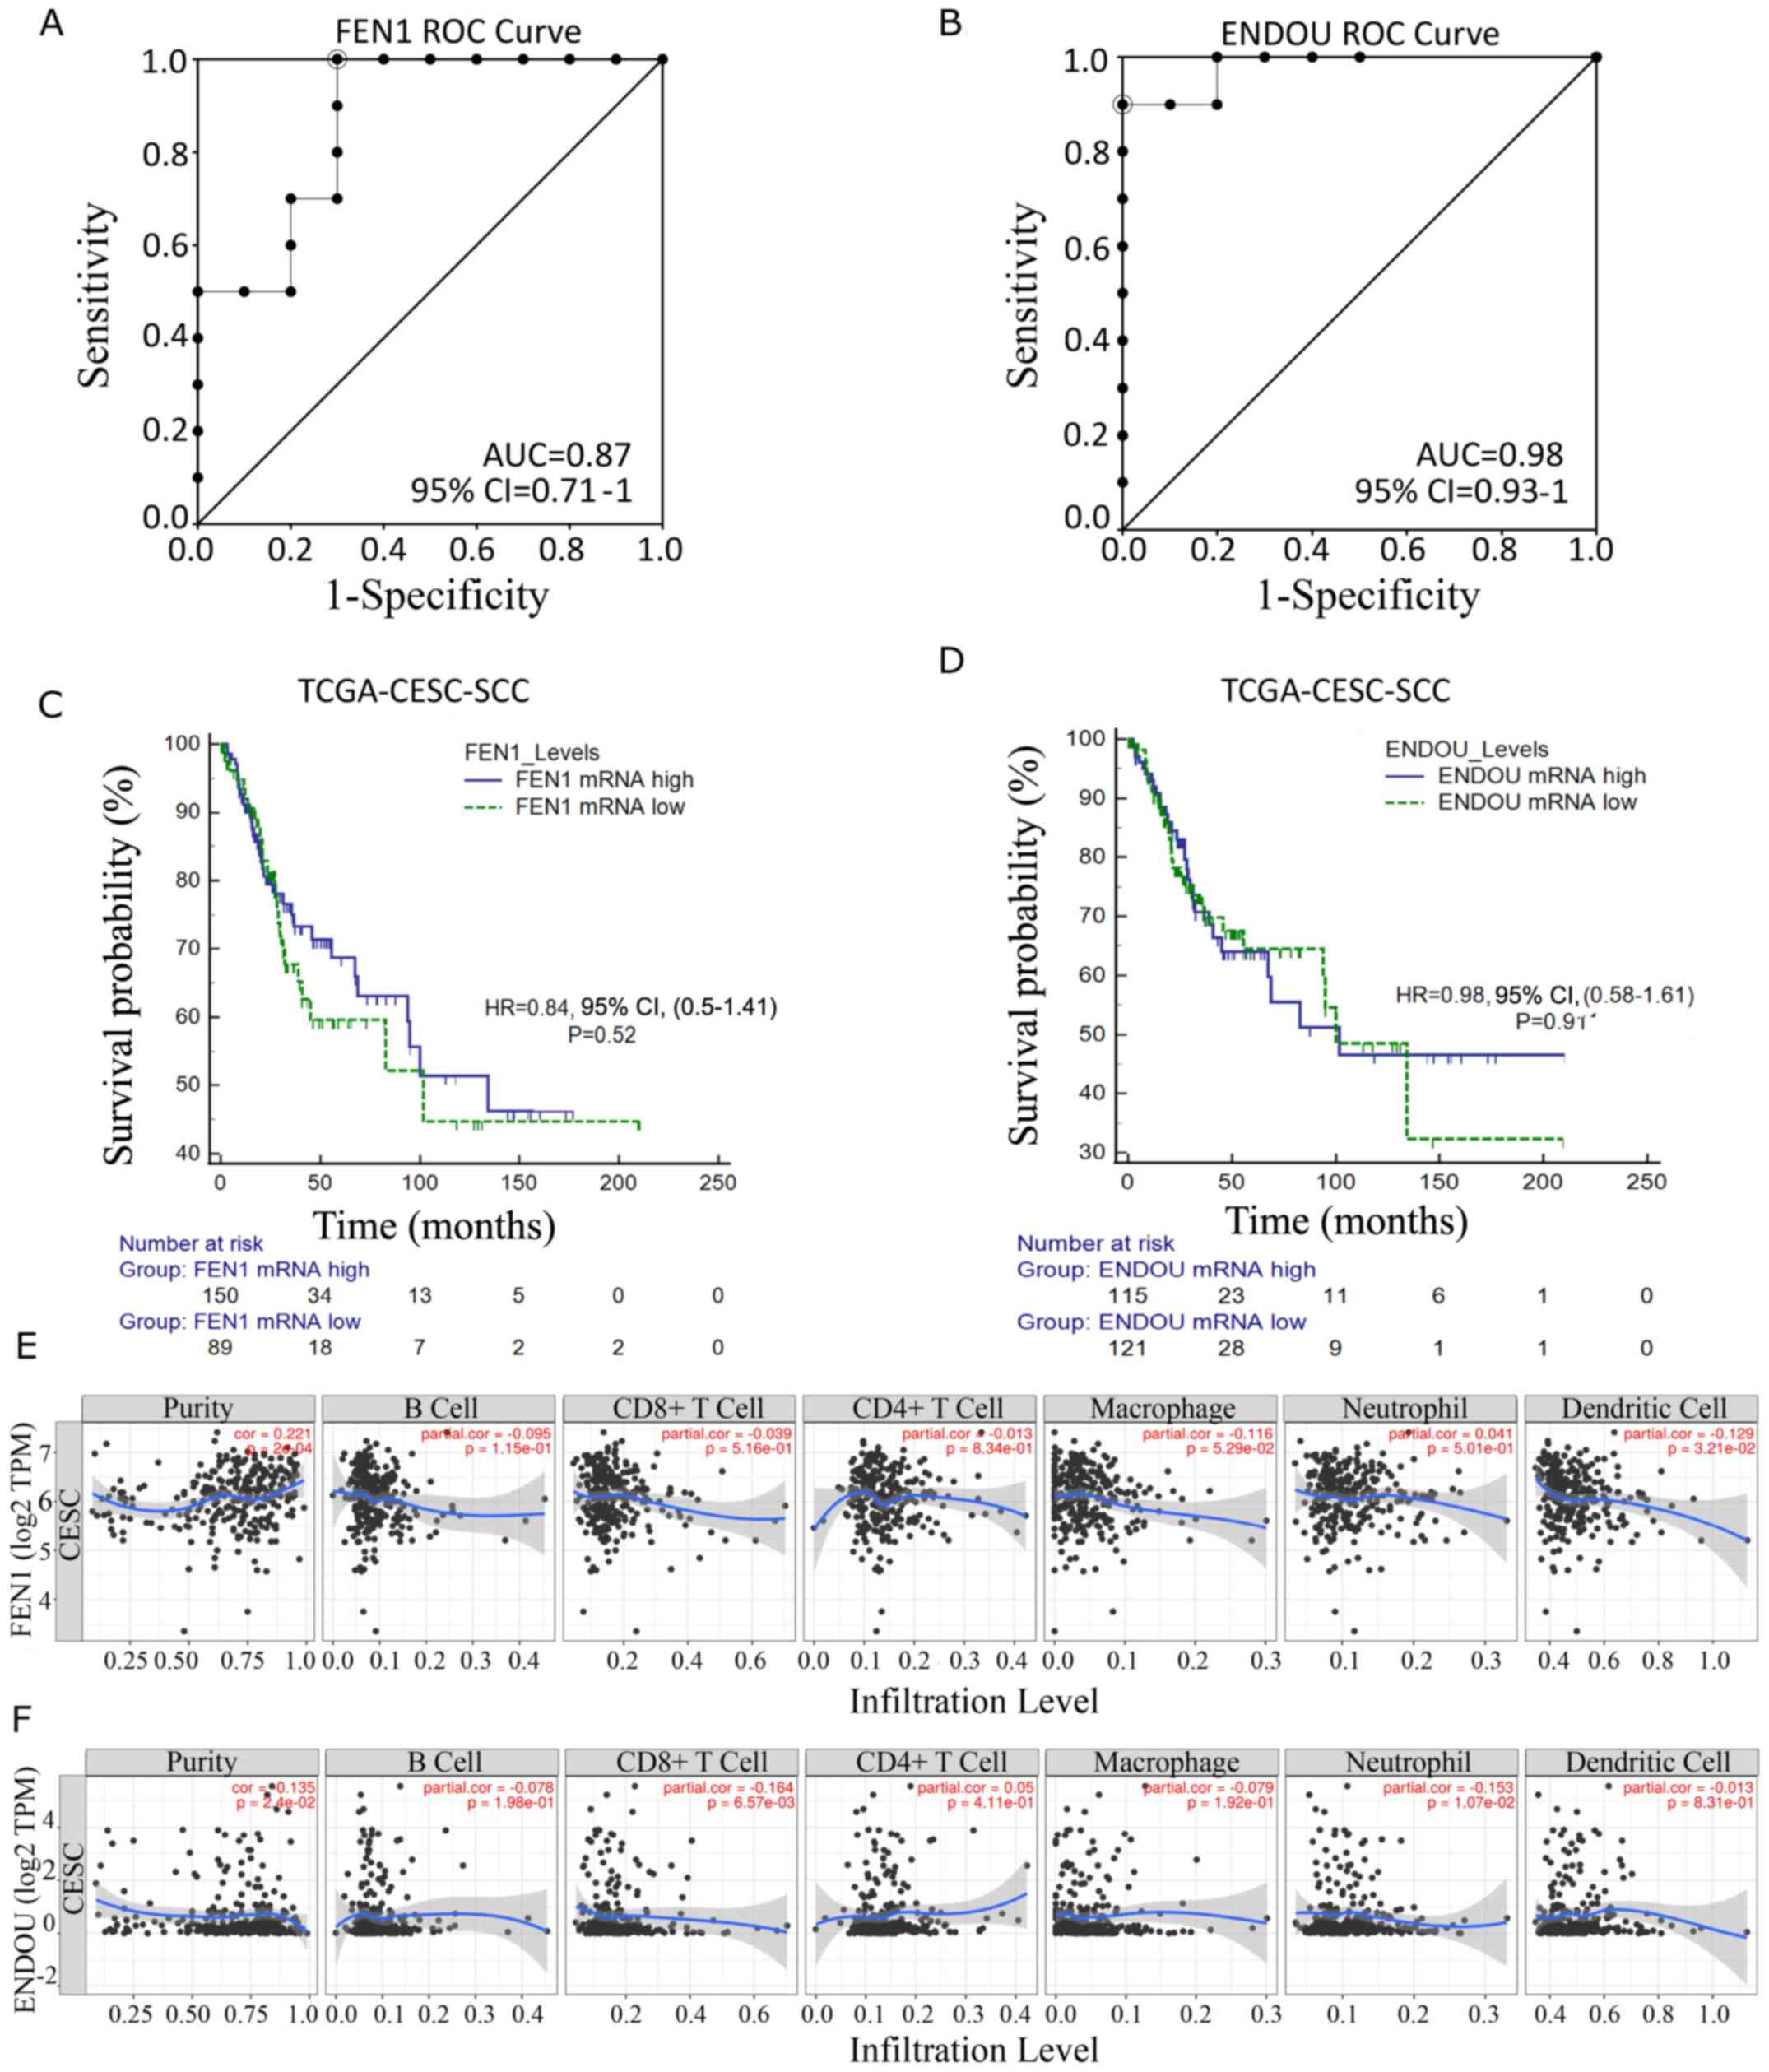 |
Figure 6.
Diagnostic and prognostic performance of FEN1 and ENDOU transcripts. (A) ROC curve analysis for FEN1 in the GSE13380 cervical cancer cohort. (B) ROC curve analysis for ENDOU in the GSE13380 cervical cancer cohort. (C) Overall survival analysis for FEN1 in the TCGA-CESC-SCC cohort. mRNA levels were dichotomized based on the median separation. (D) Overall survival analysis for ENDOU in TCGA-CESC-SCC cohort. mRNA levels were dichotomized based on the median separation. (E) Correlation between FEN1 expression and tumor infiltration signature in TCGA-CESC. (F) Correlation between ENDOU expression and tumor infiltration signature in TCGA-CESC. FEN1, flap structure-specific endonuclease 1; ENDOU, poly (U)-specific endoribonuclease; ROC, receiver operating characteristic; TCGA, The Cancer Genome Atlas; CESC, cervical squamous cell carcinoma and endocervical adenocarcinoma; SCC, squamous cell carcinoma; AUC, area under the curve; CI, confidence interval; HR, hazard ratio.
|
Validation of FEN1 and ENDOU in the cervical biopsies of patients with SCC
FEN1 and ENDOU expression was assessed at the protein level using cervical cancer tissue array with adjacent normal cervix tissues. The results demonstrated that FEN1 expression was upregulated in the nuclei of ~65% of SCC cases (n=88; P=0.0001; Fig. 7A and F); however, its expression was not observed in normal tissues (n=10). There was no statistically significant association between FEN1 expression and tumor grade (P>0.05; Fig. 7B). Furthermore, strong FEN1 staining was observed in adenosquamous cell carcinoma (n=1), but not in endocervical adenocarcinoma (n=2; Fig. 7F). In comparison, p16 was found to be overexpressed in ~98% of SCC cases (n=92; P=0.0001; Fig. 7C and F). Similarly, for FEN1, no significant association was observed between p16 staining and SCC grade (P>0.05; Fig. 7D). Strong p16 staining was also observed in adenosquamous carcinoma (n=1; Fig. 7F), but not in endocervical adenocarcinoma (n=2; Fig. 7F). Normal tissues were not stained with p16 (n=10; Fig. 7C and F).
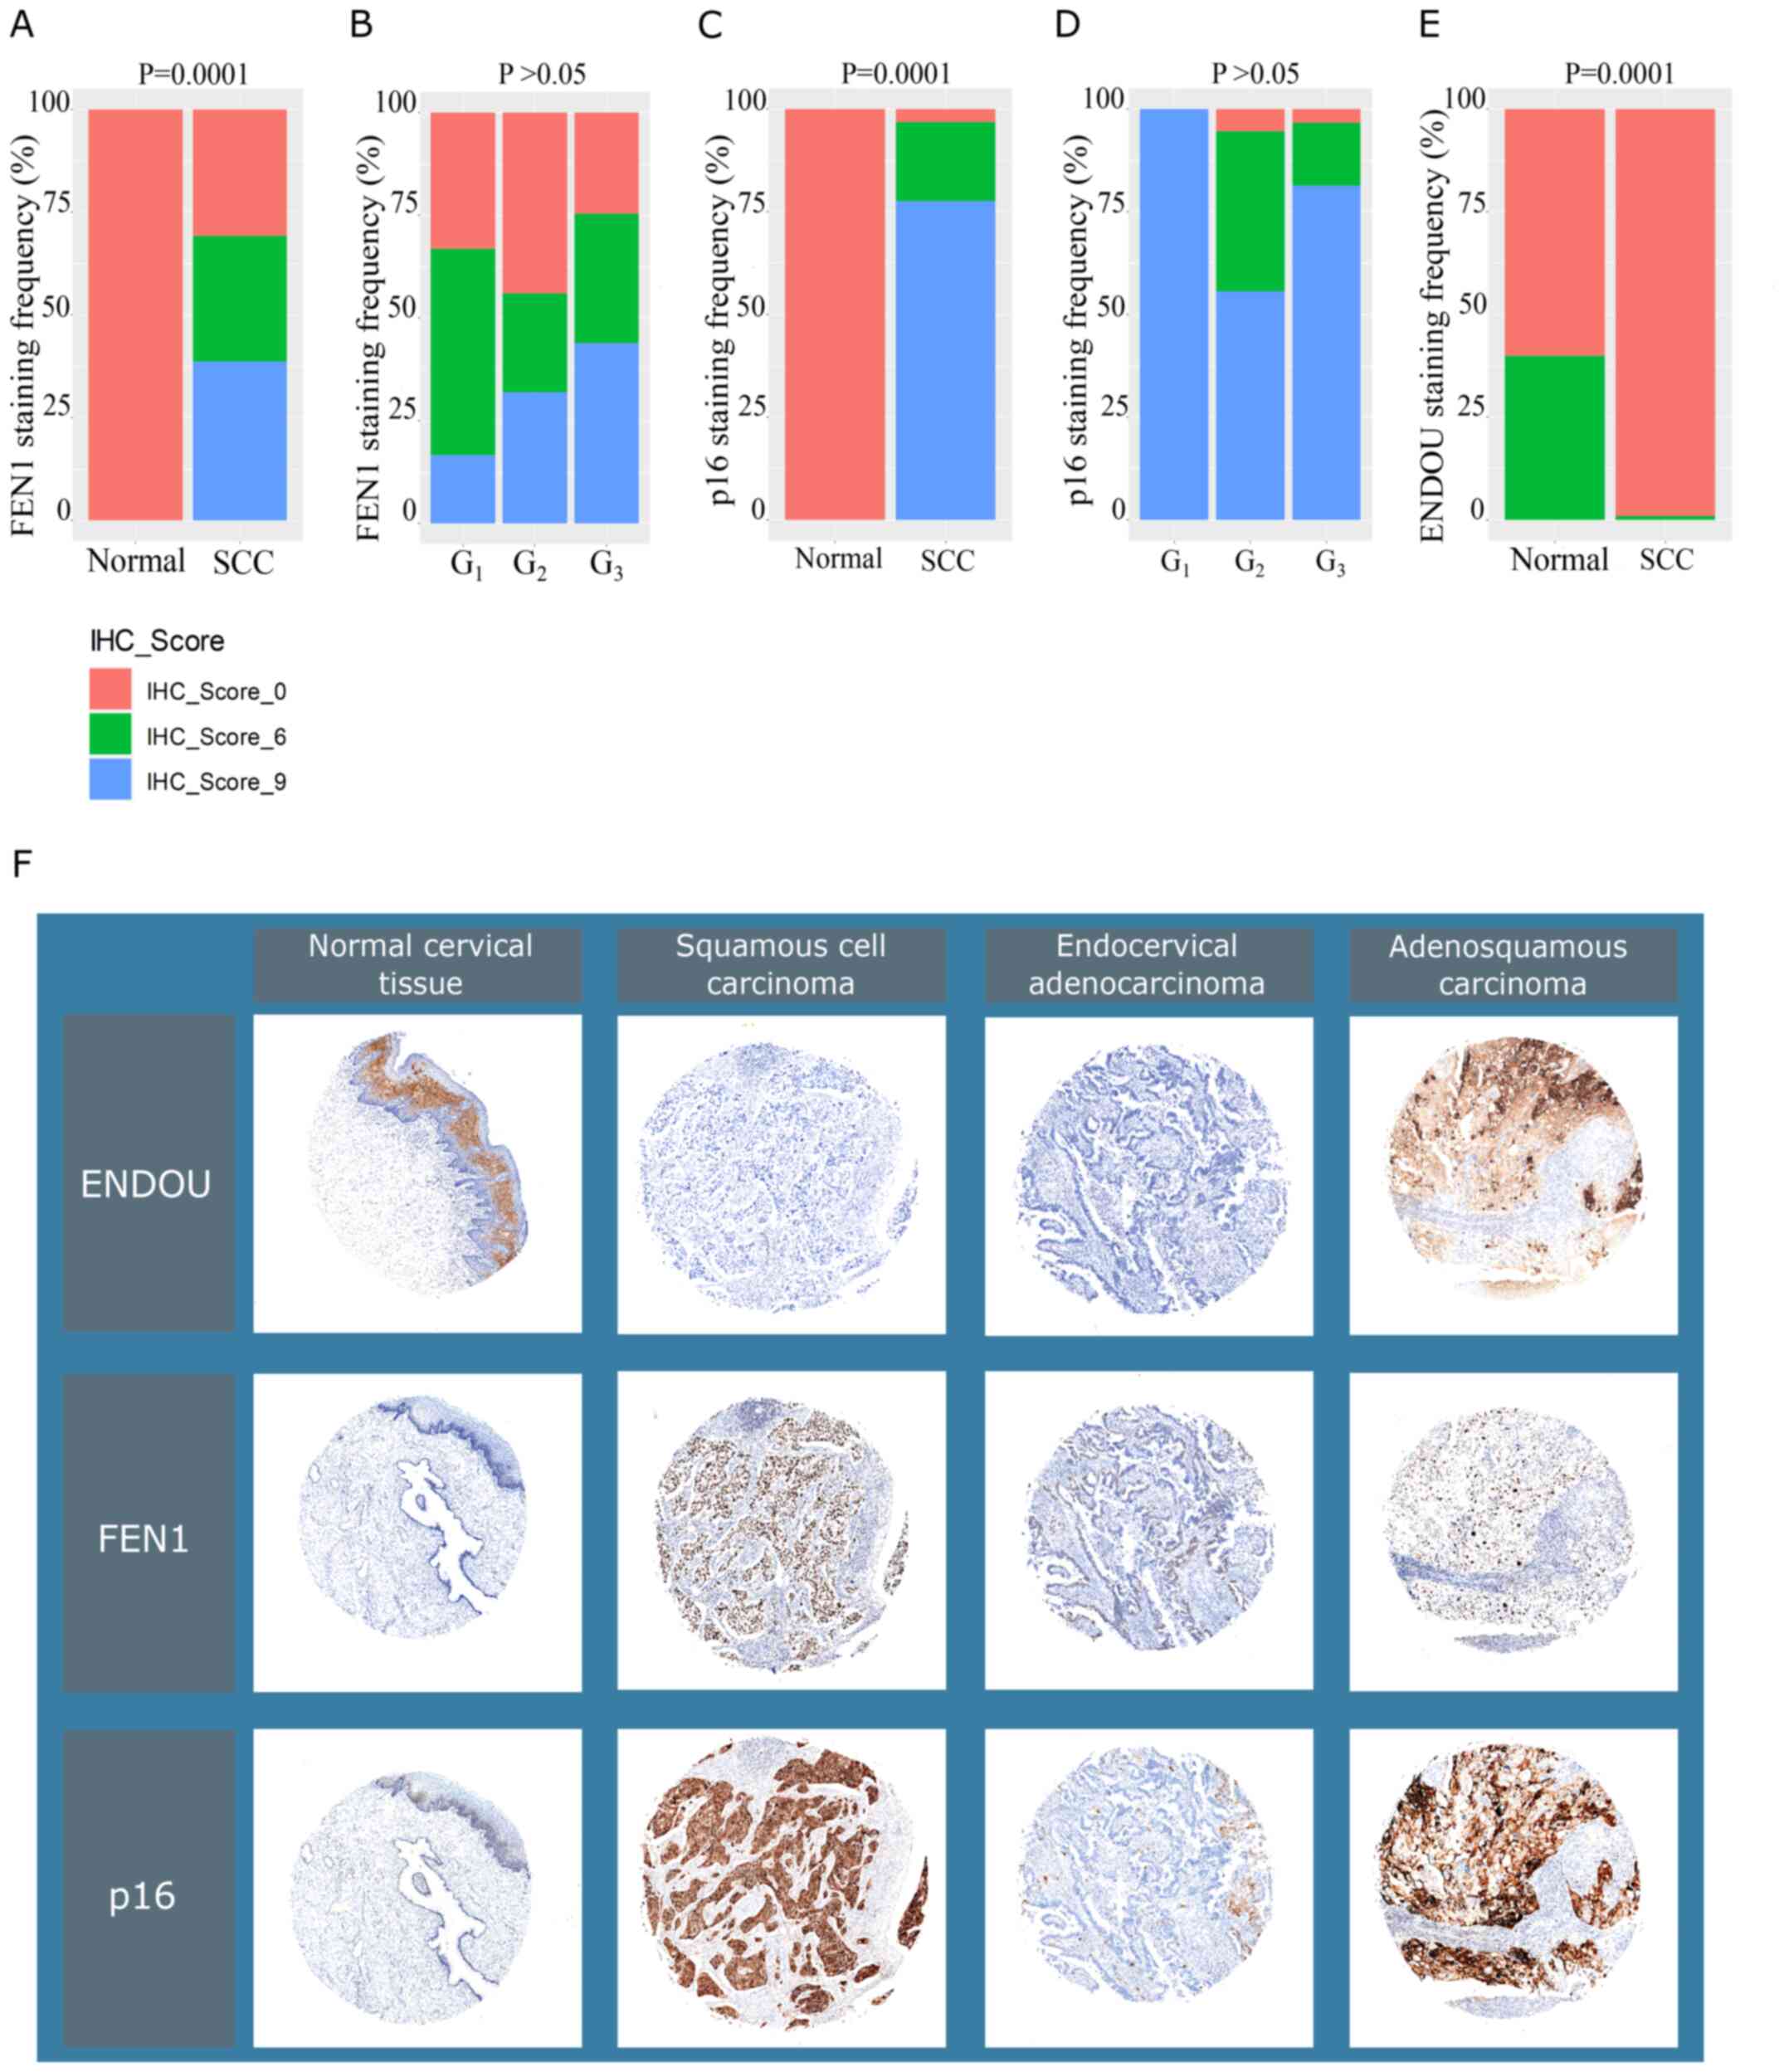 |
Figure 7.
Clinical validation of FEN1 and ENDOU in cervical biopsies. (A) Frequency distribution of FEN1 IHC scores in normal and SCC tissues. (B) Frequency distribution of FEN1 IHC scores across SCC grades. (C) Frequency distribution of p16 IHC scores in normal and SCC tissues. (D) Frequency distribution of p16 IHC scores across SCC grades. (E) Frequency distribution of ENDOU immunohistochemistry scores in normal and SCC tissues. (F) IHC analysis of FEN1, ENDOUand p16 expression levels. FEN1, flap structure-specific endonuclease 1;ENDOU, poly (U)-specific endoribonuclease; IHC, immunohistochemistry; SCC, squamous cell carcinoma.
|
Analysis of the association between different clinicopathological characteristics and FEN1 expression revealed a significant association between FEN1 and Ki67 expression levels (P<0.0001; Table II). However, no significant associations were observed between FEN1 expression and p16 staining, HPV16/18 staining, patient age, lymphatic spread, tumor grade or stage (Table II). The diagnostic accuracy of FEN1 staining compared with comparator tests is presented in Table III.
|
Table II.
Association between FEN1 expression and the clinicopathological characteristic.
|
Table II.
Association between FEN1 expression and the clinicopathological characteristic.
| |
|
FEN1 IHC score |
|
| |
|
|
|
| Characteristic |
Group |
IHC_Score_0 n (%) |
IHC_Score_6 n (%) |
IHC_Score_9 n (%) |
P-value |
| Age, years |
<60 |
28 (35.0) |
23 (30.0) |
28 (35.0) |
0.6500 |
| |
≥60 |
3 (23.1) |
4 (30.8) |
6 (46.1) |
|
| Tumor vs. normal |
SCC |
27 (30.7) |
27 (30.7) |
34 (38.6) |
0.0001 |
| |
Normal |
10 (100.0) |
0 (0.0) |
0 (0.0) |
|
| Grade |
G1 |
2 (33.3) |
3 (50.0) |
1 (16.7) |
0.3200 |
| |
G2 |
11 (44.0) |
6 (24.0) |
8 (32.0) |
|
| |
G3 |
14 (24.6) |
18 (31.6) |
25 (43.8) |
|
| Stage |
I |
18 (36.0) |
12 (24.0) |
20 (40.0) |
0.5200 |
| |
II |
11 (30.6) |
12 (33.3) |
13 (36.1) |
|
| |
III |
1 (20.0) |
3 (60.0) |
1 (20.0) |
|
| Regional lymph node involvement |
|
|
|
|
|
| |
N0 |
31 (34.4) |
25 (27.8) |
34 (37.8) |
0.6300 |
| |
N1 |
1 (25.0) |
2 (50.0) |
1 (25.0) |
|
| Ki67 IHC score |
– |
18 (81.8) |
2 (9.1) |
2 (9.1) |
<0.0001 |
| |
+ |
8 (26.7) |
15 (50) |
7 (23.3) |
|
| |
++ |
4 (15.4) |
7 (26.9) |
15 (57.7) |
|
| |
+++ |
2 (13.3) |
2 (13.3) |
11 (73.4) |
|
| HPV16/18 IHC score |
– |
0 (0.0) |
0 (0.0) |
1 (100.0) |
0.2300 |
| |
+ |
2 (12.5) |
4 (25.0) |
10 (62.5) |
|
| |
++ |
16 (37.2) |
15 (34.9) |
12 (27.9) |
|
| |
+++ |
10 (34.5) |
8 (27.6) |
11 (37.9) |
|
| p16 IHC score |
IHC_Score_0 |
1 (50.0) |
1 (50.0) |
0 (0.0) |
|
| |
IHC_Score_6 |
9 (50.0) |
6 (33.0) |
3 (17.0) |
0.2000 |
| |
IHC_Score_9 |
21 (29.2) |
20 (27.8) |
31 (43.0) |
|
|
Table III.
Diagnostic accuracy of FEN1 staining and comparator tests.
|
Table III.
Diagnostic accuracy of FEN1 staining and comparator tests.
| Biomarker |
Sensitivity (95% CI) |
Specificity (95% CI) |
PPV (95% CI) |
NPV (95% CI) |
| FEN1 |
0.69 (0.59–0.79) |
1.00 (0.69–1.00) |
1.00 (1.00–1.00) |
0.27 (0.21–0.34) |
| Ki67 |
0.76 (0.66–0.85) |
0.71 (0.29–0.96) |
0.97 (0.92–0.99) |
0.18 (0.11–0.29) |
| p16 |
0.97 (0.91–0.99) |
1.00 (0.69–1.00) |
1.00 (1.00–1.00) |
0.77 (0.52–0.91) |
ENDOU expression was detected in 1% of SCC cases and 40% of normal cervical tissues (P=0.0001; n=92; Fig. 7E and F). ENDOU expression was confined to the cytoplasm and cell membrane of the intermediary cell layer of the squamous epithelium. Strong positive staining of ENDOU was observed in one case of adenosquamous carcinoma (Fig. 7F).
Potential mechanisms of FEN1 and ENDOU function in cervical carcinogenesis
To determine the potential role of FEN1 and ENDOU in cervical carcinogenesis, the present study performed functional enrichment analysis to enrich FEN1- and ENDOU-related KEGG pathways and biological processes. As presented in Fig. 8C, high FEN1 expression was associated with increased GO terms, including ‘growth factor activity’, suppressed ‘immune response’ and ‘extracellular space’ in cervical tumors. In addition, the ‘Rap1 signaling pathway’, ‘MAPK signaling pathway’, ‘Ras signaling pathway’ and ‘PI3K-AKT signaling pathway’ were enriched in tumors expressing high levels of FEN1 (Fig. S1B). After constructing the gene concept network using meta-DEGs, the interactions between FEN1 and cyclins, CDKs and cell cycle regulators active in the G2/M phase of the cell cycle were analyzed (Fig. 8B), which was further confirmed by constructing a correlation matrix, which exhibited the highest correlation with cyclin B and CDK1 (Fig. 8D). To further verify this, single-sample gene set variation analysis was performed to calculate the score for the Hallmark G2/M checkpoint pathway using gene expression data from 254 patients with SCC included in TCGA-CESC cohort. The results revealed a positive correlation between FEN1 expression and G2/M score (R, 0.37; P<1.9×10⁻⁹; Fig. 8A). Furthermore, high G2/M score in patients with SCC was associated with a favorable outcome (Fig. S4).
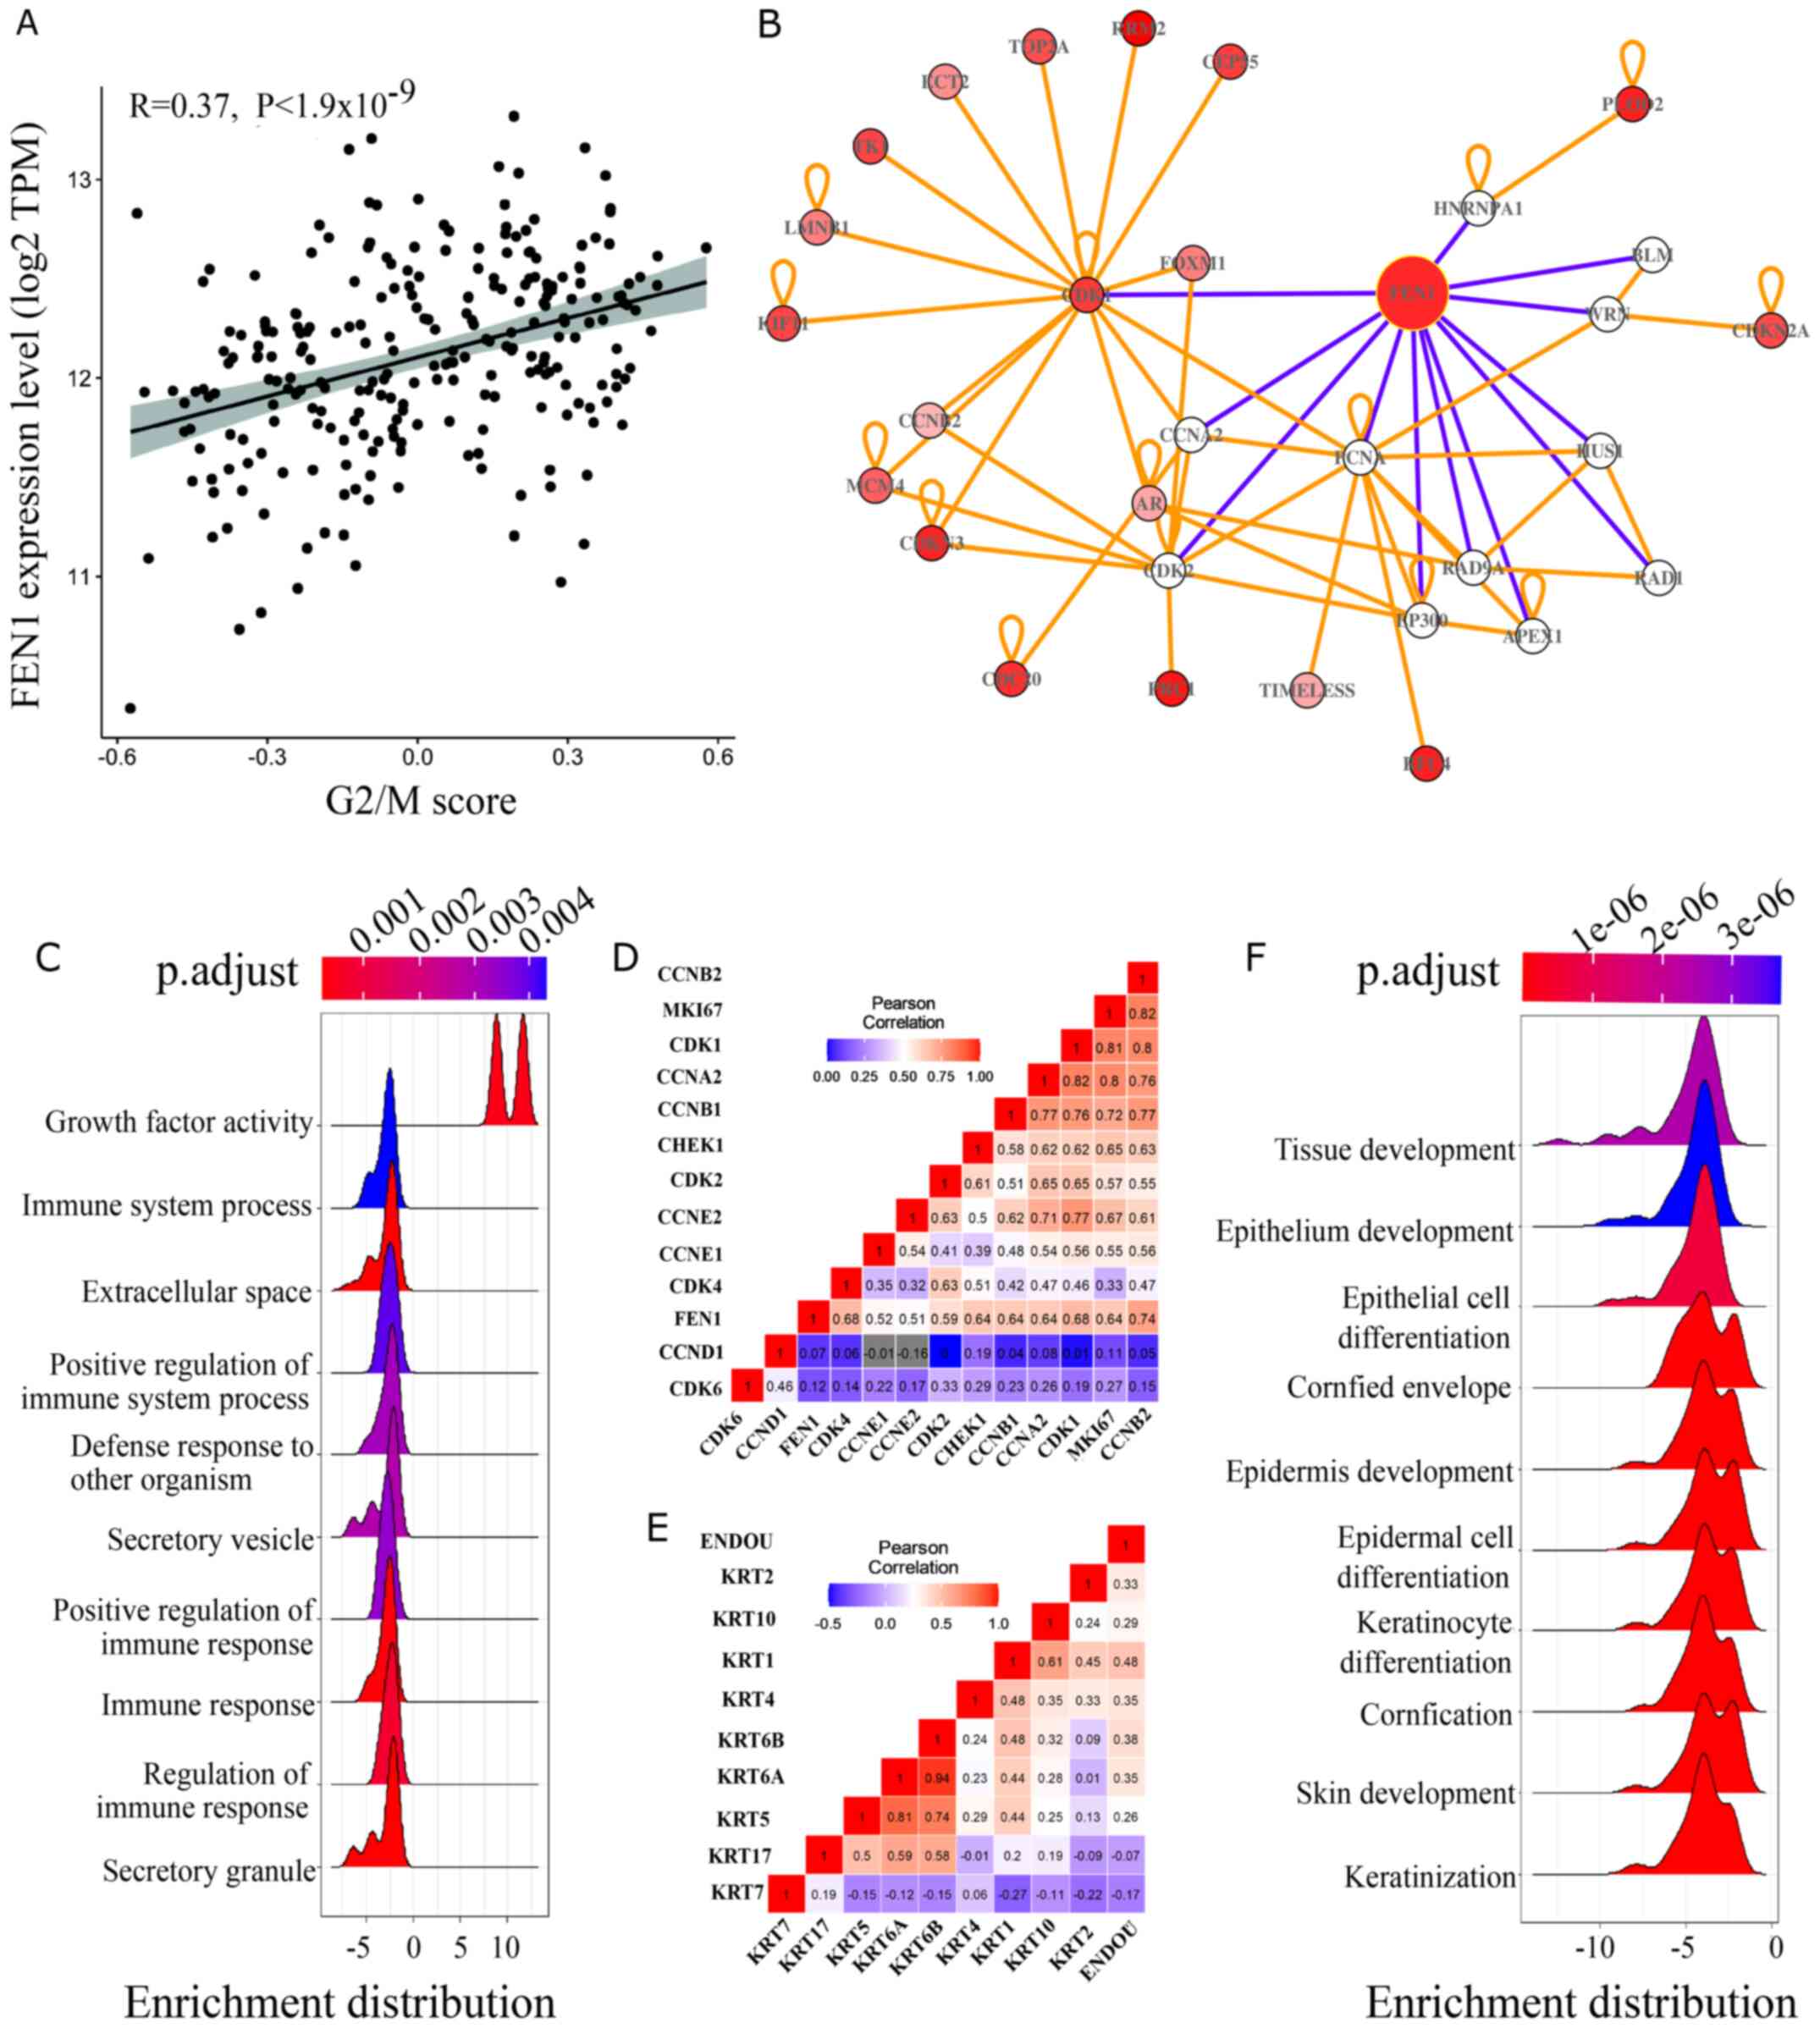 |
Figure 8.
Potential function of FEN1 and ENDOU in cervical carcinogenesis. (A) Pearson's correlation coefficient analysis plot of G2/M score and FEN1 expression in SCC tissues. (B) FEN1 concept network for prediction of gene function. (C) Ridge plot illustrating GO enrichment in cervical tumors expressing high levels of FEN1. (D) Correlation matrix between FEN1 and phase-specific cyclins, CDKs and regulators. (E) Correlation matrix between ENDOU and different cytokeratins. (F) Ridge plot illustrating Gene Set Enrichment Analysis, GO enrichment in cervical tumors expressing high levels of ENDOU. FEN1, flap structure-specific endonuclease 1; ENDOU, poly (U)-specific endoribonuclease; SCC, squamous cell carcinoma; GO, Gene Ontology.
|
GO and KEGG pathway analyses revealed a significant association between ENDOU and tissue development and differentiation, which was further highlighted by the correlation matrix between ENDOU and epithelial differentiation markers in the cervical epithelium, including different cytokeratins (Figs. 8E and F, and S1C).
Discussion
The present study performed an integrative meta-analysis approach to analyze gene expression profiles from 10 individual cervical cancer cohorts. The result of the meta-analysis was validated with a barrage of systems biology tools and subsequently used to identify a set of suitable biomarkers associated with malignant transformation of cervical epithelium that may eventually aid in the diagnostic or prognostic evaluation of the disease. The deregulated metatranscriptome overlapped to a large extent with the differential transcriptome of TCGA-CESC, one of the largest comprehensive genomic studies of cervical cancer to date (62). Compared with TCGA-CESC, the metatranscriptome offers additional insight into the gene expression profiles of normal cervical tissues (n=120 vs. n=3), which should provide a stronger basis for biomarker discovery (62). As a proof of concept, the diagnostic and prognostic applicability of FEN1 and ENDOU were investigated in independent cohorts of patients with cervical carcinoma.
FEN1 is an endonuclease that plays a critical role in DNA replication and repair in fast-dividing cells, such as cancer cells (28,34). FEN1 has been reported to be overexpressed in common malignancies, including breast (33), gallbladder (32), ovarian (33), lung (34), prostate (36), esophageal (37), testicular (35), hepatocellular (37), gastric (37) and brain tumors (35,38). Conversely, non-growing cells and terminally differentiated epithelium express low, frequently non-detectable FEN1 levels (70,71). This suggests that FEN1 may be used as a relevant diagnostic and/or prognostic biomarker for malignant transformation (33,71). The results of the present study demonstrated that FEN1 is expressed at significantly high levels in cervical SCC, which allows for relatively high diagnostic accuracy of the FEN1 transcript in discriminating diseased tissue from normal cervical tissue. In addition, FEN1 transcript levels were strongly correlated with the expression of the proliferation marker, Ki67. This observation was confirmed via IHC analysis, which demonstrated upregulation of FEN1 in ~65% of investigated tumors, where it was strongly associated with the expression of Ki67 protein. A strong positive correlation between FEN1 and Ki67 has previously been reported in non-small cell lung carcinoma (71), suggesting that overexpression of FEN1 can confer a proliferative advantage to tumors with high FEN1 phenotype. Furthermore, He et al demonstrated that deregulation of FEN1 also triggers tumor initiation and progression (34). In the present study, FEN1 expression was not detected in Ki67-positive, non-malignant cervical tissues. Compared with p16, FEN1 staining in SCC specimens demonstrated lower sensitivity but identical specificity. Thus, ~70% of p16 positive tumors overexpressed FEN1. As demonstrated by poor correlation with p16 transcript, as well as lack of association with p16 and HPV16/18 (E6/E7) staining, overexpression of FEN1 does not appear to reflect the dominant paradigm for HPV carcinogenesis revolving around G1/S transition (6,7). It appears to be part of a more general mechanism of malignant transformation supported by PAN cancer analysis; however, it does not exhibit more pronounced overexpression in HPV positive tumors. Being a crucial member of DNA damage response machinery (DDR), FEN1 may also be hijacked by HPV to enhance its genome amplification (30,72,73). Compared with HPV18, HPV16 uses DDR machinery to temporarily suppress E6/E7 expression, and activates the G2/M checkpoint via E4 (74). Thus, HPV16 establishes G2 arrest, which boosts viral replication (72,74). Similarly, Rosty et al identified FEN1 as a member of the cervical cancer proliferation cluster, which is significantly associated with HPV18 but not HPV16 E6/E7 transcript levels (69). This may explain the lack of association between p16 and E6/E7, with FEN1 expression observed in the present study, though most of the examined tumors were HPV16-positive. When constructing a gene concept network to infer the role of FEN1 in cervical carcinogenesis in the context of the deregulated metatranscriptome, the present study observed significant interactions between FEN1 and cyclins, CDKs and regulators of the G2/M phase of the cell cycle, placing significant activity of deregulated FEN1 in the G2 phase of the cell cycle as previously indicated by Zhang et al (71). In the present study, FEN1 expression in individual cervical tumors was positively correlated with the G2/M pathway score. Construction of the correlation matrix between FEN1 expression and pivotal cell cycle regulators has demonstrated a high correlation with cyclin B2 expression, suggesting involvement of FEN1 in replication stress regulation, premature centriole disengagement and chromosomal instability in cervical tumors (75). All of these processes are associated with modulation of treatment response in different epithelial tumors (75,76). Cervical tumors with high FEN1 expression levels exhibit inhibition of the host immune response, as well as augmented growth factor signaling, ECM remodeling, and activation of Rap1, MAPK, Ras and PI3K-AKT pathways, which may also facilitate establishment of an environment that allows for rapid amplification of viral genome during conditional G2 arrest (72,73,77). Contrary to glioma, lung, breast, ovarian, hepatocellular, esophageal, gastric and colorectal cancer (33,34,37,38), the results of the present study did not demonstrate a significant association between FEN1 expression and disease progression or outcome in cervical SCC. This may be due to the cohort size, diversity of treatment strategies or a specific feature of the SCC; thus, further studies are required to validate the results presented here. After clustering patients with SCC, according to administrated treatment, a trend for favorable clinical outcome (P=0.077) may be speculated in pharmacologically treated patients with SCC, with high FEN1 expression levels, which was also observed in HPV positive head and neck tumors. Contrary to breast and pancreatic carcinoma (78,79), G2/M pathway score is associated with favorable clinical outcomes in cervical SCC, probably due to an intact G2/M checkpoint function (80).
ENDOU is a widely disseminated, yet not well understood, uridylate-specific endoribonuclease deregulated in several tumor types (40–42,81). Loss of ENDOU expression in head and neck carcinoma, as well as evidence of its tumor suppressor role in vitro has recently been demonstrated (30). ENDOU was also reported to regulate c-Myc expression, cell proliferation and nucleotide metabolism via fine-tuning of mRNA stability in tumor cells (40,41,70,71). The previously indicated selective cytotoxicity of ENDOU against tumor cells (39,40,81,82) and its deregulation in cervical carcinogenesis observed in the present study may indicate the potential benefits of its pharmacological modulation in patients with cervical carcinoma. Similarly, the results of the present study demonstrated that cervical tumors with low ENDOU expression were characterized by the molecular phenotype associated with poorer differentiation, as well as perturbation in certain pathways, including transcriptional regulation in cancer, growth factor and kinase signaling. However, despite observing a consistent downregulation of ENDOU transcript across all integrated studies and its high diagnostic accuracy to discriminate malignant from normal cervical tissues, the genomic data could not be directly translated into immunohistochemical assays as ENDOU protein expression was not observed in all normal tissues. If this was a consequence of the tissue collection method, antigen stabilization procedure or post-transcriptional regulation (83) need to be addressed in future studies including a larger array of normal cervical tissues.
The present study is not without limitations. First, there was an unbalanced number of specimens from the normal and diseased groups included in the tissue arrays, which potentially introduced bias. Another possible source of bias may be IHC scoring, which was performed by only one senior pathologist. However, association of FEN1 IHC score with p16 and Ki67 protein expression mirrors correlation of their transcript levels. Moreover, all three biomarkers are regulated predominantly at the transcriptional level (84–86).
The present study performed the largest metatranscriptome analysis of cervical SCC to date, which may be useful for identifying relevant candidate biomarkers for the diagnosis and prognosis of cervical cancer. The results demonstrated that FEN1 and ENDOU may act as important regulators of malignant transformation in the cervix, with potential diagnostic value. FEN1 demonstrated lower sensitivity compared with p16 but higher specificity compared with Ki67, suggesting that FEN1 may be used as a combined marker with p16; however, it cannot replace it. Further studies are required to evaluate the diagnostic value of FEN1 and to verify the results presented here.
Supplementary Material
Supporting Data
Acknowledgements
Not applicable.
Funding
The present study was supported by the Dalarna County Council (grant no. CKFUU-936869 to VB).
Availability of data and materials
The datasets generated and/or analyzed during the present study are available in the GEO repository (https://www.ncbi.nlm.nih.gov/geo) or ArrayExpress EML-EBI (https://www.ebi.ac.uk/arrayexpress).
Authors' contributions
VB designed the study, analyzed and interpreted the patient data and drafted the initial manuscript. TT designed the study, performed the histological experiments and IHC scoring, and was a major contributor in drafting the initial manuscript. BZ and JD performed the experiments, analyzed the patient data and were contributors in drafting the initial manuscript. UP contributed to study design and was a major contributor in drafting the initial manuscript. All authors confirmed the authenticity of the raw data, and have read and approved the final manuscript.
Ethics approval and consent to participate
Not applicable.
Patient consent for publication
Not applicable.
Competing interests
The authors declare that they have no competing interests.
References
|
1
|
Arbyn M, Weiderpass E, Bruni L, de Sanjosé S, Saraiya M, Ferlay J and Bray F: Estimates of incidence and mortality of cervical cancer in 2018: A worldwide analysis. Lancet Glob Health. 8:e191–e203. 2020. View Article : Google Scholar : PubMed/NCBI
|
|
2
|
Maher EJ and Denton A: Survivorship, late effects and cancer of the cervix. Clin Oncol (R Coll Radiol). 20:479–487. 2008. View Article : Google Scholar : PubMed/NCBI
|
|
3
|
Waggoner SE: Cervical cancer. Lancet. 361:2217–2225. 2003. View Article : Google Scholar : PubMed/NCBI
|
|
4
|
Arbyn M, Tommasino M, Depuydt C and Dillner J: Are 20 human papillomavirus types causing cervical cancer? J Pathol. 234:431–435. 2014. View Article : Google Scholar : PubMed/NCBI
|
|
5
|
Walboomers JM, Jacobs MV, Manos MM, Bosch FX, Kummer JA, Shah KV, Snijders PJ, Peto J, Meijer CJ and Muñoz N: Human papillomavirus is a necessary cause of invasive cervical cancer worldwide. J Pathol. 189:12–19. 1999. View Article : Google Scholar : PubMed/NCBI
|
|
6
|
Ibeanu OA: Molecular pathogenesis of cervical cancer. Cancer Biol Ther. 11:295–306. 2011. View Article : Google Scholar : PubMed/NCBI
|
|
7
|
Arvanitis DA and Spandidos DA: Deregulation of the G1/S phase transition in cancer and squamous intraepithelial lesions of the uterine cervix: A case control study. Oncol Rep. 20:751–760. 2008.PubMed/NCBI
|
|
8
|
von Knebel Doeberitz M, Reuschenbach M, Schmidt D and Bergeron C: Biomarkers for cervical cancer screening: The role of p16(INK4a) to highlight transforming HPV infections. Expert Rev Proteomics. 9:149–163. 2012. View Article : Google Scholar : PubMed/NCBI
|
|
9
|
Malumbres M and Barbacid M: To cycle or not to cycle: A critical decision in cancer. Nat Rev Cancer. 1:222–231. 2001. View Article : Google Scholar : PubMed/NCBI
|
|
10
|
Gaillard H, García-Muse T and Aguilera A: Replication stress and cancer. Nat Rev Cancer. 15:276–289. 2015. View Article : Google Scholar : PubMed/NCBI
|
|
11
|
Crozier L, Foy R, Mouery BL, Whitaker RH, Corno A, Spanos C, Ly T, Cook JG and Saurin AT: CDK4/6 inhibitors induce replication stress to cause long-term cell cycle withdrawal. bioRxiv: 2021. doi.org/10.1101/2021.02.03.428245 (Preprint).
|
|
12
|
Spardy N, Covella K, Cha E, Hoskins EE, Wells SI, Duensing A and Duensing S: Human papillomavirus 16 E7 oncoprotein attenuates DNA damage checkpoint control by increasing the proteolytic turnover of claspin. Cancer Res. 69:7022–7029. 2009. View Article : Google Scholar : PubMed/NCBI
|
|
13
|
Yu LL, Guo HQ, Lei XQ, Qin Y, Wu ZN, Kang LN, Zhang X, Qiao YL and Chen W: p16/Ki-67 co-expression associates high risk human papillomavirus persistence and cervical histopathology: A 3-year cohort study in China. Oncotarget. 7:64810–64819. 2016. View Article : Google Scholar : PubMed/NCBI
|
|
14
|
Reuschenbach M, Wentzensen N, Dijkstra MG, von Knebel Doeberitz M and Arbyn M: p16INK4a immunohistochemistry in cervical biopsy specimens: A systematic review and meta-analysis of the interobserver agreement. Am J Clin Pathol. 142:767–772. 2014. View Article : Google Scholar : PubMed/NCBI
|
|
15
|
Lim S, Lee MJ, Cho I, Hong R and Lim SC: Efficacy of p16 and Ki-67 immunostaining in the detection of squamous intraepithelial lesions in a high-risk HPV group. Oncol Lett. 11:1447–1452. 2016. View Article : Google Scholar : PubMed/NCBI
|
|
16
|
Tsoumpou I, Arbyn M, Kyrgiou M, Wentzensen N, Koliopoulos G, Martin-Hirsch P, Malamou-Mitsi V and Paraskevaidis E: p16(INK4a) immunostaining in cytological and histological specimens from the uterine cervix: A systematic review and meta-analysis. Cancer Treat Rev. 35:210–220. 2009. View Article : Google Scholar : PubMed/NCBI
|
|
17
|
Gonçalves JES, de Andrade CV, Russomano FB, Nuovo G, Amaro-Filho SM, Carvalho MOO and Nicol AF: The role of p16 as putative biomarker for cervical neoplasia: A controversial issue? MedicalExpress. 4:M1706012017.
|
|
18
|
Zhai Y, Kuick R, Nan B, Ota I, Weiss SJ, Trimble CL, Fearon ER and Cho KR: Gene expression analysis of preinvasive and invasive cervical squamous cell carcinomas identifies HOXC10 as a key mediator of invasion. Cancer Res. 67:10163–10172. 2007. View Article : Google Scholar : PubMed/NCBI
|
|
19
|
Scotto L, Narayan G, Nandula SV, Arias-Pulido H, Subramaniyam S, Schneider A, Kaufmann AM, Wright JD, Pothuri B, Mansukhani M, et al: Identification of copy number gain and overexpressed genes on chromosome arm 20q by an integrative genomic approach in cervical cancer: Potential role in progression. Genes Chromosomes Cancer. 47:755–765. 2008. View Article : Google Scholar : PubMed/NCBI
|
|
20
|
Pyeon D, Newton MA, Lambert PF, den Boon JA, Sengupta S, Marsit CJ, Woodworth CD, Connor JP, Haugen TH, Smith EM, et al: Fundamental differences in cell cycle deregulation in human papillomavirus-positive and human papillomavirus-negative head/neck and cervical cancers. Cancer Res. 67:4605–4619. 2007. View Article : Google Scholar : PubMed/NCBI
|
|
21
|
Pappa KI, Polyzos A, Jacob-Hirsch J, Amariglio N, Vlachos GD, Loutradis D and Anagnou NP: Profiling of Discrete Gynecological Cancers Reveals Novel Transcriptional Modules and Common Features Shared by Other Cancer Types and Embryonic Stem Cells. PLoS One. 10:e01422292015. View Article : Google Scholar : PubMed/NCBI
|
|
22
|
Harding NJSH, How C, Saha S, Hui AB, Chong LC, Yan R, Fei-Fei Liu FF and Kasprzyk A: Identification and Correction of Amplification Protocol Bias in Microarray Studies, arrayexpress-repository. 2014. https://www.ebi.ac.uk/arrayexpress/experiments/E-GEOD-42764/July 27–2020
|
|
23
|
Winder DM, Chattopadhyay A, Muralidhar B, Bauer J, English WR, Zhang X, Karagavriilidou K, Roberts I, Pett MR, Murphy G, et al: Overexpression of the oncostatin M receptor in cervical squamous cell carcinoma cells is associated with a pro-angiogenic phenotype and increased cell motility and invasiveness. J Pathol. 225:448–462. 2011. View Article : Google Scholar : PubMed/NCBI
|
|
24
|
den Boon JA, Pyeon D, Wang SS, Horswill M, Schiffman M, Sherman M, Zuna RE, Wang Z, Hewitt SM, Pearson R, et al: Molecular transitions from papillomavirus infection to cervical precancer and cancer: Role of stromal estrogen receptor signaling. Proc Natl Acad Sci USA. 112:E3255–E3264. 2015. View Article : Google Scholar : PubMed/NCBI
|
|
25
|
Medina-Martinez I, Barrón V, Roman-Bassaure E, Juárez-Torres E, Guardado-Estrada M, Espinosa AM, Bermudez M, Fernández F, Venegas-Vega C, Orozco L, et al: Impact of gene dosage on gene expression, biological processes and survival in cervical cancer: A genome-wide follow-up study. PLoS One. 9:e978422014. View Article : Google Scholar : PubMed/NCBI
|
|
26
|
Biewenga P, Buist MR, Moerland PD, Ver Loren van Themaat E, van Kampen AH, ten Kate FJ and Baas F: Gene expression in early stage cervical cancer. Gynecol Oncol. 108:520–526. 2008. View Article : Google Scholar : PubMed/NCBI
|
|
27
|
Sharma S, Mandal P, Sadhukhan T, Roy Chowdhury R, Ranjan Mondal N, Chakravarty B, Chatterjee T, Roy S and Sengupta S: Bridging Links between Long Noncoding RNA HOTAIR and HPV Oncoprotein E7 in Cervical Cancer Pathogenesis. Sci Rep. 5:117242015. View Article : Google Scholar : PubMed/NCBI
|
|
28
|
Warbrick E, Coates PJ and Hall PA: Fen1 expression: A novel marker for cell proliferation. J Pathol. 186:319–324. 1998. View Article : Google Scholar : PubMed/NCBI
|
|
29
|
Sharma S, Sommers JA, Gary RK, Friedrich-Heineken E, Hübscher U and Brosh RM Jr: The interaction site of Flap Endonuclease-1 with WRN helicase suggests a coordination of WRN and PCNA. Nucleic Acids Res. 33:6769–6781. 2005. View Article : Google Scholar : PubMed/NCBI
|
|
30
|
Becker JR, Gallo D, Leung W, Croissant T, Thu YM, Nguyen HD, Starr TK, Brown GW and Bielinsky AK: Flap endonuclease overexpression drives genome instability and DNA damage hypersensitivity in a PCNA-dependent manner. Nucleic Acids Res. 46:5634–5650. 2018. View Article : Google Scholar : PubMed/NCBI
|
|
31
|
Singh P, Yang M, Dai H, Yu D, Huang Q, Tan W, Kernstine KH, Lin D and Shen B: Overexpression and hypomethylation of flap endonuclease 1 gene in breast and other cancers. Mol Cancer Res. 6:1710–1717. 2008. View Article : Google Scholar : PubMed/NCBI
|
|
32
|
Jiao X, Wu Y, Zhou L, He J, Yang C, Zhang P, Hu R, Luo C, Du J, Fu J, et al: Variants and haplotypes in Flap endonuclease 1 and risk of gallbladder cancer and gallstones: A population-based study in China. Sci Rep. 5:181602015. View Article : Google Scholar : PubMed/NCBI
|
|
33
|
Abdel-Fatah TMA, Russell R, Albarakati N, Maloney DJ, Dorjsuren D, Rueda OM, Moseley P, Mohan V, Sun H, Abbotts R, et al: Genomic and protein expression analysis reveals flap endonuclease 1 (FEN1) as a key biomarker in breast and ovarian cancer. Mol Oncol. 8:1326–1338. 2014. View Article : Google Scholar : PubMed/NCBI
|
|
34
|
He L, Luo L, Zhu H, Yang H, Zhang Y, Wu H, Sun H, Jiang F, Kathera CS, Liu L, et al: FEN1 promotes tumor progression and confers cisplatin resistance in non-small-cell lung cancer. Mol Oncol. 11:640–654. 2017. View Article : Google Scholar : PubMed/NCBI
|
|
35
|
Nikolova T, Christmann M and Kaina B: FEN1 is overexpressed in testis, lung and brain tumors. Anticancer Res. 29:2453–2459. 2009.PubMed/NCBI
|
|
36
|
Urbanucci A, Sahu B, Seppälä J, Larjo A, Latonen LM, Waltering KK, Tammela TL, Vessella RL, Lähdesmäki H, Jänne OA, et al: Overexpression of androgen receptor enhances the binding of the receptor to the chromatin in prostate cancer. Oncogene. 31:2153–2163. 2012. View Article : Google Scholar : PubMed/NCBI
|
|
37
|
Liu L, Zhou C, Zhou L, Peng L, Li D, Zhang X, Zhou M, Kuang P, Yuan Q, Song X, et al: Functional FEN1 genetic variants contribute to risk of hepatocellular carcinoma, esophageal cancer, gastric cancer and colorectal cancer. Carcinogenesis. 33:119–123. 2012. View Article : Google Scholar : PubMed/NCBI
|
|
38
|
Chen Y-D, Zhang X, Qiu X-G, Li J, Yuan Q, Jiang T and Yang M: Functional FEN1 genetic variants and haplotypes are associated with glioma risk. J Neurooncol. 111:145–151. 2013. View Article : Google Scholar : PubMed/NCBI
|
|
39
|
Jia F, Chi C and Han M: Regulation of Nucleotide Metabolism and Germline Proliferation in Response to Nucleotide Imbalance and Genotoxic Stresses by EndoU Nuclease. Cell Rep. 30:1848–1861.e1845. 2020. View Article : Google Scholar : PubMed/NCBI
|
|
40
|
Xu C, Zhang Y, Shen Y, Shi Y, Zhang M and Zhou L: Integrated Analysis Reveals ENDOU as a Biomarker in Head and Neck Squamous Cell Carcinoma Progression. Front Oncol. 10:5223322021. View Article : Google Scholar : PubMed/NCBI
|
|
41
|
Inaba N, Renk T, Daume E and Bohn H: Ectopic production of placenta-‘specific’ tissue proteins (PP5 and PP11) by malignant breast tumors. Arch Gynecol. 231:87–90. 1981. View Article : Google Scholar : PubMed/NCBI
|
|
42
|
Inaba N, Ishige H, Ijichi M, Satoh N, Ohkawa R, Sekiya S, Shirotake S, Takamizawa H, Renk T and Bohn H: Immunohistochemical detection of pregnancy-specific protein (SP1) and placenta-specific tissue proteins (PP5, PP10, PP11 and PP12) in ovarian adenocarcinomas. Oncodev Biol Med. 3:379–389. 1982.PubMed/NCBI
|
|
43
|
Huber W, Carey VJ, Gentleman R, Anders S, Carlson M, Carvalho BS, Bravo HC, Davis S, Gatto L, Girke T, et al: Orchestrating high-throughput genomic analysis with Bioconductor. Nat Methods. 12:115–121. 2015. View Article : Google Scholar : PubMed/NCBI
|
|
44
|
Gautier L, Cope L, Bolstad BM and Irizarry RA: affy - analysis of Affymetrix GeneChip data at the probe level. Bioinformatics. 20:307–315. 2004. View Article : Google Scholar : PubMed/NCBI
|
|
45
|
Carvalho BS and Irizarry RA: A framework for oligonucleotide microarray preprocessing. Bioinformatics. 26:2363–2367. 2010. View Article : Google Scholar : PubMed/NCBI
|
|
46
|
Du P, Kibbe WA and Lin SM: lumi: A pipeline for processing Illumina microarray. Bioinformatics. 24:1547–1548. 2008. View Article : Google Scholar : PubMed/NCBI
|
|
47
|
Smyth GK: Linear models and empirical bayes methods for assessing differential expression in microarray experiments. Stat Appl Genet Mol Biol. 3:Article32004. View Article : Google Scholar : PubMed/NCBI
|
|
48
|
Prada C LD and Nakaya H: MetaVolcanoR: Gene Expression Meta-analysis Visualization Tool. R package version 1.3.0. 2020.https://www.bioconductor.org/packages/release/bioc/html/MetaVolcanoR.html
|
|
49
|
Viechtbauer W: Conducting Meta-Analyses in R with The metafor Package. Journal of Statistical Software. 36:1–48. 2010. View Article : Google Scholar
|
|
50
|
Harrison PF, Pattison AD, Powell DR and Beilharz TH: Topconfects: A package for confident effect sizes in differential expression analysis provides a more biologically useful ranked gene list. Genome Biol. 20:672019. View Article : Google Scholar : PubMed/NCBI
|
|
51
|
Xia J, Gill EE and Hancock RE: NetworkAnalyst for statistical, visual and network-based meta-analysis of gene expression data. Nat Protoc. 10:823–844. 2015. View Article : Google Scholar : PubMed/NCBI
|
|
52
|
Leek JT, Johnson WE, Parker HS, Jaffe AE and Storey JD: The sva package for removing batch effects and other unwanted variation in high-throughput experiments. Bioinformatics. 28:882–883. 2012. View Article : Google Scholar : PubMed/NCBI
|
|
53
|
Huang W, Sherman BT and Lempicki RA: Bioinformatics enrichment tools: Paths toward the comprehensive functional analysis of large gene lists. Nucleic Acids Res. 37:1–13. 2009. View Article : Google Scholar : PubMed/NCBI
|
|
54
|
Kulinskaya E and Dollinger MB: An accurate test for homogeneity of odds ratios based on Cochran's Q-statistic. BMC Med Res Methodol. 15:492015. View Article : Google Scholar : PubMed/NCBI
|
|
55
|
Riley RD, Higgins JPT and Deeks JJ: Interpretation of random effects meta-analyses. BMJ. 342:d5492011. View Article : Google Scholar : PubMed/NCBI
|
|
56
|
Yu G, Wang L-G, Yan G-R and He Q-Y: DOSE: An R/Bioconductor package for disease ontology semantic and enrichment analysis. Bioinformatics. 31:608–609. 2015. View Article : Google Scholar : PubMed/NCBI
|
|
57
|
G Y: Enrichplot: Visualization of Functional Enrichment Result. R package version 1.8.1. 2020. https://bioconductor.org/packages/release/bioc/html/enrichplot.html
|
|
58
|
Szklarczyk D, Gable AL, Lyon D, Junge A, Wyder S, Huerta-Cepas J, Simonovic M, Doncheva NT, Morris JH, Bork P, et al: STRING v11: Protein-protein association networks with increased coverage, supporting functional discovery in genome-wide experimental datasets. Nucleic Acids Res. 47D:D607–D613. 2019. View Article : Google Scholar : PubMed/NCBI
|
|
59
|
Feng G, Shaw P, Rosen ST, Lin SM and Kibbe WA: Using the bioconductor GeneAnswers package to interpret gene lists. Methods Mol Biol. 802:101–112. 2012. View Article : Google Scholar : PubMed/NCBI
|
|
60
|
Subramanian A, Tamayo P, Mootha VK, Mukherjee S, Ebert BL, Gillette MA, Paulovich A, Pomeroy SL, Golub TR, Lander ES, et al: Gene set enrichment analysis: A knowledge-based approach for interpreting genome-wide expression profiles. Proc Natl Acad Sci USA. 102:15545–15550. 2005. View Article : Google Scholar : PubMed/NCBI
|
|
61
|
Hänzelmann S, Castelo R and Guinney J: GSVA: Gene set variation analysis for microarray and RNA-seq data. BMC Bioinformatics. 14:72013. View Article : Google Scholar : PubMed/NCBI
|
|
62
|
Cancer Genome Atlas Research NetworkAlbert Einstein College of MedicineAnalytical Biological ServicesBarretos Cancer HospitalBaylor College of MedicineBeckman Research Institute of City of HopeBuck Institute for Research on AgingCanada's Michael Smith Genome Sciences CentreHarvard Medical SchoolHelen F. Graham Cancer Center &Research Institute at Christiana Care Health Services, et al, . Integrated genomic and molecular characterization of cervical cancer. Nature. 543:378–384. 2017. View Article : Google Scholar : PubMed/NCBI
|
|
63
|
Colaprico A, Silva TC, Olsen C, Garofano L, Cava C, Garolini D, Sabedot TS, Malta TM, Pagnotta SM, Castiglioni I, et al: TCGAbiolinks: An R/Bioconductor package for integrative analysis of TCGA data. Nucleic Acids Res. 44:e71. 2016. View Article : Google Scholar : PubMed/NCBI
|
|
64
|
Villanueva RAM and Chen ZJ: ggplot2: Elegant Graphics for Data Analysis (2nd ed.). Measurement: Interdisciplinary Res Perspectives. 17:160–167. 2019.
|
|
65
|
Babion I, Miok V, Jaspers A, Huseinovic A, Steenbergen RDM, van Wieringen WN and Wilting SM: Identification of Deregulated Pathways, Key Regulators, and Novel miRNA-mRNA Interactions in HPV-Mediated Transformation. Cancers (Basel). 12:7002020. View Article : Google Scholar : PubMed/NCBI
|
|
66
|
Therneau TM and Terry M: A Package for Survival Analysis in R, 2020. https://CRAN.R-project.org/package=survival
|
|
67
|
Nagy Á, Munkácsy G and Győrffy B: Pancancer survival analysis of cancer hallmark genes. Sci Rep. 11:60472021. View Article : Google Scholar : PubMed/NCBI
|
|
68
|
Altman DG and De Stavola BL: Practical problems in fitting a proportional hazards model to data with updated measurements of the covariates. Stat Med. 13:301–341. 1994. View Article : Google Scholar : PubMed/NCBI
|
|
69
|
Rosty C, Sheffer M, Tsafrir D, Stransky N, Tsafrir I, Peter M, de Crémoux P, de La Rochefordière A, Salmon R, Dorval T, et al: Identification of a proliferation gene cluster associated with HPV E6/E7 expression level and viral DNA load in invasive cervical carcinoma. Oncogene. 24:7094–7104. 2005. View Article : Google Scholar : PubMed/NCBI
|
|
70
|
Kim I-S, Lee M-Y, Lee I-H, Shin S-L and Lee S-Y: Gene expression of flap endonuclease-1 during cell proliferation and differentiation. Biochim Biophys Acta. 1496:333–340. 2000. View Article : Google Scholar : PubMed/NCBI
|
|
71
|
Zhang K, Keymeulen S, Nelson R, Tong TR, Yuan YC, Yun X, Liu Z, Lopez J, Raz DJ and Kim JY: Overexpression of Flap Endonuclease 1 Correlates with Enhanced Proliferation and Poor Prognosis of Non-Small-Cell Lung Cancer. Am J Pathol. 188:242–251. 2018. View Article : Google Scholar : PubMed/NCBI
|
|
72
|
Moody C: Mechanisms by which HPV Induces a Replication Competent Environment in Differentiating Keratinocytes. Viruses. 9:2612017. View Article : Google Scholar : PubMed/NCBI
|
|
73
|
Chen J: Signaling pathways in HPV-associated cancers and therapeutic implications. Rev Med Virol. 25 (Suppl 1):24–53. 2015. View Article : Google Scholar : PubMed/NCBI
|
|
74
|
Egawa N, Wang Q, Griffin HM, Murakami I, Jackson D, Mahmood R and Doorbar J: HPV16 and 18 genome amplification show different E4-dependence, with 16E4 enhancing E1 nuclear accumulation and replicative efficiency via its cell cycle arrest and kinase activation functions. PLoS Pathog. 13:e10062822017. View Article : Google Scholar : PubMed/NCBI
|
|
75
|
Wilhelm T, Olziersky A-M, Harry D, De Sousa F, Vassal H, Eskat A and Meraldi P: Mild replication stress causes chromosome mis-segregation via premature centriole disengagement. Nat Commun. 10:35852019. View Article : Google Scholar : PubMed/NCBI
|
|
76
|
Zhang J, Dai Q, Park D and Deng X: Targeting DNA Replication Stress for Cancer Therapy. Genes (Basel). 7:512016. View Article : Google Scholar : PubMed/NCBI
|
|
77
|
Bordignon V, Di Domenico EG, Trento E, D'Agosto G, Cavallo I, Pontone M, Pimpinelli F, Mariani L and Ensoli F: How Human Papillomavirus Replication and Immune Evasion Strategies Take Advantage of the Host DNA Damage Repair Machinery. Viruses. 9:3902017. View Article : Google Scholar : PubMed/NCBI
|
|
78
|
Oshi M, Newman S, Tokumaru Y, Yan L, Matsuyama R, Endo I, Katz MHG and Takabe K: High G2M Pathway Score Pancreatic Cancer is Associated with Worse Survival, Particularly after Margin-Positive (R1 or R2) Resection. Cancers (Basel). 12:28712020. View Article : Google Scholar : PubMed/NCBI
|
|
79
|
Oshi M, Takahashi H, Tokumaru Y, Yan L, Rashid OM, Matsuyama R, Endo I and Takabe K: G2M Cell Cycle Pathway Score as a Prognostic Biomarker of Metastasis in Estrogen Receptor (ER)-Positive Breast Cancer. Int J Mol Sci. 21:29212020. View Article : Google Scholar : PubMed/NCBI
|
|
80
|
Cerciello F, Hofstetter B, Fatah SA, Zaghloul M, Odermatt B, Bodis S, Varga Z, Pruschy M and Ciernik IF: G2/M cell cycle checkpoint is functional in cervical cancer patients after initiation of external beam radiotherapy. Int J Radiat Oncol Biol Phys. 62:1390–1398. 2005. View Article : Google Scholar : PubMed/NCBI
|
|
81
|
Poe JC, Kountikov EI, Lykken JM, Natarajan A, Marchuk DA and Tedder TF: EndoU is a novel regulator of AICD during peripheral B cell selection. J Exp Med. 211:57–69. 2014. View Article : Google Scholar : PubMed/NCBI
|
|
82
|
Qi W, Gromoff EDV, Xu F, Zhao Q, Yang W, Pfeifer D, Maier W, Long L and Baumeister R: The secreted endoribonuclease ENDU-2 from the soma protects germline immortality in C. elegans. Nat Commun. 12:12622021. View Article : Google Scholar : PubMed/NCBI
|
|
83
|
Perl K, Ushakov K, Pozniak Y, Yizhar-Barnea O, Bhonker Y, Shivatzki S, Geiger T, Avraham KB and Shamir R: Reduced changes in protein compared to mRNA levels across non-proliferating tissues. BMC Genomics. 18:3052017. View Article : Google Scholar : PubMed/NCBI
|
|
84
|
Kotake Y, Naemura M, Murasaki C, Inoue Y and Okamoto H: Transcriptional Regulation of the p16 Tumor Suppressor Gene. Anticancer Res. 35:4397–4401. 2015.PubMed/NCBI
|
|
85
|
Hasan S, Stucki M, Hassa PO, Imhof R, Gehrig P, Hunziker P, Hübscher U and Hottiger MO: Regulation of human flap endonuclease-1 activity by acetylation through the transcriptional coactivator p300. Mol Cell. 7:1221–1231. 2001. View Article : Google Scholar : PubMed/NCBI
|
|
86
|
Uxa S, Castillo-Binder P, Kohler R, Stangner K, Müller GA and Engeland K: Ki-67 gene expression. Cell Death Differ. 1–14. 2021.PubMed/NCBI
|


