Introduction
Ovarian cancer (OC) is a leading cancer type among females and it is the deadliest form of gynecological tumor. Approximately 238,700 new cases of OC and 151,900 associated deaths are recorded each year worldwide (1). In the USA, 21,750 new OC cases and 13,940 deaths were predicted for 2020 (2). Of all OC cases, >90% are epithelial OC, which remains a critical global clinical challenge, as it is frequently diagnosed at later stages and metastases or recurrences are common (3). Hence, strategies for improving OC prognosis, such as by identifying early diagnostic biomarkers and therapeutic targets, are urgently required. Investigation of the molecular mechanisms underlying OC onset, progression and recurrence is key for early diagnosis, treatment planning and prognostic prediction.
Long non-coding RNAs (lncRNAs), which are known to affect a series of biological processes in a tissue- or cell type-specific manner (4–6), are transcripts with a length of >200 nucleotides (7). Rapidly accumulating evidence has indicated that lncRNAs regulate gene expression at the transcriptional, genomic and epigenetic levels in numerous cancer types (8). However, the majority of lncRNAs have remained to be functionally characterized. lncRNAs are hypothesized to act as competing endogenous RNA (ceRNA) sponges in complex ceRNA regulatory networks, binding to micro (mi)RNAs via miRNA response elements (9) and thereby altering miRNA-mediated inhibition of specific mRNAs. As described in the ceRNA hypothesis, ceRNAs are able to cross-regulate each other and they perform different regulatory functions according to their subcellular localization (10).
Numerous studies have demonstrated that lncRNA-miRNA- mRNA regulatory networks, and particularly lncRNAs, have key roles in a variety of cancer types (11–14), such as gastric cancer (15), hepatocellular carcinoma (16) and OC (17). However, the functions of lncRNAs and their ceRNA networks in human OC have remained largely elusive. Thus, it is urgently required to identify differentially expressed lncRNAs (DElncRNAs) and ceRNA regulatory networks in epithelial OC, which may lead to the discovery of novel diagnostic and prognostic biomarkers and treatments.
In the present study, the human long non-coding and coding transcriptomes between OC and healthy tissues were compared using RNA sequencing data from The Cancer Genome Atlas (TCGA) and the Genotype-Tissue Expression (GTEx) project. The processes of the study are summarized in a flowchart in Fig. 1 First, DElncRNAs and DEmRNAs were identified. Subsequently, miRcode was used to predict the lncRNA-miRNA pairs and the TargetScan, miRDB and miRTarBase databases were then used to predict the target miRNAs of the mRNAs (which were differentially expressed). Only the overlapping miRNAs were retained for further analysis. Next, Gene Ontology (GO) and Kyoto Encyclopedia of Genes and Genomes pathway (KEGG) analyses were performed to annotate the DEmRNAs with their possible biological functions. Subsequently, 8 lncRNAs, 4 miRNAs and 11 mRNAs in the lncRNA-miRNA-mRNA ceRNA network were determined to be associated with overall survival among the OC cases. Eventually, eight lncRNAs that were significantly associated with survival of patients with OC were used to construct a risk score model using least absolute shrinkage and selection operator (LASSO)-penalized Cox regression. The present results provide novel information regarding the mechanisms underlying OC tumorigenesis and progression.
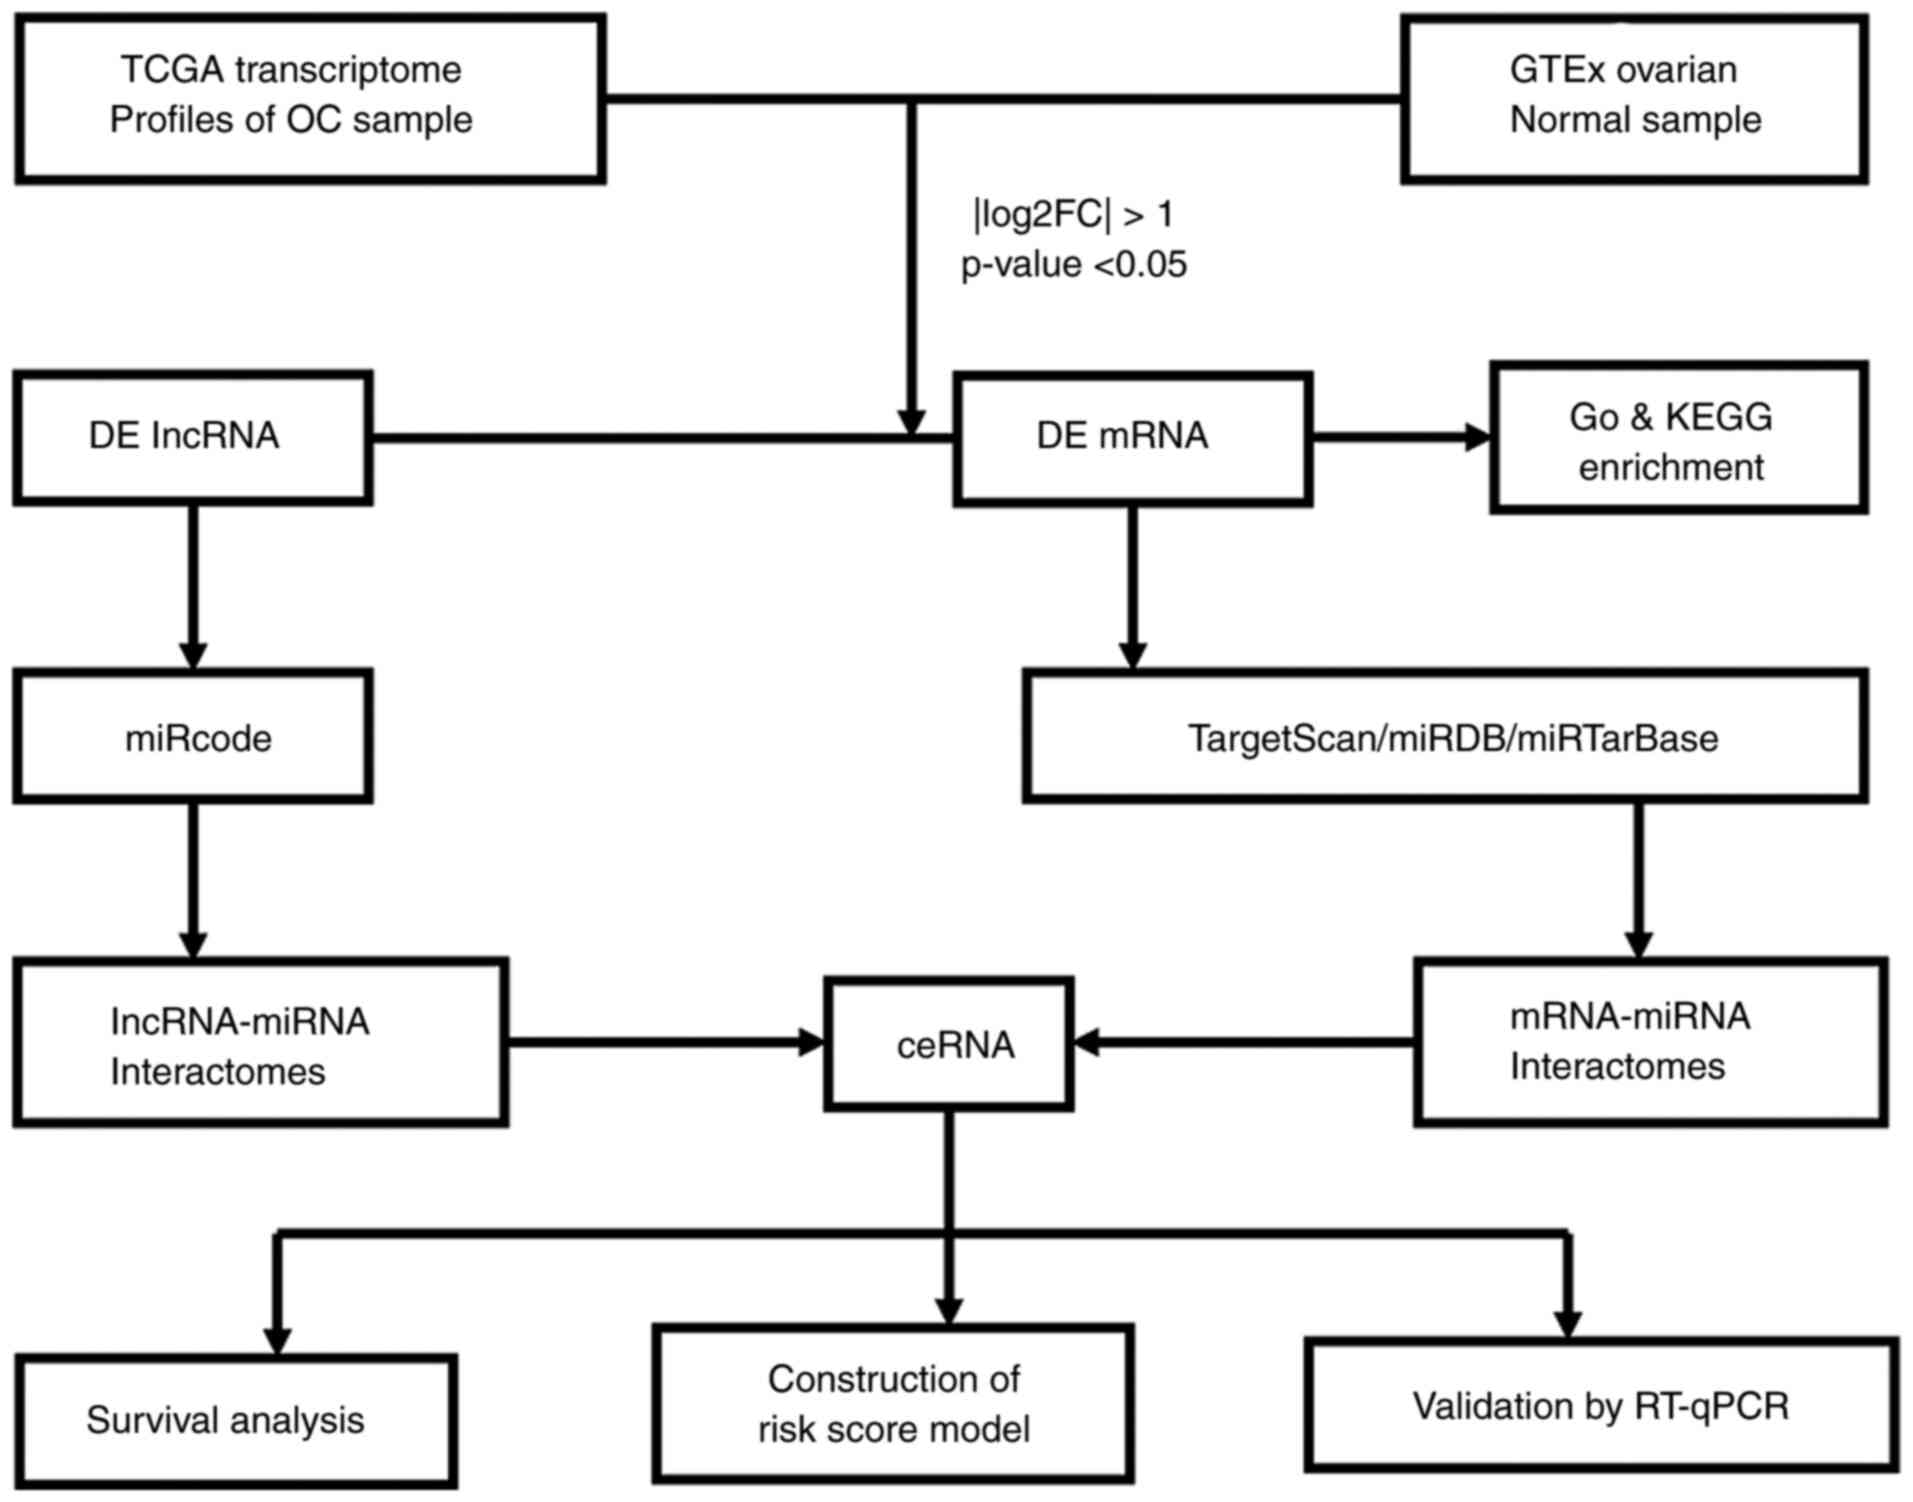 |
Figure 1.
Preparation of a ceRNA regulatory network. TCGA, The Cancer Genome Atlas; GTEx, Genotype-Tissue Expression; OC, ovarian cancer; FC, fold change; DElncRNA, differentially expressed long non-coding RNA; GO, Gene Ontology; KEGG, Kyoto Encyclopedia of Genes and Genomes; miRNA, microRNA; ceRNA, competing endogenous RNA; RT-qPCR, reverse transcription-quantitative PCR.
|
Materials and methods
RNA data retrieval and processing
RNA expression profiling data of 359 cases of OC were downloaded from the TCGA database (https://portal.gdc.cancer.gov/) and then normalized; the data had been generated using the Illumina HiSeq RNASeq and miRNASeq platforms. Clinical data including survival time were also obtained from the TCGA database. Data on 180 healthy control samples from the GTEx v8 release (https://gtexportal.org/home/datasets) were manually downloaded. The complete characteristics of the healthy controls were obtained from the official GTEx annotation. lncRNAs and mRNAs were identified and annotated using Ensembl (Homo_sapiens. GRCh38.97) (18), and RNAs that were absent from the database were excluded. No ethical approval was required for this study, as the data were obtained from TCGA and GTEx and TCGA and GTEx publication guidelines were strictly followed.
Identification of DEIncRNAs and DEmRNAs
To identify the significant DElncRNAs and DEmRNAs, the count data from OC and healthy tissues were merged into matrixes. The rows of RNA data with a rate of ≥25% of no expression were excluded. The Bioconductor package DEseq2 (https://bioconductor.org/packages/release/bioc/html/DESeq2.html) in R was used to normalize the expression data. A false discovery rate (FDR) approach was used to correct for multiple testing. Significant differential expression was defined as |log2[fold change (FC)]|≥1 and FDR-adjusted P<0.05. The DElncRNAs and DEmRNAs were used to generate volcano plots and heatmaps using the gplots and heatmap packages, respectively, in R.
Functional annotation of DEmRNAs
To assess the DEmRNAs in OC and investigate their function, the clusterProfiler package in R was employed for GO and KEGG enrichment analyses (19). The ggplot2 package (https://cran.r-project.org/web/packages/RCircos/RCircos.pdf) was used to visualize the top five GO biological process terms and KEGG functional pathways using Circos plots.
Construction of ceRNA regulatory network
The ceRNA network generation strategy is presented in Fig. 1 The miRcode database (http://www.mircode.org/) (20) was used to identify the lncRNA-miRNA pairs based on the DElncRNAs. The MiRTarBase (http://mirtarbase.mbc.nctu.edu.tw/) (21), miRDB (http://www.mirdb.org/) (22) and TargetScan (http://www.targetscan.org/) (23) databases were then used to predict the target miRNAs of the mRNAs (which were differentially expressed); only the miRNA-mRNA pairs shared by all three databases were used as candidates for network construction, to guarantee reliability. These shared miRNAs were used to merge the lncRNA-miRNA and miRNA-mRNA interactomes to produce the final ceRNA network. Finally, the ceRNA network of DElncRNAs, DEmiRNAs and DEmRNAs was visualized in Cytoscape v3.6.1 (http://www.cytoscape.org/). Theoretically, miRNA expression should negatively correlate with lncRNA and mRNA expression. Therefore, to identify the potential ceRNA regulatory axes, only positively correlated lncRNAs and mRNAs were included in the ceRNA network. A mulberry map was generated using the ‘ggalluvial’ package in R to visualize the ceRNA regulatory axes.
Survival and correlation analyses
The prognostic relevance of each lncRNA/miRNA/mRNA in the ceRNA network was subjected to a survival analysis based on TCGA data using the ‘survminer’ package in R. The Kaplan-Meier approach was used to generate survival curves that were compared using the log-rank test, with P<0.05 as the significance threshold. The patients were distributed according to quartiles. Next, a Pearson correlation analysis (with r>0.3 as the threshold) was used to explore the correlations between the lncRNAs and mRNAs.
Risk score model generation
LASSO-penalized Cox regression was used to create a risk score model using the DElncRNAs associated with OC patient survival (16). The penalized maximum likelihood method was utilized to generate the Cox model. Based on the maximally selected rank statistics, the optimal cutoff value for the risk score was determined to be 0.069. If the gene expression was ≤0.069, the expression level of the correlated gene was defined as ‘0’, whereas when the expression was >0.069, the expression level was defined as ‘1’. Using the risk score of each individual and the cutoff value of 0.069, the patients with OC were divided into high- and low-risk groups. The ability of the risk score to discriminate between OC and healthy individuals and its ability to predict overall survival of individuals with OC were then evaluated. This was performed using time-dependent receiver operating characteristic (ROC) curve and Kaplan-Meier analyses.
Cell culture
Two human ovarian adenocarcinoma cell lines, A2780 and SK-OV-3, were generously provided by Guangxi Medical University (Ningnan, China). OVCAR-3 and the human ovarian surface epithelial IOSE80 cell line were kindly provided by Southern Medical University (Guangzhou, China). The four cell lines were cultured in RPMI-1640 medium (Invitrogen; Thermo Fisher Scientific, Inc.) supplemented with 10% fetal bovine serum (HyClone; Cytiva) at 37°C in a humidified atmosphere containing 5% CO2.
RNA extraction and reverse transcription-quantitative polymerase chain reaction (RT-qPCR)
The expression levels of two key lncRNAs (HAND2-AS1 and LEMD1-AS1) and five key mRNAs (MPPED2, SAMD12, LONRF1, SORD and SERPINA1) were assessed in the control cell line (IOSE80) and the three OC cell lines (A2780, SK-O-V3 and OVCAR-3) to verify the reliability of the present results. Total RNA was extracted from the cell lines using a Cell Total RNA Isolation Kit (Foregene). Random primers and a Maxima First Strand cDNA Synthesis Kit (Takara Bio, Inc.) were used to synthesize cDNA. SYBR® Green Master Mix was used for qPCR. The primers, designed and synthesized by RiboBio, are listed in Table SI. GAPDH was used as the internal control. The relative expression was calculated using the 2−ΔΔCq method (24). All experiments were performed three times.
Western blot analysis
Western blotting was performed according to a standard protocol (https://www.westernblotprotocol.com/). The analyte proteins were MPPED2, SAMD12, LONRF1, SORD and SERPINA1 and the antibodies used are listed in Table SII. β-tubulin was used as the internal control.
Statistical analysis
Statistical analyses were performed with the GraphPad Prism version 8.1.1 software (GraphPad Software, Inc.). Comparisons between two groups were performed using an unpaired Student's t-test. One-way ANOVA was used when making comparisons among multiple groups. Dunnett's test was used as the post hoc test. Survival analysis was performed using the Kaplan-Meier estimation and log-rank test. For correlation analysis, Pearson's correlation coefficient was applied. All statistical tests were two-sided. P<0.05 was considered to indicate statistical significance.
Results
Identification of DElncRNAs and DEmRNAs in OC
The expression levels of lncRNAs and mRNAs in 359 OC samples from TCGA and 180 healthy samples from GTEx were explored. A total of 1,049 DElncRNAs and 6,516 DEmRNAs were identified. Of these, 452 lncRNAs and 3,808 mRNAs were significantly upregulated, whereas 597 lncRNAs and 2,708 mRNAs were significantly downregulated. Volcano plots [-log10FDR vs. log2(FC)] (Fig. 2A and B) were used to visualize the expression profiles of the DElncRNAs and DEmRNAs using the gplots package in R.
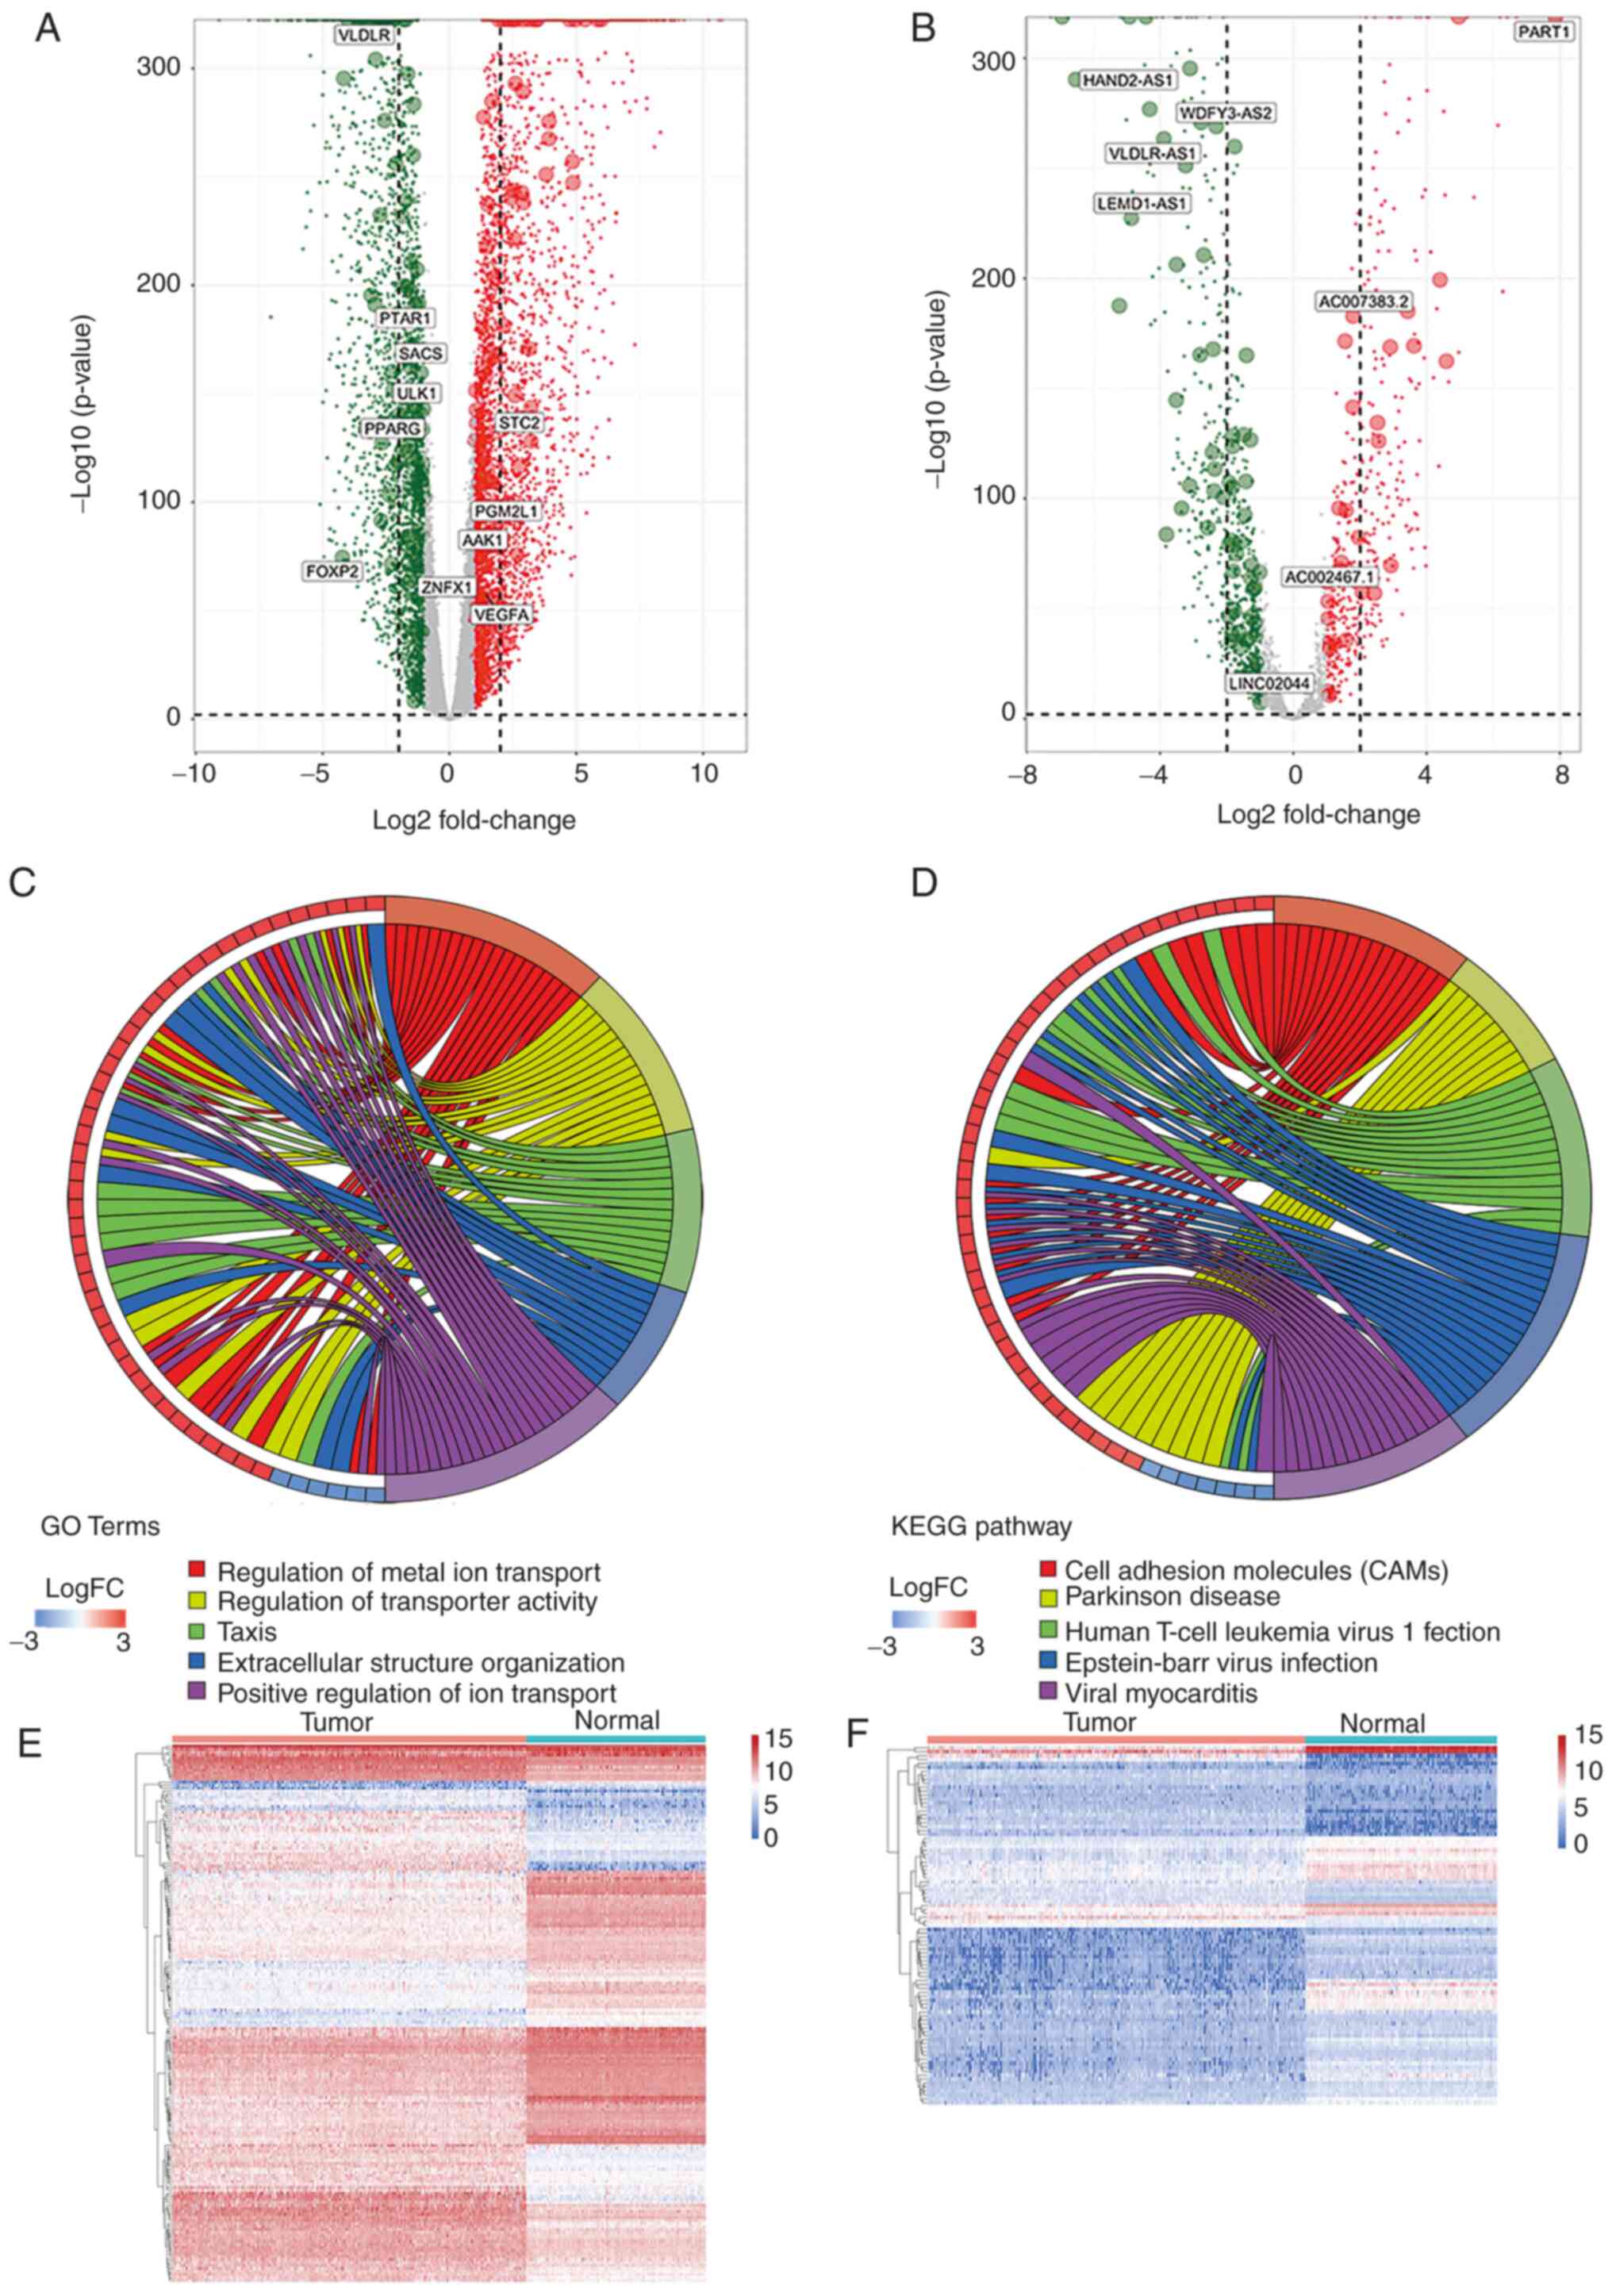 |
Figure 2.
Differentially expressed gene identification. (A) Dysregulated mRNAs and (B) lncRNAs between groups as presented in volcano plots: Normal ovarian samples vs. OC samples. Red and green indicate up- and downregulated factors, respectively. Chord diagrams presenting five significant enriched (C) GO terms and (D) KEGG terms. The GO terms and KEGG terms are marked by colored bars and are indicated on the right of the chord diagrams, while involved differentially expressed mRNAs are presented to the left. Blue and red bars denote down- and upregulated genes, respectively. Heatmap of the expression levels of the (E) mRNAs and (F) lncRNAs between OC and normal ovarian tissues. FC, fold change; lncRNA, long non-coding RNA; GO, Gene Ontology; KEGG, Kyoto Encyclopedia of Genes and Genomes; OC, ovarian cancer.
|
Functional enrichment analysis of DEmRNAs
To predict the functions of the DEmRNAs and how they affect the pathogenesis of OC, GO and KEGG analyses were performed. The 10 most significant GO terms (in descending order) were extracellular structure organization, extracellular matrix organization, regulation of ion transport, leukocyte migration, positive regulation of ion transport, renal system development, kidney development, positive regulation of cell adhesion, epithelial cell differentiation and regulation of metal ion transport. Of the top 15 GO terms, five were visualized using Cytoscape (Fig. 2C). The top 10 KEGG pathways included cell adhesion molecules (CAMs), human T-cell leukemia virus 1 infection, Parkinson's disease, viral myocarditis, Epstein-Barr virus infection, p53 signaling pathway, AGE-RAGE signaling pathway in diabetic complications, platinum drug resistance, type 1 diabetes mellitus and the rap1 signaling pathway. The top five pathways are visualized in Fig. 2D. In addition, certain cancer-related pathways, including the NF-κB signaling pathway, the phosphoinositide 3-kinase (PI3K)-Akt signaling pathway and apoptosis, were significantly enriched.
ceRNA network construction
To more fully elucidate the roles of the DElncRNAs and DEmRNAs in OC and to better assess the regulatory mechanisms they are involved in, an lncRNA-miRNA-mRNA ceRNA regulatory network was established. As specified above, miRcode was used to predict the lncRNA-miRNA pairs. MiRTarBase, miRDB and TargetScan were then used to predict the miRNA-mRNA interactions and the predicted miRNAs that overlapped among the three databases were retained for further analysis (Fig. 3A). Based on the miRNAs shared by the predicted lncRNA-miRNA and miRNA-mRNA pairs, the interactomes were combined to generate a co-expression network containing 100 lncRNAs, 23 miRNAs and 184 mRNAs (Fig. 3B). The heatmaps of DE-RNA expression in the ceRNA network between the OC and healthy samples are presented in Fig. 2E and F. Based on the ceRNA hypothesis, the elements in each lncRNA-miRNA or miRNA-mRNA pair have opposite expression trends. Therefore, only these pairs were used to establish the regulatory axes, which comprised 91 lncRNAs, 23 miRNAs and 179 mRNAs (Fig. 3C).
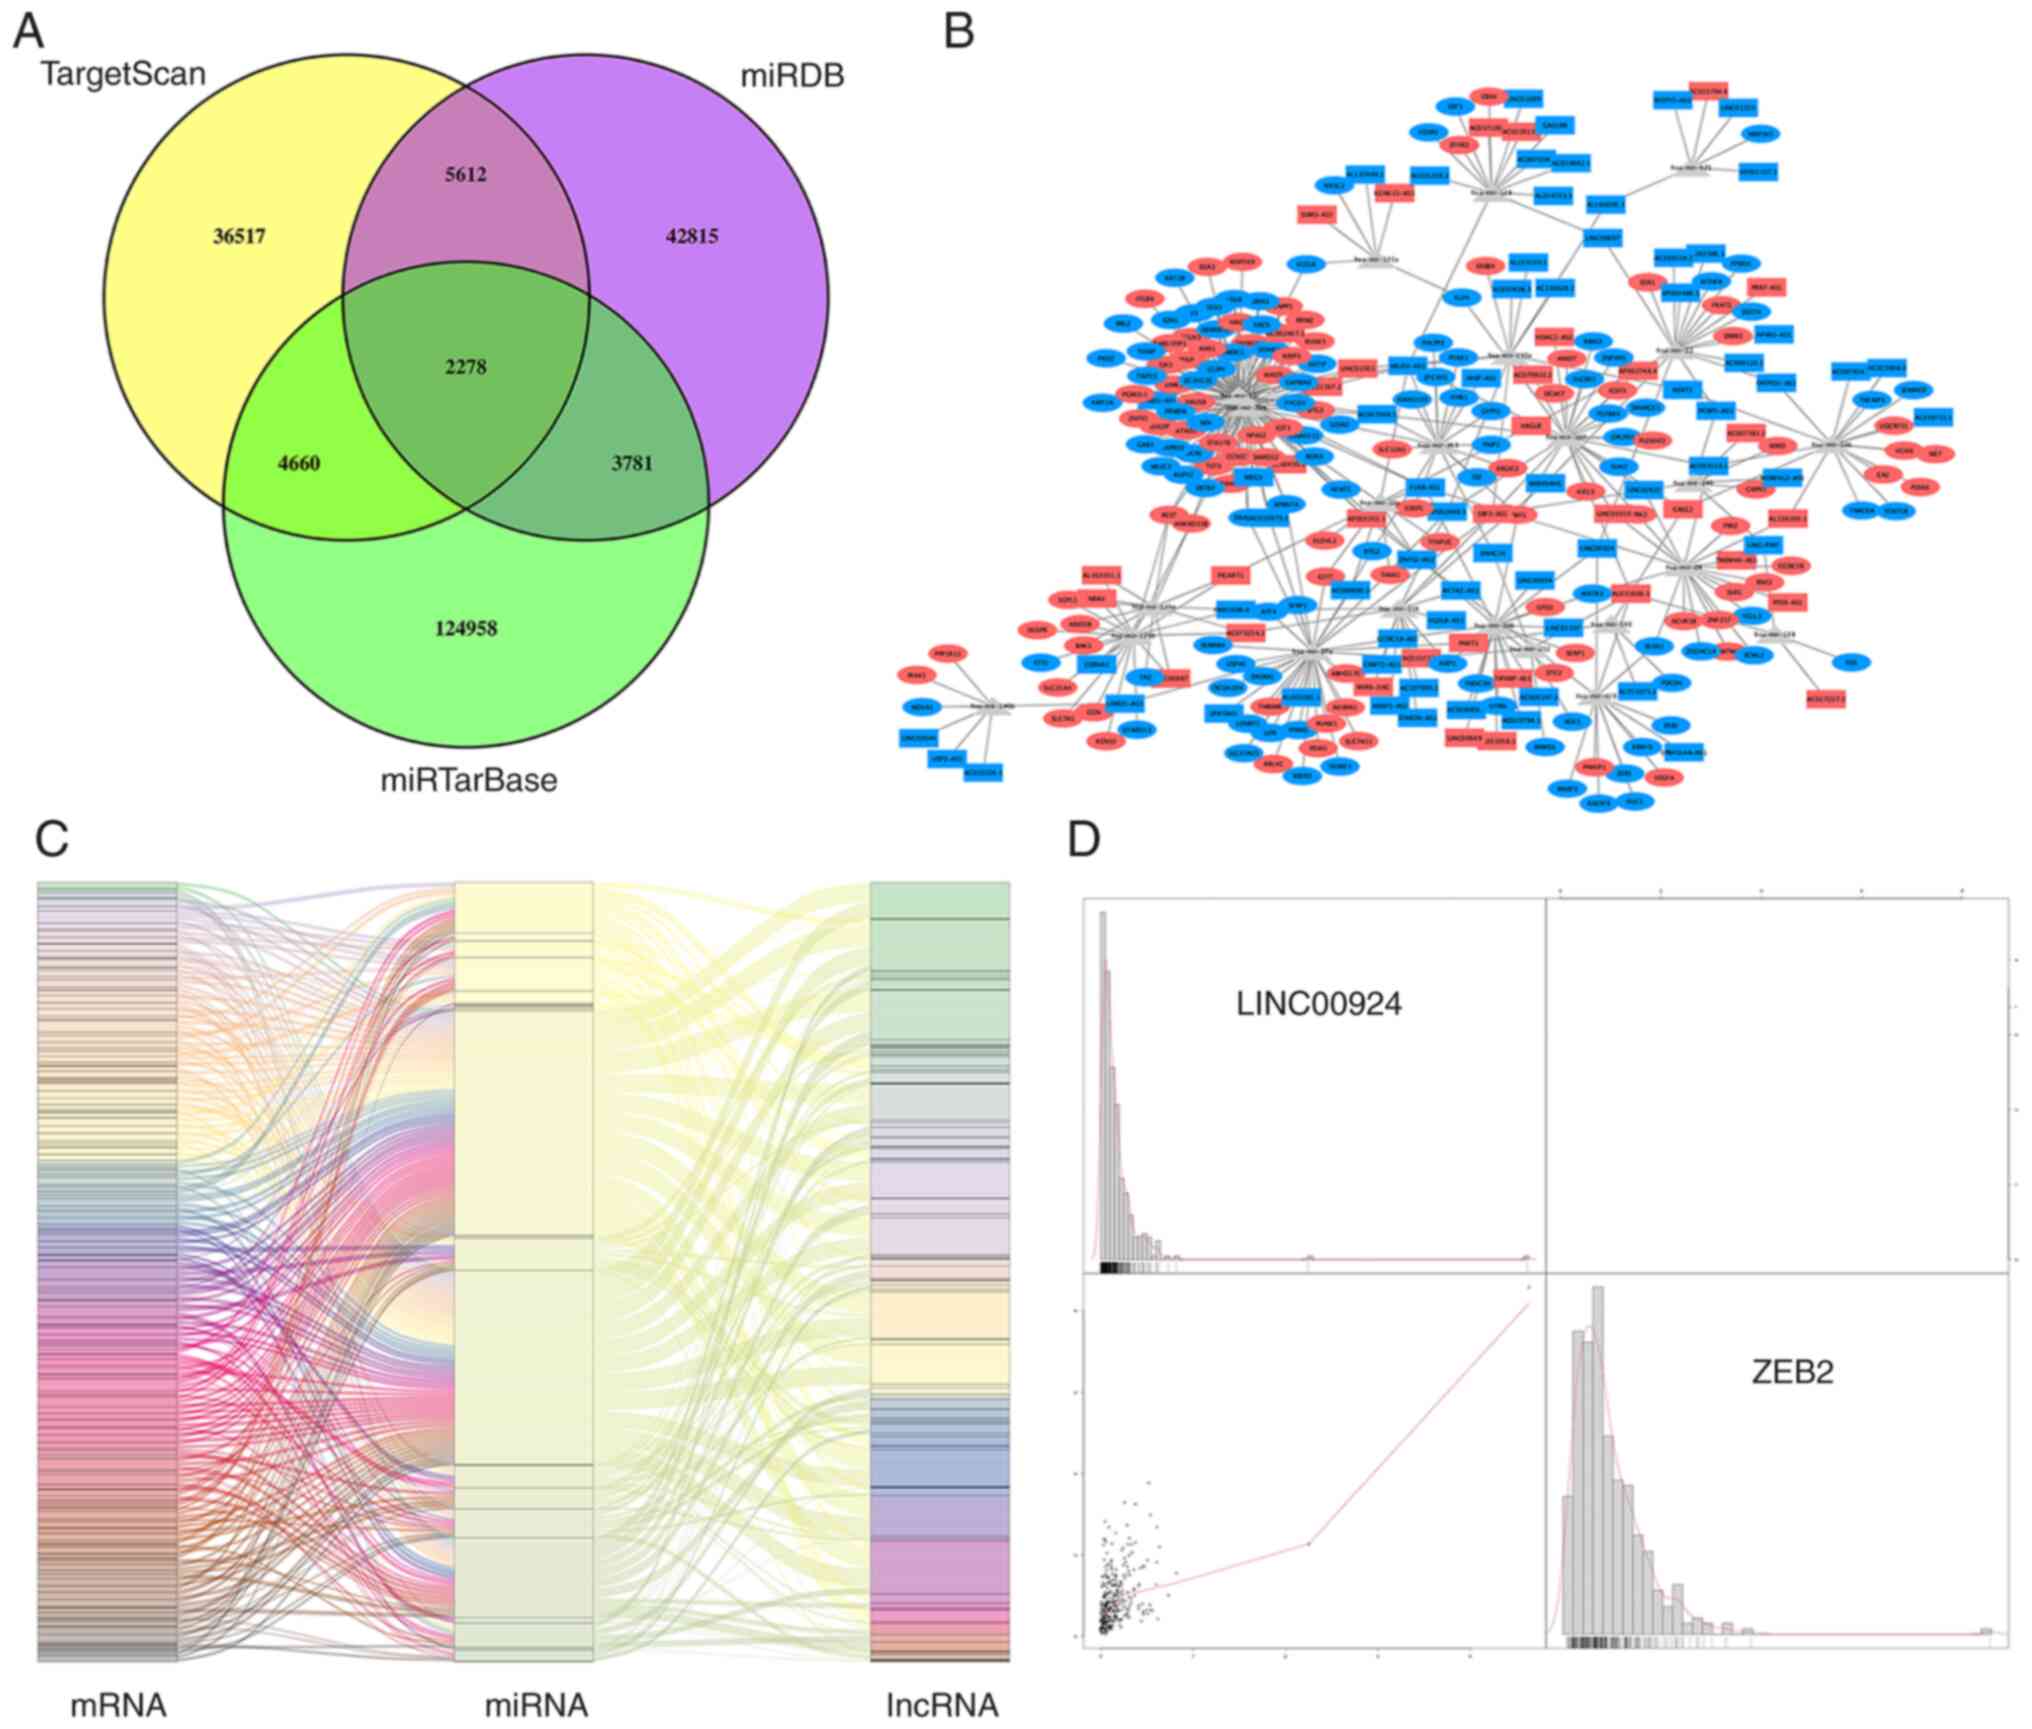 |
Figure 3.
Integrative ceRNA regulated network analysis. (A) Venn diagrams indicate intersecting differentially expressed miRNAs predicted by TargetScan (yellow areas), miRDB (purple areas) and miRTarBase (green areas). (B) The resulting ceRNA network of DEGs. Rectangles mark 91 lncRNAs; ovals mark 179 mRNAs; red and blue indicate up- and downregulation for genes, respectively; Grey triangles represent 23 miRNAs. (C) The lncRNA-miRNA-mRNA axes that were detected were integrated to yield the final module map. Left, middle and right bars indicate mRNAs, miRNAs and lncRNAs. (D) Correlation analysis of DEGs between lncRNAs and mRNAs. The correlation between lncRNA LINC00924 and mRNA ZEB2, which had the most significant correlation coefficient, is presented. In the dot plot in the lower left corner, x- and y-axis represents the expression level of ZEB2 and LINC00924 respectively, and the bar chart shows the density distribution of the expression level of corresponding genes. miRNA, microRNA; ceRNA, competing endogenous RNA; lncRNA, long non-coding RNA; DEG, differentially expressed gene.
|
Prognostic significance of lncRNAs/miRNAs/mRNAs in the ceRNA network
The prognostic relevance of the ceRNA network in OC was assessed via a survival analysis using survival and lncRNA/miRNA/mRNA expression data from the TCGA database. Kaplan-Meier analysis for each lncRNA/miRNA/mRNA in the ceRNA network was performed. A total of 5 lncRNAs (VLDLR-AS1, LEMD1-AS1, WDFY3-AS2, AC007383.2 and PART1), 1 miRNA (hsa-miR-363) and 5 mRNAs (VEGFA, PGM2L1, PTAR1, STC2 and VLDLR) were identified as protective genes in OC development, as lower expression levels were associated with shorter survival (P<0.05). By contrast, the aberrant expression levels of 3 lncRNAs (HAND2-AS1, AC002467.1 and LINC02044), 3 miRNAs (hsa-miR-10a, hsa-miR-22 and hsa-miR-23b) and 6 mRNAs (SACS, PPARG, ULK1, AAK1, FOXP2 and ZNFX1) correlated negatively with OC patient overall survival. Fig. 4A-I presents the Kaplan-Meier curves of the 9 most significant lncRNAs/miRNAs/mRNAs.
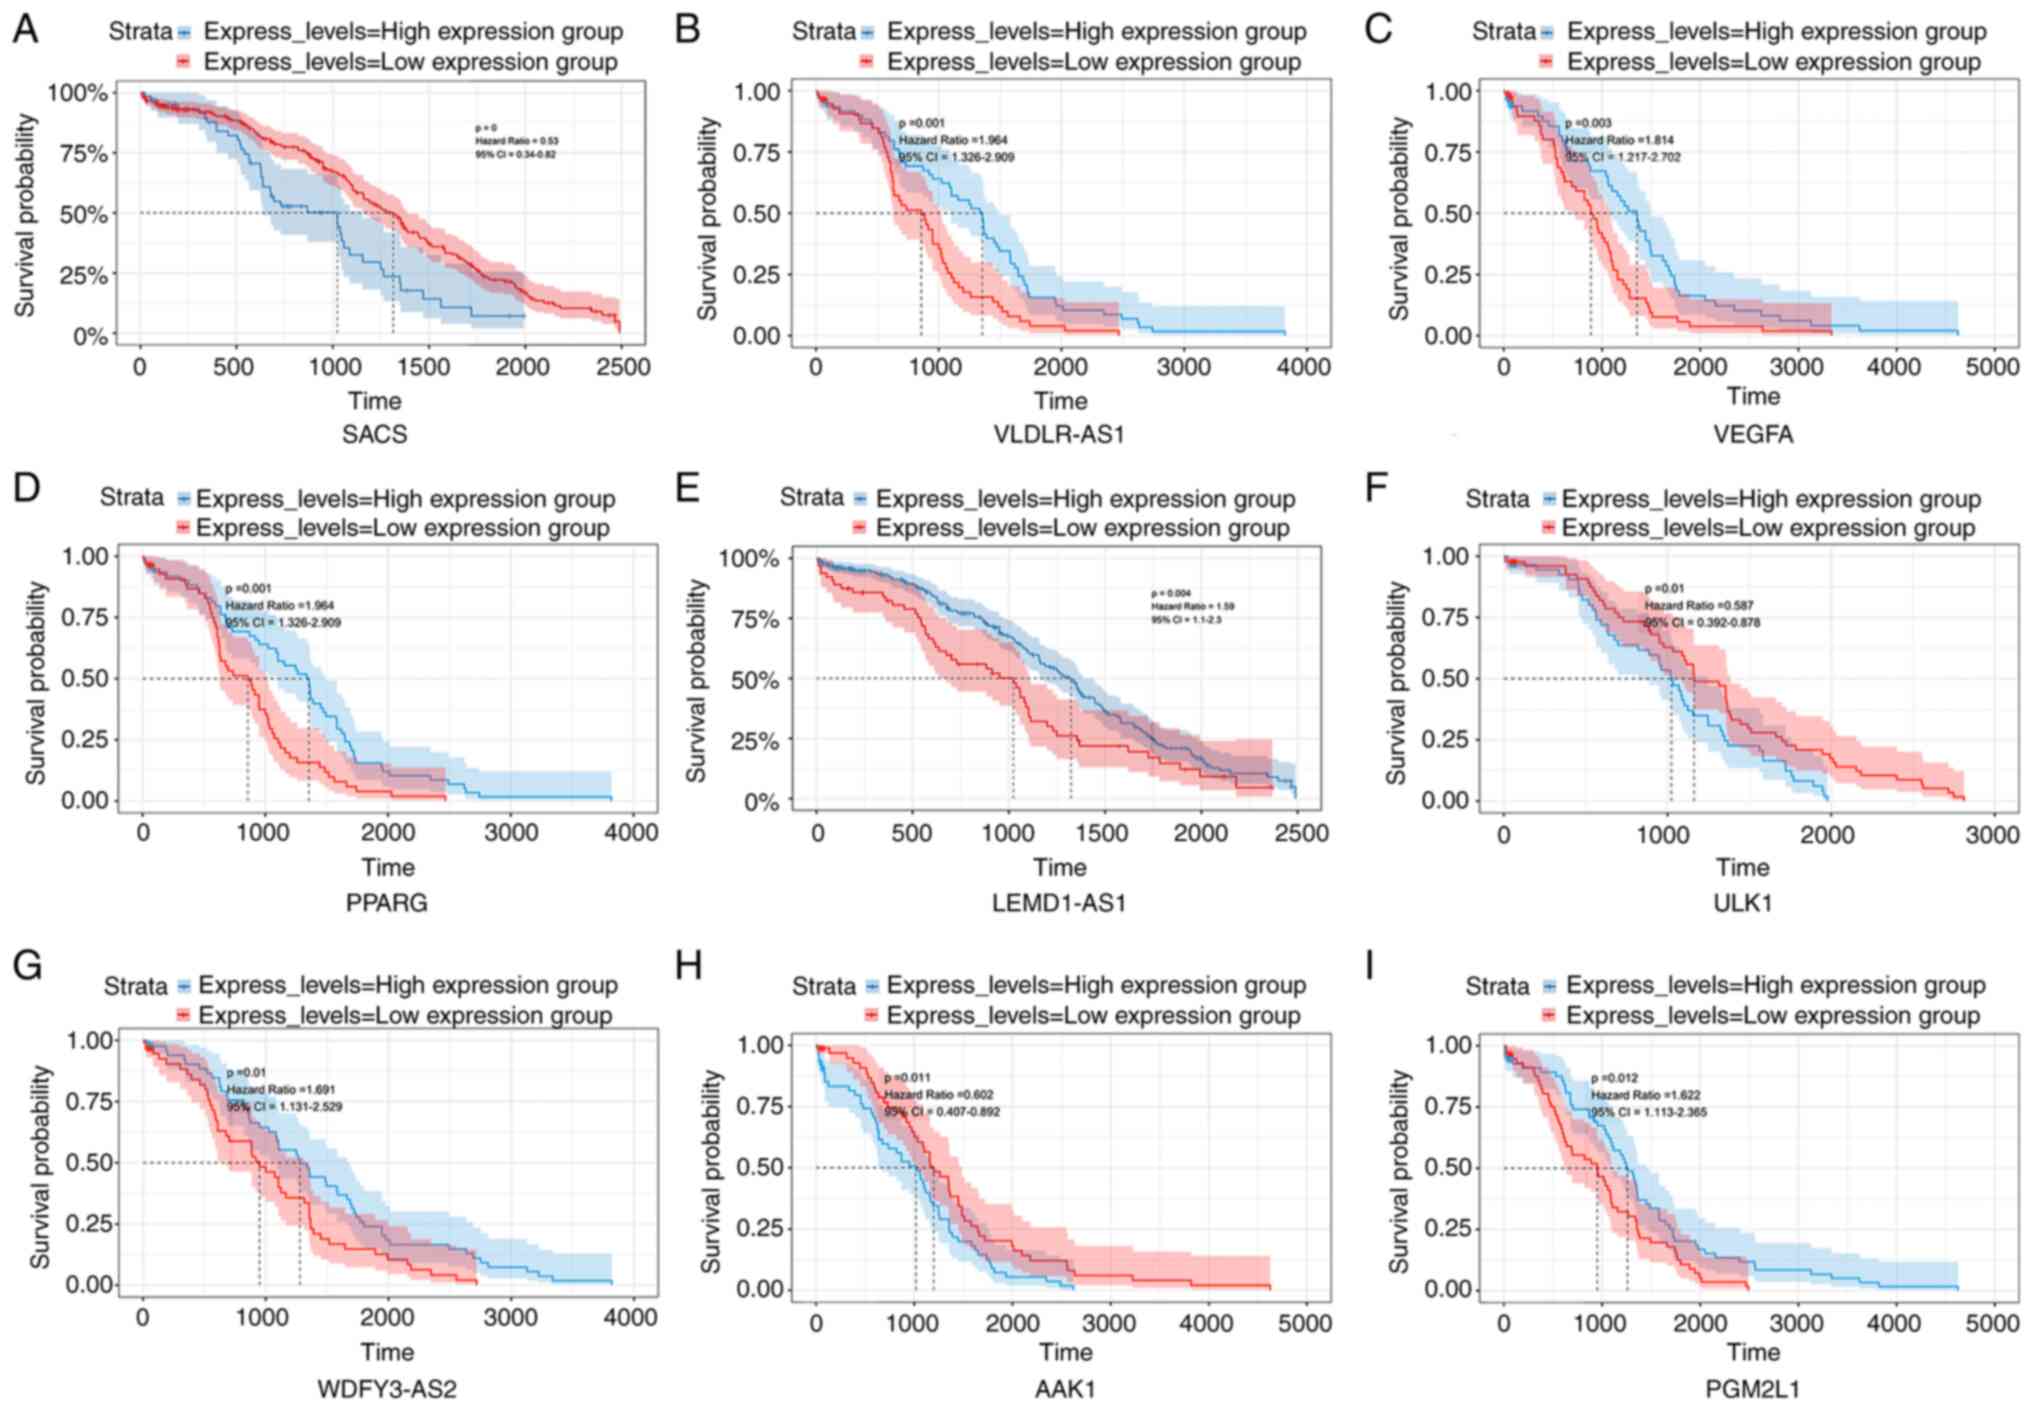 |
Figure 4.
Survival assessment of differentially expressed genes in patients with ovarian cancer. (A) SACS; (B) VLDLR-AS1; (C) VEGFA; (D) PPARG; (E) LEMD1-AS1; (F) ULK1; (G) WDFY3-AS2; (H) AAK1; and (I) PGM2LI. The three long non-coding RNAs most related to survival and the top six mRNAs most relevant to survival are indicated based upon optimal cutoffs.
|
Correlations between DElncRNAs and DEmRNAs
To more fully assess how lncRNA and mRNA expression levels were related in the ceRNA network, a correlation analysis was performed. According to the ceRNA hypothesis, lncRNAs are able to indirectly regulate the expression of positively correlated mRNAs. The lncRNA LINC00924 was correlated with the mRNA ZEB2 and they were involved in the same ceRNA regulatory axis and had the largest significant correlation coefficient (Fig. 3D).
lncRNA-based risk scores
The eight lncRNAs that had been determined to be associated with overall survival were used to construct a risk score model using LASSO-penalized Cox regression, with the coefficients being used to weight the expression value of each lncRNA as follows (Fig. 5A and B): Risk score = (AC002467.1 × 0.102) + [AC007383.2 × (−0.045)] + (HAND2.AS1 × 0.928) + [LEMD1.AS1 × (−0.106)] + (LINC0204 × 1.418) + [PART1 × (−0.051)] + [VLDLR.AS1 × (−0.385)] + [WDFY3.AS1 × (−0.439)]. Among these lncRNAs, AC007383.2, LEMD1.AS1, PART1, VLDLR.AS1 and WDFY3.AS1 had negative coefficients, indicating that they are protective. The maximally selected rank statistics and risk score distributions were calculated (Fig. 5C and D), with the optimal cutoff value for the risk score determined to be 0.069. Thereafter, the ability of the risk score to discriminate between patients with OC and healthy individuals and its ability to predict the overall survival of individuals with OC were assessed using time-dependent ROC curve and Kaplan-Meier analyses (Fig. 5E and F). A heatmap and a scatter plot were used to visualize the 8 lncRNA expression profiles and the risk scores for the 359 patients with OC that had survival data (Fig. 5G).
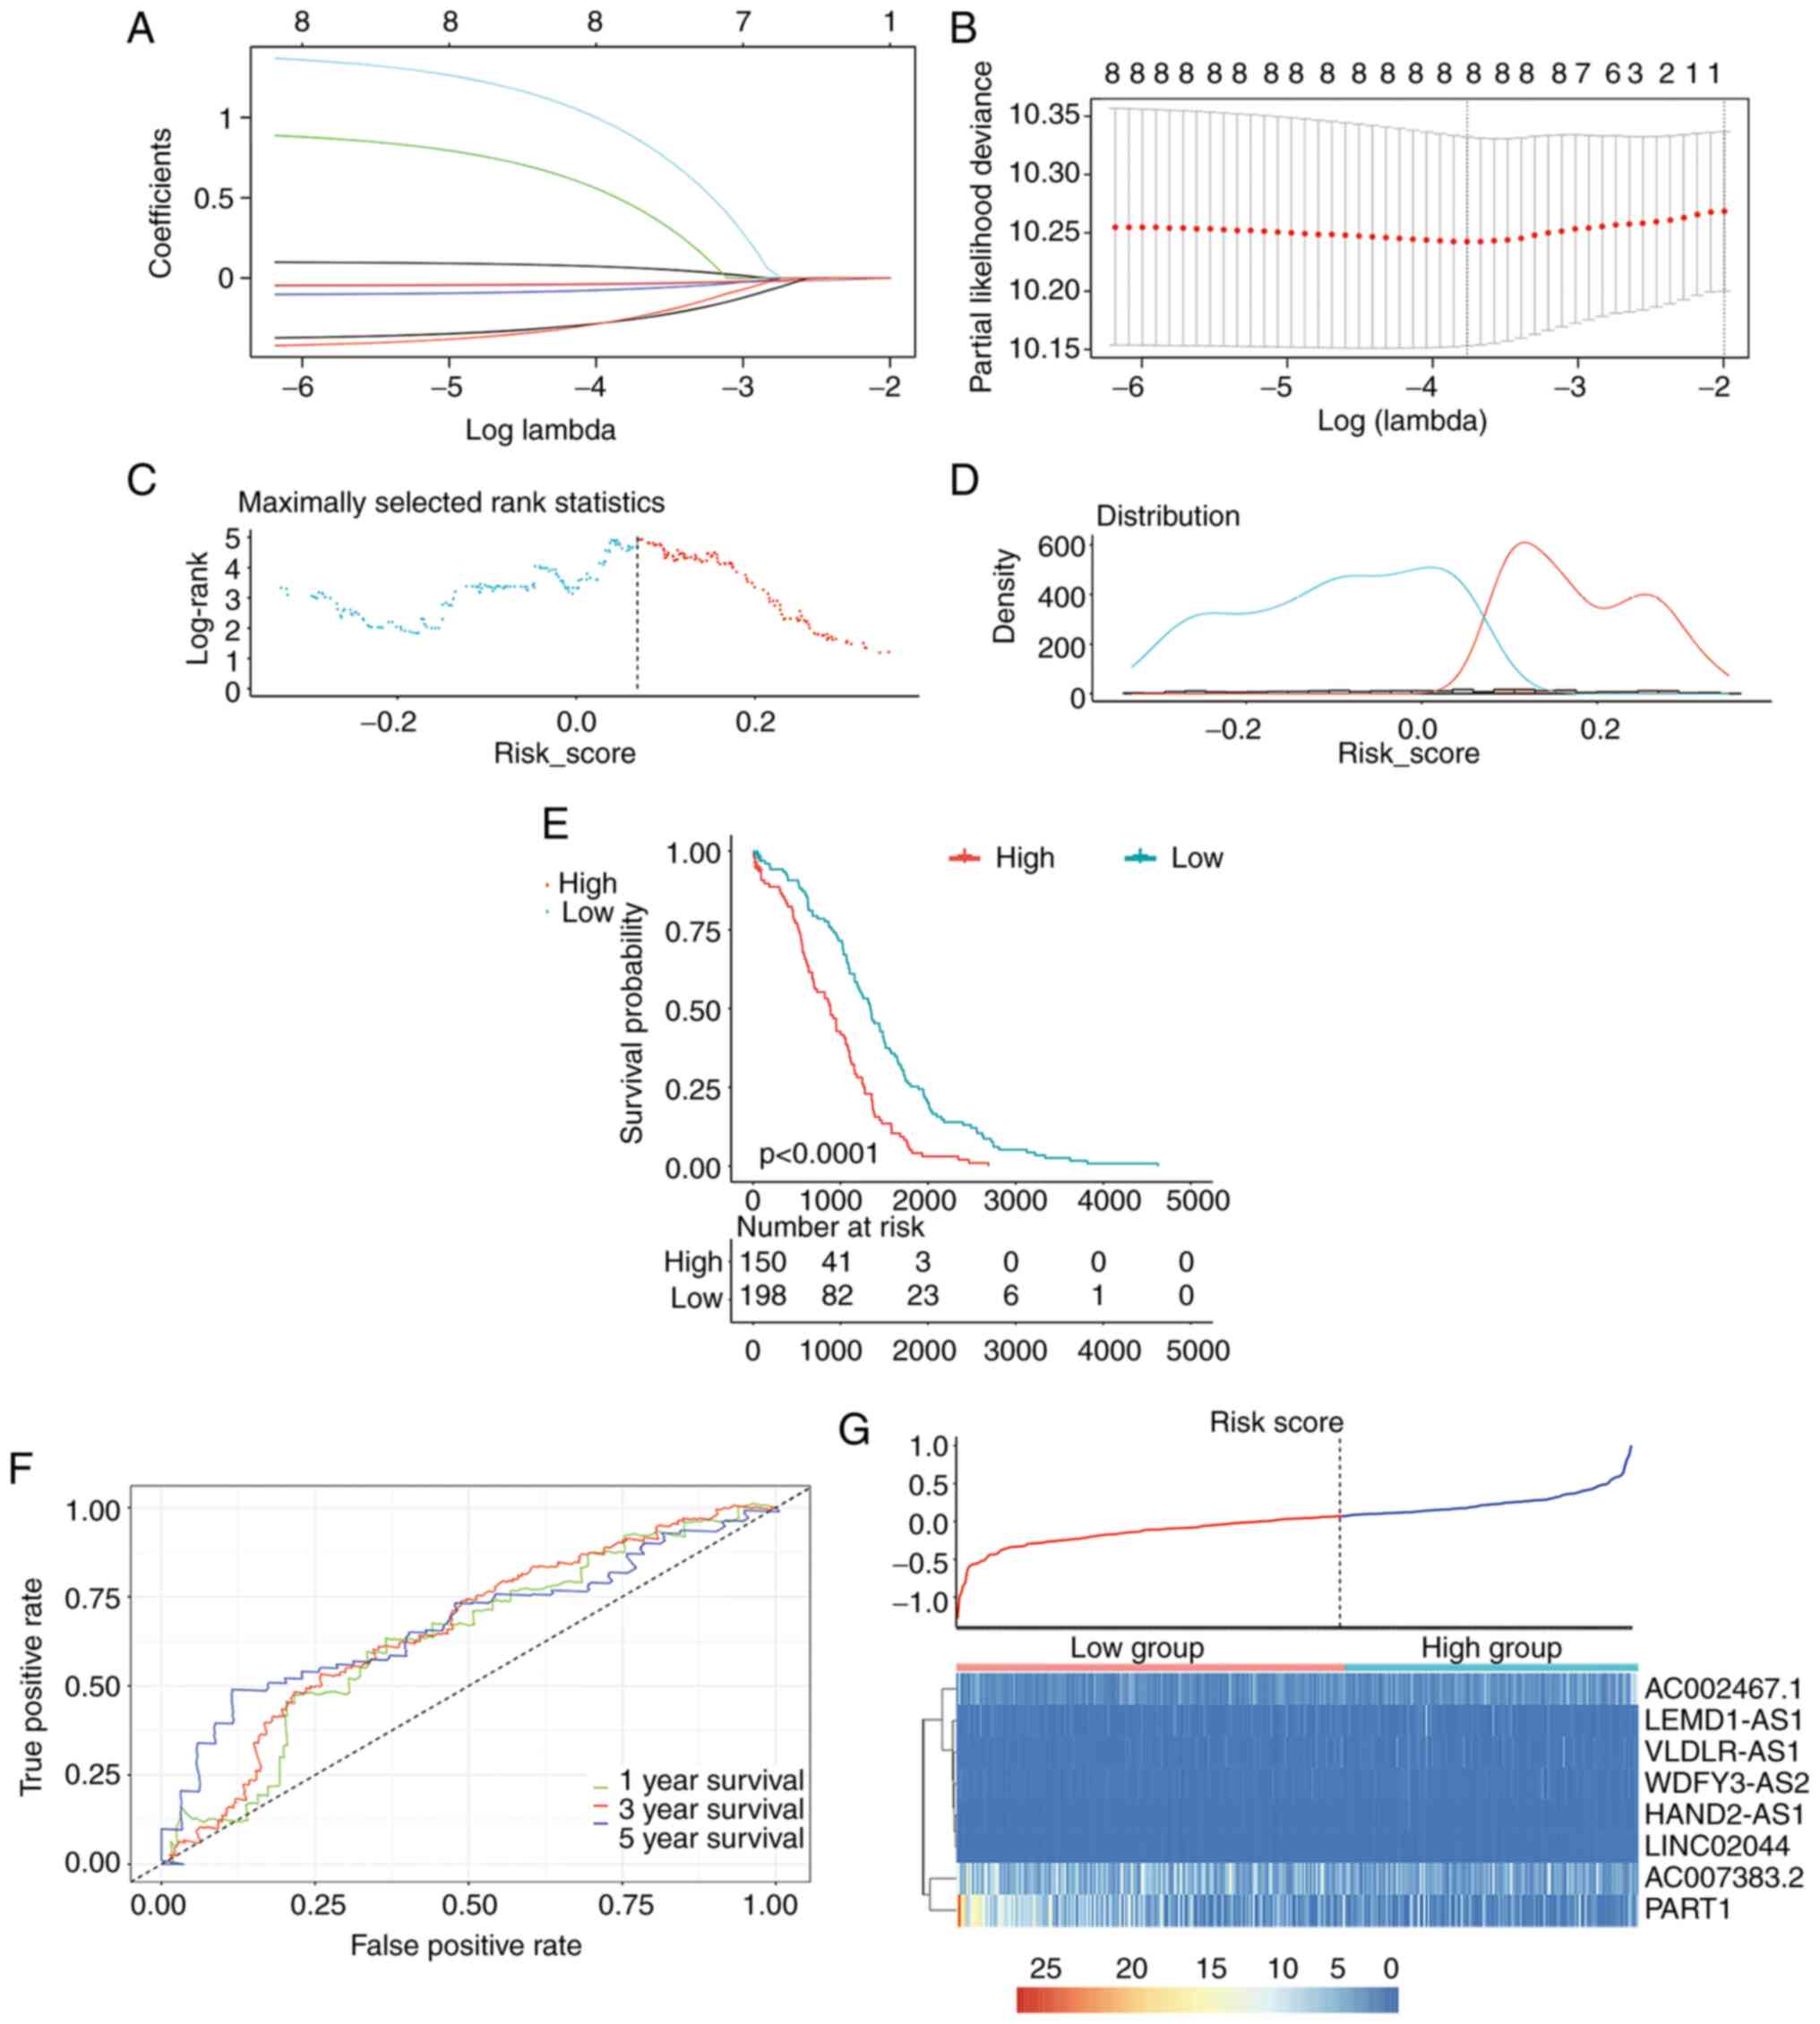 |
Figure 5.
OC risk scoring system. (A) Lasso-penalized Cox regression analysis of 8 differentially expressed lncRNAs. (B) The coefficient values at varying levels of penalty. The lambda which enabled the lowest mean cross-validated error value was determined. Partial likelihood deviance is marked in red, while 95% CIs are indicated using solid vertical lines. Dotted lines on the right and left correspond to lambda. 1se (lambda that resulted in an AUC one standard error away from the maximum AUC) and lambda. min (lambda that resulted in the highest AUC), respectively. (C) Risk score-related standardized log-rank statistics. The optimal cutoff value was 0.07. (D) Risk scores were used for optimal cutoff and survival curve selection. Density distributions of patients with OC with high- and low-risk score are provided. (E) Kaplan-Meier survival curve of high risk score and low risk score groups. (F) Time-dependent ROC curves based on risk score. (G) Risk score analysis of 8 differentially expressed lncRNAs. The risk score of 8 differentially expressed lncRNAs are displayed in the top panel and heatmaps below indicate differentially expressed lncRNA expression profiles for patients with OC with survival information. Blue and red indicate low and high expression, respectively. OC, ovarian cancer; lncRNA, long non-coding RNA; AUC, area under the ROC curve; ROC, receiver operating characteristic.
|
Validation of key lncRNAs and mRNAs
The expression profiles of two lncRNAs (HAND2-AS1 and LEMD1-AS1) were verified in OC cell lines by RT-qPCR. The expression profiles of five mRNAs (MPPED2, SAMD12, LONRF1, SORD and SERPINA1) were verified in OC cell lines by RT-qPCR and western blot. MPPED2, SAMD12, SORD and SERPINA1 were upregulated in the three OC cell lines (A2780, SK-OV-3 and OVCAR-3), while HAND2-AS1, LEMD1-AS1 and LONRF1 were downregulated (Fig. 6H-O). The RT-qPCR and western blot results thus verified the results of the bioinformatics analysis (Fig. 6A-G).
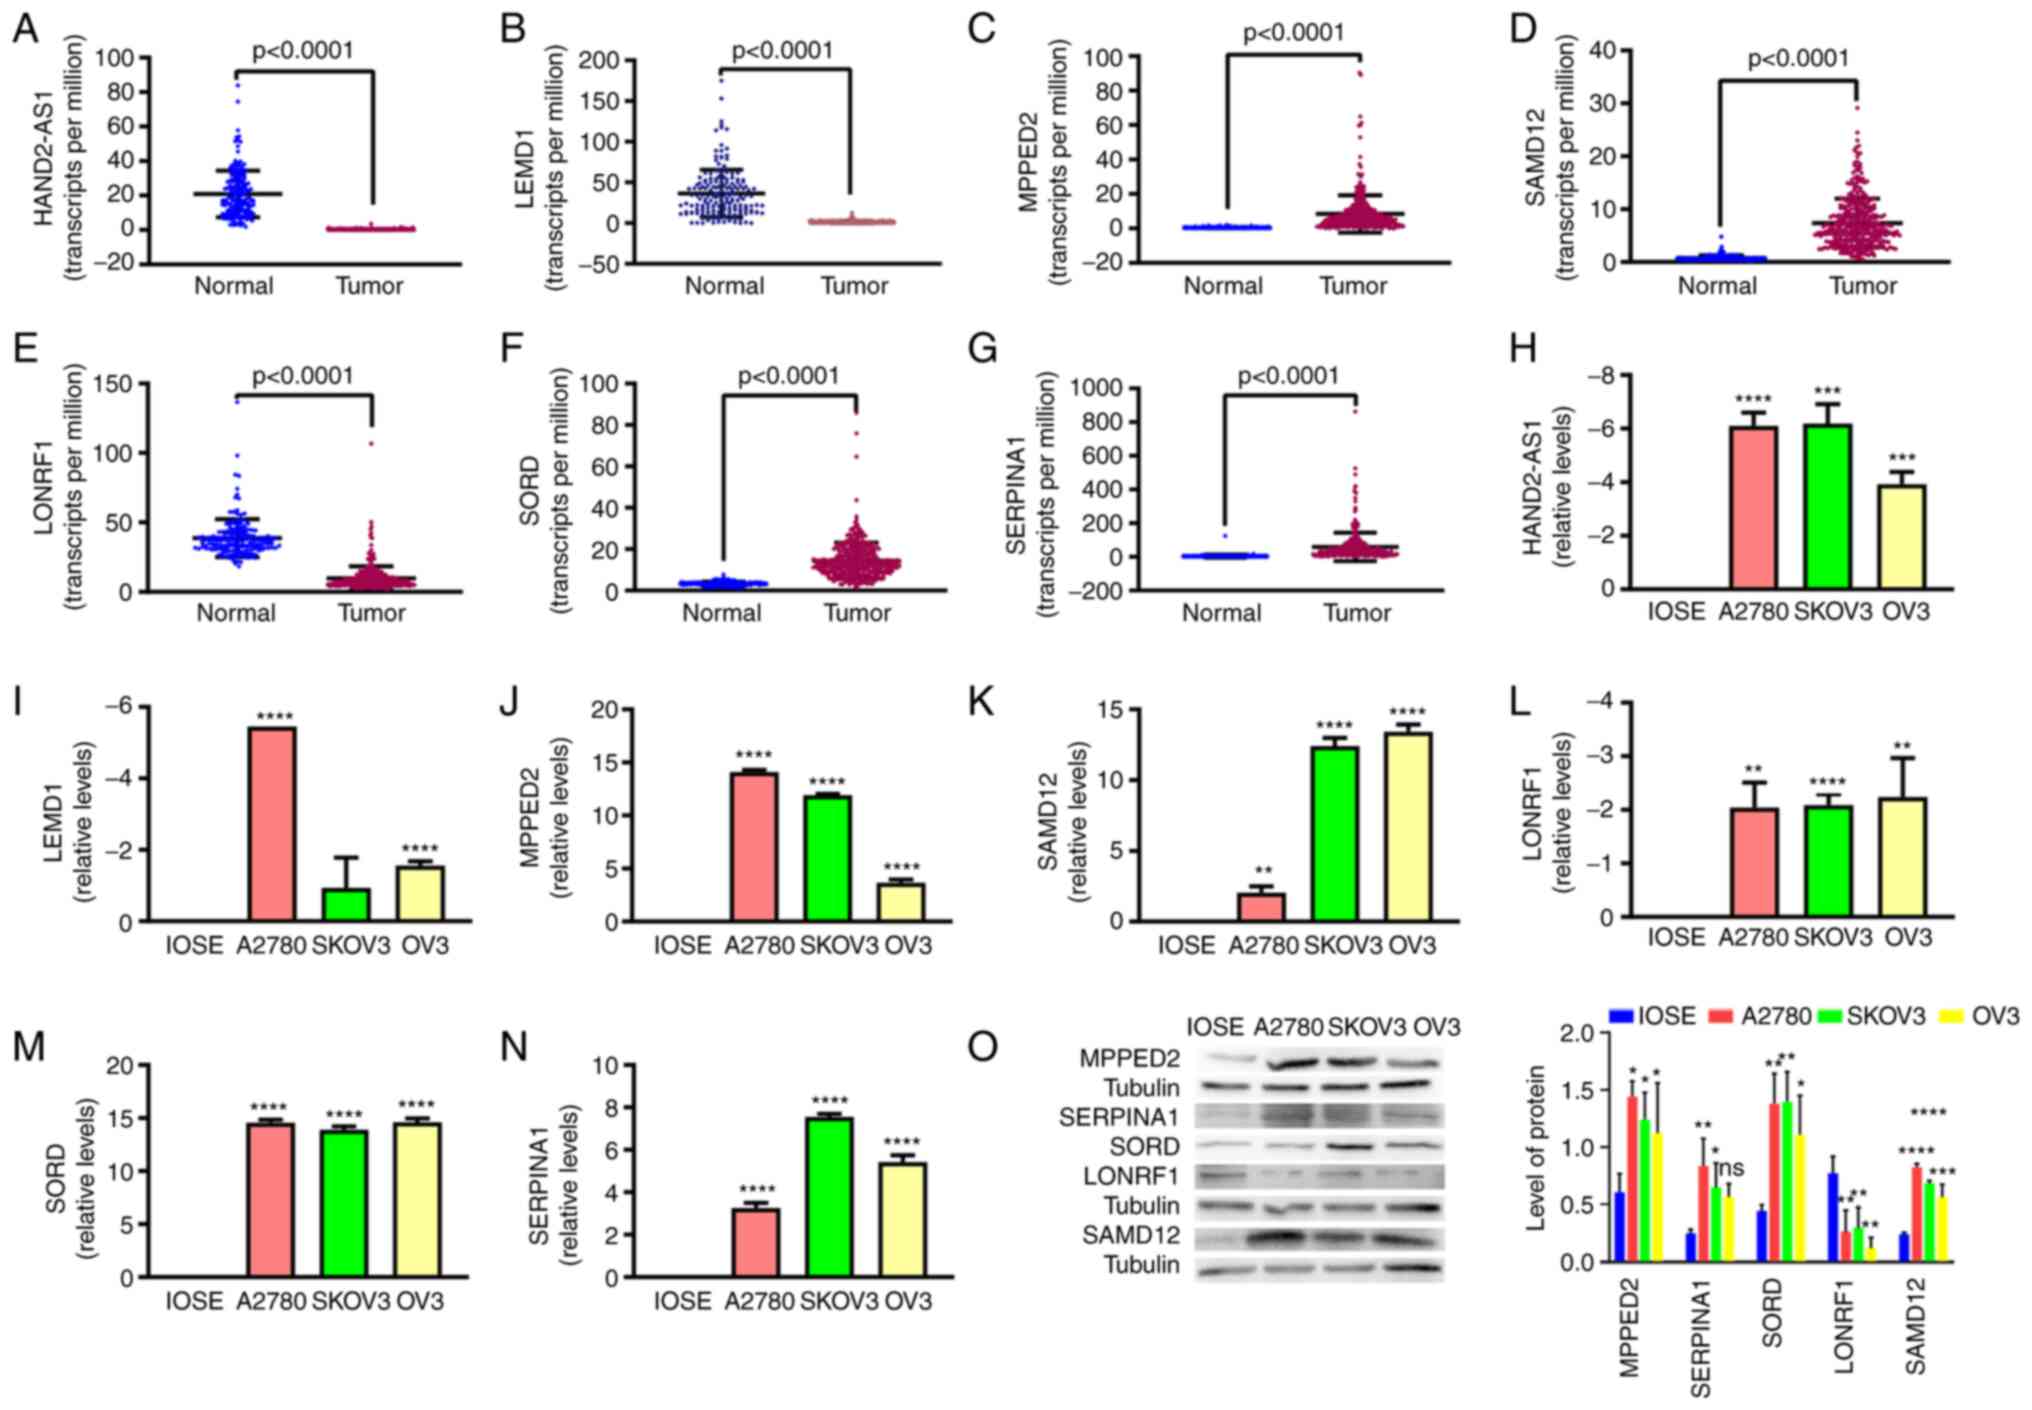 |
Figure 6.
Validation of the expression levels of two lncRNAs and five mRNAs by reverse transcription-quantitative PCR and western blot. (A-G) Expression levels of (A) HAND2-AS1, (B) LEMD1-AS1, (C) MPPED2, (D) SAMD12, (E) LONRF1, (F) SORD and (G) SERPINA1 in The Cancer Genome Atlas dataset vs. the Genotype-Tissue Expression dataset. (H-N) The RNA levels of (H) HAND2-AS1, (I) LEMD1-AS1, (J) MPPED2, (K) SAMD12, (L) LONRF1, (M) SORD and (N) SERPINA1 in human ovarian adenocarcinoma cell lines (A2780, SK-OV-3 and OVCAR-3) vs. ovarian surface epithelium cell line (IOSE80). (O) The protein levels of MPPED2, SAMD12, LONRF1, SORD and SERPINA1 in human ovarian adenocarcinoma cell lines (A2780, SK-OV-3 and OVCAR-3) vs. ovarian surface epithelium cell line (IOSE80). *P<0.05, **P<0.01; ***P<0.001; ****P<0.0001 vs. IOSE80.
|
Discussion
OC is the most fatal neoplasm of the female reproductive system (25). Although numerous treatment strategies have been adopted, the prognosis of patients with OC remains unsatisfactory. Of note, >70% of patients with OC are diagnosed at advanced stages due to the asymptomatic nature of the disease. Therefore, it is frequently referred to as a ‘silent killer’ (26).
OC-related regulatory mechanisms are currently being studied in-depth. Furthermore, high-throughput sequencing technologies have indicated that lncRNAs are able to modulate transcription and have key roles in gene regulation, notably as components of ceRNA networks (27). An increasing number of studies have indicated that ceRNA-related genes strongly impact cancer pathogenesis, progression and prognosis (28). Regarding OC, several studies have explored ceRNA networks in OC based on TCGA (17) and Gene Expression Omnibus (29) data and these studies predominantly focused on certain clinical traits in the OC cohort, such as recurrence (30) and drug resistance (31). However, this is far from ideal, as differential expression between OC and healthy tissues was not considered. To explore the differential expression, given that there are no healthy control tissues in the TCGA RNA-Seq database, data from healthy ovarian tissue samples from the GTEx database were used as controls. For the first time, an OC-associated ceRNA regulatory network was identified based on the DElncRNAs and DEmRNAs between the TCGA and GTEx cohorts.
First, DElncRNAs and DEmRNAs were identified via comparisons of OC and healthy tissues. Subsequently, interactions between lncRNAs and miRNAs, as well as between miRNAs and mRNAs were predicted. Next, an OC-related ceRNA network was constructed to predict the lncRNA regulatory functions. GO analysis suggested that the DEmRNAs were predominantly enriched in extracellular matrix organization, leukocyte migration and positive regulation of cell adhesion. KEGG pathway analysis indicated that most of the DEmRNAs have important roles in cancer-related pathways, including CAMs, p53 signaling pathway, NF-κB signaling pathway, PI3K-Akt signaling pathway and platinum drug resistance. Furthermore, survival analyses of the lncRNAs/miRNAs/mRNAs in the ceRNA network suggested that 8 of the 91 lncRNAs, 4 of the 23 miRNAs and 11 of the 179 mRNAs were associated with OC prognosis.
As such, these lncRNAs/miRNAs/mRNAs have a marked impact on overall survival of patients with OC, indicating that the OC-related ceRNA network has the potential to reveal prognostic biomarkers for use in OC. Further, a correlation analysis between the lncRNAs and mRNAs was performed. The results suggested that the correlation of the lncRNA LINC00924 and the mRNA ZEB2 was highest. Finally, eight survival-associated lncRNAs were selected to calculate risk scores for individuals with OC using LASSO-penalized Cox regression analysis.
To the best of our knowledge, five of the eight survival-related lncRNAs [HAND2-AS1, PART1, WDFY3-AS2, VLDLR-AS1 (32) and LEMD1-AS1] have been identified previously. Of note, HAND2-AS1 (33), PART1 (34), WDFY3-AS2 (35) and LEMD1-AS1 (36) have been identified in OC. By contrast, no previous studies have reported the involvement of LINC00924, AC007383.2 or AC002467.1 in cancer. Among the lncRNAs identified, HAND2-AS1 is a well-studied tumor suppressor gene. In cancers such as hepatocellular carcinoma (37), breast cancer (38) and endometrial cancer (30), HAND2-AS1 was indicated to inhibit proliferation, invasion and migration of cancer cells. Wang et al (33) demonstrated that HAND2-AS1 suppresses OC growth via BCL2L11 upregulation by competitively binding to miR-340-5p, which indicates that it has potential diagnostic and therapeutic value. Furthermore, HAND2-AS1 drives liver cancer stem cell self-renewal via BMP signaling and it drives liver oncogenesis, providing a potential new target for hepatocellular carcinoma therapy (33). Consistent with the previous studies, the present results suggested that HAND2-AS1 is downregulated by 6-fold in OC and it is associated with favorable prognosis. By contrast, the lncRNA PART1 is considered an oncogene in several cancer types, including OC. It regulates colorectal cancer by activating the Wnt/β-catenin pathway. Inhibition of PART1 hinders colorectal cancer cell proliferation, invasion and migration, while promoting colorectal cancer cell apoptosis (39). In non-small cell lung cancer cells, PART1 promotes in vivo and in vitro lung cancer progression via the JAK-STAT signaling pathway (40). Similar conclusions have been reached regarding cancers such as hepatocellular carcinoma (41), tongue squamous cell carcinoma (41) and prostate cancer (42). Furthermore, after exosome-mediated transfer of PART1, it was able to induce gefitinib resistance in esophageal cancer by functioning as a ceRNA (43). WDFY3-AS2 is another confirmed tumor suppressor gene that is able to restrain breast cancer progression (44) and diffuse glioma progression (45). WDFY3-AS2 was reported to regulate epithelial-to-mesenchymal transition (EMT) in hepatocellular carcinoma (45). Li et al (35) used gain- and loss-of-function experiments to confirm that WDFY3-AS2 suppressed OC cell proliferation, migration, invasion and EMT, accompanied by enhanced apoptosis.
As detailed above, numerous previous studies provided vast theoretical information and experimental data to support the ceRNA regulatory network predicted by the present study. However, the exact functions of lncRNAs in OC remain largely elusive. In addition, due to differences in platforms, parameter settings and correction methods, contradictory findings may exist among bioinformatics analyses. Hence, in vivo and in vitro experiments are necessary for further validation.
Supplementary Material
Supporting Data
Acknowledgements
Not applicable.
Funding
This study was supported by Guangdong Medical Research Foundation, China (grant no. A2020578).
Availability of data and materials
The datasets analyzed during the current study are available as public datasets (TCGA: https://portal.gdc.cancer.gov/; GTEx: http://gtexportal.org/home/datasets).
Authors' contributions
WW conceived the study and performed the bioinformatics analyses. CG downloaded and organized the clinical and gene expression data. DZ performed the statistical analyses. WW wrote the original draft. LC participated in the analysis of data, and was involved in drafting the manuscript and revising it critically for important intellectual content. SG made substantial contributions to the concept and design of the study, the analysis and interpretation of data, and the writing of manuscript. All authors confirm the authenticity of all the raw data. All authors read and approved the final manuscript.
Ethics approval and consent to participate
Not applicable.
Patient consent for publication
Not applicable.
Competing interests
The authors declare that they have no competing interests.
References
|
1
|
Torre LA, Bray F, Siegel RL, Ferlay J, Lortet-Tieulent J and Jemal A: Global cancer statistics, 2012. CA Cancer J Clin. 65:87–108. 2015. View Article : Google Scholar : PubMed/NCBI
|
|
2
|
Siegel RL, Miller KD and Jemal A: Cancer statistics, 2020. CA Cancer J Clin. 70:7–30. 2020. View Article : Google Scholar : PubMed/NCBI
|
|
3
|
Esselen KM, Cronin AM, Bixel K, Bookman MA, Burger RA, Cohn DE, Cristea M, Griggs JJ, Levenback CF, Mantia-Smaldone G, et al: Use of CA-125 Tests and Computed Tomographic Scans for Surveillance in Ovarian Cancer. JAMA Oncol. 2:1427–1433. 2016. View Article : Google Scholar : PubMed/NCBI
|
|
4
|
Cabili MN, Trapnell C, Goff L, Koziol M, Tazon-Vega B, Regev A and Rinn JL: Integrative annotation of human large intergenic noncoding RNAs reveals global properties and specific subclasses. Genes Dev. 25:1915–1927. 2011. View Article : Google Scholar : PubMed/NCBI
|
|
5
|
Mercer TR, Dinger ME, Sunkin SM, Mehler MF and Mattick JS: Specific expression of long noncoding RNAs in the mouse brain. Proc Natl Acad Sci USA. 105:716–721. 2008. View Article : Google Scholar : PubMed/NCBI
|
|
6
|
Ravasi T, Suzuki H, Pang KC, Katayama S, Furuno M, Okunishi R, Fukuda S, Ru K, Frith MC, Gongora MM, et al: Experimental validation of the regulated expression of large numbers of non-coding RNAs from the mouse genome. Genome Res. 16:11–19. 2006. View Article : Google Scholar : PubMed/NCBI
|
|
7
|
Ulitsky I and Bartel DP: lincRNAs: Genomics, evolution, and mechanisms. Cell. 154:26–46. 2013. View Article : Google Scholar : PubMed/NCBI
|
|
8
|
Xiong X-D, Ren X, Cai M-Y, Yang JW, Liu X and Yang J-M: Long non-coding RNAs: An emerging powerhouse in the battle between life and death of tumor cells. Drug Resist Updat. 26:28–42. 2016. View Article : Google Scholar : PubMed/NCBI
|
|
9
|
Salmena L, Poliseno L, Tay Y, Kats L and Pandolfi PP: A ceRNA hypothesis: The Rosetta Stone of a hidden RNA language? Cell. 146:353–358. 2011. View Article : Google Scholar : PubMed/NCBI
|
|
10
|
Cao Z, Pan X, Yang Y, Huang Y and Shen H-B: The lncLocator: A subcellular localization predictor for long non-coding RNAs based on a stacked ensemble classifier. Bioinformatics. 34:2185–2194. 2018. View Article : Google Scholar : PubMed/NCBI
|
|
11
|
Yan X, Hu Z, Feng Y, Hu X, Yuan J, Zhao SD, Zhang Y, Yang L, Shan W, He Q, et al: Comprehensive Genomic Characterization of Long Non-coding RNAs across Human Cancers. Cancer Cell. 28:529–540. 2015. View Article : Google Scholar : PubMed/NCBI
|
|
12
|
Bhan A, Soleimani M and Mandal SS: Long Noncoding RNA and Cancer: A New Paradigm. Cancer Res. 77:3965–3981. 2017. View Article : Google Scholar : PubMed/NCBI
|
|
13
|
Slack FJ and Chinnaiyan AM: The Role of Non-coding RNAs in Oncology. Cell. 179:1033–1055. 2019. View Article : Google Scholar : PubMed/NCBI
|
|
14
|
Hosono Y, Niknafs YS, Prensner JR, Iyer MK, Dhanasekaran SM, Mehra R, Pitchiaya S, Tien J, Escara-Wilke J, Poliakov A, et al: Oncogenic Role of THOR, a Conserved Cancer/Testis Long Non-coding RNA. Cell. 171:1559–1572.e1520. 2017. View Article : Google Scholar : PubMed/NCBI
|
|
15
|
Sun TT, He J, Liang Q, Ren LL, Yan TT, Yu TC, Tang JY, Bao YJ, Hu Y, Lin Y, et al: lncRNA GClnc1 Promotes Gastric Carcinogenesis and May Act as a Modular Scaffold of WDR5 and KAT2A Complexes to Specify the Histone Modification Pattern. Cancer Discov. 6:784–801. 2016. View Article : Google Scholar : PubMed/NCBI
|
|
16
|
Bai Y, Long J, Liu Z, Lin J, Huang H, Wang D, Yang X, Miao F, Mao Y, Sang X, et al: Comprehensive analysis of a ceRNA network reveals potential prognostic cytoplasmic lncRNAs involved in HCC progression. J Cell Physiol. 234:18837–18848. 2019. View Article : Google Scholar : PubMed/NCBI
|
|
17
|
Li N and Zhan X: Identification of clinical trait-related lncRNA and mRNA biomarkers with weighted gene co-expression network analysis as useful tool for personalized medicine in ovarian cancer. EPMA J. 10:273–290. 2019. View Article : Google Scholar : PubMed/NCBI
|
|
18
|
Zerbino DR, Achuthan P, Akanni W, Amode MR, Barrell D, Bhai J, Billis K, Cummins C, Gall A, Girón CG, et al: Ensembl 2018. Nucleic Acids Res. 46D:D754–D761. 2018. View Article : Google Scholar : PubMed/NCBI
|
|
19
|
Yu G, Wang L-G, Han Y and He Q-Y: clusterProfiler: An R package for comparing biological themes among gene clusters. OMICS. 16:284–287. 2012. View Article : Google Scholar : PubMed/NCBI
|
|
20
|
Jeggari A, Marks DS and Larsson E: miRcode: A map of putative microRNA target sites in the long non-coding transcriptome. Bioinformatics. 28:2062–2063. 2012. View Article : Google Scholar : PubMed/NCBI
|
|
21
|
Chou C-H, Chang N-W, Shrestha S, Hsu SD, Lin YL, Lee WH, Yang CD, Hong HC, Wei TY, Tu SJ, et al: miRTarBase 2016: Updates to the experimentally validated miRNA-target interactions database. Nucleic Acids Res. 44D:D239–D247. 2016. View Article : Google Scholar : PubMed/NCBI
|
|
22
|
Wong N and Wang X: miRDB: An online resource for microRNA target prediction and functional annotations. Nucleic Acids Res. 43D:D146–D152. 2015. View Article : Google Scholar : PubMed/NCBI
|
|
23
|
Agarwal V, Bell GW, Nam JW and Bartel DP: Predicting effective microRNA target sites in mammalian mRNAs. eLife. 4:e050052015. View Article : Google Scholar : PubMed/NCBI
|
|
24
|
Livak KJ and Schmittgen TD: Analysis of relative gene expression data using real-time quantitative PCR and the 2(-Delta Delta C(T)) Method. Methods. 25:402–408. 2001. View Article : Google Scholar : PubMed/NCBI
|
|
25
|
Webb PM and Jordan SJ: Epidemiology of epithelial ovarian cancer. Best Pract Res Clin Obstet Gynaecol. 41:3–14. 2017. View Article : Google Scholar : PubMed/NCBI
|
|
26
|
Le Page C, Provencher D, Maugard CM, Ouellet V and Mes-Masson AM: Signature of a silent killer: Expression profiling in epithelial ovarian cancer. Expert Rev Mol Diagn. 4:157–167. 2004. View Article : Google Scholar : PubMed/NCBI
|
|
27
|
Guttman M and Rinn JL: Modular regulatory principles of large non-coding RNAs. Nature. 482:339–346. 2012. View Article : Google Scholar : PubMed/NCBI
|
|
28
|
Schmitt AM and Chang HY: Long Noncoding RNAs in Cancer Pathways. Cancer Cell. 29:452–463. 2016. View Article : Google Scholar : PubMed/NCBI
|
|
29
|
Li G, Han L, Ren F, Zhang R and Qin G: Prognostic value of the tumor-specific ceRNA network in epithelial ovarian cancer. J Cell Physiol. 234:22071–22081. 2019. View Article : Google Scholar : PubMed/NCBI
|
|
30
|
Yang X, Wang CC, Lee WYW, Trovik J, Chung TKH and Kwong J: Long non-coding RNA HAND2-AS1 inhibits invasion and metastasis in endometrioid endometrial carcinoma through inactivating neuromedin U. Cancer Lett. 413:23–34. 2018. View Article : Google Scholar : PubMed/NCBI
|
|
31
|
Dong C, Yin F, Zhu D, Cai X, Chen C and Liu X: NCALD affects drug resistance and prognosis by acting as a ceRNA of CX3CL1 in ovarian cancer. J Cell Biochem. 121:4470–4483. 2020. View Article : Google Scholar : PubMed/NCBI
|
|
32
|
Liu H, Zhou T, Wang B, Li L, Ye D and Yu S: Identification and functional analysis of a potential key lncRNA involved in fat loss of cancer cachexia. J Cell Biochem. 119:1679–1688. 2018. View Article : Google Scholar : PubMed/NCBI
|
|
33
|
Wang Y, Zhu P, Luo J, Wang J, Liu Z, Wu W, Du Y, Ye B, Wang D, He L, et al: lncRNA HAND2-AS1 promotes liver cancer stem cell self-renewal via BMP signaling. EMBO J. 38:e1011102019. View Article : Google Scholar : PubMed/NCBI
|
|
34
|
Zhao Q and Fan C: A novel risk score system for assessment of ovarian cancer based on co-expression network analysis and expression level of five lncRNAs. BMC Med Genet. 20:1032019. View Article : Google Scholar : PubMed/NCBI
|
|
35
|
Li W, Ma S, Bai X, Pan W, Ai L and Tan W: Long noncoding RNA WDFY3-AS2 suppresses tumor progression by acting as a competing endogenous RNA of microRNA-18a in ovarian cancer. J Cell Physiol. 235:1141–1154. 2020. View Article : Google Scholar : PubMed/NCBI
|
|
36
|
Zheng M, Hu Y, Gou R, Nie X, Li X, Liu J and Lin B: Identification three lncRNA prognostic signature of ovarian cancer based on genome-wide copy number variation. Biomed Pharmacother. 124:1098102020. View Article : Google Scholar : PubMed/NCBI
|
|
37
|
Yang Y, Chen L, Gu J, Zhang H, Yuan J, Lian Q, Lv G, Wang S, Wu Y, Yang YT, et al: Recurrently deregulated lncRNAs in hepatocellular carcinoma. Nat Commun. 8:144212017. View Article : Google Scholar : PubMed/NCBI
|
|
38
|
Wang Y and Cai X: Long noncoding RNA HAND2-AS1 restrains proliferation and metastasis of breast cancer cells through sponging miR-1275 and promoting SOX7. Cancer Biomark. 27:85–94. 2020. View Article : Google Scholar : PubMed/NCBI
|
|
39
|
Zhou T, Wu L, Ma N, Tang F, Zong Z and Chen S: lncRNA PART1 regulates colorectal cancer via targeting miR-150-5p/miR-520h/CTNNB1 and activating Wnt/β-catenin pathway. Int J Biochem Cell Biol. 118:1056372020. View Article : Google Scholar : PubMed/NCBI
|
|
40
|
Zhu D, Yu Y, Wang W, Wu K, Liu D, Yang Y, Zhang C, Qi Y and Zhao S: Long noncoding RNA PART1 promotes progression of non-small cell lung cancer cells via JAK-STAT signaling pathway. Cancer Med. 8:6064–6081. 2019. View Article : Google Scholar : PubMed/NCBI
|
|
41
|
Ye J, Zhang J, Lv Y, Wei J, Shen X, Huang J, Wu S and Luo X: Integrated analysis of a competing endogenous RNA network reveals key long noncoding RNAs as potential prognostic biomarkers for hepatocellular carcinoma. J Cell Biochem. 120:13810–13825. 2019. View Article : Google Scholar : PubMed/NCBI
|
|
42
|
Sun M, Geng D, Li S, Chen Z and Zhao W: lncRNA PART1 modulates toll-like receptor pathways to influence cell proliferation and apoptosis in prostate cancer cells. Biol Chem. 399:387–395. 2018. View Article : Google Scholar : PubMed/NCBI
|
|
43
|
Kang M, Ren M, Li Y, Fu Y, Deng M and Li C: Exosome-mediated transfer of lncRNA PART1 induces gefitinib resistance in esophageal squamous cell carcinoma via functioning as a competing endogenous RNA. J Exp Clin Cancer Res. 37:1712018. View Article : Google Scholar : PubMed/NCBI
|
|
44
|
Deva Magendhra Rao AK, Patel K, Korivi Jyothiraj S, Meenakumari B, Sundersingh S, Sridevi V, Rajkumar T, Pandey A, Chatterjee A, Gowda H, et al: Identification of lncRNAs associated with early-stage breast cancer and their prognostic implications. Mol Oncol. 13:1342–1355. 2019. View Article : Google Scholar : PubMed/NCBI
|
|
45
|
Wu F, Zhao Z, Chai R, Liu Y, Wang K, Wang Z, Li G, Huang R, Jiang H and Zhang K: Expression profile analysis of antisense long non-coding RNA identifies WDFY3-AS2 as a prognostic biomarker in diffuse glioma. Cancer Cell Int. 18:1072018. View Article : Google Scholar : PubMed/NCBI
|


