Introduction
Helicobacter pylori (HP) has been classified
as a group I carcinogen by The International Agency for Research on
Cancer (1). A previous study
revealed that chronic gastritis and gastric ulcers were caused by
HP, which may be a factor to increase the risk of gastric cancer
(2). However, the exact mechanism of
how HP is involved in the development of gastric cancer has not
been elucidated.
MicroRNAs (miRNAs/miRs) are short non-coding RNAs
that can regulate the translation of genes by binding to the
3′-untranslated regions of the target gene (3). miRNAs are involved in various important
biological processes in the development of gastric cancer, such as
cell proliferation, invasion and metastasis (4). Previous studies have found that miRNAs
play significant roles in the regulation of tumor biology (5–7), and in
the regulation of the physiology and pathology of the immune system
(8). Some miRNAs serve as
therapeutic targets or as prognostic biomarkers of gastric cancer
(9,10). For example, poor prognosis and
advanced features in patients with non-small cell lung cancer could
be predicted by the downregulation of miR-503 expression (11).
Transcription factors (TFs) are significant
regulatory factors that can serve as oncogenes or tumor suppressors
by binding to the target genes in the gene expression pathway
(12,13). TFs serve as regulators that act at
the transcriptional level, while miRNAs function at the
post-transcriptional level (3,12). A
large number of studies (14–16) have
shown that transcriptional and post-transcriptional regulators of
gene expression interact with each other in the molecular pathology
of numerous diseases, such as the role of FBL in epithelial
mesenchymal transition and cardiogenesis (17). miRNAs and TFs are regulated by each
other in feedback loops (17).
Previous studies have reported that miRNAs are regulated by TFs
(TF-miRNA regulation); for example, the identification of a
TF-miRNA network was found in esophageal adenocarcinoma using
bioinformatics analysis (18).
However, associations between the TF-miRNA-mRNA network and
HP-associated gastric cancer have not been investigated. The aim of
the present study was to identify the hub genes and TF-miRNA axes,
and to identify the potential mechanisms involved in HP-associated
gastric cancer.
Materials and methods
Patients and tissue specimens
A total of 30 tumor tissues [10 HP-negative (−) and
20 HP-positive (+)] were collected from patients with gastric
cancer who underwent gastrectomy at the Department of
Gastrointestinal Surgery, Union Hospital of Huazhong University of
Science and Technology (Wuhan, China). All procedures were approved
by the Ethics Committee of the Union Hospital of Huazhong
University of Science and Technology, and conducted according to
Declaration of Helsinki principles. Prior written and informed
consent was obtained from each patient or their guardians. The
clinicopathological information of the patients is shown in
Table SI.
Data sourcing and processing
Genes and miRNA expression profiles, as well as the
corresponding clinical information, from patients with gastric
cancer, were downloaded from The Cancer Genome Atlas (TCGA)
database using TCGA biolinks package (19). Samples containing clear HP infection
information were included. Samples with unavailable HP infection
information, samples of paracancer tissue and samples of normal
tissue were removed. The HP status of the tissue samples from the
enrolled patients was confirmed using a 13C-urea breath test with
75 mg urea (UREA 13C breath test Heliforce kit; Beijing
Richen-Force Science & Technology Co. Ltd.). A total of 141
gastric samples [16 cases were HP(+) and 125 cases were HP(−)] were
selected for the following bioinformatics analysis. The
differentially expressed genes (DEGs) with significant differential
expression between the HP(+) and HP(−) groups were selected. A gene
would be selected using the following conditions: i) Expression
level 1.2 times higher in 20% of the total number of samples
compared with the median expression level in the total number of
samples; and ii) the variance in the expression level in every
sample was higher than the median level. Subsequently, log2
transformation and Z correction were performed to normalize the
expression value of each gene.
Identification of DEGs and DE miRNAs
(DEMs)
Limma package (20)
was applied to compute DEGs and DEMs based on the aforementioned
normalized mRNA and miRNA expression data. Bayes test was used to
identify DEGs with ≥2 fold-change and a P-value cutoff of 0.05 was
defined as statistically significant.
Gene Ontology (GO) and Kyoto
Encyclopedia of Genes and Genomes (KEGG) pathway enrichment
analysis of DEGs
Genes and gene products were annotated using GO
analysis, which is a common and useful method for identifying
characteristic biological attributes of transcriptome data or from
high-throughput genomic data. KEGG serves as a knowledge base for
systematic analysis of gene functions, and linkage between genomic
information and higher-order functional information.
Comprehensively mapping a set of genes to the associated biological
annotation is an important foundation for the success of the gene
functional analysis of any high-throughput data. KEGG pathway
analysis and GO enrichment was performed using the ClusterProfiler
package (21) to analyze the DEGs at
the functional level. P<0.05 was considered to indicate a
statistically significant difference.
Construction and integration of the
PPI network
The PPI network was investigated using the Search
Tool for the Retrieval of Interacting Genes (STRING) online
database (22). STRING (v11.0) was
used, which covers 24,584,628 proteins from 5,090 organisms. The
DEGs were mapped using the STRING database to determine the
interactive associations among DEGs, and then, the experimentally
validated interactions with a significant combined score >0.4
were selected for further analysis. PPI networks were then
constructed with the CytoScape software (v3.6.1) (23). Subsequently, the sub-network modules
were screened using the plug-in molecular complex detection (MCODE)
in CytoScape. The following screening criteria was used: MCODE
score >3 and node number >6. In addition, the function and
pathway enrichment analysis of DEGs in the sub-module was also
determined. P<0.05 was considered to indicate a statistically
significant difference.
Construction of TF-miRNA-gene
axis
The TFs and DEMs were selected to construct TF-miRNA
regulatory networks using the miRWalk2.0 database (24). The TF-miRNAs were identified as hub
interactions, as predicted by the miRWalk2.0 database,
TargetScan6.2 database (25),
miRanda database (26) and RNA22
database (27) simultaneously. The
miRNA-DEG regulatory networks were constructed across the
aforementioned method. Finally, TF-miRNA-gene axes were constructed
to identify a transcriptional regulation model and reveal
significant networks involved in HP-associated gastric cancer.
Cell culture
The gastric cancer MKN45 cell line was purchased
from the American Type Culture Collection. The MNK-450 cells were
cultured in RPMI 1640 medium (HyClone; Cytiva) with 10% FBS and 1%
penicillin-streptomycin under a humidified atmosphere with 5%
CO2 at 37°C.
Validation of TF and targeted
DEMs
DE TFs and DEMs were confirmed using reverse
transcription-quantitative PCR (RT-qPCR) in samples from enrolled
patients. To confirm the results from the integrated bioinformatics
analysis, 20 fresh HP(+) and 10 fresh HP(−) gastric cancer tissues
were collected and examined by experienced pathologists at the
Department of Gastrointestinal Surgery, Union Hospital of Huazhong
University of Science and Technology between September 1 and
December 30, 2019. The tissue samples were frozen and stored
immediately in liquid nitrogen following surgical resection. Total
cellular RNA was extracted from the gastric samples using RNAiso
Plus (Takara Bio, Inc.). For miRNA quantification, synthesis of
cDNA was performed using the PrimeScript™ RT reagent kit
(GeneCopoeia, Inc.) according to the manufacturer's protocols. The
purity and concentration of RNA was measured using a Nanodrop2000
(Thermo Fisher Scientific, Inc.). qPCR was performed using the
Real-time PCR Detection System (SLAN; Shanghai Hongshi Medical
Technology, Co., Ltd.) and the SYBR Premix Ex Taq II kit (Takara
Bio, Inc.). The conditions of PCR cycling were as following:
Activation of TaqMan at 95°C for 10 min, and then 40 cycles of
denaturation at 95°C for 10 sec, and annealing/extension at 60°C
for 60 sec. Relative miRNA expression levels were normalized to U6,
while mRNA was normalized to GAPDH, and quantification was
performed using the 2−ΔΔCq method (28). The primer sequences are shown in
Table I. R language (https://www.r-project.org/) was used to analyze the
RT-qPCR data. All reactions were performed in triplicate.
 | Table I.Sequences of reverse
transcription-quantitative PCR primers. |
Table I.
Sequences of reverse
transcription-quantitative PCR primers.
| Primers | Sequences
(5′-3′) |
|---|
| HIC1 |
|
|
Forward |
GCGCCGCTGCTCCCCTCTTTGTG |
|
Reverse |
ACCCAGGCCCGGCTCGTGCTTCAT |
| LHX3 |
|
|
Forward |
GCCCAGCCCAGCCCAGCATAGC |
|
Reverse |
GAGAAGGGGCGCCAGGCATTTTTG |
| LMX1B |
|
|
Forward |
GGGGGTGCTGCTGGGCTCCGACTG |
|
Reverse |
CCCCGCTGCCCTTGCTCTGACTGC |
| MAFB |
|
|
Forward |
GCTCGGCGCCCAAATCTCATCAGT |
|
Reverse |
CGGTTTGGCGGGGCGGGTATTTA |
| PAX2 |
|
|
Forward |
GGGCGCGGGCGGAGCACAC |
|
Reverse |
GGGTAGGGGCCGGCCGTTCACAA |
| SLA2 |
|
|
Forward |
TCATCCGGGAGAGCCAGACCAG |
|
Reverse |
GGGCCTAGGCATCATCCAAAGA |
| U6 |
|
|
Forward |
CTCGCTTCGGCAGCACA |
|
Reverse |
AACGCTTCACGAATTTGCGT |
| hsa-miR-144-3p |
|
|
Forward |
GCGCGCGACAGTATAGATGAT |
|
Reverse |
CAGTGCGTGTCGTGGAGT |
| hsa-miR-3176 |
|
|
Forward |
GCGACTGGCCTGGGAC |
|
Reverse |
CAGTGCGTGTCGTGGAGT |
| hsa-miR-592 |
|
|
Forward |
GCGCTTGTGTCAATATGCGA |
|
Reverse |
CAGTGCGTGTCGTGGAGT |
| hsa-miR-659 |
|
|
Forward |
GCGAGGACCTTCCCTGAAC |
|
Reverse |
CAGTGCGTGTCGTGGAGT |
| ZEB1 |
|
|
Forward |
CGCAGTCTGGGTGTAATCGT |
|
Reverse |
TTGCAGTTTGGGCATTCATA |
| GAPDH |
|
|
Forward |
TTAAAAGCAGCCCTGGTGAC |
|
Reverse |
TGTGGTCATGAGTCCTTCCA |
Western blot analysis
Tissue lysates were extracted using the RIPA lysis
buffer (Beyotime Institute of Biotechnology) supplemented with 1%
phenylmethylsulfonyl fluoride (Sigma-Aldrich; Merck KGaA) according
to the manufacturer's instructions. The protein concentration was
measured using the Pierce bicinchoninic acid protein assay kit
(Thermo Fisher Scientific, Inc.). The same amount of protein (30
µg) from all patients with gastric cancer was separated on 10% gels
using SDS-PAGE (Bio-Rad Laboratories, Inc.) and transferred onto a
PVDF membrane (EMD Millipore) After that, the membrane was blocked
for 1 h with 5% non-fat milk and 1X TBST (0.05%) at room
temperature. Next, the primary antibodies were used to incubate the
membrane at 4°C overnight followed by incubation with secondary
antibodies for 2 h at room temperature. β-actin was used as a
loading control. The following primary antibodies were used: Rabbit
anti-ZEB1 (1:1,000; cat. no. 021544-1-AP; ProteinTech Group, Inc.),
rabbit anti-LHX3 (1:1,000; cat. no. 20745-1-AP, ProteinTech Group,
Inc.), rabbit anti-PAX2 (1:2,000; cat. no. ab79389; Abcam) and
mouse anti-β-actin (1:5,000; cat. no. 60008-1-Ig; ProteinTech
Group, Inc.). Anti-mouse IgG (1:5,000; cat. no. ab208001; Abcam)
and anti-rabbit IgG (1:5,000; cat. no. ab207999; Abcam) were used
as the secondary antibodies. Proteins bands were visualized using
electrochemiluminescence (ECL Western Blotting Substrate; cat. no.
32106; Pierce; Thermo Fisher Scientific, Inc.) and analyzed using
the ChemiDoc™ XRS Molecular Imager 3.0 system (Bio-Rad
Laboratories, Inc.).
Transfection
ZEB1-small interfering (si)RNA (siZEB1), PAX2-siRNA
(siPAX2) and corresponding negative control (NC-siRNA) (Table II) were purchased from Guangzhou
RiboBio Co., Ltd. ZEB1 and PAX2 pcDNA3.1 plasmid (ZEB1 and PAX2
overexpression plasmid) and the control vector were purchased from
Shanghai GeneChem Co., Ltd. All siRNAs were transfected at a final
concentration of 50 nmol/l, and the plasmid was transfected at
final concentration using 1.6 µg for a 12-well plate.
Lipofectamine® 3000 (Invitrogen; Thermo Fisher
Scientific, Inc.) was used for cell transfection at 37°C for 48 h
according to the manufacturer's instructions and then subsequent
experiments were immediately performed. The promoter reporter
construct (ΔE-box) was constructed with the QuikChange
site-directed mutagenesis kit (Stratagene; Agilent Technologies,
Inc.).
| Table II.Sequences of siRNAs. |
Table II.
Sequences of siRNAs.
| siRNA targets | Sequences
(5′-3′) |
|---|
| PAX2-siRNA |
|
|
Sense |
CGACUAUGUUCGCCUGGGATT |
|
Antisense |
UCCCAGGCGAACAUAGUCGGG |
| ZEB1-siRNA |
|
|
Sense |
GCGGCGCAAUAACGUUACAAA |
|
Antisense |
UGUAACGUUAUUGCGCCGCGG |
| NC-siRNA |
|
|
Sense |
UAUAAGUGUGACUACUAACTT |
|
Antisense |
GUUAGUAGUCACACUUAUATT |
Luciferase reporter assay
The JASPAR database (http://jaspar.genereg.net) was used to predict the
binding region of the miRNA-144 according to the manufacturer's
protocols (29). To determine
whether ZEB1 targeted the promoter region of the miR-144 gene,
using Lipofectamine 3000, the gastric adenocarcinoma MKN-45 cell
line was transfected with the recombinant pGL4.1 plasmid (Promega
Corporation), including the wild-type or mutant miR-144 gene
promoter, empty vector, ZEB1 overexpression plasmid and siZEB1 and
NC (siNC). The empty vector and siNC were used as the negative
controls for the luciferase reporter gene assay. After 48 h,
firefly and Renilla luciferase activities were detected
using the dual-luciferase reporter assay system (Promega
Corporation). Renilla luciferase activity was used for
normalization.
Statistical analysis
Statistical analyses were performed applying R
software (4.0.0; http://www.r-project.org/) unless otherwise noted. All
results are presented as the mean ± SD and were assessed via
Graphpad Prism 7 (Graphpad Software, Inc.). The significance of
differences between two groups was evaluated via Student's unpaired
t-test, and the comparison among multiple groups was conducted via
one-way ANOVA followed by the LSD post hoc test. All experiments
were performed 3 times. P<0.05 was used to indicate a
statistically significant difference.
Results
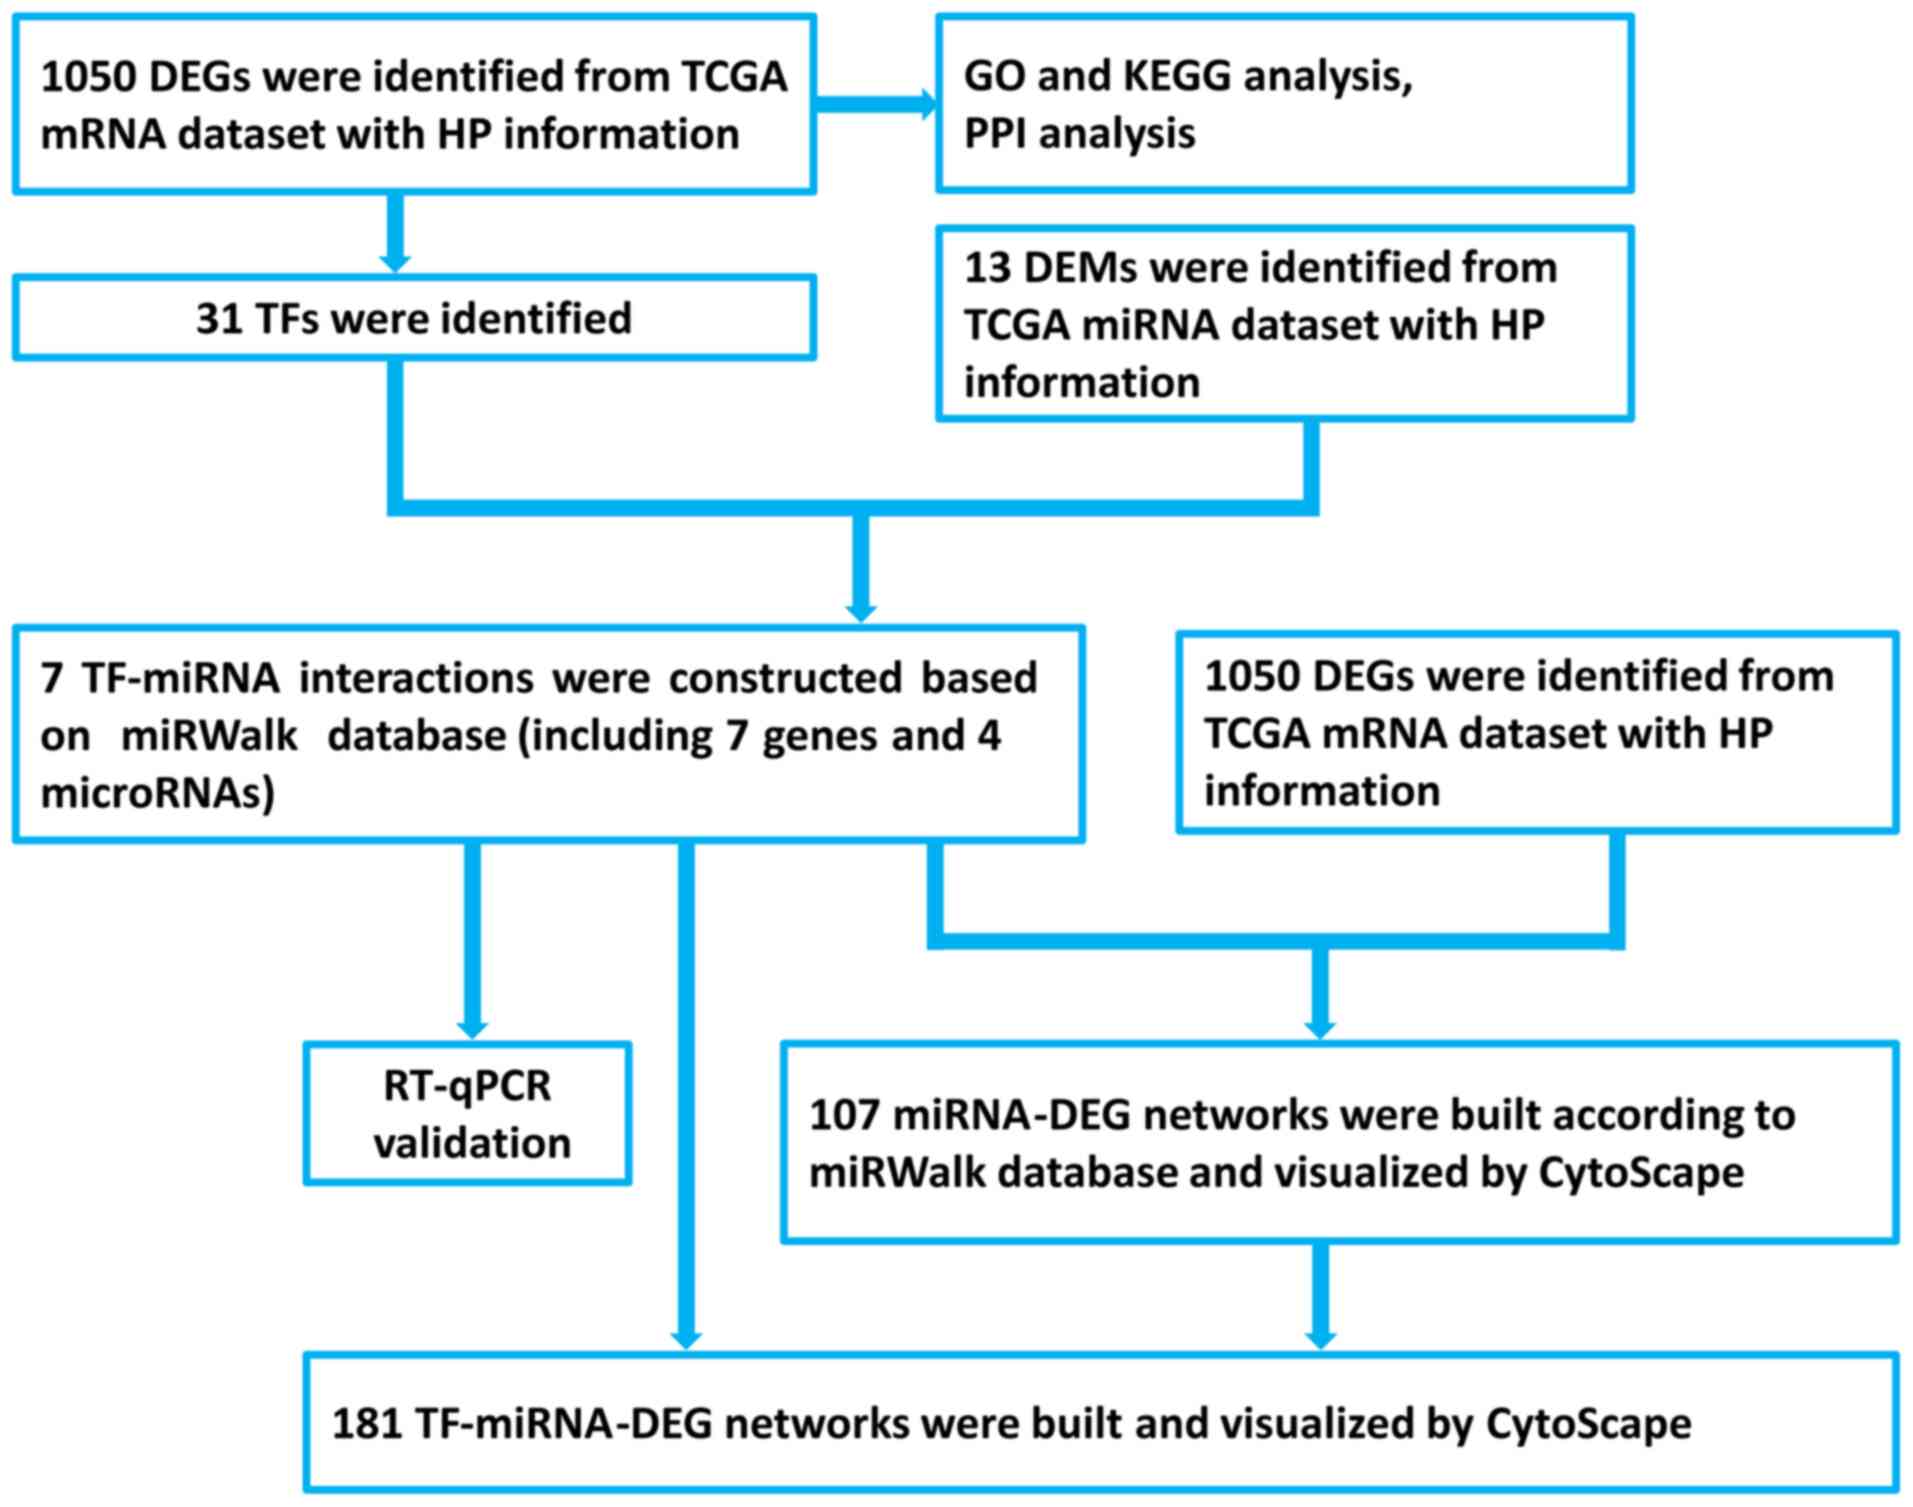
Identification of DEGs and DEMs
There were 24,991 gene and 1,881 miRNA expression
profiles from 141 gastric cancer samples obtained from TCGA mRNA
and miRNA datasets, respectively. A total of 1,050 genes and 13
miRNAs were found to be DE in the HP-associated gastric cancer
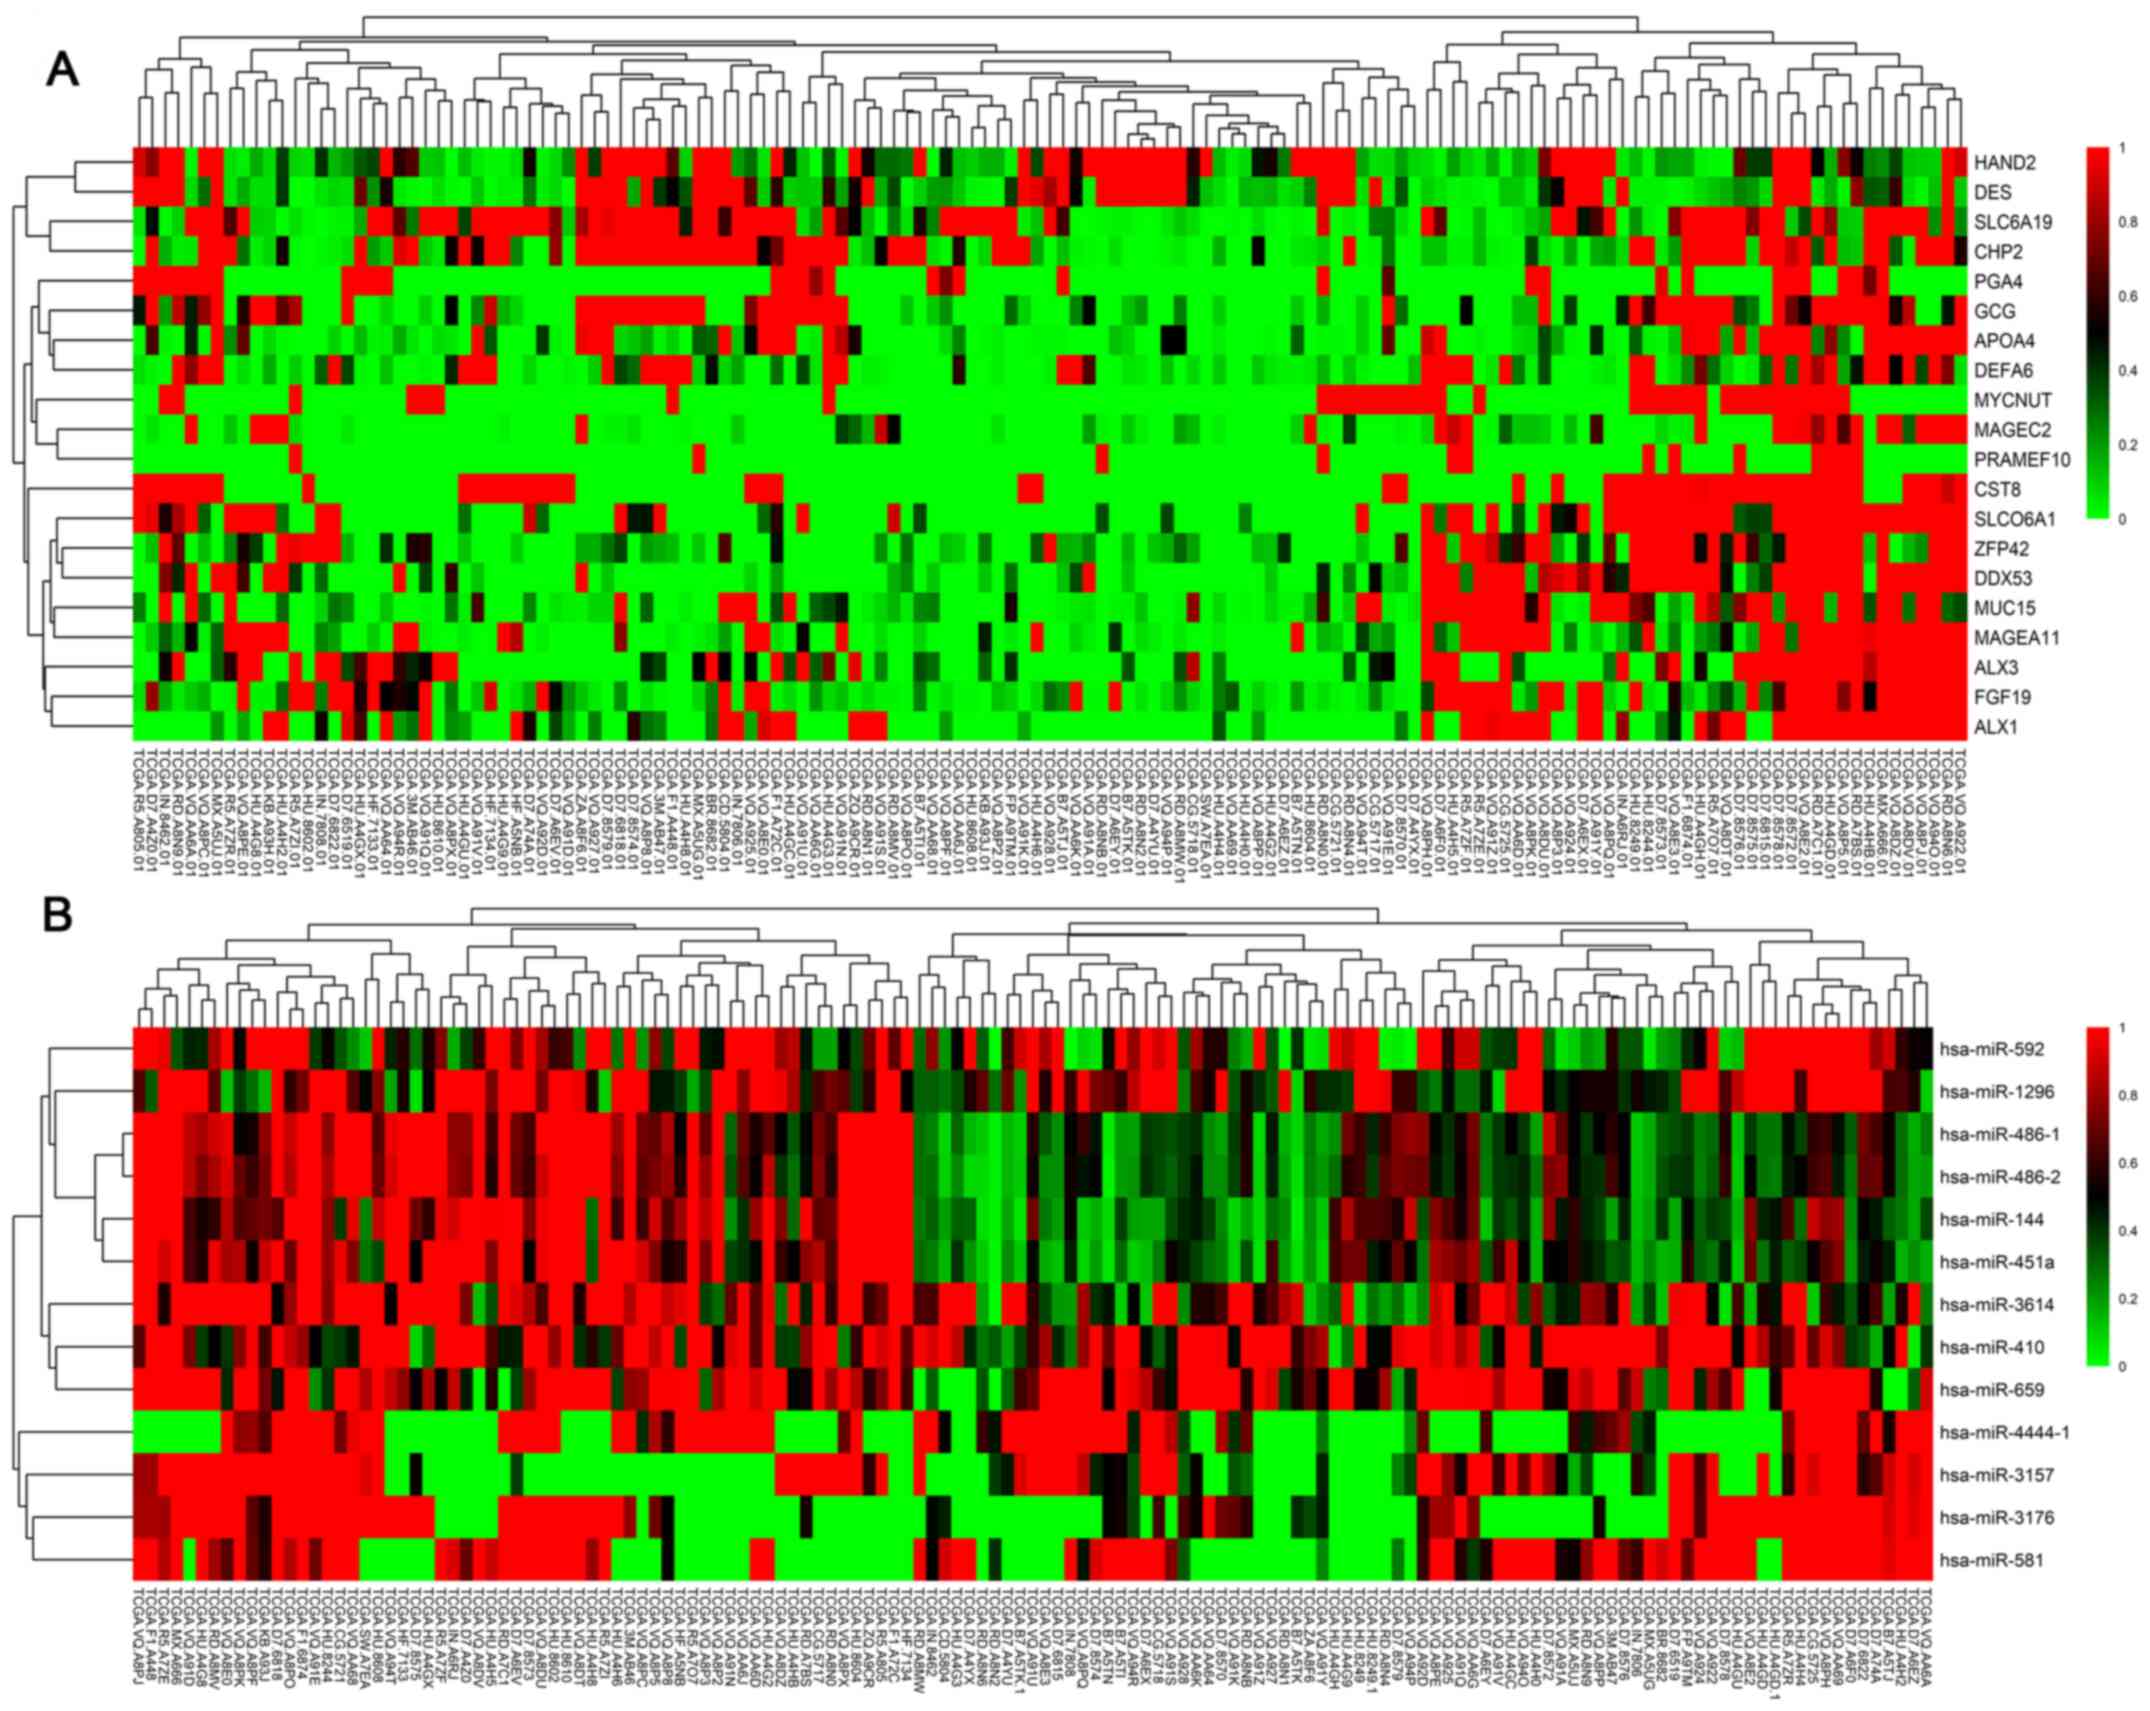
samples, as shown in Fig. 1. The top
20 DEGs are shown in Fig. 2A, while
the 13 DEMs are listed in Fig.
2B.
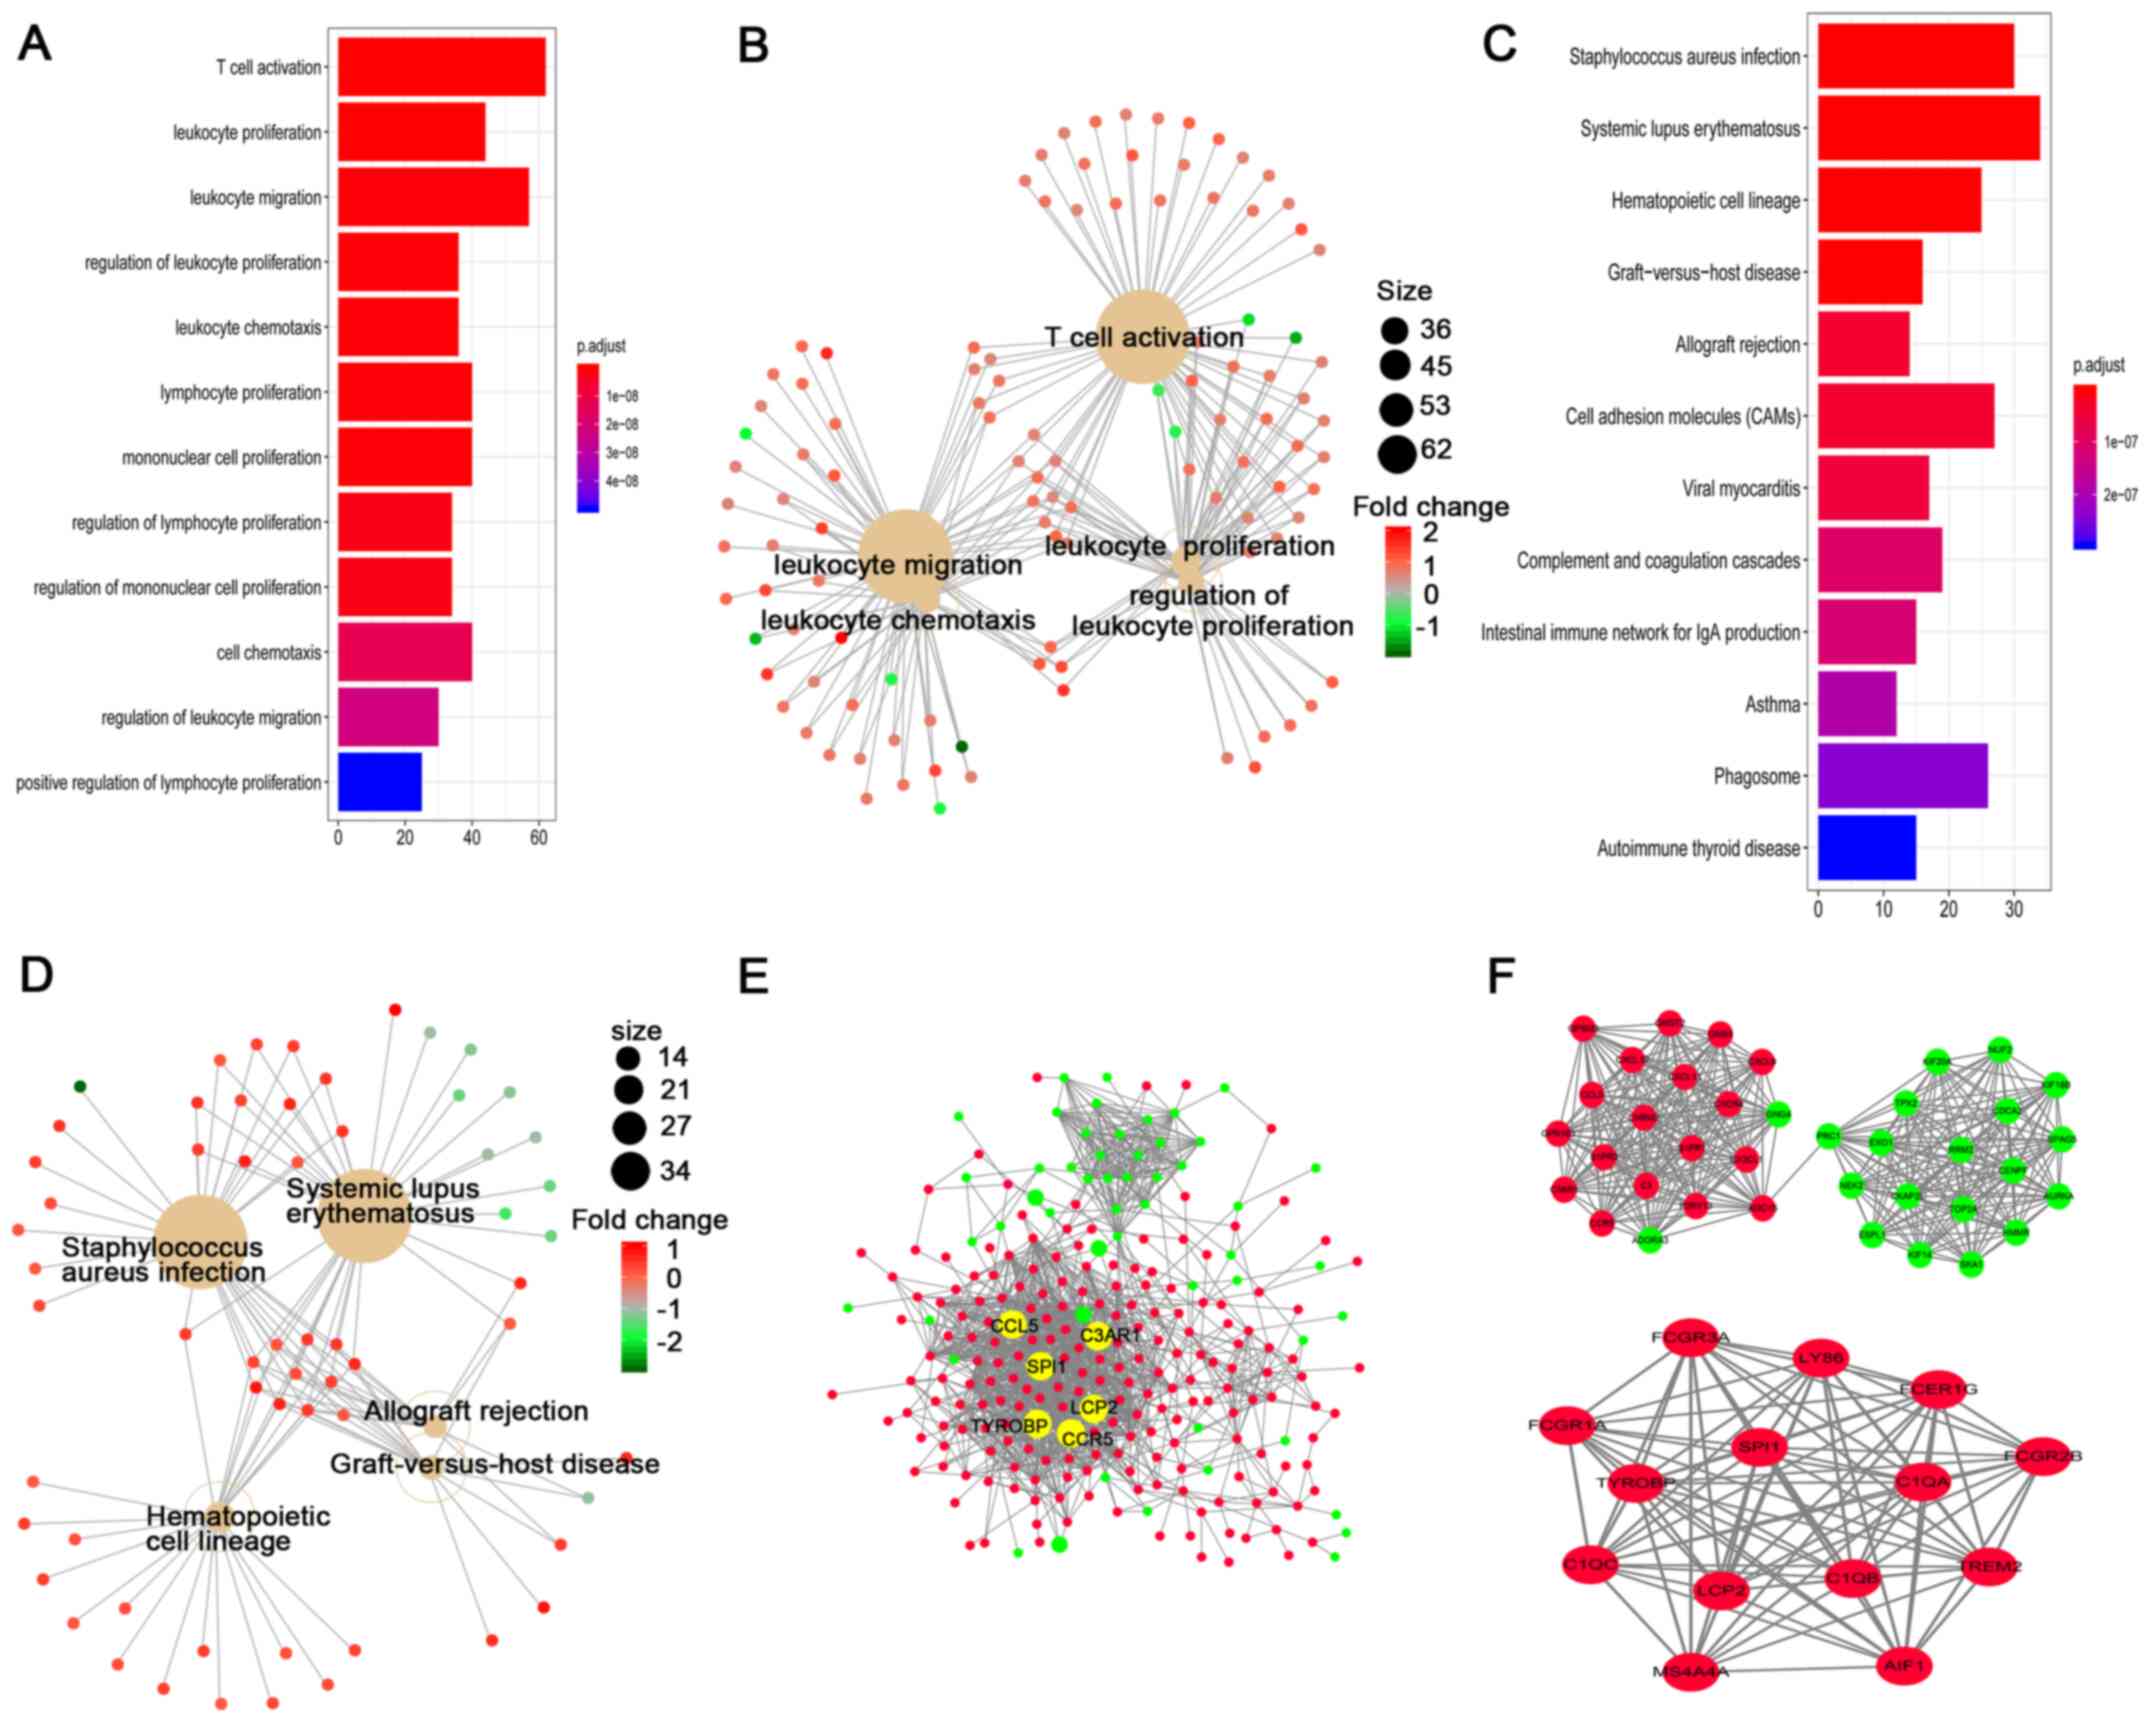
Gene set enrichment analysis
All of the 1,050 DEGs identified, which were based
on the normalized mRNA expression data, were screened for gene set
enrichment analysis. A total of 180 significant enrichments were
identified using the GO analysis, including in the three main
categories of biological process, cell component and molecular
function. The top three GO terms were ‘T cell activation’,
‘leukocyte proliferation’ and ‘leukocyte migration’. The top 12 GO
terms according to the P-values and the top 5 GO enrichments with
the gene linkages are displayed in Fig.
3A and B, respectively. Pathway analysis using the KEGG
database found that these genes were significantly enriched in
‘Staphylococcus aureus infection’, ‘systemic lupus
erythematosus’ and ‘hematopoietic cell lineage’. The top 12 KEGG
pathways and the top 5 pathways with the gene linkages are
displayed in Fig. 3C and D,
respectively.
PPI network and sub-network
analyses
The top 400 DEGs were imported into the STRING
database to identify the interactive association between the
proteins. Only the genes with a combined score >0.4 were
selected to create the network. Finally, 1,434 pairs of protein
associations were identified following removal of the unmatched
genes. In addition, genes with >60 edges were considered as hub
genes. A total of 6 significant genes were identified based the
annotated information from the STRING database: TYROBP, CCR5,
C3AR1, LCP2, CCL5 and SPI1 (Fig.
3E).
A total of 252 nodes and 1,434 edges were analyzed
using the plug-in, MCODE. The top 2 significant modules were
selected for the gene functional annotation involved in the
modules. Enrichment analysis showed that the genes in those 2
modules were primarily associated with phytochelatin metabolic
process and positive regulation of apoptosis (Fig. 3F).
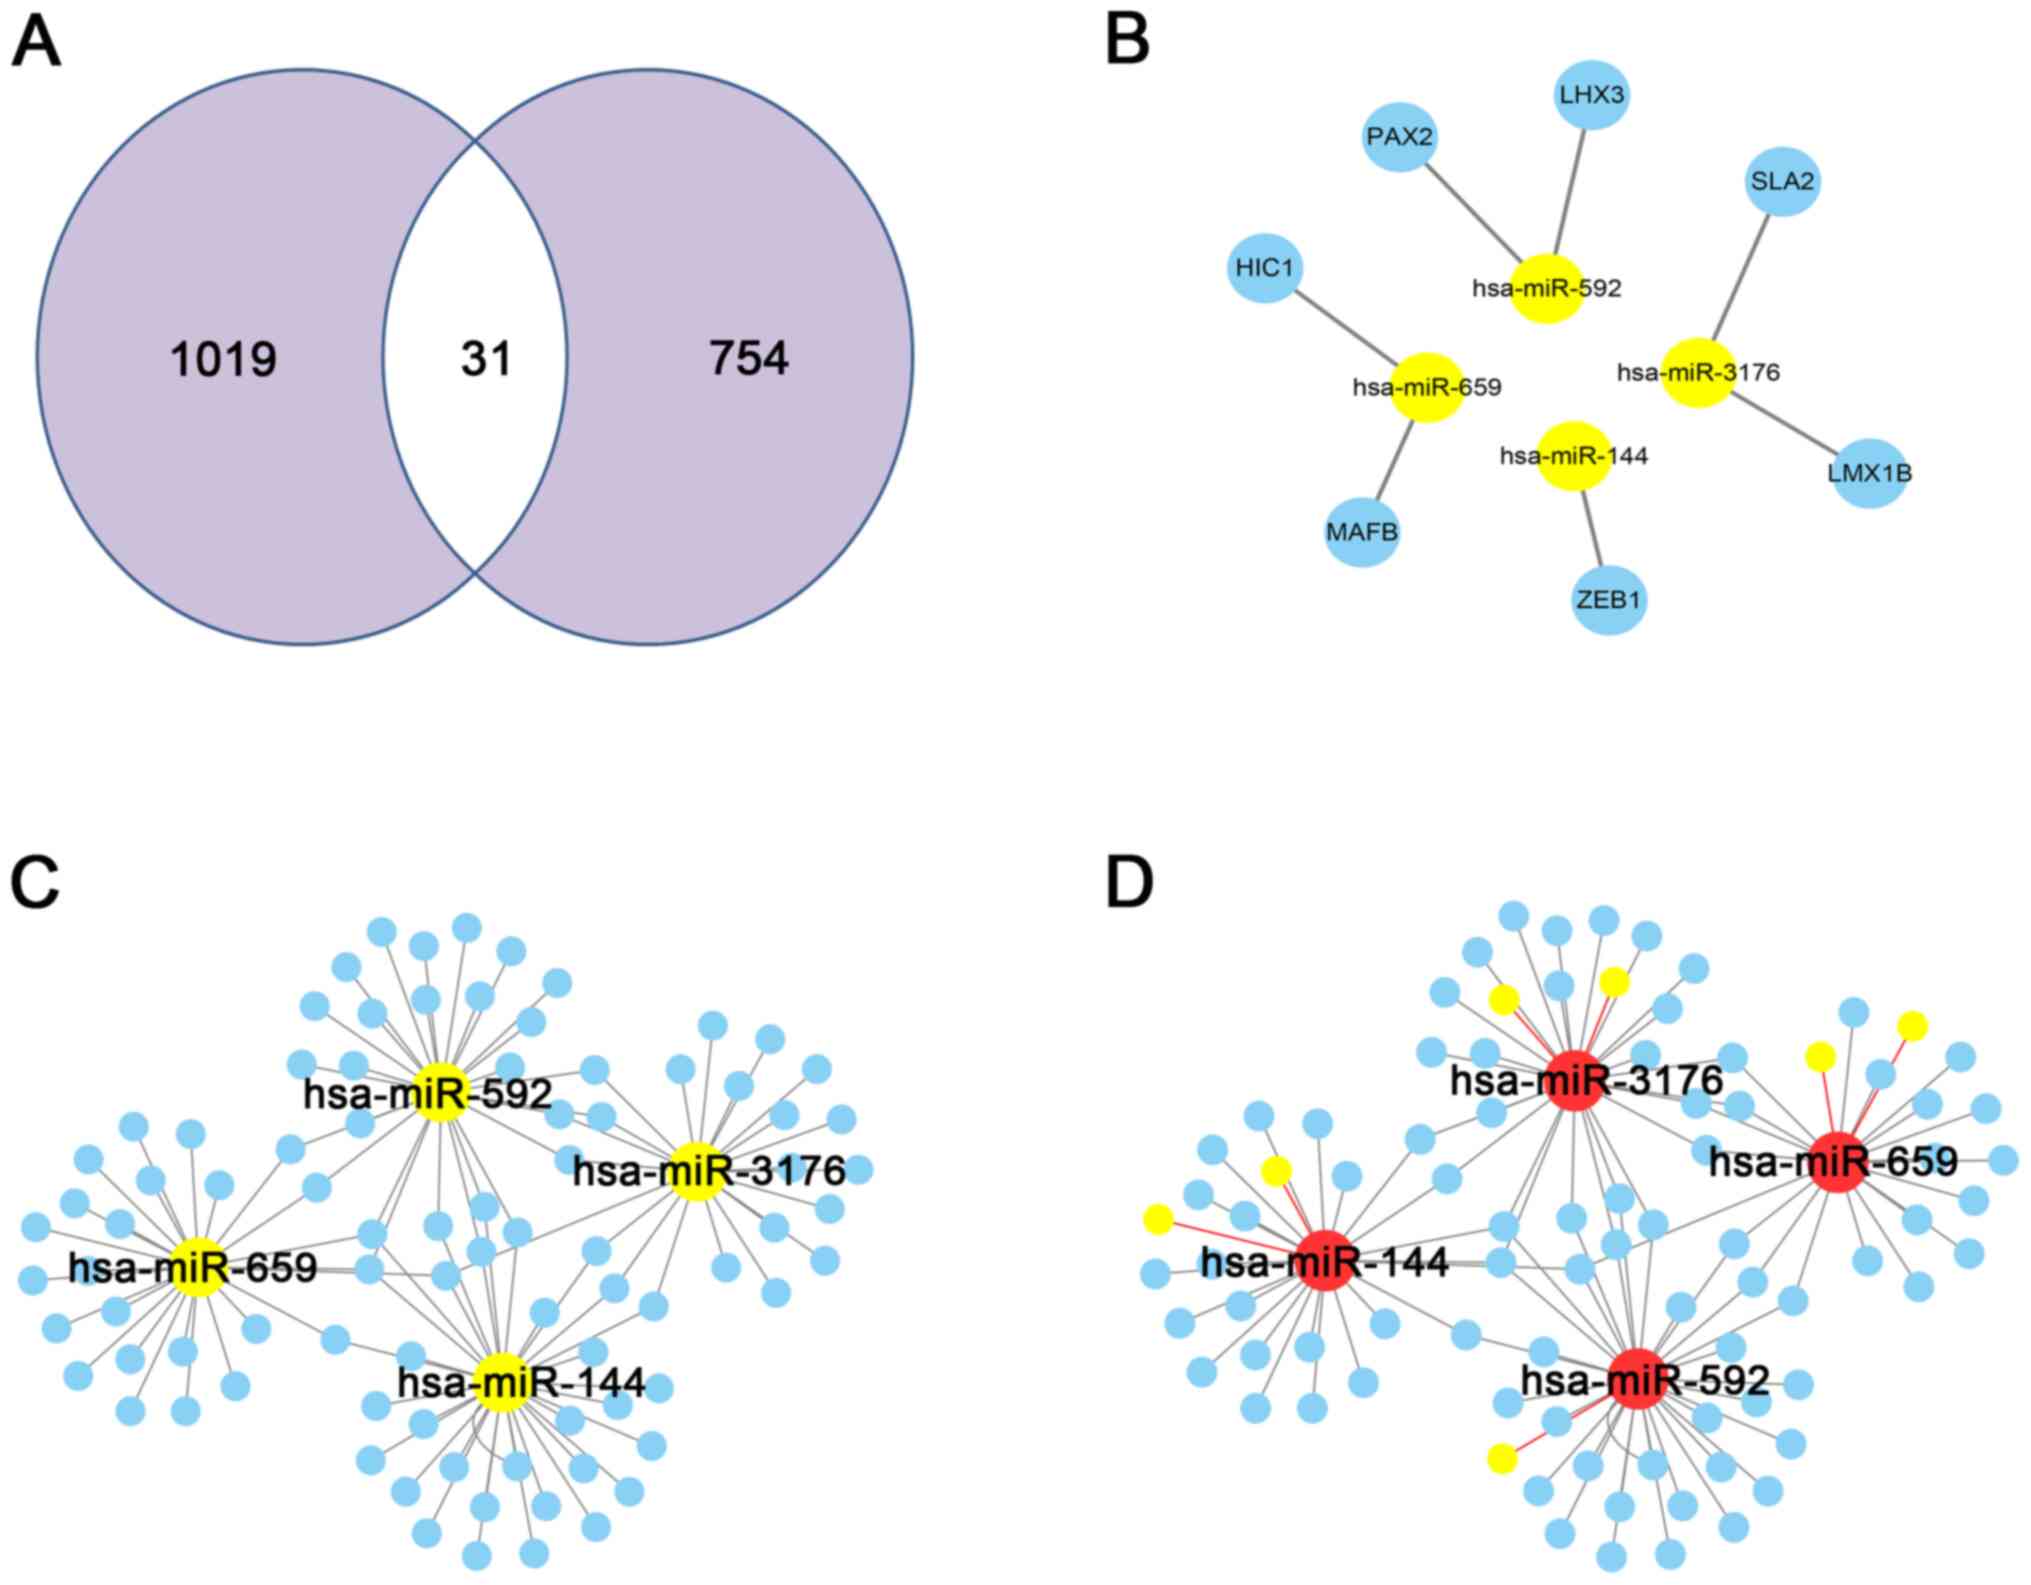
Construction of the TF-miRNA-mRNA
network
Using the mRNA and miRNA expression data from TCGA
database, 1,050 DEGs and 13 DEMs were identified. From these, 31 DE
TFs were identified from the Trrust database (Fig. 4A). Next, the regulatory associations
were constructed using the 31 TFs and 13 miRNAs and the miRWalk
database, and finally, 7 TF-miRNA pairs (including 7 genes and 4
miRNAs) were constructed (Fig. 4B).
Subsequently, 107 pairs of miRNA-DEG interactions were also
constructed using the 4 miRNAs and 1,050 DEGs, and the miRWalk
database (Fig. 4C). Combining the
aforementioned regulatory associations, 181 TF-miRNA-DEG regulatory
associations were finally identified (Fig. 4D) (Table
III).
| Table III.Regulatory relations of 181
TF-miRNA-differentially expressed genes. |
Table III.
Regulatory relations of 181
TF-miRNA-differentially expressed genes.
| TF | miRNA | Target gene |
|---|
| HIC1 | hsa-miR-659 | ADCY5, CRHR1,
CYP1B1, DPYSL3, KCNMA1, MYH11, PRKG1, SFRP1, SLIT2, TLR7, GPR88,
CYS1, NRK, C7, HIC1, KCNC1, MYLK, NFATC4, CXCL12, USH2A, SDPR,
MPDZ, MAFB, CD96, SMOC2, TNFAIP8L2, MACC1 |
| LHX3 | hsa-miR-592 | C7, CYP1B1, PAX2,
CDK14, DAAM2, PPP1R16B, GREM1, HAVCR2, SHE, PODN, ZCCHC24, CXCL9,
PFKFB2, RAG2, TOP2A, USH2A, LHX3, MS4A4A, RHPN2, GIMAP8, CYS1,
SKA1 |
| LMX1B | hsa-miR-3176 | CD6, STOM, KCNC1,
LMX1B, RAC2, CXCL12, TIMP3, TLL1, CD300A, RASD2, GLIPR2, ZBTB7C,
CD4, CRHR1, FKBP5, MYH11, PCOLCE, SLC22A14, CELF2, ADAP1, LZTS1,
PPP1R16B, RGMA, SLA2, GLIS2 |
| MAFB | hsa-miR-659 | ADCY5, CRHR1,
CYP1B1, DPYSL3, KCNMA1, MYH11, PRKG1, SFRP1, SLIT2, TLR7, GPR88,
CYS1, NRK, C7, HIC1, KCNC1, MYLK, NFATC4, CXCL12, USH2A, SDPR,
MPDZ, MAFB, CD96, SMOC2, TNFAIP8L2, MACC1 |
| PAX2 | hsa-miR-592 | C7, CYP1B1, PAX2,
CDK14, DAAM2, PPP1R16B, GREM1, HAVCR2, SHE, PODN, ZCCHC24, CXCL9,
PFKFB2, RAG2, TOP2A, USH2A, LHX3, MS4A4A, RHPN2, GIMAP8, CYS1,
SKA1 |
| SLA2 | hsa-miR-3176 | CD6, STOM, KCNC1,
LMX1B, RAC2, CXCL12, TIMP3, TLL1, CD300A, RASD2, GLIPR2, ZBTB7C,
CD4, CRHR1, FKBP5, MYH11, PCOLCE, SLC22A14, CELF2, ADAP1, LZTS1,
PPP1R16B, RGMA, SLA2, GLIS2 |
| ZEB1 | hsa-miR-144-3p | CAV2, EFEMP1,
MAP1B, CXCL11, CXCL12, SFRP1, ZEB1, KIF14, AKT3, CELF2, PPP1R16B,
RAB9B, NAV3, ANTXR2, SHE, AXL, DSG2, CXCL9, MSN, NAP1L3, TNS1,
SDPR, MPDZ, LEFTY1, CPED1, CHRM2, KCNC1, NFATC4, DAAM2, APOLD1,
BOC, CYP2U1 |
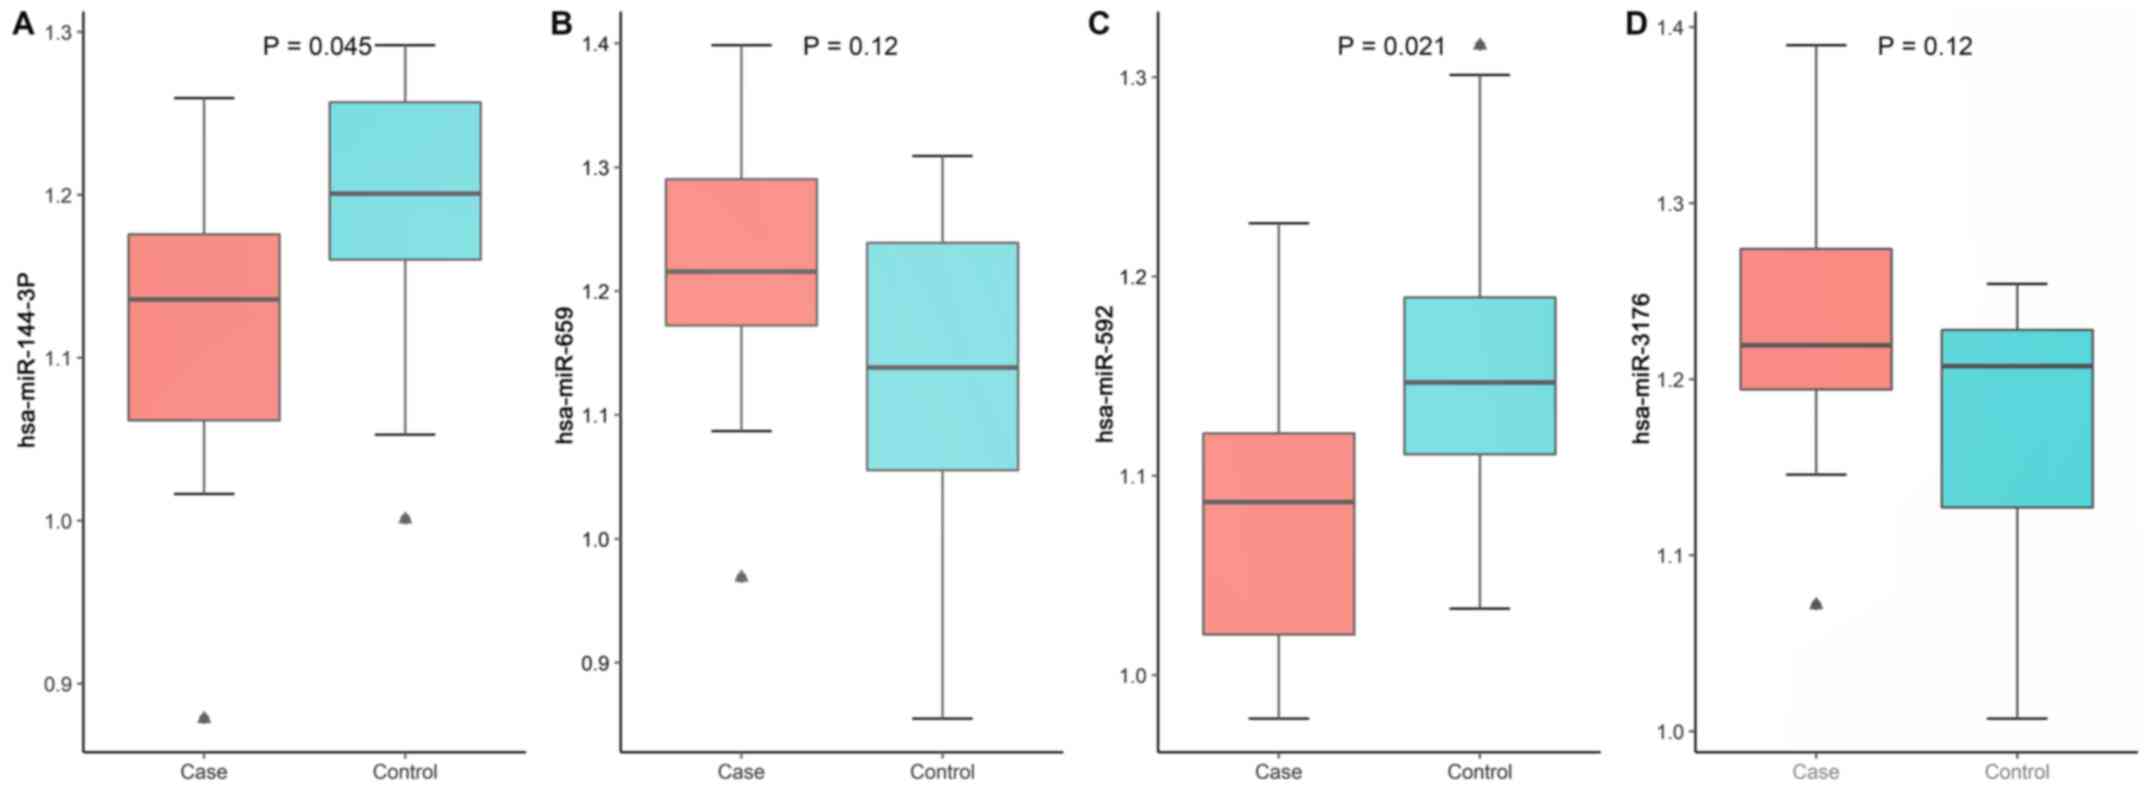
Confirmation using RT-qPCR and western
blot analysis, and ZEB1-miRNA-144 axis validation
RT-qPCR was used to investigate the expression level
of the 7 TF-miRNAs (Table III). It
was revealed that the expression level of 3 genes and 2 miRNAs were
dysregulated [Figs. 5 and 6; HP(+) is represented by the case group
and HP(−) is represented by the control group]. Among these genes
and miRNAs, the expression levels of PAX2, LHX3, miRNA-144-3p,
miRNA-592 were downregulated, while that of ZEB1 was upregulated,
which was consistent with the screening results. Furthermore,
western blot analysis was used to determine the protein expression
levels of the associated proteins in the normal (HP(−) tissues, as
well as the tumor groups, and the clinicopathological information
of the patients with gastric cancer is shown in Table SI. LHX3 was found to be
downregulated and ZEB1 was upregulated, while there was no
difference in PAX2 expression levels (Fig. 6H). To verify whether ZEB1 binds to
the promoter region of miR-144-3p, to suppress transcriptional
activity, the JASPAR database was used to predict the binding
region of the miRNA-144, which was subsequently amplified and
cloned into the luciferase reporter vector (Fig. 6I). As shown in Fig. 6J, ZEB1 knockdown enhanced the
luciferase activity, while the overexpression of ZEB1 markedly
inhibited transcriptional activity in the presence of the wild-type
E-box construct only, which confirmed that ZEB1 directly targeted
the E-box of the miR-144-3p gene promoter to trigger its
expression. In order to further investigate whether there was
significant regulatory association between ZEB1 and miR-144-3p, an
siRNA for ZEB1 (siZEB1) and an overexpression plasmid (ZEB1-OE) for
ZEB1 were designed and applied to attenuate or increase the
expression of ZEB1 (Fig. 6J).
Fig. 6K shows that miR-144-3p
expression was significantly decreased in ZEB1 overexpression
cells, while being significantly increased in ZEB1 knockdown cells,
which further confirmed the regulatory relationship between ZEB1
and miR-144-3p. Additionally, Fig.
6L shows that luciferase activity in the WT miR-144-3p promoter
was upregulated under ZEB1 deficiency, while the opposite result
was observed when ZEB1 was overexpressed. No significant difference
was observed when the binding site was mutated. After silencing and
overexpressing PAX2 (Fig. 6M), it
was found that there was no significant regulatory association
between PAX2 and miR-592 (Fig. 6N).
In addition, the results of the luciferase reporter assay showed
that there was no significant transcriptional regulation between
PAX2 and miR-592 (Fig. 6O).
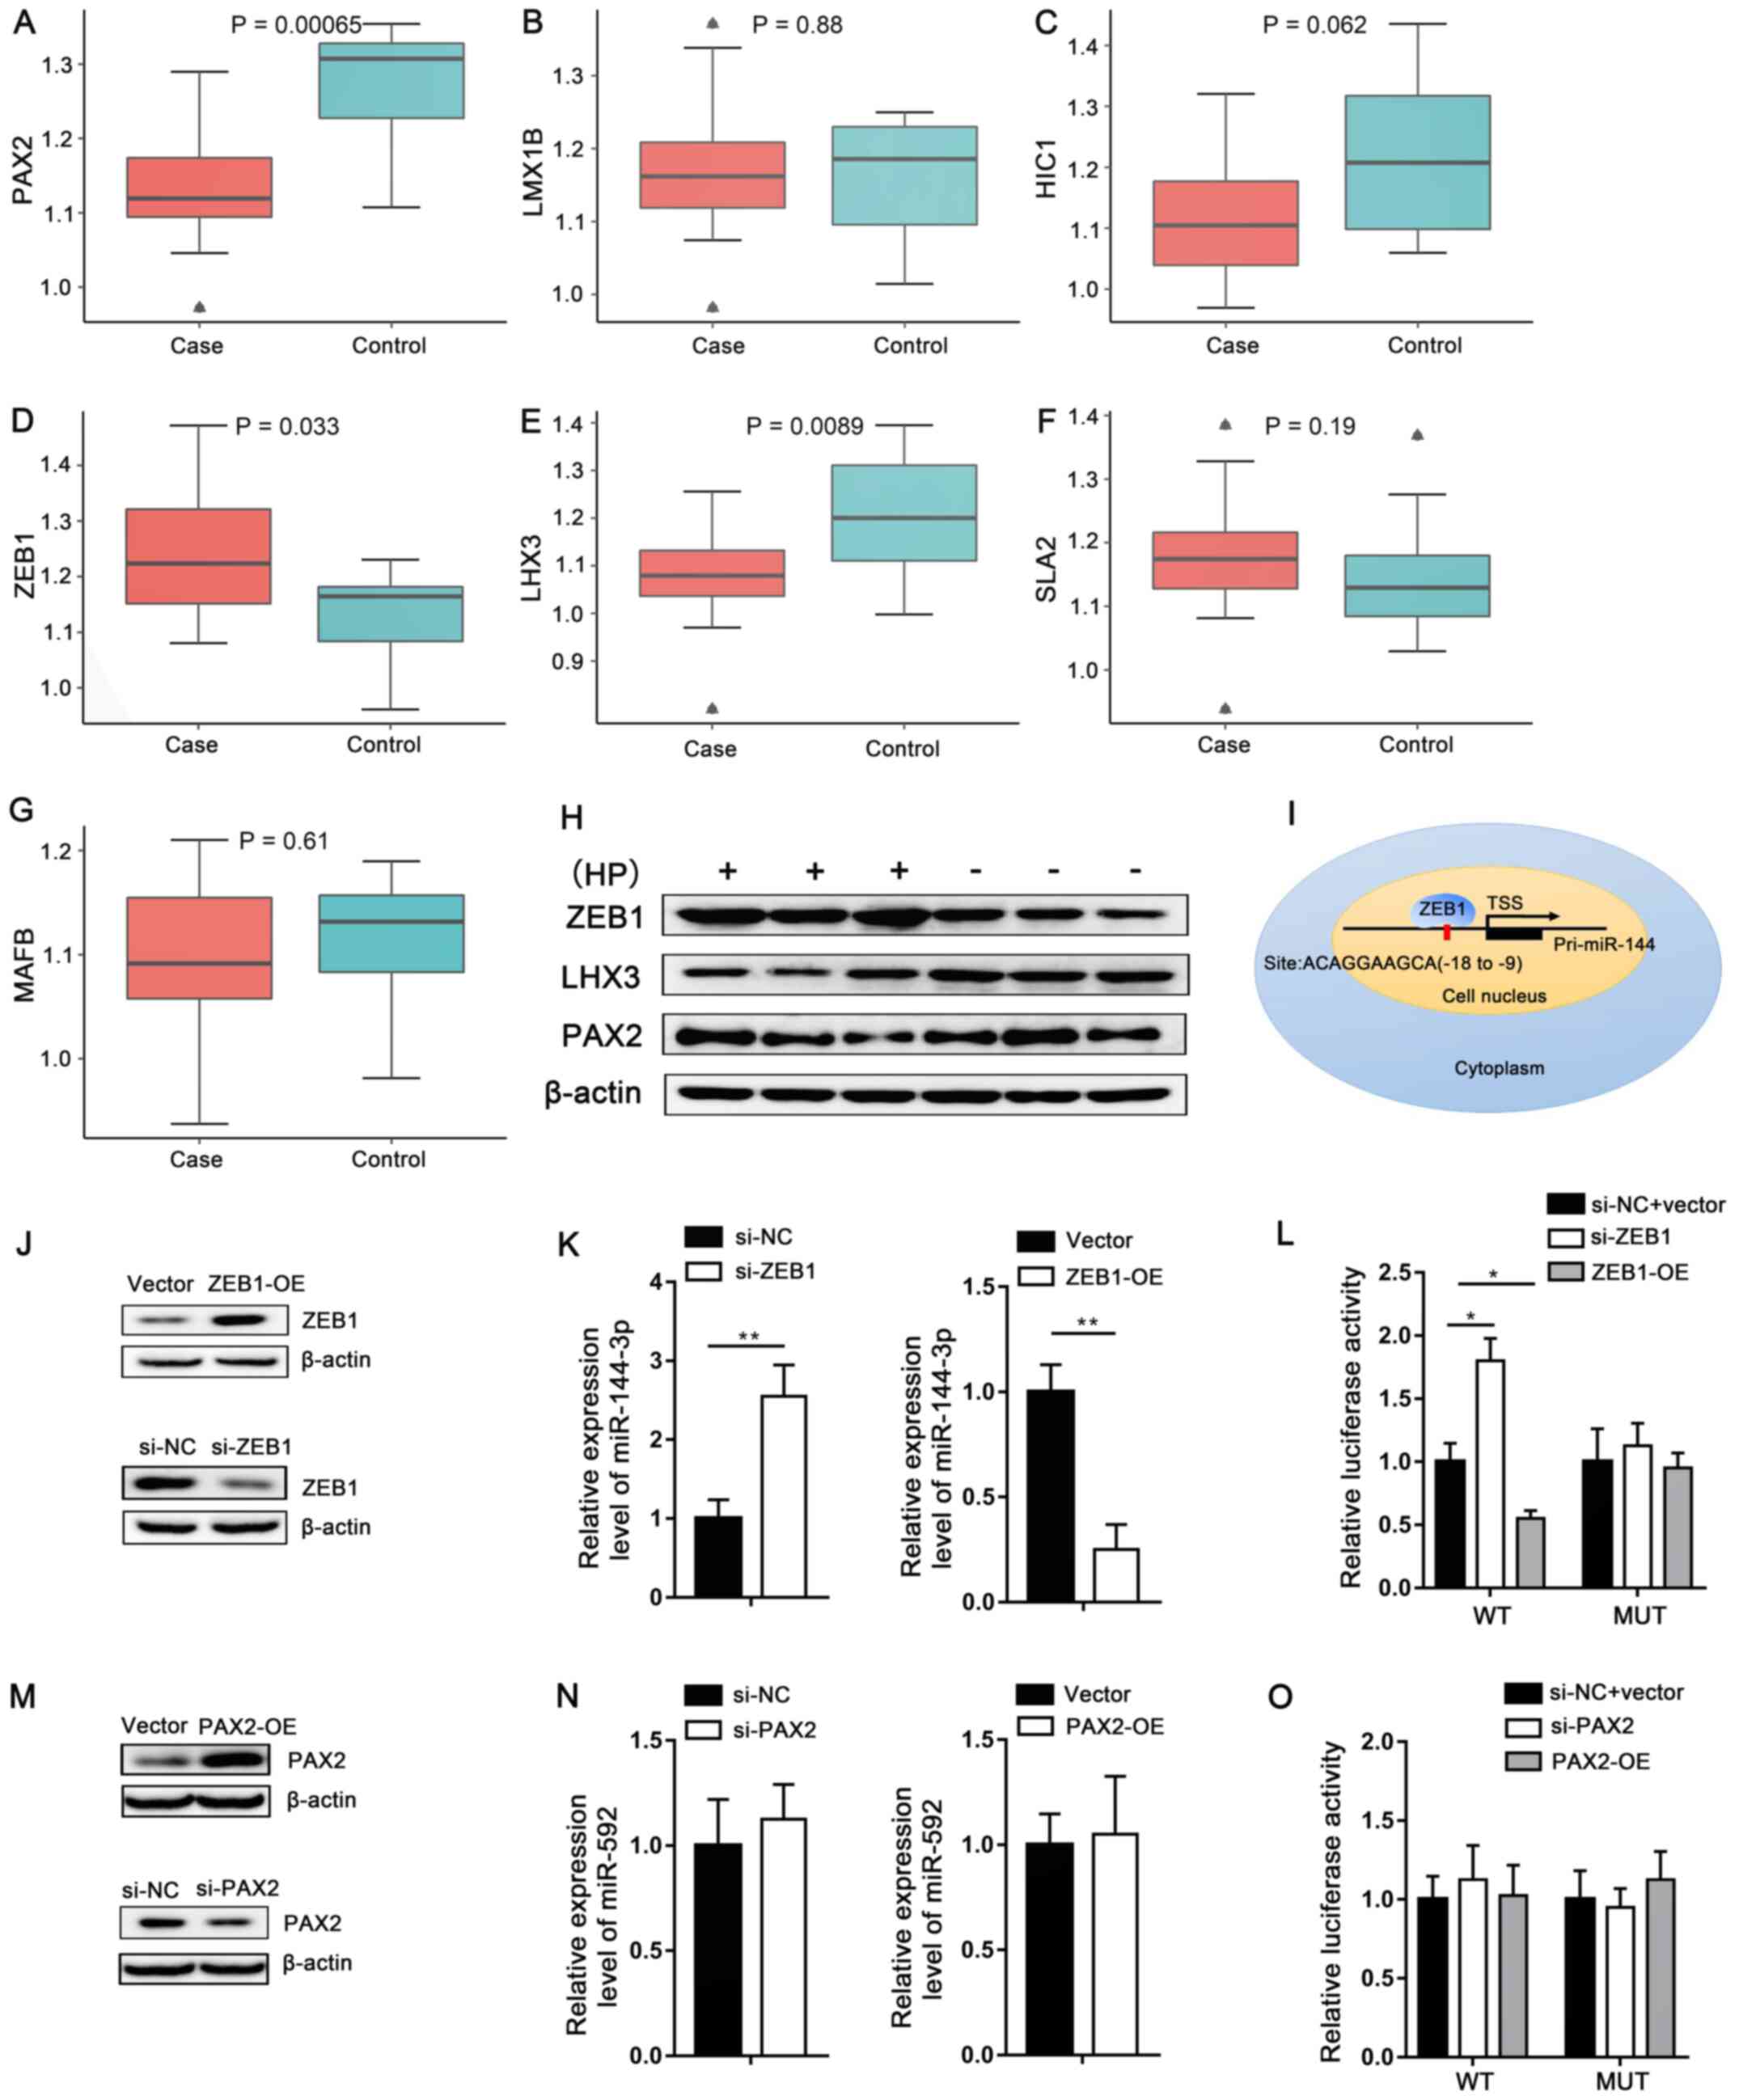 | Figure 6.RT-qPCR was used to analyze the
expression levels of (A) PAX2, (B) LMX1B, (C) HIC1, (D) ZEB1, (E)
LHX3, (F) SLA2 and (G) MAFB in HP-associated gastric cancer. HP(+)
is represented by the case group, while HP(−) is represented by the
control group. (H) Western blot confirmation of the ZEB1, LHX3 and
PAX2 protein expression levels in gastric cancer tissue and β-actin
was used as the internal control. (I) Schematic construction of the
luciferase reporter constructs containing the wild-type or mutated
miR-144 gene promoter region. (J and K) After transfection with
pcDNA-ZEB1 plasmid (ZEB1-OE) or si-ZEB1, as well as their own
respective negative controls, the expression of ZEB1 and miR-144-3p
in MKN-45 cells was measured by western blotting and RT-qPCR. (L)
Luciferase activity assays were also performed in those treated
MKN-45 cells, which were further transfected with miR-144-3p-MUT or
miR-144-3p-WT. After 48 h, firefly luciferase activity was detected
and normalized by Renilla luciferase activity. (M and N)
After transfection with pcDNA-PAX2 plasmid (PAX2-OE) or si-PAX2, as
well as their own respective negative controls, the expression of
PAX2 and miR-592 in MKN-45 cells was measured by western blotting
and RT-qPCR. (O) Luciferase activity assays were also performed in
those treated MKN-45 cells, which were further transfected with
miR-592-MUT or miR-592-WT. After 48 h, firefly luciferase activity
was detected and normalized by Renilla luciferase activity.
Data are presented as the mean ± SD of at least three independent
experiments. *P<0.05 and **P<0.01. The term ‘case’ represents
gastric cancer HP(+) samples and the term ‘control’ represents
gastric cancer HP(−) samples. HP, Helicobacter pylori;
HP(+)/+, HP-positive; HP(−)/-, HP-negative; si-, siRNA; miR,
microRNA; RT-qPCR, reverse transcription-quantitative PCR; OE,
overexpression; NC, negative control; MUT, mutant; WT,
wild-type. |
Discussion
HP, a type-1 carcinogen, serves as the primary cause
of gastric cancer (30). In 2008,
32.5% of new cancer cases, caused by a particular infectious agent,
were attributed to HP globally (31). However, the precise pathological
mechanism of HP-associated gastric cancer remains unclear.
Therefore, identification of the mechanisms of HP-associated
gastric cancer is required to prevent progression and improve
survival times. In recent years, high-throughput technology has
been widely utilized to investigate gene expression levels in
various types of tumor, such as colorectal (32) and ovarian cancer (33), providing a novel method to identify
significant genes and determine their effects on tumor progression
and initiation (34,35).
In the present study, 1,050 DEGs were identified
between HP(+) and HP(−) groups based on TCGA stomach cancer mRNA
dataset, including 418 downregulated and 632 upregulated genes.
Subsequently, enrichment and PPI analyses were used to identify the
potential functions of these key genes. The top 400 DEGs, out of
the total 1,050, were selected for PPI network analysis and the top
key 6 genes (TYROBP, CCR5, C3AR1, LCP2, CCL5 and SPI1) were
associated with HP(+) and HP(−). TYROBP and CCR5 were identified as
upregulated genes by integrative analysis, which indicated that the
expression of TYROBP and CCR5 could be increased in HP-associated
gastric cancer. A previous study revealed that gene co-expression
networks identified TREM2 and TYROBP as major hubs in human APOE
expressing mice following traumatic brain injury (36). TYROBP may also play a key role in the
formation of chronic gastritis and gastric ulcers. One study
suggested that the inhibition of the CCL5/CCR5 axis inhibited the
progression of gastric cancer (37).
Thus, CCR5 may play a significant role in the tumorigenesis of
gastric cancer associated with HP.
In the present study, TFs from the DEGs were
subsequently identified using the Trrust database. Typically, not
all DEGs corresponded to TFs. A total of 31 TFs were identified by
a series of comprehensive analyses. Recently, numerous studies
(38–40) have demonstrated that TFs regulate
gene expression by interacting with miRNAs. Thus, the associations
between the miRNAs and TFs were further investigated using the
miRWalk database. Next, a TF-miRNA-target gene network was
constructed to identify the potential molecular mechanisms. It was
found that the ZEB1-miR-144-3p and PAX2-miR-592 networks might play
key roles in the different mechanisms of HP(+) and HP(−) gastric
cancer. A previous study found that ZEB1 could activate the
hsa-miR-99b/let-7e/miR-125a cluster and promote the invasion of
liver cancer cells (41). ZEB1 may
promote the invasion of liver cancer cells by regulating
miR-144-3p. In addition, miR-144-3p has been shown to inhibit tumor
proliferation and invasion (42). On
the other hand, several studies reported that miR-144 regulated
ZEB1 expression directly (43–47) and
no studies explored the role of ZEB1 on miR-144-5p. No studies have
shown a regulatory association between PAX2 and miR-592. In the
present study, ZEB1 was identified as an upregulated gene in the
HP(+) group, which was confirmed using RT-qPCR. Thus,
ZEB1-miR-144-3p may play a key role in the pathogenesis of gastric
cancer associated with HP. PAX2 was shown to play a significant
role in cancer cell invasion (42).
PAX2 was identified as a downregulated gene using integrative
analysis. This suggested that the downregulation of PAX2 may play a
significant role in the pathogenesis of gastric cancer associated
with HP, by regulating miR-592. In the present study, the
ZEB1-miR-144-3p was hypothesized to play key roles in the mechanism
of gastric cancer associated with HP (+), which has not been
previously investigated. Thus, RT-qPCR was used to confirm the
results of the bioinformatics analysis and suggested that the
expression of the miRNAs and key genes was consistent with the
analysis. Furthermore, the ZEB1-miR-144-3p axis was confirmed using
western blot analysis and luciferase reporter assay. However,
several limitations still exist in the present study. Firstly, the
ZEB1-miR-144-3p axis was verified using a gastric cancer cell line
that was HP(−), due to the difficulty of obtaining the co-cultured
cell lines of HP. Secondly, the validation in another gastric
cancer cell line other than MKN-45 is needed. Thirdly, the data
sizes of TCGA and the collected sample data were too small to be
suitable for survival analysis. More samples will be collected in
further studies to explore the association between HP infection and
patient prognosis.
In conclusion, in the present study, a TF-miRNA-mRNA
network was constructed to analyze the potential molecular
mechanisms of gastric cancer associated with HP. A total of 31 TFs,
6 key genes (TYROBP, CCR5, C3AR1, LCP2, CCL5 and SPI1), 7 TF-miRNAs
and 181 TF-miRNA-mRNA sets were identified. RT-qPCR, western blot
analysis and a luciferase reporter assay were used to confirm the
results. The present study may provide a novel direction for
further experiments, and the TF-miRNA axes may be underlying
targets for precision treatment.
Supplementary Material
Supporting Data
Acknowledgements
Not applicable.
Funding
This study was supported by the National Natural Science
Foundation of China (grant no. 81702397). This project supported by
Hainan Province Clinical Medical Center.
Availability of data and materials
The datasets used and/or analyzed during the current
study are available from the corresponding author on reasonable
request.
Authors' contributions
PZ and XM designed the study, and extracted,
analyzed and interpreted the data from TCGA. JC and PZ performed
the experiments and wrote the manuscript. PZ, XM and JC confirm the
authenticity of all the raw data. LL and HC made substantial
contributions to the conception of the study and substantively
revised it. All authors have read and approved the final
manuscript.
Ethics approval and consent to
participate
All procedures were approved by the Ethics Committee
of the Union Hospital of Huazhong University of Science and
Technology (Wuhan, China), and conducted according to Declaration
of Helsinki principles. Prior written and informed consent was
obtained from each patient or their guardians.
Patient consent for publication
Not applicable.
Competing interests
The authors declare that they have no competing
interests.
Glossary
Abbreviations
Abbreviations:
|
TF
|
transcription factor
|
|
TGGA
|
The Cancer Genome Atlas
|
|
PPI
|
protein-protein interaction
|
|
DEG
|
differentially expressed gene
|
|
DEM
|
differentially expressed microRNA
|
|
HP
|
Helicobacter pylori
|
|
GO
|
Gene Ontology
|
|
KEGG
|
Kyoto Encyclopedia of Genes and
Genomes
|
|
STRING
|
Search Tool for the Retrieval of
Interacting Genes
|
References
|
1
|
Parsonnet J, Friedman GD, Vandersteen DP,
Chang Y, Vogelman JH, Orentreich N and Sibley RK: Helicobacter
pylori infection and the risk of gastric carcinoma. N Engl J Med.
325:1127–1131. 1991. View Article : Google Scholar : PubMed/NCBI
|
|
2
|
Sepulveda AR: Helicobacter, inflammation,
and gastric cancer. Curr Pathobiol Rep. 1:9–18. 2013. View Article : Google Scholar : PubMed/NCBI
|
|
3
|
Bartel DP: MicroRNAs: Target recognition
and regulatory functions. Cell. 136:215–233. 2009. View Article : Google Scholar : PubMed/NCBI
|
|
4
|
Guo LL, Song CH, Wang P, Dai LP, Zhang JY
and Wang KJ: Competing endogenous RNA networks and gastric cancer.
World J Gastroenterol. 21:11680–11687. 2015. View Article : Google Scholar : PubMed/NCBI
|
|
5
|
Baer C, Claus R and Plass C: Genome-wide
epigenetic regulation of miRNAs in cancer. Cancer Res. 73:473–477.
2013. View Article : Google Scholar : PubMed/NCBI
|
|
6
|
Singh R and Mo YY: Role of microRNAs in
breast cancer. Cancer Biol Ther. 14:201–212. 2013. View Article : Google Scholar : PubMed/NCBI
|
|
7
|
Song S and Ajani JA: The role of microRNAs
in cancers of the upper gastrointestinal tract. Nat Rev
Gastroenterol Hepatol. 10:109–118. 2013. View Article : Google Scholar : PubMed/NCBI
|
|
8
|
O'Connell RM, Rao DS, Chaudhuri AA and
Baltimore D: Physiological and pathological roles for microRNAs in
the immune system. Nat Rev Immunol. 10:111–122. 2010. View Article : Google Scholar : PubMed/NCBI
|
|
9
|
Shrestha S, Hsu SD, Huang WY, Huang HY,
Chen W, Weng SL and Huang HD: A systematic review of microRNA
expression profiling studies in human gastric cancer. Cancer Med.
3:878–888. 2014. View
Article : Google Scholar : PubMed/NCBI
|
|
10
|
Link A and Kupcinskas J: MicroRNAs as
non-invasive diagnostic biomarkers for gastric cancer: Current
insights and future perspectives. World J Gastroenterol.
24:3313–3329. 2018. View Article : Google Scholar : PubMed/NCBI
|
|
11
|
Liu L, Qu W and Zhong Z: Down-regulation
of miR-503 expression predicate advanced mythological features and
poor prognosis in patients with NSCLC. Int J Clin Exp Pathol.
8:5609–5613. 2015.PubMed/NCBI
|
|
12
|
Latchman DS: Transcription factors: An
overview. Int J Biochem Cell Biol. 29:1305–1312. 1997. View Article : Google Scholar : PubMed/NCBI
|
|
13
|
Hughes TR: Introduction to ‘a handbook of
transcription factors’. Subcell Biochem. 52:1–6. 2011. View Article : Google Scholar : PubMed/NCBI
|
|
14
|
Lichti J, Gallus C and Glasmacher E:
Immune responses-transcriptional and post-transcriptional networks
pass the baton. Trends Biochem Sci. 43:1–4. 2018. View Article : Google Scholar : PubMed/NCBI
|
|
15
|
Sussenbach JS, Rodenburg RJ, Scheper W and
Holthuizen P: Transcriptional and post-transcriptional regulation
of the human IGF-II gene expression. Adv Exp Med Biol. 343:63–71.
1993. View Article : Google Scholar : PubMed/NCBI
|
|
16
|
Lefkofsky HB, Veloso A and Ljungman M:
Transcriptional and post-transcriptional regulation of nucleotide
excision repair genes in human cells. Mutat Res. 776:9–15. 2015.
View Article : Google Scholar : PubMed/NCBI
|
|
17
|
Zhang HM, Kuang S, Xiong X, Gao T, Liu C
and Guo AY: Transcription factor and microRNA co-regulatory loops:
Important regulatory motifs in biological processes and diseases.
Brief Bioinform. 16:45–58. 2015. View Article : Google Scholar : PubMed/NCBI
|
|
18
|
Chen D, Lu T, Tan J, Zhao K, Li Y, Zhao W,
Li H, Wang Q, Wang Y and Wei L: Identification of a transcription
factor-microRNA network in esophageal adenocarcinoma through
bioinformatics analysis and validation through qRT-PCR. Cancer
Manag Res. 11:3315–3326. 2019. View Article : Google Scholar : PubMed/NCBI
|
|
19
|
Colaprico A, Silva TC, Olsen C, Garofano
L, Cava C, Garolini D, Sabedot TS, Malta TM, Pagnotta SM,
Castiglioni I, et al: TCGAbiolinks: An R/Bioconductor package for
integrative analysis of TCGA data. Nucleic Acids Res. 44:e712016.
View Article : Google Scholar : PubMed/NCBI
|
|
20
|
Ritchie ME, Phipson B, Wu D, Hu Y, Law CW,
Shi W and Smyth GK: Limma powers differential expression analyses
for RNA-sequencing and microarray studies. Nucleic Acids Res.
43:e472015. View Article : Google Scholar : PubMed/NCBI
|
|
21
|
Yu G, Wang LG, Han Y and He QY:
ClusterProfiler: An R package for comparing biological themes among
gene clusters. OMICS. 16:284–287. 2012. View Article : Google Scholar : PubMed/NCBI
|
|
22
|
Szklarczyk D, Gable AL, Lyon D, Junge A,
Wyder S, Huerta-Cepas J, Simonovic M, Doncheva NT, Morris JH, Bork
P, et al: STRING v11: Protein-protein association networks with
increased coverage, supporting functional discovery in genome-wide
experimental datasets. Nucleic Acids Res. 47:D607–D613. 2019.
View Article : Google Scholar : PubMed/NCBI
|
|
23
|
Smoot ME, Ono K, Ruscheinski J, Wang PL
and Ideker T: Cytoscape 2.8: New features for data integration and
network visualization. Bioinformatics. 27:431–432. 2011. View Article : Google Scholar : PubMed/NCBI
|
|
24
|
Dweep H, Gretz N and Sticht C: MiRWalk
database for miRNA-target interactions. Methods Mol Biol.
1182:289–305. 2014. View Article : Google Scholar : PubMed/NCBI
|
|
25
|
Friedman RC, Farh KK, Burge CB and Bartel
DP: Most mammalian mRNAs are conserved targets of microRNAs. Genome
Res. 19:92–105. 2009. View Article : Google Scholar : PubMed/NCBI
|
|
26
|
Betel D, Koppal A, Agius P, Sander C and
Leslie C: Comprehensive modeling of microRNA targets predicts
functional non-conserved and non-canonical sites. Genome Biol.
11:R902010. View Article : Google Scholar : PubMed/NCBI
|
|
27
|
Kertesz M, Iovino N, Unnerstall U, Gaul U
and Segal E: The role of site accessibility in microRNA target
recognition. Nat Genet. 39:1278–1284. 2007. View Article : Google Scholar : PubMed/NCBI
|
|
28
|
Livak KJ and Schmittgen TD: Analysis of
relative gene expression data using real-time quantitative PCR and
the 2(−Delta Delta C(T)) method. Methods. 25:402–408. 2001.
View Article : Google Scholar : PubMed/NCBI
|
|
29
|
Khan A, Fornes O, Stigliani A, Gheorghe M,
Castro-Mondragon JA, van der Lee R, Bessy A, Chèneby J, Kulkarni
SR, Tan G, et al: JASPAR 2018: Update of the open-access database
of transcription factor binding profiles and its web framework.
Nucleic Acids Res. 46:D260–D266. 2018. View Article : Google Scholar : PubMed/NCBI
|
|
30
|
Schistosomes, liver flukes and
Helicobacter pylori. IARC Working Group on the Evaluation of
Carcinogenic Risks to Humans. Lyon, 7-14 June 1994. IARC Monogr
Eval Carcinog Risks Hum. 61:1–241. 1994.PubMed/NCBI
|
|
31
|
de Martel C, Ferlay J, Franceschi S,
Vignat J, Bray F, Forman D and Plummer M: Global burden of cancers
attributable to infections in 2008: A review and synthetic
analysis. Lancet Oncol. 13:607–615. 2012. View Article : Google Scholar : PubMed/NCBI
|
|
32
|
Xu H, Liu Y, Cheng P, Wang C, Liu Y, Zhou
W, Xu Y and Ji G: CircRNA_0000392 promotes colorectal cancer
progression through the miR-193a-5p/PIK3R3/AKT axis. J Exp Clin
Cancer Res. 39:2832020. View Article : Google Scholar : PubMed/NCBI
|
|
33
|
Khan K, Javed Z, Sadia H, Sharifi-Rad J,
Cho WC and Luparello C: Quercetin and MicroRNA interplay in
apoptosis regulation in ovarian cancer. Curr Pharm Des.
27:2328–2336. 2021. View Article : Google Scholar : PubMed/NCBI
|
|
34
|
Carvalho GB, Costa LE, Lage DP, Ramos FF,
Santos TTO, Ribeiro PAF, Dias DS, Salles BCS, Lima MP, Carvalho LM,
et al: High-through identification of T cell-specific phage-exposed
mimotopes using PBMCs from tegumentary leishmaniasis patients and
their use as vaccine candidates against Leishmania amazonensis
infection. Parasitology. 146:322–332. 2019. View Article : Google Scholar : PubMed/NCBI
|
|
35
|
Steinlechner M and Parson W: Automation
and high through-put for a DNA database laboratory: Development of
a laboratory information management system. Croat Med J.
42:252–255. 2001.PubMed/NCBI
|
|
36
|
Castranio EL, Mounier A, Wolfe CM, Nam KN,
Fitz NF, Letronne F, Schug J, Koldamova R and Lefterov I: Gene
co-expression networks identify Trem2 and Tyrobp as major hubs in
human APOE expressing mice following traumatic brain injury.
Neurobiol Dis. 105:1–14. 2017. View Article : Google Scholar : PubMed/NCBI
|
|
37
|
Aldinucci D and Casagrande N: Inhibition
of the CCL5/CCR5 Axis against the progression of gastric cancer.
Int J Mol Sci. 19:14772018. View Article : Google Scholar : PubMed/NCBI
|
|
38
|
Bo C, Zhang H, Cao Y, Lu X, Zhang C, Li S,
Kong X, Zhang X, Bai M, Tian K, et al: Construction of a
TF-miRNA-gene feed-forward loop network predicts biomarkers and
potential drugs for myasthenia gravis. Sci Rep. 11:24162021.
View Article : Google Scholar : PubMed/NCBI
|
|
39
|
Hong Z, Wang Q, Hong C, Liu M, Qiu P, Lin
R, Lin X, Chen F, Li Q, Liu L, et al: Identification of seven cell
cycle-related genes with unfavorable prognosis and construction of
their TF-miRNA-mRNA regulatory network in breast cancer. J Cancer.
12:740–753. 2021. View Article : Google Scholar : PubMed/NCBI
|
|
40
|
Bertonha FB, Bando SY, Ferreira LR,
Chaccur P, Vinhas C, Zerbini MC, Carneiro-Sampaio MM and
Moreira-Filho CA: Age-related transcriptional modules and
TF-miRNA-mRNA interactions in neonatal and infant human thymus.
PLoS One. 15:e02275472020. View Article : Google Scholar : PubMed/NCBI
|
|
41
|
Wang XF, Liu JY, Li JL, Wang FZ and Sun
BL: ZEB1 causes the production of
hsa-microRNA-99b/let-7e/microRNA-125a cluster and promotes invasion
of liver cancer cells. Eur Rev Med Pharmacol Sci. 23:1468–1475.
2019.PubMed/NCBI
|
|
42
|
Cao J, Han X, Qi X, Jin X and Li X: TUG1
promotes osteosarcoma tumorigenesis by upregulating EZH2 expression
via miR-144-3p. Int J Oncol. 51:1115–1123. 2017. View Article : Google Scholar : PubMed/NCBI
|
|
43
|
Guan H, Liang W, Xie Z, Li H, Liu J, Liu
L, Xiu L and Li Y: Down-regulation of miR-144 promotes thyroid
cancer cell invasion by targeting ZEB1 and ZEB2. Endocrine.
48:566–574. 2015. View Article : Google Scholar : PubMed/NCBI
|
|
44
|
Pan Y, Zhang J, Fu H and Shen L: MiR-144
functions as a tumor suppressor in breast cancer through inhibiting
ZEB1/2-mediated epithelial mesenchymal transition process. Onco
Targets Ther. 9:6247–6255. 2016. View Article : Google Scholar : PubMed/NCBI
|
|
45
|
Zhang G, An H and Fang X: MicroRNA-144
regulates proliferation, invasion, and apoptosis of cells in
malignant solitary pulmonary nodule via zinc finger E-box-binding
homeobox 1. Int J Clin Exp Pathol. 8:5960–5967. 2015.PubMed/NCBI
|
|
46
|
Pan HL, Wen ZS, Huang YC, Cheng X, Wang
GZ, Zhou YC, Wang ZY, Guo YQ, Cao Y and Zhou GB: Down-regulation of
microRNA-144 in air pollution-related lung cancer. Sci Rep.
5:143312015. View Article : Google Scholar : PubMed/NCBI
|
|
47
|
Gao ZY, Liu H and Zhang Z: MiR-144-3p
increases radiosensibility of gastric cancer cells by targeting
inhibition of ZEB1. Clin Transl Oncol. 23:491–500. 2021. View Article : Google Scholar : PubMed/NCBI
|
|
48
|
Wittekind C: The development of the TNM
classification of gastric cancer. Pathol Int. 65:399–403. 2015.
View Article : Google Scholar : PubMed/NCBI
|