Introduction
In the USA in 2022, there will be approximately
19,880 women newly diagnosed with epithelial ovarian cancer (EOC)
and approximately 12,810 deaths attributed to this disease
(1). Unfortunately, the five-year
survival rate for EOC is only 48% (2), with minimal improvement in survival
in the last 30 years (3). This is
due to the fact that many patients develop a recurrence within
12-18 months of completion of their primary treatment regimen, at
which time the cancer is less responsive to traditional platinum
based-chemotherapeutics (4,5). In
recent years, there have been approvals of new targeted therapies
such as anti-angiogenic and poly (ADP-ribose) polymerase (PARP)
inhibitors that modestly improve progression-free survival (PFS);
however, neither have produced a substantial overall survival (OS)
benefit for patients (6–8). Currently, the focus of EOC clinical
trials is immune checkpoint inhibitors that restore the anti-tumor
function of CD8+ T cells, such as monoclonal antibodies
targeting programmed cell death protein-1 (PD-1) (9). While these PD-1 inhibitors have
proven to be successful in cancers such as melanoma, non-small cell
lung, and renal cell carcinoma, EOC clinical trials have shown that
only a small portion of patients (10–33%) respond to anti-PD-1
therapy (10–12). Despite EOC patients exhibiting low
responses to anti-PD-1 based therapies, ovarian tumors produce
anti-tumor immune responses that can be detected in ascites,
peripheral blood, and tumors (13). In addition, it has been well
documented that higher intratumoral T cell numbers correlate to a
better clinical prognosis for EOC patients (14,15).
Therefore, there is a strong need for improved immunotherapeutic
approaches for this patient population.
In recent years, a plethora of pre-clinical in
vivo studies show that combinatorial targeting of alternative T
cell co-receptors in combination with PD-1 increases tumor immune
cell infiltration and improves survival in EOC patients (16). However, there have been no studies
comparing expression levels of diverse intratumoral immune
co-receptors in EOC tissue. The expression of different
intratumoral immune co-receptors in EOC is of particular
importance, since one potential reason that PD-1 based therapies
have been unsuccessful in EOC is because programmed death-ligand 1
(PD-L1) often exhibits low expression in patient tumors, suggesting
that not all ovarian tumors utilize the PD-1 signaling pathway to
evade immune detection (17). To
address this knowledge deficit, we performed immunohistochemistry
analysis of high grade serous ovarian cancer (HGSOC) patient tissue
along with analysis of The Cancer Genome Atlas (TCGA) ovarian
cancer dataset to comprehensively examine intratumoral expression
of PD-1 and seven of the most commonly investigated immune
co-receptors in the field of oncology, which are summarized in
Table I (18–38).
Therefore, this analysis provides a thorough depiction of immune
co-receptor composition in HGSOC for the first time.
 | Table I.Commonly investigated immune
receptors in the field of oncology. |
Table I.
Commonly investigated immune
receptors in the field of oncology.
| Immune
receptor | Cellular expression
(18) | Main ligand(s)
(18) | Main Physiological
roles | Phases in clinical
development (18,22) |
|---|
| PD1 (CD279) | T cells, B cells,
NK cells and tumor infiltrating lymphocytes | PD-L1 and
PD-L2 | Inhibits T cell
proliferation (23) and both
adaptive and innate immune responses (24). Maintains immune tolerance (24) | FDA approved
(pembrolizumab and nivolumab) |
| CTLA-4 (CD152) | T cells | B7-1 (CD80) B7-2
(CD286) | Inhibits T cell
proliferation, differentiation and function (36) | FDA approved
(ipilimumab) |
| BTLA (CD272) | cells, resting B
cells, NK cells,macrophages, and dendritic cells | HVEM
(TNFRSF14) | Inhibits T cell
proliferation (19) Promotes
CD8+ T cell and T regulation cell differentiation
(20,21) | Pre-clinical |
| CD137 (4-1BB) | Dendritic cells, NK
cells, adaptive/activated CD4+ and CD8+ T
cells and T regulation cells | CD137L
(4-1BBL) | Induces T cell
proliferation and survival via production of INFy and IL-2
(25). Maintenance and memory of
CD8+ T cells (26) | II (solid tumors,
NHL, NSCLC, RCC, HNCC and HCC) |
| LAG-3 (CD223) | T cells, B cells,
NK cells and dendritic cells | MHC Class II and
HLA class II FGL1 (37) | Negatively
regulated T cell activation and function (38) Controls memory T cell expansion
(28). Promotes tolerance on
CD8+ T cells (29).
Required for maximal suppressive T regulation cell activity
(27,29) | I/II (solid tumors,
pancreatic and breast melanoma) |
| OX40 (TNFRSF4 and
CD134) | T cells | OX40L (TNFSF4) | Enhances
proliferation and survival of T cells, increasing effector molecule
expression and cytokine secretion (30,31).
Inhibits T regulation cell Function (30) | I (solid tumors,
melanoma and NSCLC) |
| TIM-3 (HAVCR2 and
CD366) |
CD8+/CD4+ cells, T
regulation cells, Th17 cells and NK cells | Galectin-9
(LGAL9) | Mediates T cell
exhaustion during chronic viral infections (32). Promotes MDSCs (33). Regulates function of
FOXP3+T regulation cells (33) | I/II (advanced
malignances and solid tumors) |
| ICOS (CD278) | Activated T cells
(34) | ICOSL (34) | Enhances broad
cytokine production to enhance proliferation of effector and
regulatory T cell populations and promote memory cell development
(35) | I/II (advanced
solid tumors) (35) |
Materials and methods
Patient samples
Formalin-fixed, paraffin embedded (FFPE) tumor
blocks from 29 stage III, grade 3 serous EOC patients were obtained
from Women and Infants Hospital's Pathology Department, under
Institutional Review Board (IRB) approval. Summarized patient data
is presented in Table II.
Specimen processing and analysis of samples was performed with IRB
approval and in compliance with Women and Infant's IRB HIPAA
requirements. All patient tumor samples were representative of
patients' primary debulking, and thus naïve to therapy.
| Table II.Patient clinical outcomes. |
Table II.
Patient clinical outcomes.
| Patient number | Age at diagnosis
(years) | CA125 pre-op | HE4 pre-op | Stage (FIGO) | Grade (FIGO) | Debulking
status | PFS (months) | OS (months) |
|---|
| 1 | 80-84 | >1,000 | 0-500 | IIIC | 3 | Optimal | 36 | 96+ |
| 2 | 65-69 | 0-500 | 0-500 | IIIC | 3 | Suboptimal | 6 | 10 |
| 3 | 60-64 | 0-500 | 0-500 | IIIC | 3 | Optimal | 8 | 18 |
| 4 | 55-59 | 500-1,000 | 500-1,000 | IIIC | 3 | Suboptimal | 18 | 55 |
| 5 | 60-64 | 0-500 | >1,000 | IIIA | 3 | Optimal | 14 | 29 |
| 6 | 80-84 | >1,000 | 500-1,000 | IIIC | 3 | Suboptimal | 21 | 30 |
| 7 | 55-59 | 1,000 | 500-1,000 | IIIC | 3 | Optimal | 23 | 78 |
| 8 | 80-84 | >1,000 | >1,000 | IIIC | 3 | Suboptimal | 38 | 84+ |
| 9 | 60-64 | 500-1,000 | >1,000 | IIIC | 3 | Optimal | 10 | 66 |
| 10 | 75-79 | 0-500 | 0-500 | IIIC | 3 | Optimal | 19 | 45 |
| 11 | 75-79 | 0-500 | N/A | IIIC | 3 | Optimal | 62 | 66+ |
| 12 | 70-74 | >1,000 | 500-1,000 | IIIC | 3 | Optimal | 7 | 28 |
| 13 | 50-54 | >1,000 | 0-500 | IIIC | 3 | Optimal | 20 | 50 |
| 14 | 50-54 | 0-500 | N/A | IIIC | 3 | Optimal | 90+ | 90+ |
| 15 | 65-69 | >1,000 | N/A | IIIC | 3 | Optimal | 20 | 67+ |
| 16 | 55-59 | 0-500 | N/A | IIIC | 3 | Suboptimal | 6 | 14 |
| 17 | 75-79 | 500-1,000 | 0-500 | IIIC | 3 | Optimal | 67+ | 67+ |
| 18 | 55-59 | 0-500 | 0-500 | IIIC | 3 | Optimal | 26 | 85+ |
| 19 | 65-69 | >1,000 | N/A | IIIC | 3 | Suboptimal | 7 | 15 |
| 20 | 70-74 | >1,000 | N/A | IIIC | 3 | Optimal | 16 | 38 |
| 21 | 55-59 | 0-500 | N/A | IIIC | 3 | Optimal | 33 | 84 |
| 22 | 65-69 | 0-500 | 0-500 | IIIC | 3 | Optimal | 45 | 49+ |
| 23 | 65-69 | N/A | N/A | IIIC | 3 | Optimal | 4 | 6 |
| 24 | 50-54 | 0-500 | 0-500 | IIIC | 3 | Optimal | 93+ | 93+ |
| 25 | 40-44 | 0-500 | 0-500 | IIIC | 3 | Optimal | 84+ | 84+ |
| 26 | 65-69 | 0-500 | >1,000 | IIIC | 3 | Optimal | 10 | 22 |
| 27 | 55-59 | 0-500 | N/A | IIIC | 3 | Optimal | 100+ | 100+ |
| 28 | 60-64 | 0-500 | N/A | IIIC | 3 | Optimal | 72+ | 72+ |
| 29 | 55-56 | 0-500 | N/A | IIIC | 3 | Suboptimal | 62 | 64 |
Immunofluorescence
FFPE human ovarian cancer tissue slides were baked
at two hours at 65°C. Slides were then washed in xylene, 100%
ethanol, 95% ethanol, 70% ethanol, deoxygenated water, and FTA
Hemagglutination Buffer. Antigen retrieval was then performed using
Antigen Retrieval Solution (1X) (Vector Laboratories, H-3300) and
heated to 95°C for 20 min. Slides were then blocked with 5% horse
serum in FTA Hemagglutination buffer and incubated overnight in
primary antibody at 4°C. Secondary antibody was then applied to
slides following incubation in the dark at room temperature for one
hour. Slides were washed between each step using FTA
Hemagglutination buffer and cover-slipped with DAPI containing
mounting medium (Vector Laboratories, H-1200). A representative
image of immune receptor co-staining with DAPI can be seen in
Fig. S1. Primary antibodies were
all used at a [1:50] dilution, with vendor and catalog numbers as
follows: CD8 (Origene TA802079 and Abcam ab4055), CD4 (Origene,
UM800010 and Abcam ab133616), PD-1 (Origene, UM870089), OX40
(Origene UM870166), BTLA (Origene, TA505536), CD137 (Abcam,
ab232990), TIM-3 (Origene, TA807034), LAG-3 (Origene, TA807082).
The secondary antibodies used were either Anti-Rabbit IgG Dylight
488 or Anti-Mouse IgG Dylight 594 (Vector Laboratories, DI-1488 and
DI-2594), each at a 1:1,000 dilution.
Microscopy
Representative confocal images were acquired with a
Nikon C1si confocal (Nikon Inc.) or a Nikon Eclipse Ti Microscope
(Nikon Inc.) using diode lasers 402, 488, and 561. To obtain images
for cell counting, ten randomly selected fields per case were
acquired with a Nikon C1si confocal (Nikon Inc.) or a Nikon Eclipse
Ti Microscope (Nikon Inc.) using a 40X objective. Each wavelength
was acquired separately and an RGB image was created.
Image analysis
Image processing and analysis were performed in
Photoshop CS6 (Adobe) or GIMP image analysis software (GIMP,
Bremen, Germany). For each of the ten randomly selected image
fields, total numbers of positive immune cells were counted. Single
positive CD8+, CD4+, PD-1+,
OX40+, TIM-3+, LAG-3+,
BTLA+, and CD137+ cells were counted, as well
as double positive CD8+ and CD4+ cells with
each of the six immune receptors. Where average T cell or immune
receptor levels are reported, the total number of positive cells
per field was averaged from each patient from the cohort stained.
Immune receptor and T cell counts for each patient are summarized
in Data S1.
The Cancer Genome Atlas (TCGA)
The ovarian cancer TCGA dataset with complete
RNA-sequencing results (n=378) from The Cancer Genome Atlas was
obtained using GenomicDataCommons (version 1.12.0) and RStudio (R
version 4.0.0) (39,40) which can be found at http://github.com/Bioconductor/GenomicDataCommons.
Fragments Per Kilobase of transcript per Million mapped reads
(FPKM) values were obtained for PD-1, CTLA-4, ICOS, LAG-3, BTLA,
CD137, TIM-3, OX40, PD-L1, OX40L, and Galectin-9.
cBioPortal
Survival outcomes and residual disease related to
mRNA expression (−log10) of either OX40, TIM-3, Galectin-9, or
PD-L1 were obtained from TCGA ovarian serous cystadenocarcinoma
cohort (Nature 2011) in cBioPortal (https://cbioportal.org). Data was available for 316
samples. Moreover, TCGA PanCancer Atlas Studies from cBioPortal was
employed to determine expression levels of PD-1, OX40, and TIM-3
[mRNA expression RNA seq log2 (value+1)] in breast (n=1082),
cervical (n=294), ovarian (n=300), uterine (n=527), clear cell
renal cell carcinoma (n=510), papillary renal cell carcinoma
(n=283), lung adenocarcinoma (n=510), squamous lung cancer (n=484),
and melanoma (n=443) cohorts.
Kaplan-Meier plotter
The ovarian cancer Kaplan-Meier Plotter (https://kmplot.com/analysis/index.php?p=service&cancer=ovar),
which compiles Gene Expression Omnibus (GEO) Series (GSE) and TCGA
data for analysis (41), was
employed to determine the association between TIM-3 and OX40
expression with PFS and OS, using median expression as a
cutoff.
Statistical analysis
Kaplan-Meier survival curve analysis was used to
compare survival in patients from our Women and Infants Hospital
cohort with high and low levels of CD4+ OX40+
T cells in which the top and bottom quartiles of expression
delineated the groups. Mann Whitney U test was employed to compare
mean ranks of TIM-3, OX40, and PD-1 expression across various
cancers as well as the %CD8+ OX40+
populations in patients with low or high median CA125 levels (U
value and P-value reported). Two-tailed unpaired t-test was used to
determine significant differences in ligand expression of OX40L,
Galectin-9, and PD-L1, as well as expression of OX40, TIM-3, OX40L,
Galectin-9, or PD-L1 according to survival and residual disease
outcomes. Statistical analyses were performed in GraphPad Prism.
P<0.05 was considered significant.
Results
Intratumoral composition of immune
co-receptors in HGSOC
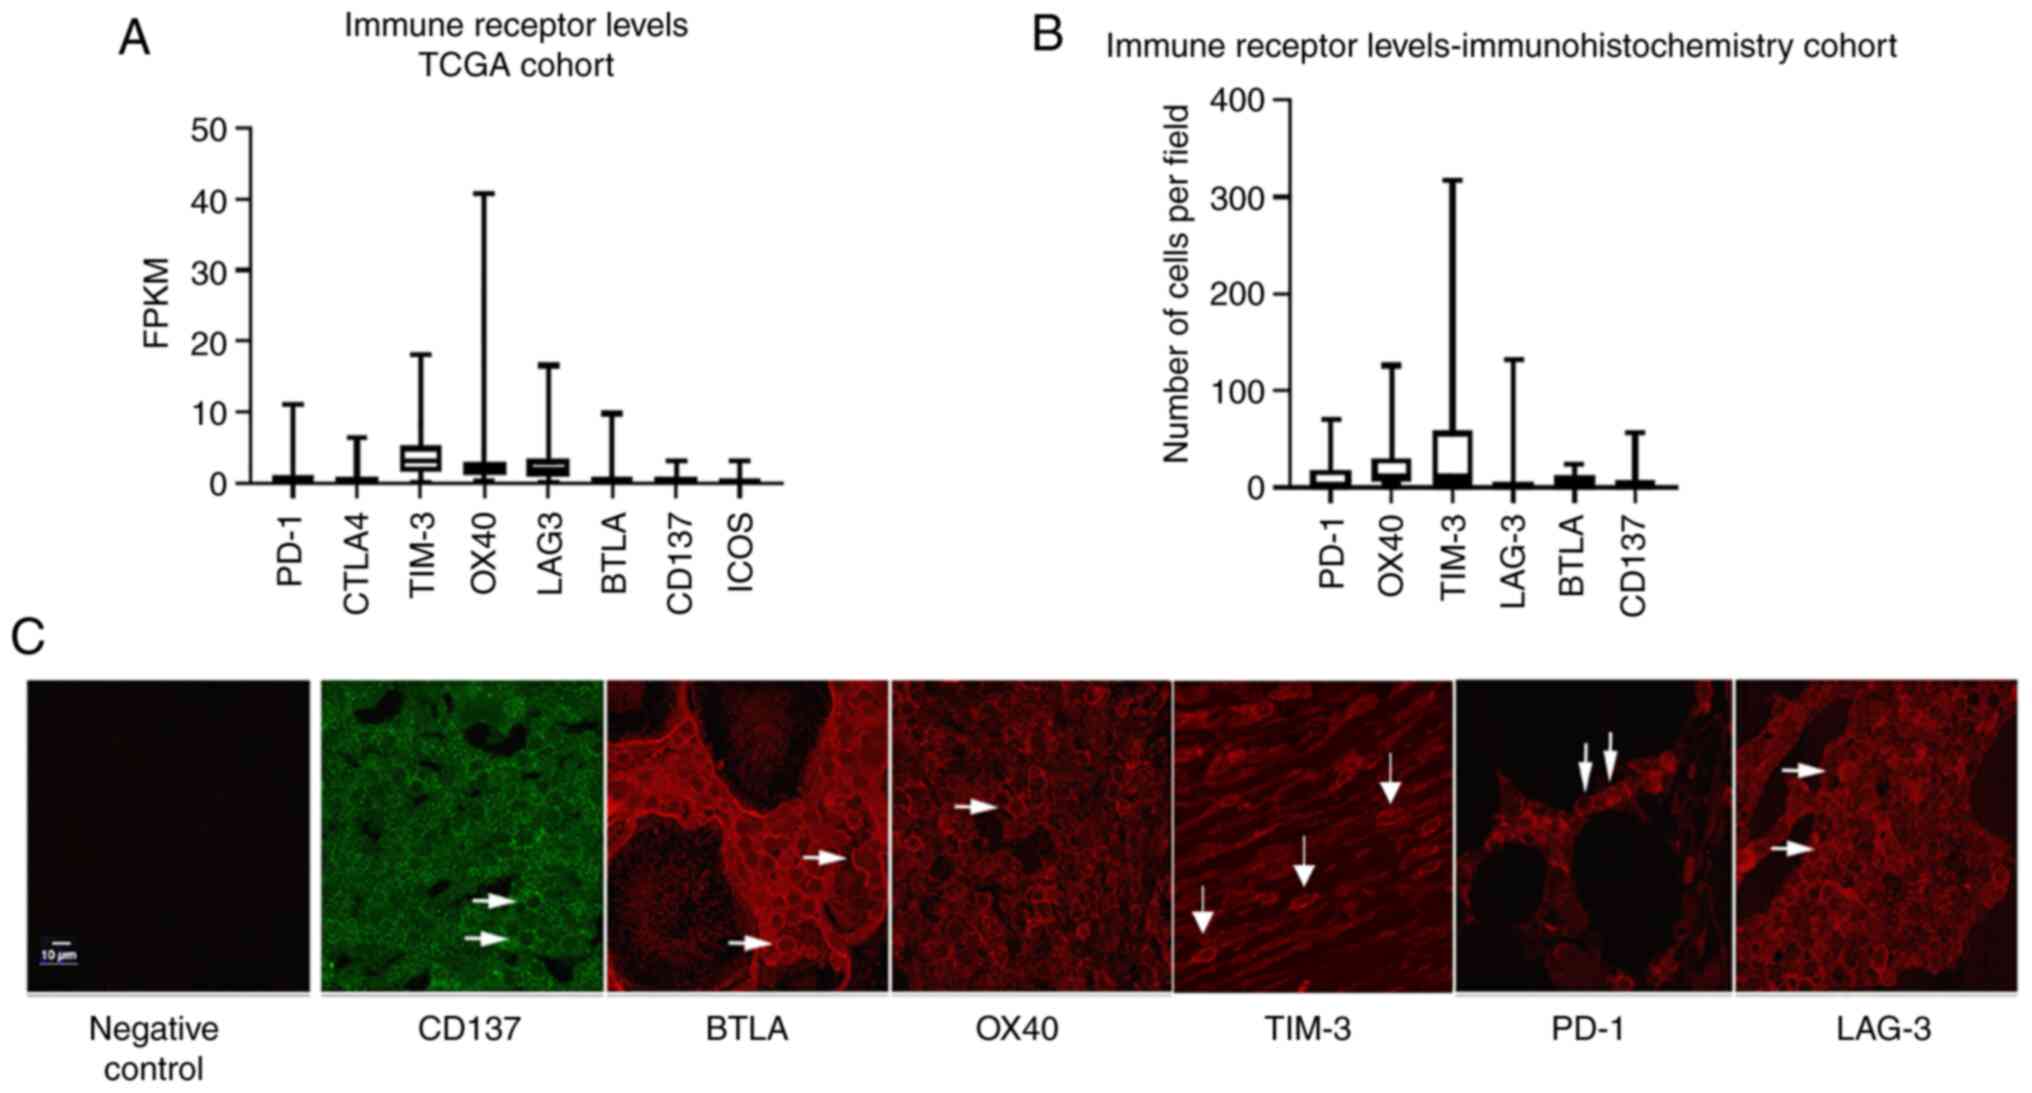
Analysis of ovarian cancer TCGA data was performed
to compare mRNA levels (FKPM) of the top eight most commonly
studied immune receptors in EOC: PD-1, cytotoxic T lymphocyte
associated protein-4 (CTLA-4), T-cell immunoglobin and mucin domain
containing 3 (TIM-3), OX40, CD137, B and T lymphocyte attenuator
(BTLA), and inducible T cell co-stimulator (ICOS). The highest
median transcript levels were observed in TIM-3 (3.13) and OX40
(2.02), followed by LAG-3 (1.86). PD-1 demonstrated a median
expression level of 0.54, with all other immune
co-receptors-CTLA-4, BTLA, CD137, and ICOS-exhibiting transcript
levels of ≥0.28 (Fig. 1A). To
confirm this data, immunohistochemistry was employed to determine
protein levels of select immune co-receptors in a cohort of ten
HGSOC patient tissues. Overall, there was a strong concordance
between TCGA mRNA expression and protein expression by
immunohistochemistry, with OX40 and TIM-3 immune co-receptors
demonstrating the highest median expression (11.75 and 11.5
positive cells per field, respectively). Furthermore, in agreement
with TCGA mRNA expression, PD-1, BTLA, and CD137 exhibited low
intratumoral median expression with ≤1.5 positive cells per field.
Interestingly, LAG-3+ cell numbers did not correlate
with TCGA mRNA data, as immunohistochemical analysis revealed an
average of only 0.5 positive cells per field (Fig. 1B), which was corroborated with two
different LAG-3 antibodies (data not shown). A representative image
of all co-receptors can be seen in Fig. 1C.
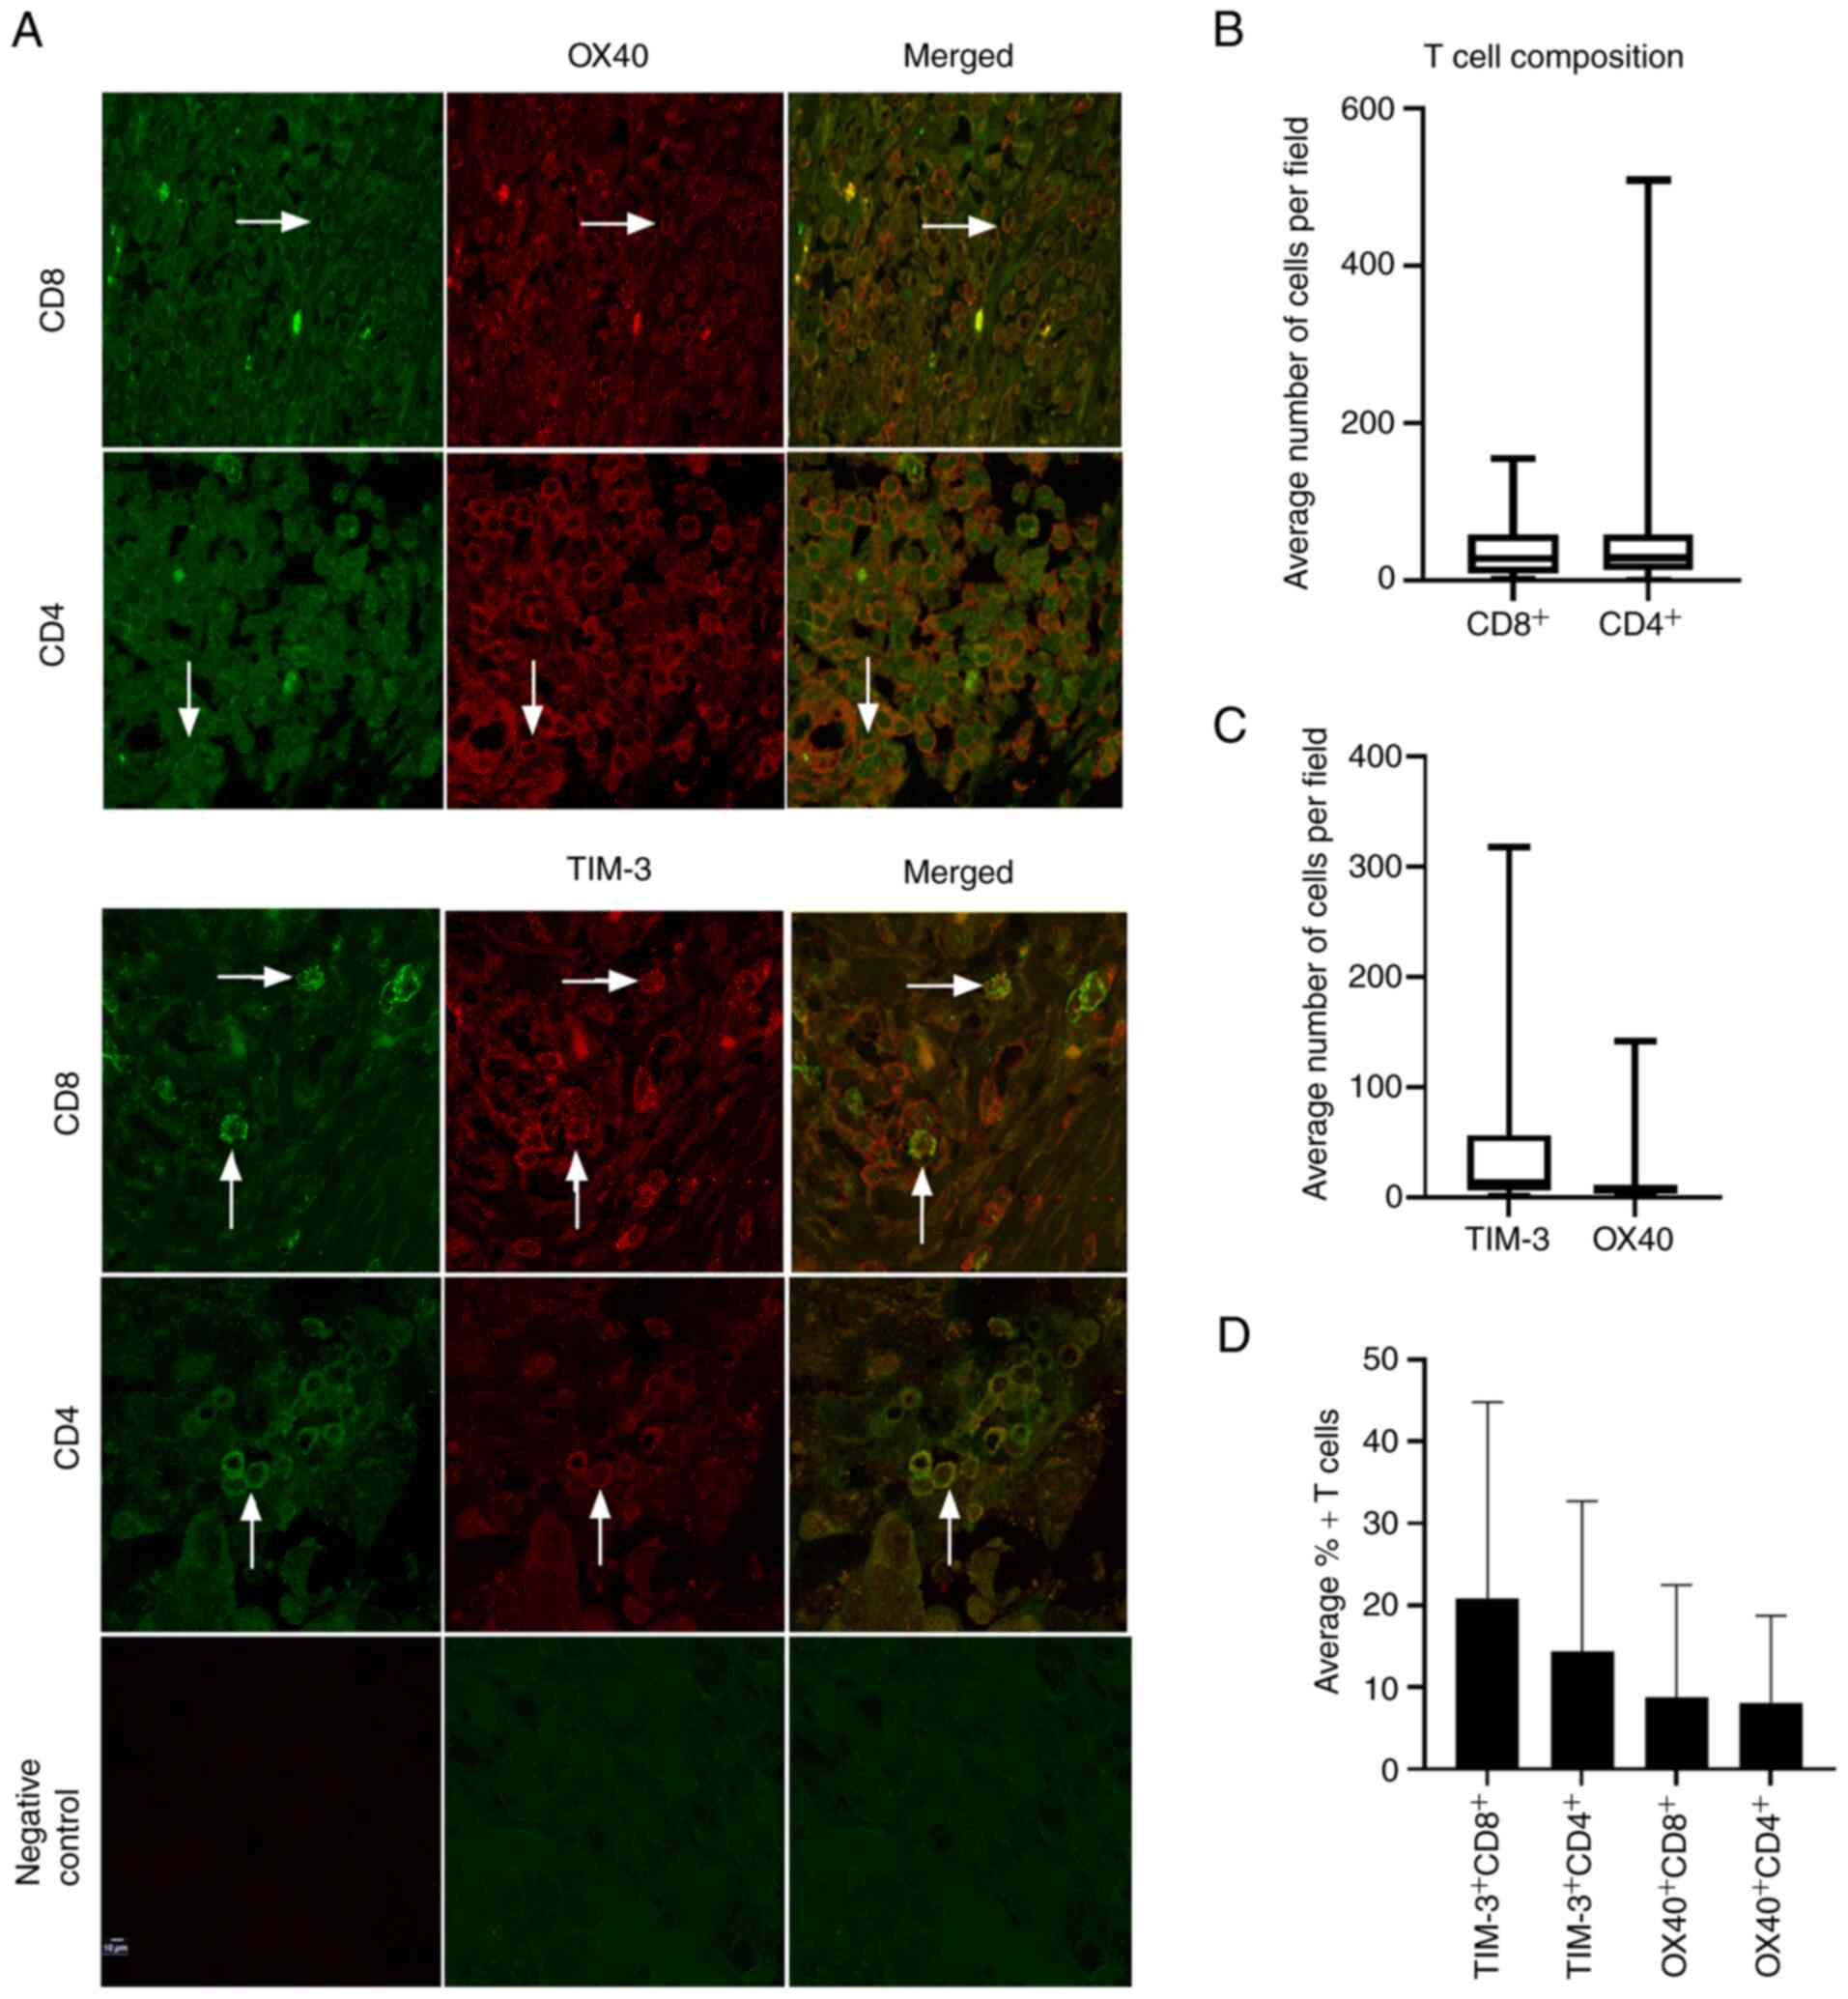
Characterization of TIM-3 and OX40
expression in helper and cytotoxic T cell population
Next, since TIM-3 and OX40 were the most highly
expressed immune co-receptors at both the gene and protein level,
an additional 19 HGSOC patient tissues were stained for OX40 and
TIM-3 in both CD4+ and CD8+ T cell
populations via immunohistochemistry, for a total of 29 tissues
(Fig. 2A). Median levels of
positive cells per field were 31 for CD8+ cells and 29.1
for CD4+ cells (Fig.
2B). TIM-3 and OX40 demonstrated median average cells per field
of 14.3 and 6.3, respectively (Fig.
2C). Examining co-expression of TIM-3 and OX40 in both
cytotoxic and helper T cell populations revealed that TIM-3 was
present on 20.8% of CD8+ T cells, and 14.0% of
CD4+ T cells, while OX40 was expressed on 8.9% of
CD8+ and 8.0% of CD4+ T cells (Fig. 2D), establishing that TIM-3 was more
highly expressed on both CD8+ and CD4+
subsets.
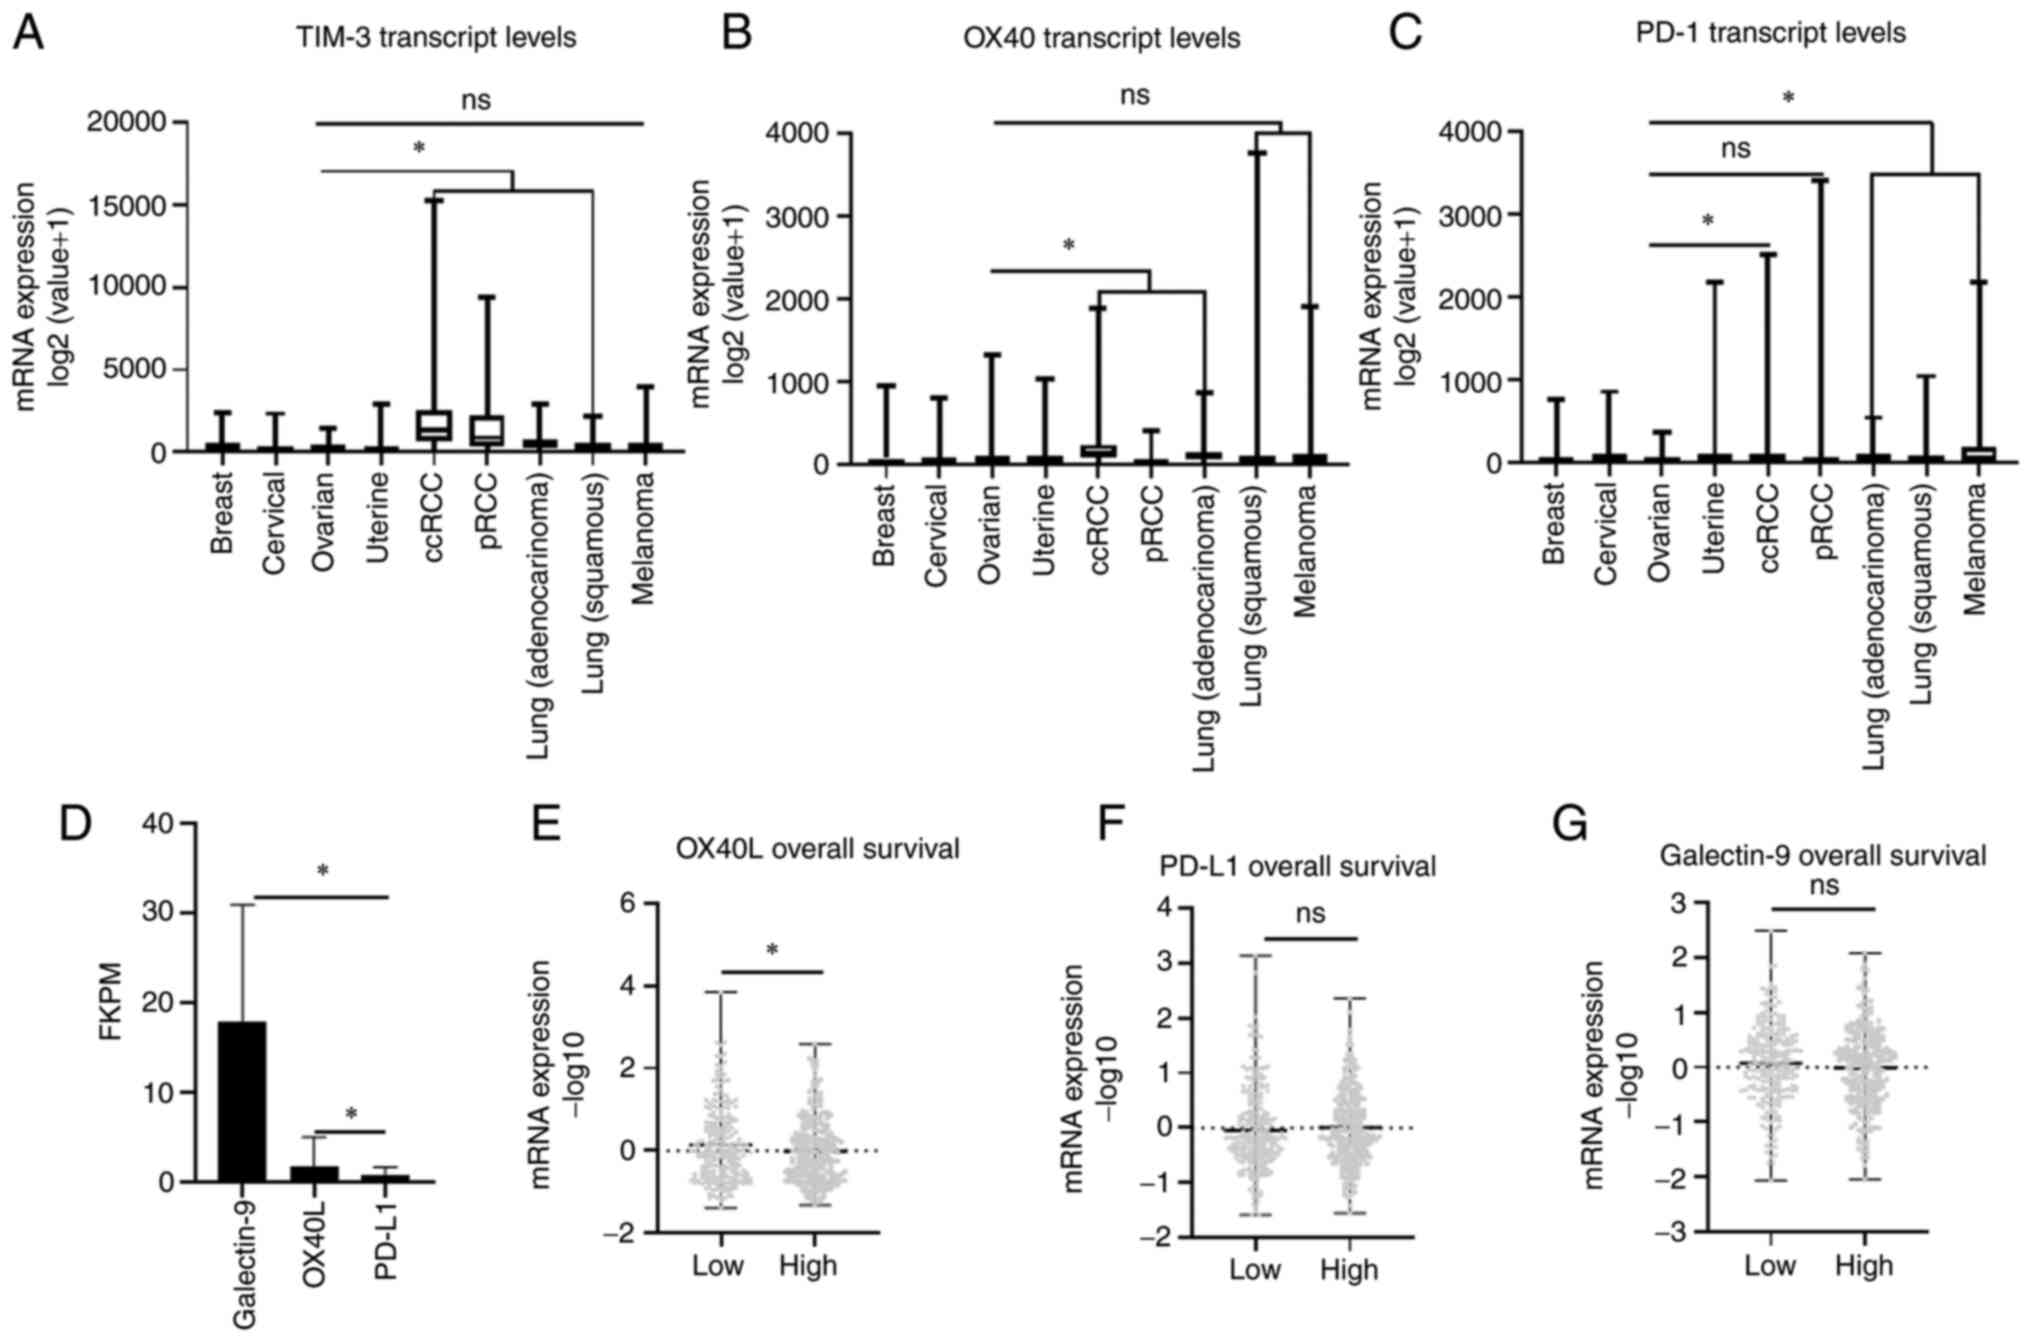
TIM-3 and OX40 expression across
select cancer subtypes
After examining the specific staining patterns of
TIM-3 and OX40 in helper and cytotoxic T cells, transcript
expression of both TIM-3 and OX40 along with PD-1 were compared
across a Pan Cancer TCGA cohort that included breast, gynecologic
malignancies, and immunotherapy responsive cancers such as renal
cell carcinoma (RCC), lung cancer, and melanoma. There was no
significant difference in TIM-3 expression between ovarian cancer
and melanoma (U=64916, P=0.5632), while a significant lower
expression was observed in ovarian cancer compared to clear cell
RCC (ccRCC) (U=17157, P<0.0001), papillary RCC (pRCC) (U=18861,
P<0.0001), lung adenocarcinoma (U=48751, P<0.0001), and
squamous lung cancer (U=65968, P=0.0314) (Fig. 3A). A similar trend was observed
with OX40 as transcript levels were not significantly different
between ovarian cancer and melanoma (U=64329, P=0.4601), or
squamous lung cancer (U=70892, P=0.5796) cohorts, while exhibiting
significantly lower levels (P<0.0001) compared to ccRCC
(U=35011) and lung adenocarcinoma (U=52535), and higher levels
compared to pRCC (U=16069) (Fig.
3B). Finally, comparing PD-1 mRNA expression revealed
significantly lower expression (P<0.0001) in ovarian cancer
cohorts compared to melanoma (U=42864), ccRCC (U=41215), lung
adenocarcinoma (U=33339), and squamous lung cancer (U=40306). No
significant difference between PD-1 expression was observed between
ovarian cancer and pRCC cohorts (U=38942, P=0.084). Moreover, the
ovarian cancer cohort demonstrated the lowest median transcript
expression of PD-1 out of all cancers analyzed (Fig. 3C). These results collectively
suggest that OX40 and TIM-3 may represent more clinically relevant
immune co-receptors for immunotherapy targeting than PD-1 in
ovarian cancer.
TIM-3 and OX40 ligand expression
Ligand expression for TIM-3 (Galectin-9), OX40
(OX40L) and PD-1 (PD-L1) was compared in the ovarian cancer TCGA
cohort. Significantly higher (P<0.001) transcript expression
(FKPM) of Galectin-9 (22.16-fold) and OX40L (2.07-fold) was
observed compared to PD-L1 levels (Fig. 3D). In addition, when ligand levels
were stratified according to median OS, mean mRNA expression
(−log10 value) of OX40L was significantly (P=0.048) elevated in
patients with a shorter survival (Fig.
3E), while TIM-3 (P=0.4873) and PD-L1 (P=0.2221) expression was
not significantly different when stratified by OS (Fig. 3F and G). Therefore, as was observed
for their co-receptor levels, Galectin-9 and OX40L are more
abundantly expressed than PD-L1 in HGSOC.
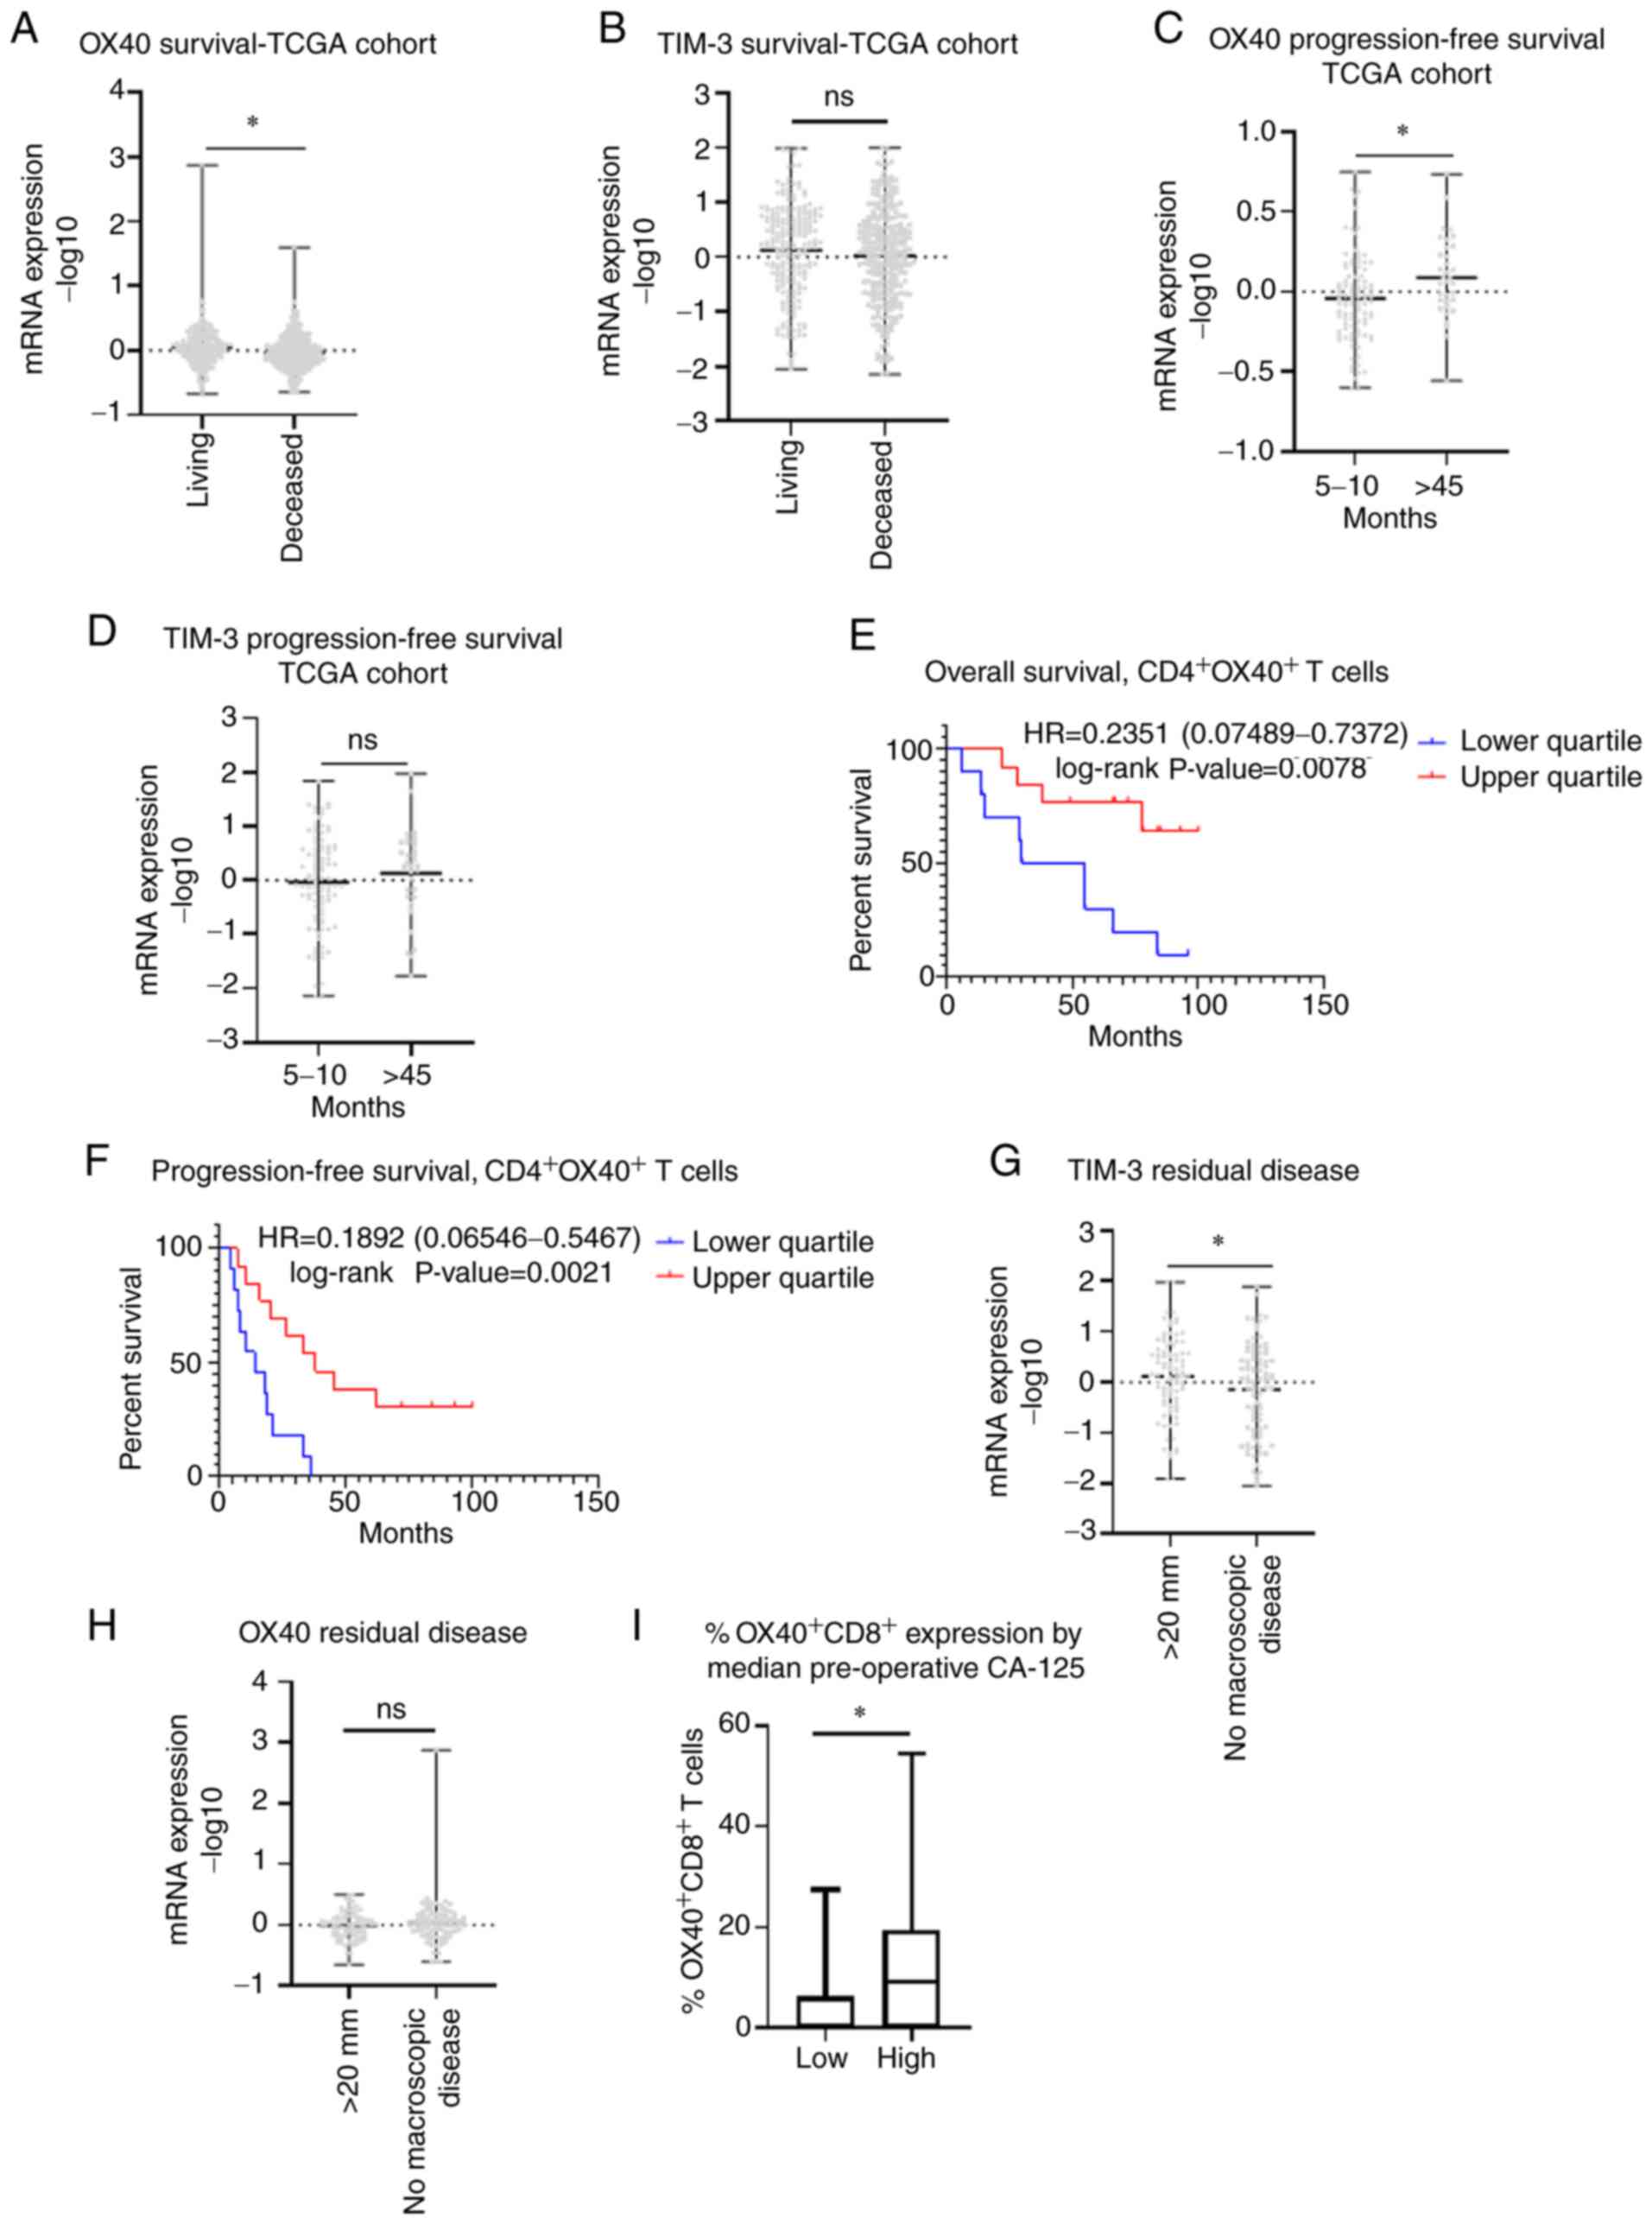
Clinical outcomes related to TIM-3 and
OX40 expression
Next, we stratified TIM-3 and OX40 protein
expression from our immunohistochemical analysis by median patient
PFS and OS. No significant difference in expression between short
and long median survival groups was observed for either receptor
(Fig. S2A-D). This observation
was confirmed at the genomic level utilizing TCGA data (Fig. S2E-H). Upon examining alternative
survival cohorts from TCGA data, we observed that transcript
expression (−log 10) of OX40 was 2.16-fold higher (P=0.0010) in
patients who were living vs. deceased. Similarly, median TIM-3
levels were higher in living patients than deceased patients,
however this association did not reach significance (P=0.1841)
(Fig. 4A and B). Furthermore,
comparing patients with a short (5–10 months) and an exceptionally
long (>45 months) PFS, we saw that OX40 was significantly higher
(P=0.0134) in patients with a longer PFS (Fig. 4C). While TIM-3 levels were also
elevated in patients with a longer PFS, this trend was not
significant (P=0.3271) (Fig. 4D).
Moreover, Kaplan-Meier curve analysis from our immunohistochemical
data demonstrated that higher levels of OX40 in CD4+ T
cells was associated with an improved OS (HR=0.2351
[0.07489-0.7372], P=0.0078) (Fig.
4E) and PFS (HR=0.1892 [0.06546-0.5467], P-value=0.0021)
(Fig. 4F). TCGA analysis was again
applied to compare OX40 and TIM-3 expression when stratified
according to residual disease outcomes following debulking surgery.
TIM-3 levels were significantly higher in patients who exhibited
>20 mm residual disease than in patients with no macroscopic
disease (P=0.0471) (Fig. 4G). In
contrast, there was no significant difference in OX40 levels
between the cohorts with >20 mm residual disease vs. no
macroscopic disease (P=0.3493) (Fig.
4H). Finally, as CA-125 is routinely used as a serum diagnostic
marker in conjunction with radiology to detect ovarian disease, we
sought to determine how OX40 expression related to these
pre-operative levels. Our immunohistochemical data revealed a
significantly higher percentage of OX40+ CD8+
cells in patients with higher median preoperative CA-125 levels
(U=55, P=0.0345) (Fig. 4I), with
no significant relationships detected between CA-125 and
OX40+ cells alone or OX40+ CD4+
cells (data not shown).
Lastly, we employed Kaplan-Meier survival curve
analysis to examine the relationship between TIM-3 and OX40 and
survival using TCGA and GSE data. Higher OX40 expression was
significantly associated with a longer OS [HR=0.78 (0.64-0.97),
P=0.022], but not PFS [HR=0.97 (0.8-1.17), P=0.73] in stage III
grade 3 patients (Fig. 5A and B).
Once restricting expression according to debulking status, it was
discovered that while increased OX40 expression was not associated
with improved OS or PFS in patients that were optimally debulked,
in suboptimally debulked patients a significant association with
improved OS [HR=0.58 (0.42-0.82), P=0.0.0015], and not PFS [HR=0.83
(0.61-1.13), P=0.24] was identified. (Fig. 5C-F). Conversely, no relationship
was detected between TIM-3 expression and survival outcomes in
stage III, grade 3 ovarian cancer patients (Fig. 5G-L). Taken as a whole, these
survival analyses identified that high OX40 expression is most
significantly and consistently associated with improved patient
survival.
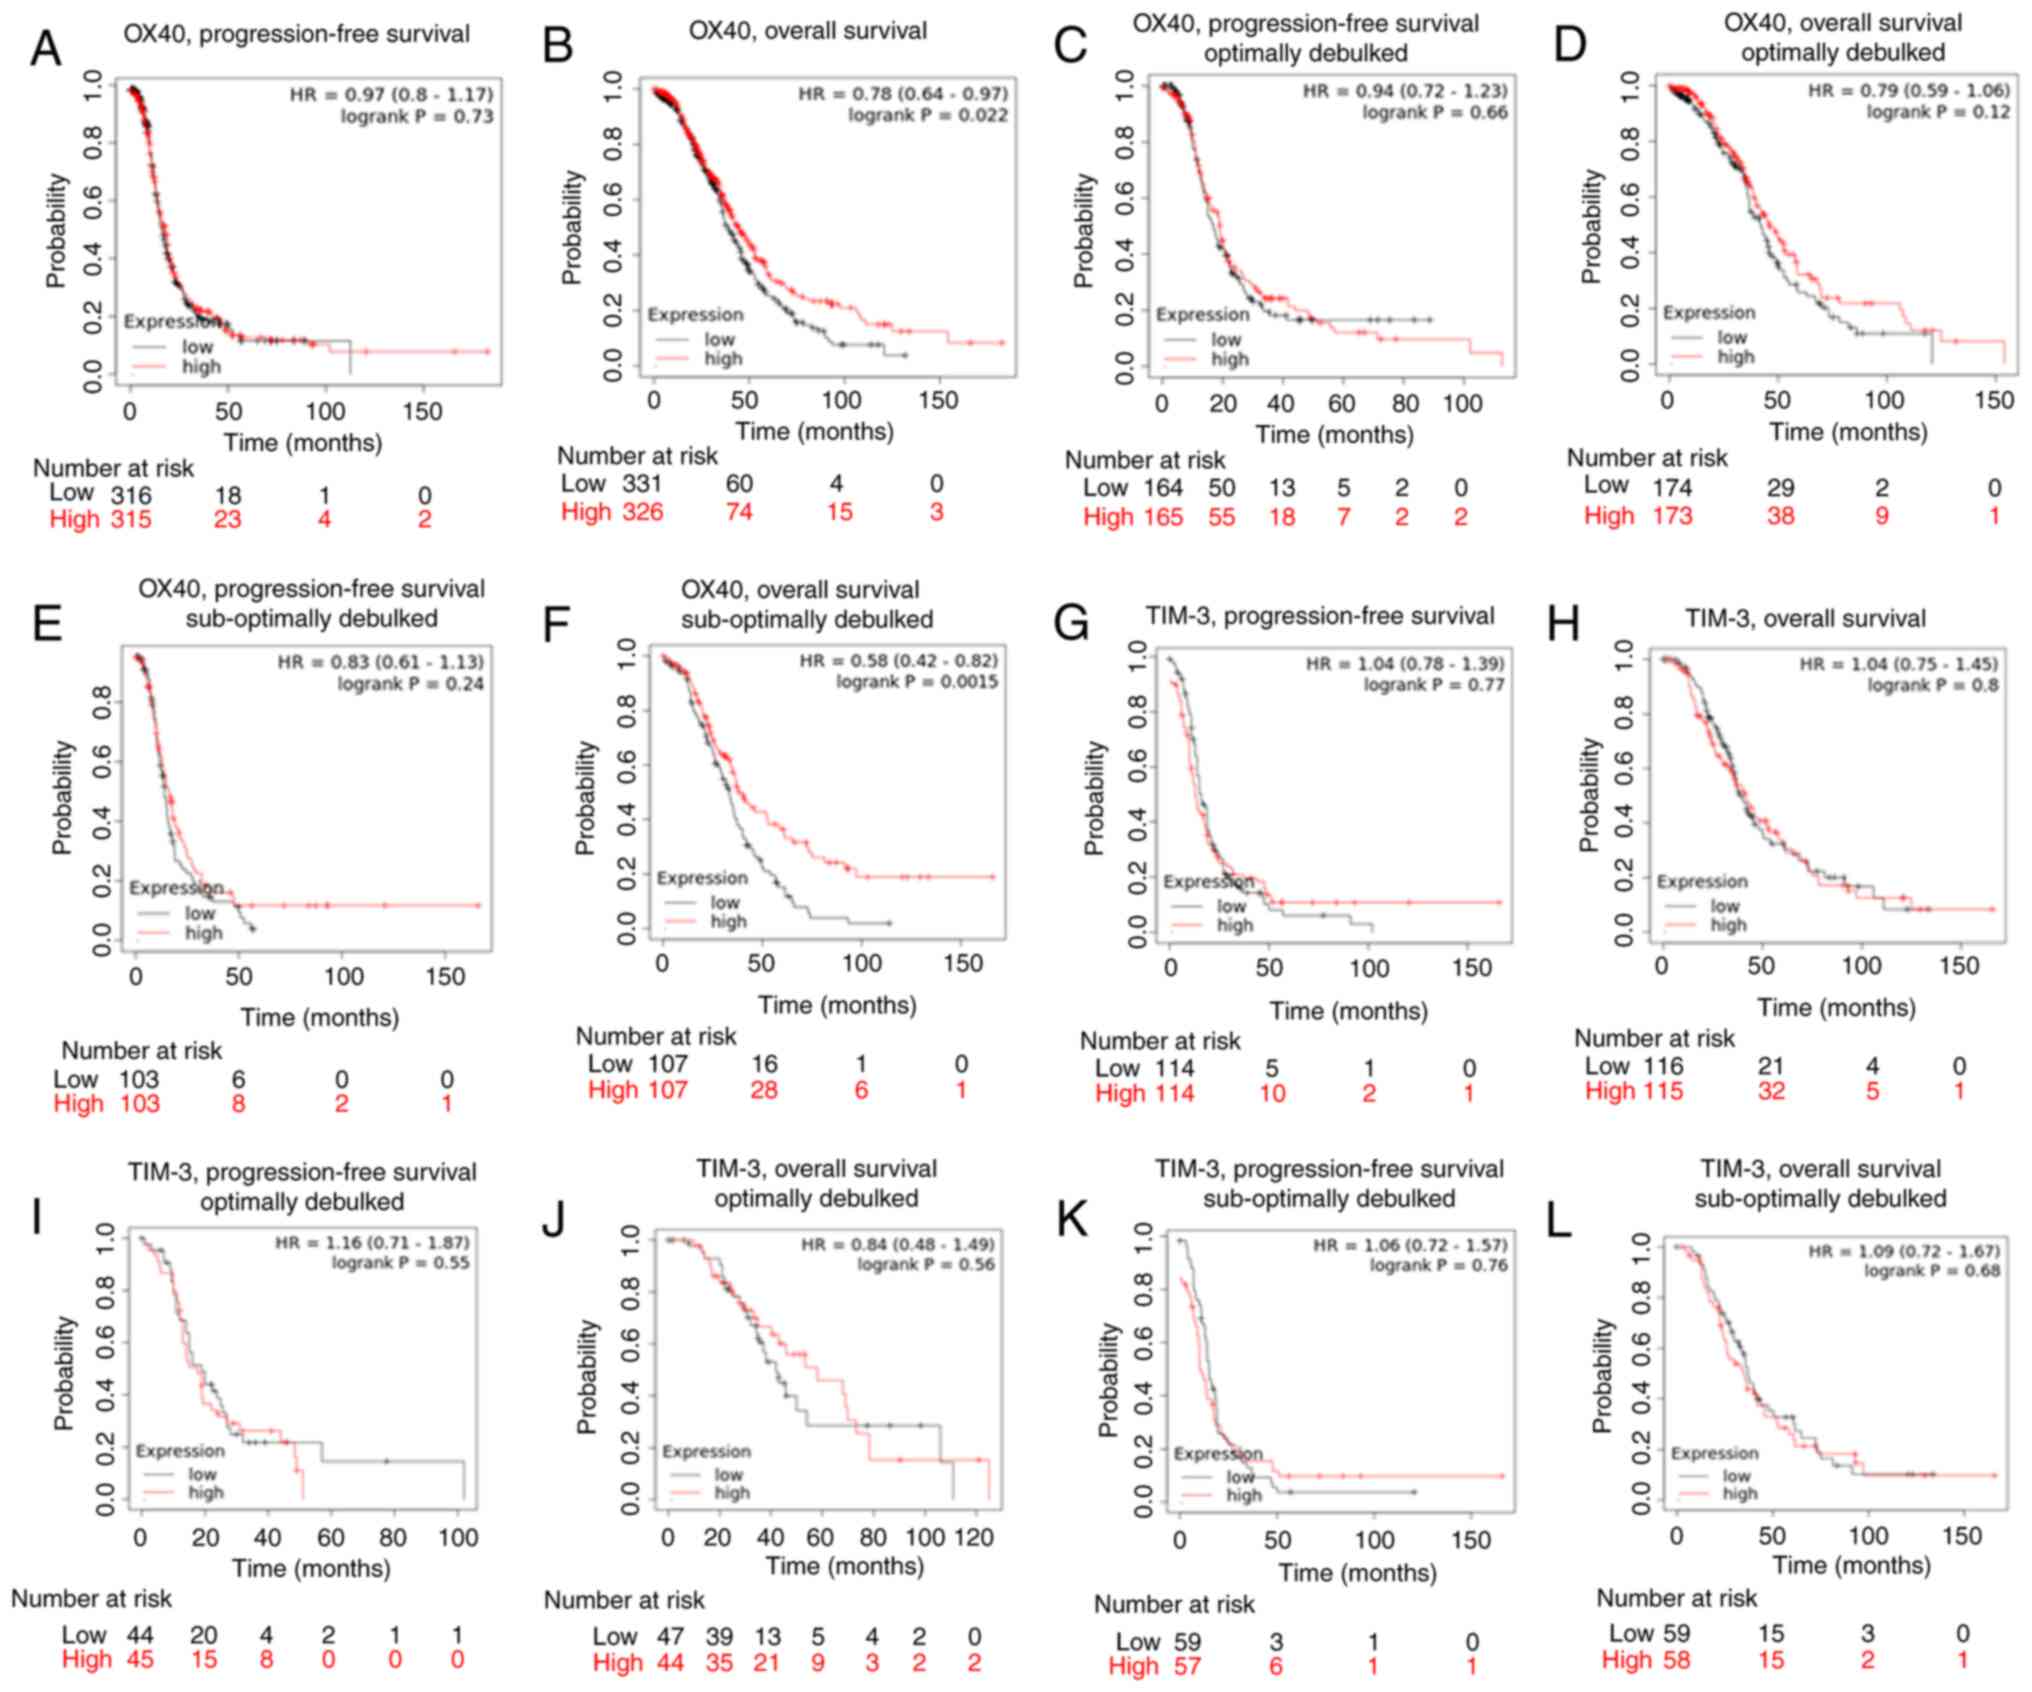 | Figure 5.Kaplan-Meier survival curve analysis
of TIM-3 and OX40. Kaplan-Meier survival analysis was performed
using The Cancer Genoma Atlas and Expression Omnibus Series data in
patients with serous stage III, grade 3 ovarian cancer.
Kaplan-Meier curves were generated to determine the association of
OX40 with (A) progression-free survival, (B) overall survival, (C)
progression-free survival (optimal debulking sub-cohort), (D)
overall survival (optimal debulking sub-cohort), (E)
progression-free survival (suboptimal debulking sub-cohort) and (F)
overall survival (suboptimal debulking sub-cohort). Kaplan-Meier
curves were generated depicting the association of TIM-3 with (G)
progression-free survival, (H) overall survival, (I)
progression-free survival (optimal debulking sub-cohort), (J)
overall survival (optimal debulking sub-cohort), (K)
progression-free survival (suboptimal debulking sub-cohort), and
(L) overall survival (suboptimal debulking sub-cohort). Median
expression of either OX40 or TIM-3 was used to delineate ‘low’ vs.
‘high’ expressing groups. Log-rank hazard ratios and P-values are
reported, with 95% confidence intervals in parentheses. |
Discussion
This comparative analysis revealed that TIM-3 and
OX40 are two prominently expressed immune co-receptors in HGSOC,
and consistently more highly expressed than PD-1 at the RNA and
protein level. Furthermore, specific levels of both co-receptors
were characterized in helper and cytotoxic T cell populations,
revealing higher expression of TIM-3 in CD4+ and
CD8+ T cells. While this T cell expression analysis was
limited due to a small sample size, it will be necessary to verify
these findings in a larger patient cohort, as well as expand our
analyses to regulatory T cell populations. Nevertheless, to the
best of our knowledge, there has been only one comprehensive
intratumoral immune profiling paper in HGSOC. Rådestad et al
similarly discovered high levels of TIM-3 in CD4+ and
CD8+ populations and additionally found that that
highest degree of co-expression out of all immune receptors
analyzed existed on TIM-3+ PD-1+
CD8+ T cells (42). The
naturally high expression of TIM-3, along with its high degree of
co-expression with PD-1 indicates that TIM-3 could be an
efficacious combinatorial partner to anti-PD-1 therapy. Moreover, a
study by Fucikova et al found that TIM-3 was highly
expressed on CD8+ populations, with PD-1+
TIM-3+ CD8+ T cells exhibiting all hallmarks
of functional exhaustion and correlating with poor clinical
outcomes in HGSOC (43).
Conversely, neither CTLA-4, LAG-3, or the PD-1/PD-L1 axis alone
were found to contribute to clinically meaningful
immunosuppression, suggesting that TIM-3 might play a pivotal role
in suppressing immune responses in HGSOC (43). Hence, the high degree of expression
exhibited by TIM-3 in HGSOC discovered by our group and others
coupled with its high degree of co-expression with PD-1 suggests
that it may represent a viable treatment modality to increase
ovarian cancer patient response to PD-1 based therapy.
Our data revealed that while TIM-3 exhibited higher
levels on both helper and cytotoxic T cell populations, OX40 was
most significantly associated with longer patient survival. Using
ovarian cancer TCGA and GSE data, we found that higher OX40
transcript levels are consistently associated with a significantly
longer survival. Furthermore, OX40′s ligand, OX40L was found to be
significantly associated with improved survival. Finally, our
original data suggests that intratumoral co-expression of CD4 and
OX40 is significantly associated with improved HGSOC patient PFS
and OS. Interestingly, a study by Ramser et al reported that
levels of OX40 in ovarian cancer patient pre-treatment biopsies
significantly correlated to chemosensitivity. In addition, patients
who exhibited an increase in intratumoral OX40 expression within
recurrent biopsies had improved recurrence free survival (RFS)
(44). These studies corroborate
our data showing that increased OX40 expression is associated with
improved patient clinical outcomes both in the upfront and
recurrent treatment setting, suggesting OX40′s utility as a
prognostic factor for improved survival in HGSOC. In order to
validate these results, a large prospective cohort should be
initiated in addition to further investigations that examine if
OX40 expression can be detected through non-invasive sampling to
increase clinical utility of this potential immune prognostic
marker.
There have been limited pre-clinical studies
performed that have explored the efficacy of targeting either TIM-3
or OX40 with a PD-1 inhibitor. A study by Guo et al reported
that targeting OX40 and PD-1 in combination significantly reduced
murine tumor growth, increased levels of helper and cytotoxic T
cells, promoted interferon-gamma (IFNγ) secretion, and decreased
levels of regulatory T cells (Treg) and myeloid-derived
suppressor cells (MDSCs) (45).
Furthermore, an in vitro study that targeted TIM-3 and PD-1
in combination demonstrated an increase in the production of
granzyme B, INFγ, and perforin in cytotoxic T cells, while
inhibition of each immune receptor alone produced no such effects
(43). In recent years, several
early clinical trials have been initiated examining monoclonal
antibodies against OX40 and TIM-3 in combination with anti-PD-1
based inhibitors. An OX40 agonist (PF-04518600) has been
investigated in combination with the PD-1 inhibitor avelumab in a
phase 2 triple negative breast cancer trial (NCT-3971407) and a
phase 1b/2 trial in solid tumors that includes a platinum resistant
ovarian cancer cohort (NCT02554812). Furthermore, a phase 1 trial
evaluating a hexavalent OX40 agonist (INBR-X-106) in combination
with another PD-1 inhibitor, pembrolizumab, in advanced or
metastatic solid tumors has also been initiated (NCT041987). There
is one TIM-3 inhibitor (TSR-022) currently being investigating in
clinical trials. A phase 1 trial evaluating TSR-022 in combination
with nivolumab (anti-PD-1 monoclonal antibody) in solid tumors
(NCT02817633), as well as a phase 2 trial in melanoma in addition
to the PD-1 inhibitor dostarlimab (NCT04139902) have commenced.
Ultimately, results from these early clinical trial studies will
provide insight into the effectiveness of OX40 and TIM-3 based
immunotherapies.
This study represents an intratumoral expression
analysis of several of the most commonly studied immune receptors
in EOC, which identified TIM-3 and OX40 as having the highest
distribution of expression. Therefore, these receptors represent
potential therapeutic targets that in combination with current PD-1
based inhibitors could improve patient response to immunotherapy.
Furthermore, our analyses suggest that OX40 is most significantly
associated with improved survival compared to TIM-3, and may serve
as a prognostic immune factor for improved outcomes in HGSOC.
Supplementary Material
Supporting Data
Supporting Data
Acknowledgements
The authors would like to thank Dr Joselynn Wallace
(COBRE Center for CBHD, Brown University) for assistance with
acquiring TCGA data. The authors would also like to thank Dr
Christina Raker (Division of Research, Women and Infants Hospital)
for counseling on all statistical analyses performed.
Funding
The present study was supported by the Rhode Island Hospital
Center for Cancer Research Development COBRE Pilot Award supported
by an Institutional Development Award (IDeA) from the National
Institute of General Medical Sciences of the National Institutes of
Health (grant no. 5P30GM110759); the Division of Gynecologic
Oncology, Program in Women's Oncology at Women & Infants
Hospital; Swim Across America; the Kilguss Research Core of Women
& Infants Hospital, and the COBRE Center for Computational
Biology of Human Disease (CBHD) at Brown University. The Kilguss
Research Core is supported by an Institutional Development Award
(IDeA) from the National Institute of General Medical Sciences of
the National Institutes of Health (grant no. P30GM114750). The
COBRE Center for CBHD is supported by an Institutional Development
Award (IDeA) from the National Institute of General Medical
Sciences of the National Institutes of Health (grant no.
P20GM109035).
Availability of data and materials
All data generated during this study are included in
this published article.
Authors' contributions
NEJ and JRR were responsible for the
conceptualization and design of the study. ADV, MW and NEJ
performed immunohistochemical staining. Image acquisition and
analysis was executed by VH, JRR and NEJ. ADV, JBE, and KM
performed chart reviews. All statistical analyses were performed by
NEJ and JRR. JO obtained all tissue samples utilized and assured
they met minimum quality standards. JRR oversaw all aspects of the
study. NEJ, JRR and ADV prepared the manuscript. NEJ and JRR
confirm the authenticity of all the raw data. All authors read and
approved the final manuscript.
Ethics approval and consent to
participate
All patient tissue used for this study was obtained
under the approval of the Women and Infants Hospital Institutional
Review Board (protocol no. 1326537). Under this approved protocol,
a waiver of consent and Health Insurance Portability and
Accountability Act (HIPAA) was obtained.
Patient consent for publication
Not applicable.
Competing interests
The authors declare that they have no competing
interests.
References
|
1
|
American Cancer Society, . Key Statistics
for Ovarian Cancer. https://www.cancer.org/cancer/ovarian-cancer/about/key-statistics.htmlFebruary
1–2022PubMed/NCBI
|
|
2
|
Torre LA, Trabert B, DeSantis CE, Miller
KD, Samimi G, Runowicz CD, Gaudet MM, Jemal A and Siegel RL:
Ovarian cancer statistics, 2018. CA Cancer J Clin. 68:284–296.
2018. View Article : Google Scholar : PubMed/NCBI
|
|
3
|
Labidi-Galy SI, Papp E, Hallberg D,
Niknafs N, Adleff V, Noe M, Bhattacharya R, Novak M, Jones S,
Phallen J, et al: High grade serous ovarian carcinomas originate in
the fallopian tube. Nat Commun. 8:10932017. View Article : Google Scholar : PubMed/NCBI
|
|
4
|
Morgan RD, Clamp AR, Evans DGR, Edmondson
RJ and Jayson GC: PARP inhibitors in platinum-sensitive high-grade
serous ovarian cancer. Cancer Chemother Pharmacol. 81:647–658.
2018. View Article : Google Scholar : PubMed/NCBI
|
|
5
|
Selvakumaran M, Pisarcik DA, Bao R, Yeung
AT and Hamilton TC: Enhanced cisplatin cytotoxicity by disturbing
the nucleotide excision repair pathway in ovarian cancer cell
lines. Cancer Res. 63:1311–1316. 2003.PubMed/NCBI
|
|
6
|
Rossi L, Verrico M, Zaccarelli E, Papa A,
Colonna M, Strudel M, Vici P, Bianco V and Tomao F: Bevacizumab in
ovarian cancer: A critical review of phase III studies. Oncotarget.
8:12389–12405. 2017. View Article : Google Scholar : PubMed/NCBI
|
|
7
|
Liu G, Yang D, Sun Y, Shmulevich I, Xue F,
Sood AK and Zhang W: Differing clinical impact of BRCA1 and BRCA2
mutations in serous ovarian cancer. Pharmacogenomics. 13:1523–1535.
2012. View Article : Google Scholar : PubMed/NCBI
|
|
8
|
Earl H, Molica S and Rutkowski P:
Spotlight on landmark oncology trials: The latest evidence and
novel trial designs. BMC Med. 15:1112017. View Article : Google Scholar : PubMed/NCBI
|
|
9
|
Lieber S, Reinartz S, Raifer H,
Finkernagel F, Dreyer T, Bronger H, Jansen JM, Wagner U, Worzfeld
T, Müller R and Huber M: Prognosis of ovarian cancer is associated
with effector memory CD8+ T cell accumulation in
ascites, CXCL9 levels and activation-triggered signal transduction
in T cells. Oncoimmunology. 7:e14246722018. View Article : Google Scholar : PubMed/NCBI
|
|
10
|
Hamanishi J, Mandai M and Konishi I:
Immune checkpoint inhibition in ovarian cancer. Int Immunol.
28:339–348. 2016. View Article : Google Scholar : PubMed/NCBI
|
|
11
|
Webb JR, Milne K, Kroeger DR and Nelson
BH: PD-L1 expression is associated with tumor-infiltrating T cells
and favorable prognosis in high-grade serous ovarian cancer.
Gynecol Oncol. 141:293–302. 2016. View Article : Google Scholar : PubMed/NCBI
|
|
12
|
Drakes ML, Mehrotra S, Aldulescu M, Potkul
RK, Liu Y, Grisoli A, Joyce C, O'Brien TE, Stack MS and Stiff PJ:
Stratification of ovarian tumor pathology by expression of
programmed cell death-1 (PD-1) and PD-ligand-1 (PD-L1) in ovarian
cancer. J Ovarian Res. 11:432018. View Article : Google Scholar : PubMed/NCBI
|
|
13
|
Rodriguez GM, Galpin KJC, McCloskey CW and
Vanderhyden BC: The tumor microenvironment of epithelial ovarian
cancer and its influence on response to immunotherapy. Cancers
(Basel). 10:2422018. View Article : Google Scholar : PubMed/NCBI
|
|
14
|
Zhang L, Conejo-Garcia JR, Katsaros D,
Gimotty PA, Massobrio M, Regnani G, Makrigiannakis A, Gray H,
Schlienger K, Liebman MN, et al: Intratumoral T cells, recurrence,
and survival in epithelial ovarian cancer. N Engl J Med.
348:203–213. 2003. View Article : Google Scholar : PubMed/NCBI
|
|
15
|
Santoiemma PP and Powell DJ Jr: Tumor
infiltrating lymphocytes in ovarian cancer. Cancer Biol Ther.
16:807–820. 2015. View Article : Google Scholar : PubMed/NCBI
|
|
16
|
James NE, Woodman M, DiSilvestro PA and
Ribeiro JR: The perfect combination: Enhancing Patient response to
PD-1-based therapies in epithelial ovarian cancer. Cancers (Basel).
12:21502020. View Article : Google Scholar : PubMed/NCBI
|
|
17
|
Ghisoni E, Imbimbo M, Zimmermann S and
Valabrega G: Ovarian cancer immunotherapy: Turning up the heat. Int
J Mol Sci. 20:29272019. View Article : Google Scholar : PubMed/NCBI
|
|
18
|
Torphy RJ, Schulick RD and Zhu Y: Newly
emerging immune checkpoints: Promises for future cancer therapy.
Int J Mol Sci. 18:26422017. View Article : Google Scholar : PubMed/NCBI
|
|
19
|
Ritthipichai K, Haymaker CL, Martinez M,
Aschenbrenner A, Yi X, Zhang M, Kale C, Vence LM, Roszik J,
Hailemichael Y, et al: Multifaceted role of BTLA in the control of
CD8+ T-cell fate after antigen encounter. Clin Cancer
Res. 23:6151–6164. 2017. View Article : Google Scholar : PubMed/NCBI
|
|
20
|
Flynn R, Hutchinson T, Murphy KM, Ware CF,
Croft M and Salek-Ardakani S: CD8 T cell memory to a viral pathogen
requires trans cosignaling between HVEM and BTLA. PLoS One.
8:e779912013. View Article : Google Scholar : PubMed/NCBI
|
|
21
|
Simon T and Bromberg JS: BTLA+
dendritic cells: The regulatory T cell force awakens. Immunity.
45:956–958. 2016. View Article : Google Scholar : PubMed/NCBI
|
|
22
|
Marin-Acevedo JA, Dholaria B, Soyano AE,
Knutson KL, Chumsri S and Lou Y: Next generation of immune
checkpoint therapy in cancer: New developments and challenges. J
Hematol Oncol. 11:392018. View Article : Google Scholar : PubMed/NCBI
|
|
23
|
Zak KM, Grudnik P, Magiera K, Dömling A,
Dubin G and Holak TA: Structural biology of the immune checkpoint
receptor PD-1 and its ligands PD-L1/PD-L2. Structure. 25:1163–1174.
2017. View Article : Google Scholar : PubMed/NCBI
|
|
24
|
Han Y, Liu D and Li L: PD-1/PD-L1 pathway:
Current researches in cancer. Am J Cancer Res. 10:727–742.
2020.PubMed/NCBI
|
|
25
|
Makkouk A, Chester C and Kohrt HE:
Rationale for anti-CD137 cancer immunotherapy. Eur J Cancer.
54:112–119. 2016. View Article : Google Scholar : PubMed/NCBI
|
|
26
|
Snell LM, Lin GH, McPherson AJ, Moraes TJ
and Watts TH: T-cell intrinsic effects of GITR and 4-1BB during
viral infection and cancer immunotherapy. Immunol Rev. 244:197–217.
2011. View Article : Google Scholar : PubMed/NCBI
|
|
27
|
Bauché D, Joyce-Shaikh B, Jain R, Grein J,
Ku KS, Blumenschein WM, Ganal-Vonarburg SC, Wilson DC, McClanahan
TK, Malefyt RW, et al: LAG3+ regulatory T cells restrain
interleukin-23-Producing CX3CR1+ gut-resident
macrophages during group 3 innate lymphoid cell-driven colitis.
Immunity. 49:342–352.e5. 2018. View Article : Google Scholar : PubMed/NCBI
|
|
28
|
Workman CJ, Cauley LS, Kim IJ, Blackman
MA, Woodland DL and Vignali DAA: Lymphocyte activation gene-3
(CD223) regulates the size of the expanding T cell population
following antigen activation in vivo. J Immunol. 172:5450–5455.
2004. View Article : Google Scholar : PubMed/NCBI
|
|
29
|
Grosso JF, Kelleher CC, Harris TJ, Maris
CH, Hipkiss EL, De Marzo A, Anders R, Netto G, Getnet D, Bruno TC,
et al: LAG-3 regulates CD8+ T cell accumulation and
effector function in murine self- and tumor-tolerance systems. J
Clin Invest. 117:3383–3392. 2007. View Article : Google Scholar : PubMed/NCBI
|
|
30
|
Willoughby J, Griffiths J, Tews I and
Cragg MS: OX40: Structure and function-What questions remain? Mol
Immunol. 83:13–22. 2017. View Article : Google Scholar : PubMed/NCBI
|
|
31
|
Buchan SL, Rogel A and Al-Shamkhani A: The
immunobiology of CD27 and OX40 and their potential as targets for
cancer immunotherapy. Blood. 131:39–48. 2018. View Article : Google Scholar : PubMed/NCBI
|
|
32
|
Jayaraman P, Jacques MK, Zhu C, Steblenko
KM, Stowell BL, Madi A, Anderson AC, Kuchroo VK and Behar SM: TIM3
Mediates T Cell Exhaustion during Mycobacterium tuberculosis
infection. PLoS Pathog. 12:e10054902016. View Article : Google Scholar : PubMed/NCBI
|
|
33
|
Anderson AC, Joller N and Kuchroo VK:
Lag-3, Tim-3, and TIGIT: Co-inhibitory receptors with specialized
functions in immune regulation. Immunity. 44:989–1004. 2016.
View Article : Google Scholar : PubMed/NCBI
|
|
34
|
Xiao Z, Mayer AT, Nobashi TW and Gambhir
SS: ICOS Is an Indicator of T-cell-mediated response to cancer
immunotherapy. Cancer Res. 80:3023–3032. 2020. View Article : Google Scholar : PubMed/NCBI
|
|
35
|
Solinas C, Gu-Trantien C and Willard-Gallo
K: The rationale behind targeting the ICOS-ICOS ligand
costimulatory pathway in cancer immunotherapy. ESMO Open.
5:e0005442020. View Article : Google Scholar : PubMed/NCBI
|
|
36
|
Hosseini A, Gharibi T, Marofi F, Babaloo Z
and Baradaran B: CTLA-4: From mechanism to autoimmune therapy. Int
Immunopharmacol. 80:1062212020. View Article : Google Scholar : PubMed/NCBI
|
|
37
|
Wang J, Sanmamed MF, Datar I, Su TT, Ji L,
Sun J, Chen L, Chen Y, Zhu G, Yin W, et al: Fibrinogen-like Protein
1 Is a Major Immune Inhibitory Ligand of LAG-3. Cell.
176:334–347.e12. 2019. View Article : Google Scholar : PubMed/NCBI
|
|
38
|
Andrews LP, Marciscano AE, Drake CG and
Vignali DA: LAG3 (CD223) as a cancer immunotherapy target. Immunol
Rev. 276:80–96. 2017. View Article : Google Scholar : PubMed/NCBI
|
|
39
|
Team RC: R: A language and environment for
statistical computing. 2013. http://www.R-project.org/June 15–2020
|
|
40
|
Morgan M and Davis S: R: A language and
environment for statistical computing. [Internet]. NIH/NCI Genomic
Data Commons Access. https://bioconductor.org/packages/GenomicDataCommonsJune
15–2020
|
|
41
|
Gyorffy B, Lánczky A and Szállási Z:
Implementing an online tool for genome-wide validation of
survival-associated biomarkers in ovarian-cancer using microarray
data from 1287 patients. Endocr Relat Cancer. 19:197–208. 2012.
View Article : Google Scholar : PubMed/NCBI
|
|
42
|
Rådestad E, Klynning C, Stikvoort A,
Mogensen O, Nava S, Magalhaes I and Uhlin M: Immune profiling and
identification of prognostic immune-related risk factors in human
ovarian cancer. Oncoimmunology. 8:e15357302019. View Article : Google Scholar : PubMed/NCBI
|
|
43
|
Fucikova J, Rakova J, Hensler M, Kasikova
L, Belicova L, Hladikova K, Truxova I, Skapa P, Laco J, Pecen L, et
al: TIM-3 dictates functional orientation of the immune infiltrate
in ovarian cancer. Clin Cancer Res. 25:4820–4831. 2019. View Article : Google Scholar : PubMed/NCBI
|
|
44
|
Ramser M, Eichelberger S, Däster S,
Weixler B, Kraljević M, Mechera R, Tampakis A, Delko T, Güth U,
Stadlmann S, et al: High OX40 expression in recurrent ovarian
carcinoma is indicative for response to repeated chemotherapy. BMC
Cancer. 18:4252018. View Article : Google Scholar : PubMed/NCBI
|
|
45
|
Guo Z, Wang X, Cheng D, Xia Z, Luan M and
Zhang S: PD-1 blockade and OX40 triggering synergistically protects
against tumor growth in a murine model of ovarian cancer. PLoS One.
9:e893502014. View Article : Google Scholar : PubMed/NCBI
|