Introduction
Type 2 diabetes mellitus (T2DM) and cancer are the
most common causes of death in the world, and the incidence of
certain cancers is increasing in patients with T2DM, such as a
total incidence of 0.95% for endometrial cancer in 2007 and 0.75%
for colorectal cancer in 2011 (1–3).
Meanwhile, a mortality rate of 7.5% in patients with T2DM with
cancer was also observed in 2010 (1). Among them, the incidence of T2DM
combined with digestive system tumors ranks first, for instance,
the incidence of colorectal cancer (CRC) is 1.3-1.5% (4). As the risk of T2DM complicated with
cancer has varied in recent years, it is necessary to
systematically examine their relationship to discover potential
biomarkers to detect cancer early and help understand
pathogenesis.
Both T2DM and cancer are multifactorial diseases
caused by the interaction of genes and the environment. On the one
hand, the risk of these diseases is strongly influenced by genetic
factors (5–7). Over the past 10 years, genome-wide
association studies have found important applications in the
genetics of complex diseases (8).
Both share similar underlying pathophysiological pathways,
including hyperinsulinemia, hyperglycemia, or chronic inflammation
(9). Therefore, genes and their
molecular mechanisms deserve attention. On the other hand, there is
large heterogeneity in the clinical phenotypes of these diseases,
mainly caused by environmental factors such as lifestyle.
Epigenetic modifications, particularly DNA methylation
modifications (10), are necessary
mechanisms to connect the internal genetic genome with the external
environment and influence pathogenesis (11).
The regulation of gene expression by DNA methylation
has also been extensively studied in T2DM and cancer. DNA
methylation may be involved in the development of obesity and
insulin resistance in T2DM by regulating the expression of
glycolysis and adipogenesis genes (12). Concurrently, the hypermethylation
of CpG islands in the promoter region of tumor suppressor genes and
the hypomethylation of oncogenes are involved in the occurrence and
development of cancer by affecting different stages of cell growth
and development (13). DNA
methylation, which is associated with both T2DM and cancer, was
chosen as the entry point for the present study.
Finding the cancer types most likely to be
associated with T2DM and their reliable DNA methylation genes as
biomarkers can help predict disease risk in advance. In the present
study, high-throughput omics data of DNA methylation and gene
expression in T2DM and 13 cancers were first systematically
integrated and analyzed, and then genes with differences in DNA
methylation levels and mRNA expression levels were screened.
Second, a weighted association network was constructed and analyzed
based on methylation levels to identify the types of cancer and
their key genes most associated with T2DM. Subsequently, tissue
samples from clinical cancer patients were collected to verify the
results.
Materials and methods
Data collection
The RNA-SeqV2 gene expression and DNA methylation
data of human types of cancer were downloaded from The Cancer
Genome Atlas database (TCGA; http://cancergenome.nih.gov/). Cancer with fewer than
10 cases in the case or control group were removed. Prostate cancer
was also removed due to its inverse association with diabetes,
unlike others reported positively associated. After sorting, a
total of 13 types of cancer were included in the present study
including breast cancer (BRCA), CRC, liver cancer (LIHC),
pancreatic cancer (PAAD), bladder cancer (BLCA), esophageal cancer
(ESCA), head and neck cancer (HNSC), renal clear cell carcinoma
(KIRC), renal papillary cell carcinoma (KIRP), lung adenocarcinoma
(LUAD), lung squamous cell carcinoma (LUSC), endometrioid carcinoma
(UCEC) and thyroid cancer (THCA). Human T2DM mRNA expression
datasets (GSE9006, GSE15653, GSE15932, GSE23343, GSE25462, GSE25724
and GSE55650) and DNA methylation datasets (GSE65057, GSE34008,
GSE21232 and GSE38291) were downloaded from the Gene Expression
Omnibus database (GEO; https://www.ncbi.nlm.nih.gov/geo/). A summary of the
data obtained in the TCGA database is revealed in Table I, and a summary of the data
obtained in the GEO database is presented in Table II. Illumina HiSeq 2000 RNA was
used to measure gene expression profiles, and Illumina Human
Methylation 450 Beadchip (450 K array) (both from Illumina, Inc.)
was used to measure DNA methylation data.
 | Table I.Number of cases for each cancer type
in The Cancer Genome Atlas database. |
Table I.
Number of cases for each cancer type
in The Cancer Genome Atlas database.
|
| Gene expression
dataset | DNA methylation
dataset |
|---|
|
|
|
|
|---|
| Type of
malignancy | Cancer | Normal | Cancer | Normal |
|---|
| Breast cancer | 1104 | 114 | 793 | 96 |
| Colorectal
cancer | 383 | 51 | 398 | 45 |
| Liver cancer | 373 | 50 | 373 | 48 |
| Pancreatic
cancer | 179 | 4 | 185 | 10 |
| Bladder cancer | 407 | 19 | 419 | 21 |
| Esophageal
cancer | 185 | 11 | 184 | 16 |
| Head and neck
cancer | 522 | 44 | 527 | 50 |
| Renal clear cell
carcinoma | 534 | 72 | 324 | 159 |
| Renal papillary cell
carcinoma | 291 | 32 | 276 | 45 |
| Lung
adenocarcinoma | 517 | 59 | 469 | 32 |
| Lung squamous cell
carcinoma | 502 | 51 | 370 | 42 |
| Endometrioid
carcinoma | 177 | 24 | 425 | 45 |
| Thyroid cancer | 513 | 59 | 501 | 56 |
| Table II.Data summary of mRNA and DNA
methylation of T2DM in GEO database. |
Table II.
Data summary of mRNA and DNA
methylation of T2DM in GEO database.
| Accession/ID | Platform | Tissue | T2DM | Normal | Gene/DNA
methylation |
|---|
| GSE25724 | GPL96 | Pancreatic islet | 6 | 7 | Gene |
| GSE9006 | GPL96, GPL97 | Blood | 24 | 48 | Gene |
| GSE15932 | GPL570 | Blood | 8 | 8 | Gene |
| GSE55650 | GPL570 | Skeletal
muscle | 12 | 11 | Gene |
| GSE25462 | GPL570 | Skeletal
muscle | 10 | 40 | Gene |
| GSE23343 | GPL570 | Liver | 10 | 7 | Gene |
| GSE15653 | GPL96 | Liver | 9 | 9 | Gene |
| GSE65057 | GPL13534 | Liver | 9 | 15 | DNA
methylation |
| GSE21232 | GPL8490 | Pancreatic
islet | 5 | 11 | DNA
methylation |
| GSE34008 | GPL8490 | Blood | 12 | 12 | DNA
methylation |
| GSE38291 | GPL8490 | Skeletal
muscle | 11 | 11 |
|
Screening of differentially methylated
genes and differentially expressed genes
The levels of mRNA expression and DNA methylation
were compared between the cancer and the normal control group to
screen out cancer-related differentially expressed genes (cDEGs)
and differentially methylated genes (cDMGs). The same approach was
used to screen each dataset for cDEGs and cDMGs associated with
T2DM. When using t-tests, the thresholds for defining DEGs were
false discovery rate (FDR) <0.05 and |log2 fold difference [fold
change (FC)]|>1.5. DMGs are those genes that satisfy the
conditions of FDR<0.05 and |absolute difference|>0.2. Due to
the large number of dDMGs, those in the top 10% of FDR values and
located in the promoter region were selected. For each disease,
results from different datasets were first united, and then DEGs
and DMGs were intersected to obtain differentially methylated
expression overlapping genes (DE-MGs).
Pathway enrichment and functional
annotation of DE-MGs
Kyoto Encyclopedia of Genes and Genomes (KEGG)
pathway enrichment and Gene Ontology (GO) gene function annotations
were performed on DE-MGs using David web tools (https://david.ncifcrf.gov/tools.jsp). Thresholds
were FDR <0.05 and gene count >2.
Construction of gene interaction
network
Spearman's correlation analysis was performed on the
methylation levels of DE-MGs for each type of cancer. Each
methylation data was perturbed 1,000 times and correlation
coefficients were calculated. P<0.01 was considered to indicate
a statistically significant difference and random coefficients with
connectivity less than 0.2 were removed. Thus, significant gene
pairs and their correlation coefficients were received. Then, the
human protein-protein interaction (PPI) network was downloaded from
the Human Protein Reference Database (http://www.hprd.org/). Significant gene pairs were
mapped to a PPI network and correlation coefficients were used as
weights for their edges. The DE-MG and its one-step neighbors were
extracted as a sub-network, and different diseases were marked with
different colors. Topological properties of the sub-networks were
analyzed to identify candidate genes for T2DM-associated types of
cancer.
Clinical sample collection
Samples were collected from 28 patients with CRC
including 14 with T2DM and 14 without T2DM. There were no
significant differences in mean age and sex distribution between
the two groups. Each group included 10 males and 4 females. The
mean age of the two groups was 66±4.45 and 62.5±7.07 years,
respectively. There were no statistically significant differences
in age and sex between the two groups. The clinicopathological
characteristics of the patients are presented in Table III. All patients underwent CRC
resection at the Affiliated Hospital of Harbin Medical University
(Harbin, China) from March 2016 to December 2018 and the diagnosis
was based on the pathology report. The present study was approved
(approval no. KY2016-017) by the Ethics Committee of the Second
Affiliated Hospital of Harbin Medical University (Harbin, China).
Written informed consent was obtained from all patients.
| Table III.Clinicopathological characteristics
of the patients. |
Table III.
Clinicopathological characteristics
of the patients.
| Clinicopathological
characteristics | CRC without
T2DM | CRC with T2DM |
|---|
| Age, years | 66±4.45 | 62.5±7.07 |
| Sex |
|
|
|
Male | 10 | 10 |
|
Female | 4 | 4 |
| Tumor stage |
|
|
| T3 | 12 | 9 |
| T4 | 2 | 5 |
| Lymph node
metastasis |
|
|
| N0 | 10 | 9 |
| N1 | 2 | 4 |
| N2 | 2 | 1 |
| Total | 14 | 14 |
A CRC cancer tissue and a paracancerous tissue were
collected from each patient. A total of 56 tissue samples were
divided into 4 groups: i) adjacent tissues without T2DM (control
group), ii) CRC tissues without T2DM (CRC group), iii) adjacent
tissues with T2DM (T2DM group) and iv) CRC tissues with T2DM
(combination group).
RNA extraction and related gene
expression detection
Primer3 (http://primer3.ut.ee/) was used to design primers. The
NCBI online primer design tool (primer-blast, http://www.ncbi.nlm.nih.gov/tools/primer-blast) and
NCBI-Basic Local Alignment Search Tool were used for sequence
alignment. Primers were synthesized by Shanghai Bioengineering
Company (http://www.sangon.com). Primer sequences
for mRNA and DNA methylation are revealed in Tables SI and SII, respectively.
All cancer tissues were frozen in liquid nitrogen
immediately after resection and stored at −80°C until analysis.
Total RNA was extracted from tissues with TRIzol®
reagent (Invitrogen; Thermo Fisher Scientific, Inc.) and then
reverse transcribed to generate cDNA using the
PrimeScript® 1st Strand cDNA Synthesis kit according to
the manufacturer's protocol (Takara Bio, Inc.). Reverse
transcription-quantitative polymerase chain reaction (RT-qPCR) was
used to detect the mRNA expression levels. The glyceraldehyde
3-phosphate dehydrogenase (GAPDH) gene was used as an internal
reference to normalize sample-to-sample variations. qPCR was
performed in triplicate using SYBR®Premix Ex Taq™ Master
Mix (Takara Bio, Inc.) and a 7300 real-time PCR system (Thermo
Fisher Scientific, Inc.). The qPCR analysis was performed as
follows: A 10-µl aliquot of the PCR reaction mixture was prepared
for each reaction, which included 5 µl of SYBR Premix Ex Taq II
(2×), 0.2 µl of ROX Reference Dye (50×), 2 µl of each primer (2
µM), 1 µl of the template and 1.8 µl of DNase-free water. The
reaction mixture was incubated in the wells of a 96-well plate at
95°C for 1 min, followed by 40 cycles at 95°C for 5 sec and 60°C
for 30 sec. Dissociation curve analysis of the PCR products was
performed at the final stage of 60°C to 95°C. All reactions were
performed in triplicate. The relative expression levels of the
candidate genes were normalized to that of GAPDH and fold changes
among the samples were calculated using the 2−ΔΔCq
method (14).
Detection of methylation levels
Primer3 (http://primer3.ut.ee/) was used to design primers.
Further processing was conducted using the software (copyright
number SW110703) of Shanghai Tianhao Biology (http://www.geneskybiotech.com). Sample processing
was performed using the EZ DNA Methylation Gold kit (Zymo Research
Corp.) to convert unmethylated cytosine to uracil in genomic DNA.
The optimized multiplex PCR primer panel to was used to perform
multiplex PCR amplification using the transformed sample genome as
a template. After quality control, the amplification products of
all multiplex PCR primer sets were pooled using the same sample
genomic DNA as template, and it was ensured that the amount of
primer amplification product at each site was equal. Specific index
sequences compatible with the Illumina platform were introduced
into the library ends by PCR amplification using primers with index
sequences. The reaction uses an 11-cycle PCR program to minimize
PCR tendency. Exponential PCR amplification products from all
samples were equally mixed and tapped to obtain the final methyl
target sequencing library. The fragment length distribution of this
library was verified by an Agilent 2100 Bioanalyzer (Agilent
Technologies, Inc.). After accurate quantification of library
molarity, the library was finally sequenced in 2×150 bp paired-end
sequencing mode on the Illumina Hiseq (Illumina, Inc.) platform to
obtain FastQ data.
Statistical analysis
The unpaired t-test was used for comparison between
two groups. One-way ANOVA followed by Tukey's post-hoc test was
used for comparison between multiple groups. Correlation analysis
was performed using Spearman's correlation analysis. All
statistical analyses were performed using SPSS v. 21.0 (IBM Corp.).
P<0.05 was considered to indicate a statistically significant
difference.
Results
Acquisition and functional annotation
of DE-MGs
Based on the data in the GEO database, there were a
total of 293 DE-MGs associated with T2DM. There are 3307
cancer-related DE-MGs in the TCGA database, including 794 in BLCA,
599 in BRCA, 975 in CRC, 479 in ESCA, 604 in HNSC, 302 in KIRC, 303
in KIRP, and 586 in LIHC. There were 364 in LUAD, 902 in LUSC, 63
in PAAD, 74 in THCA, and 1023 in UCEC.
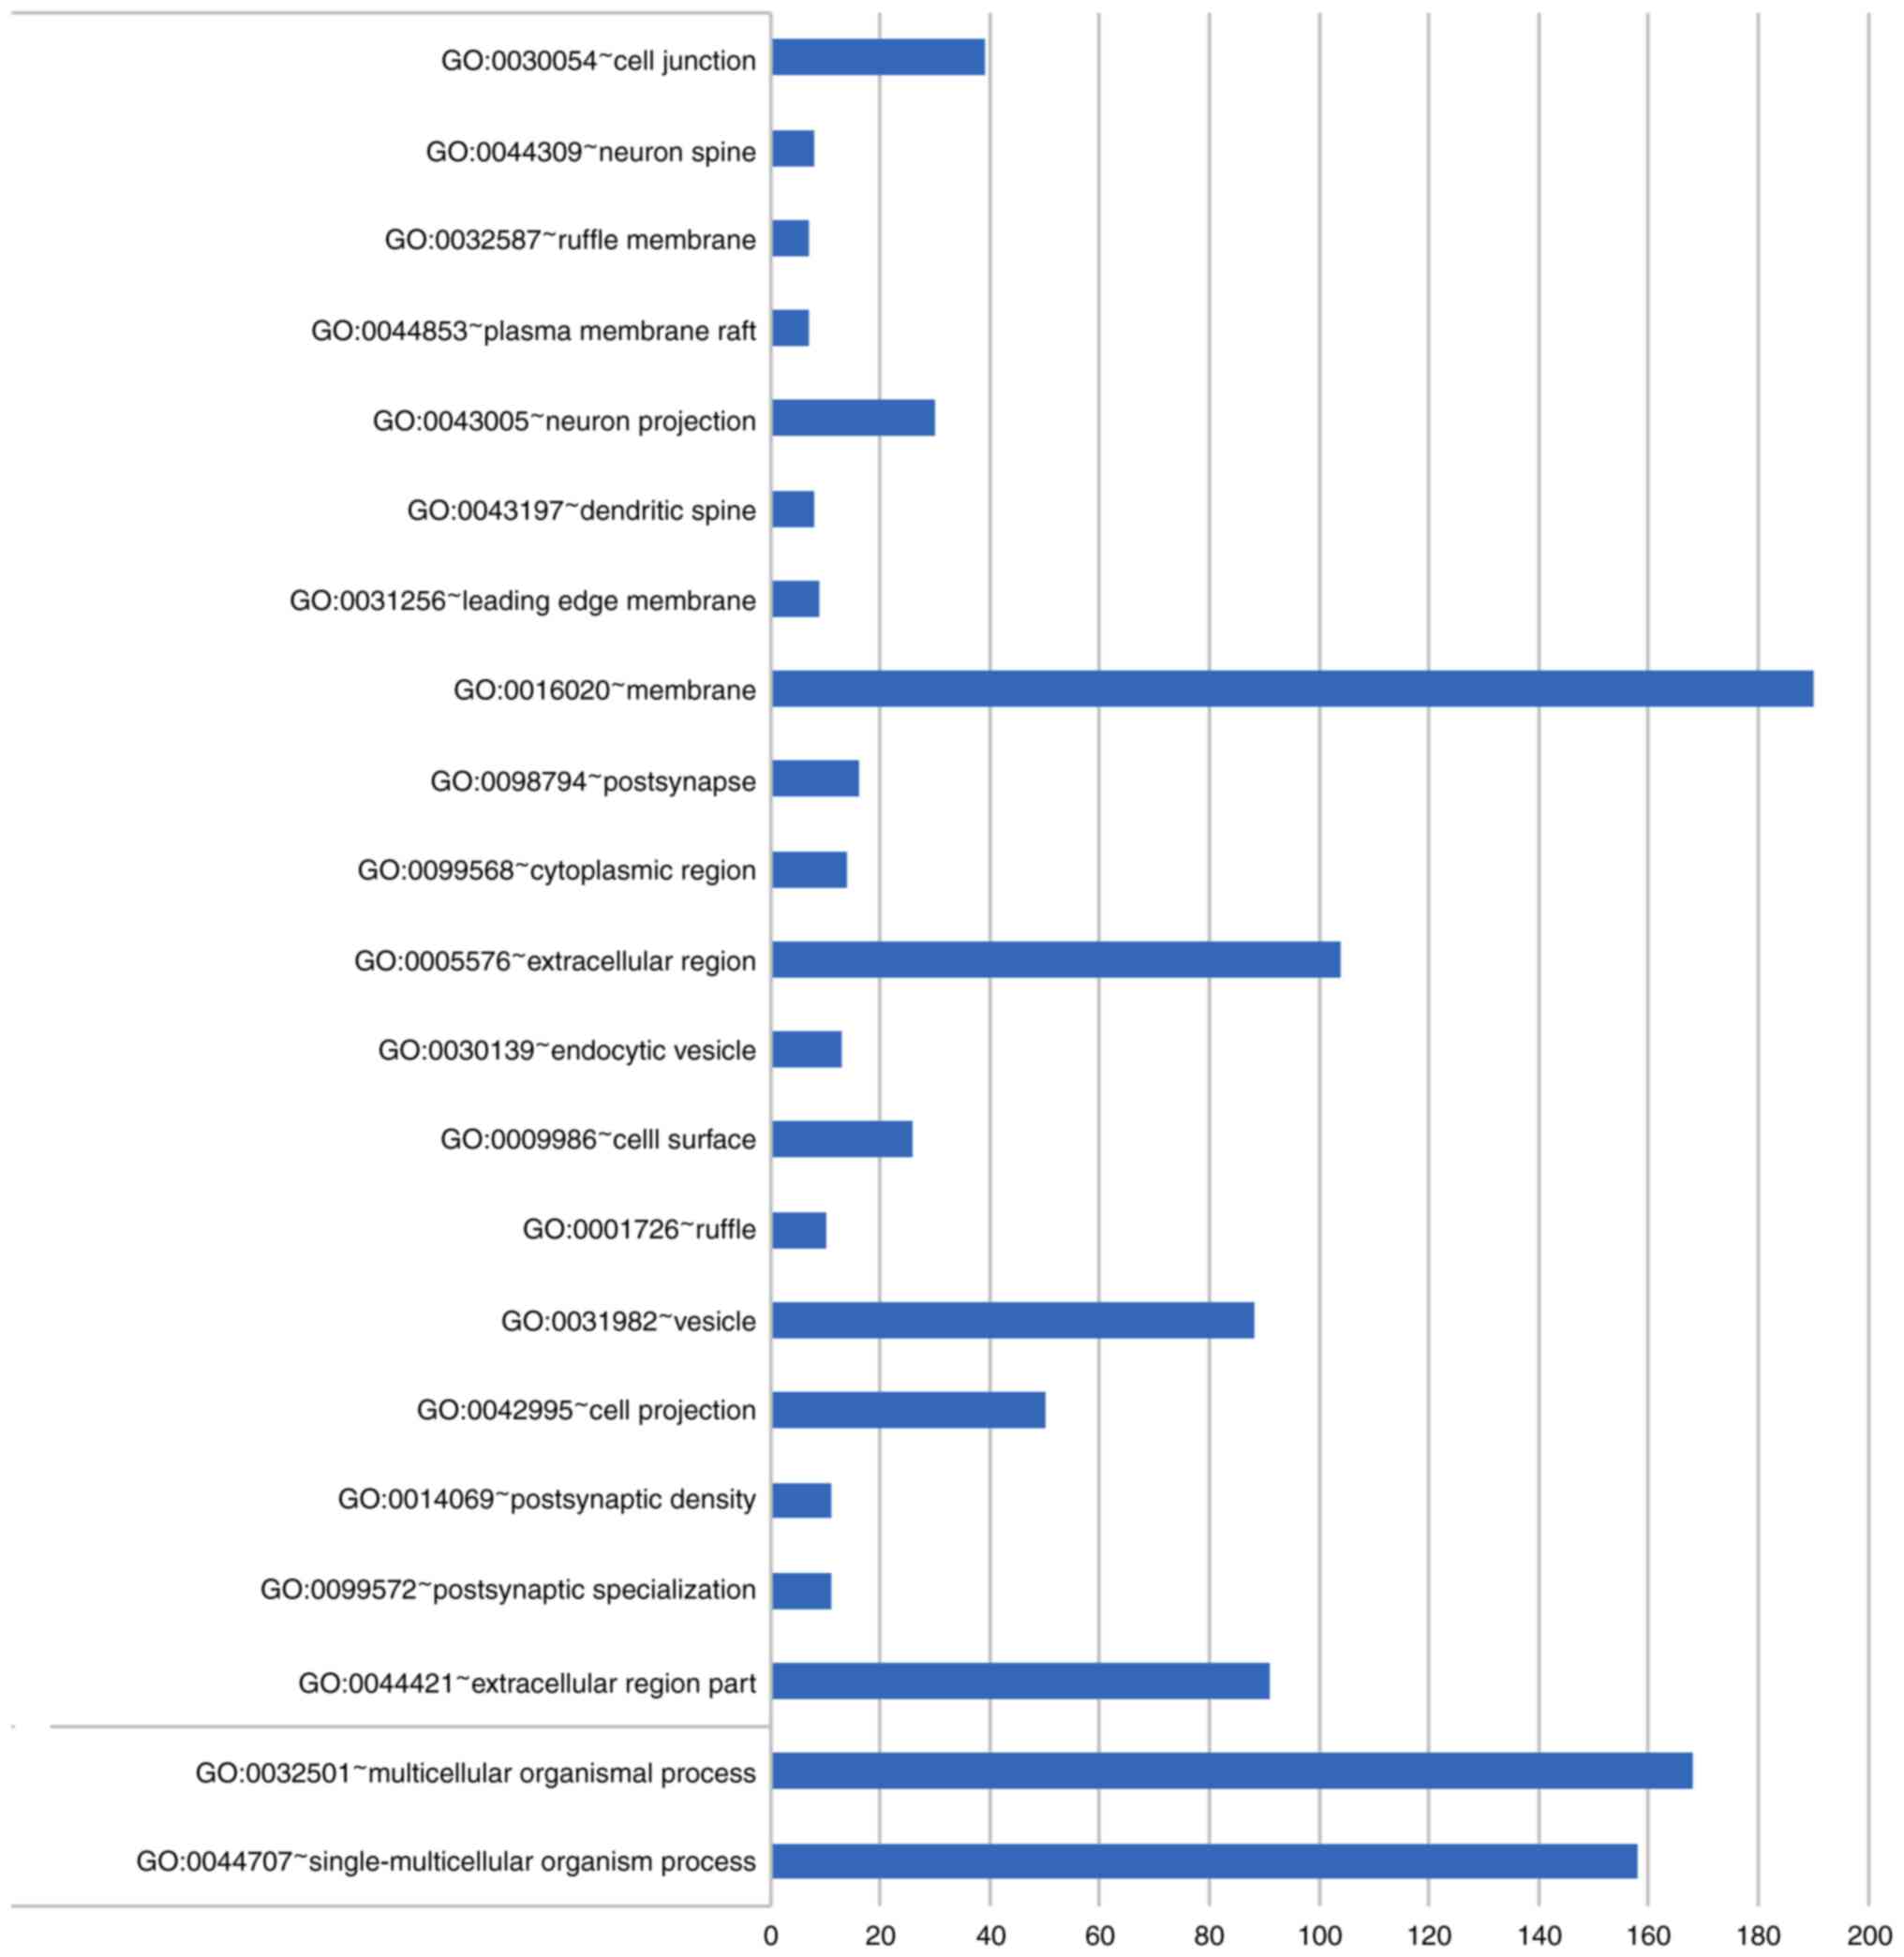
DE-MGs for each disease annotated GO gene function
and enriched the KEGG pathway separately. For example, DE-MGs of
T2DM annotated 20 important GO gene functions (Fig. 1), including c-AMP metabolism and
regulation of adenylate cyclase activity, but no important KEGG
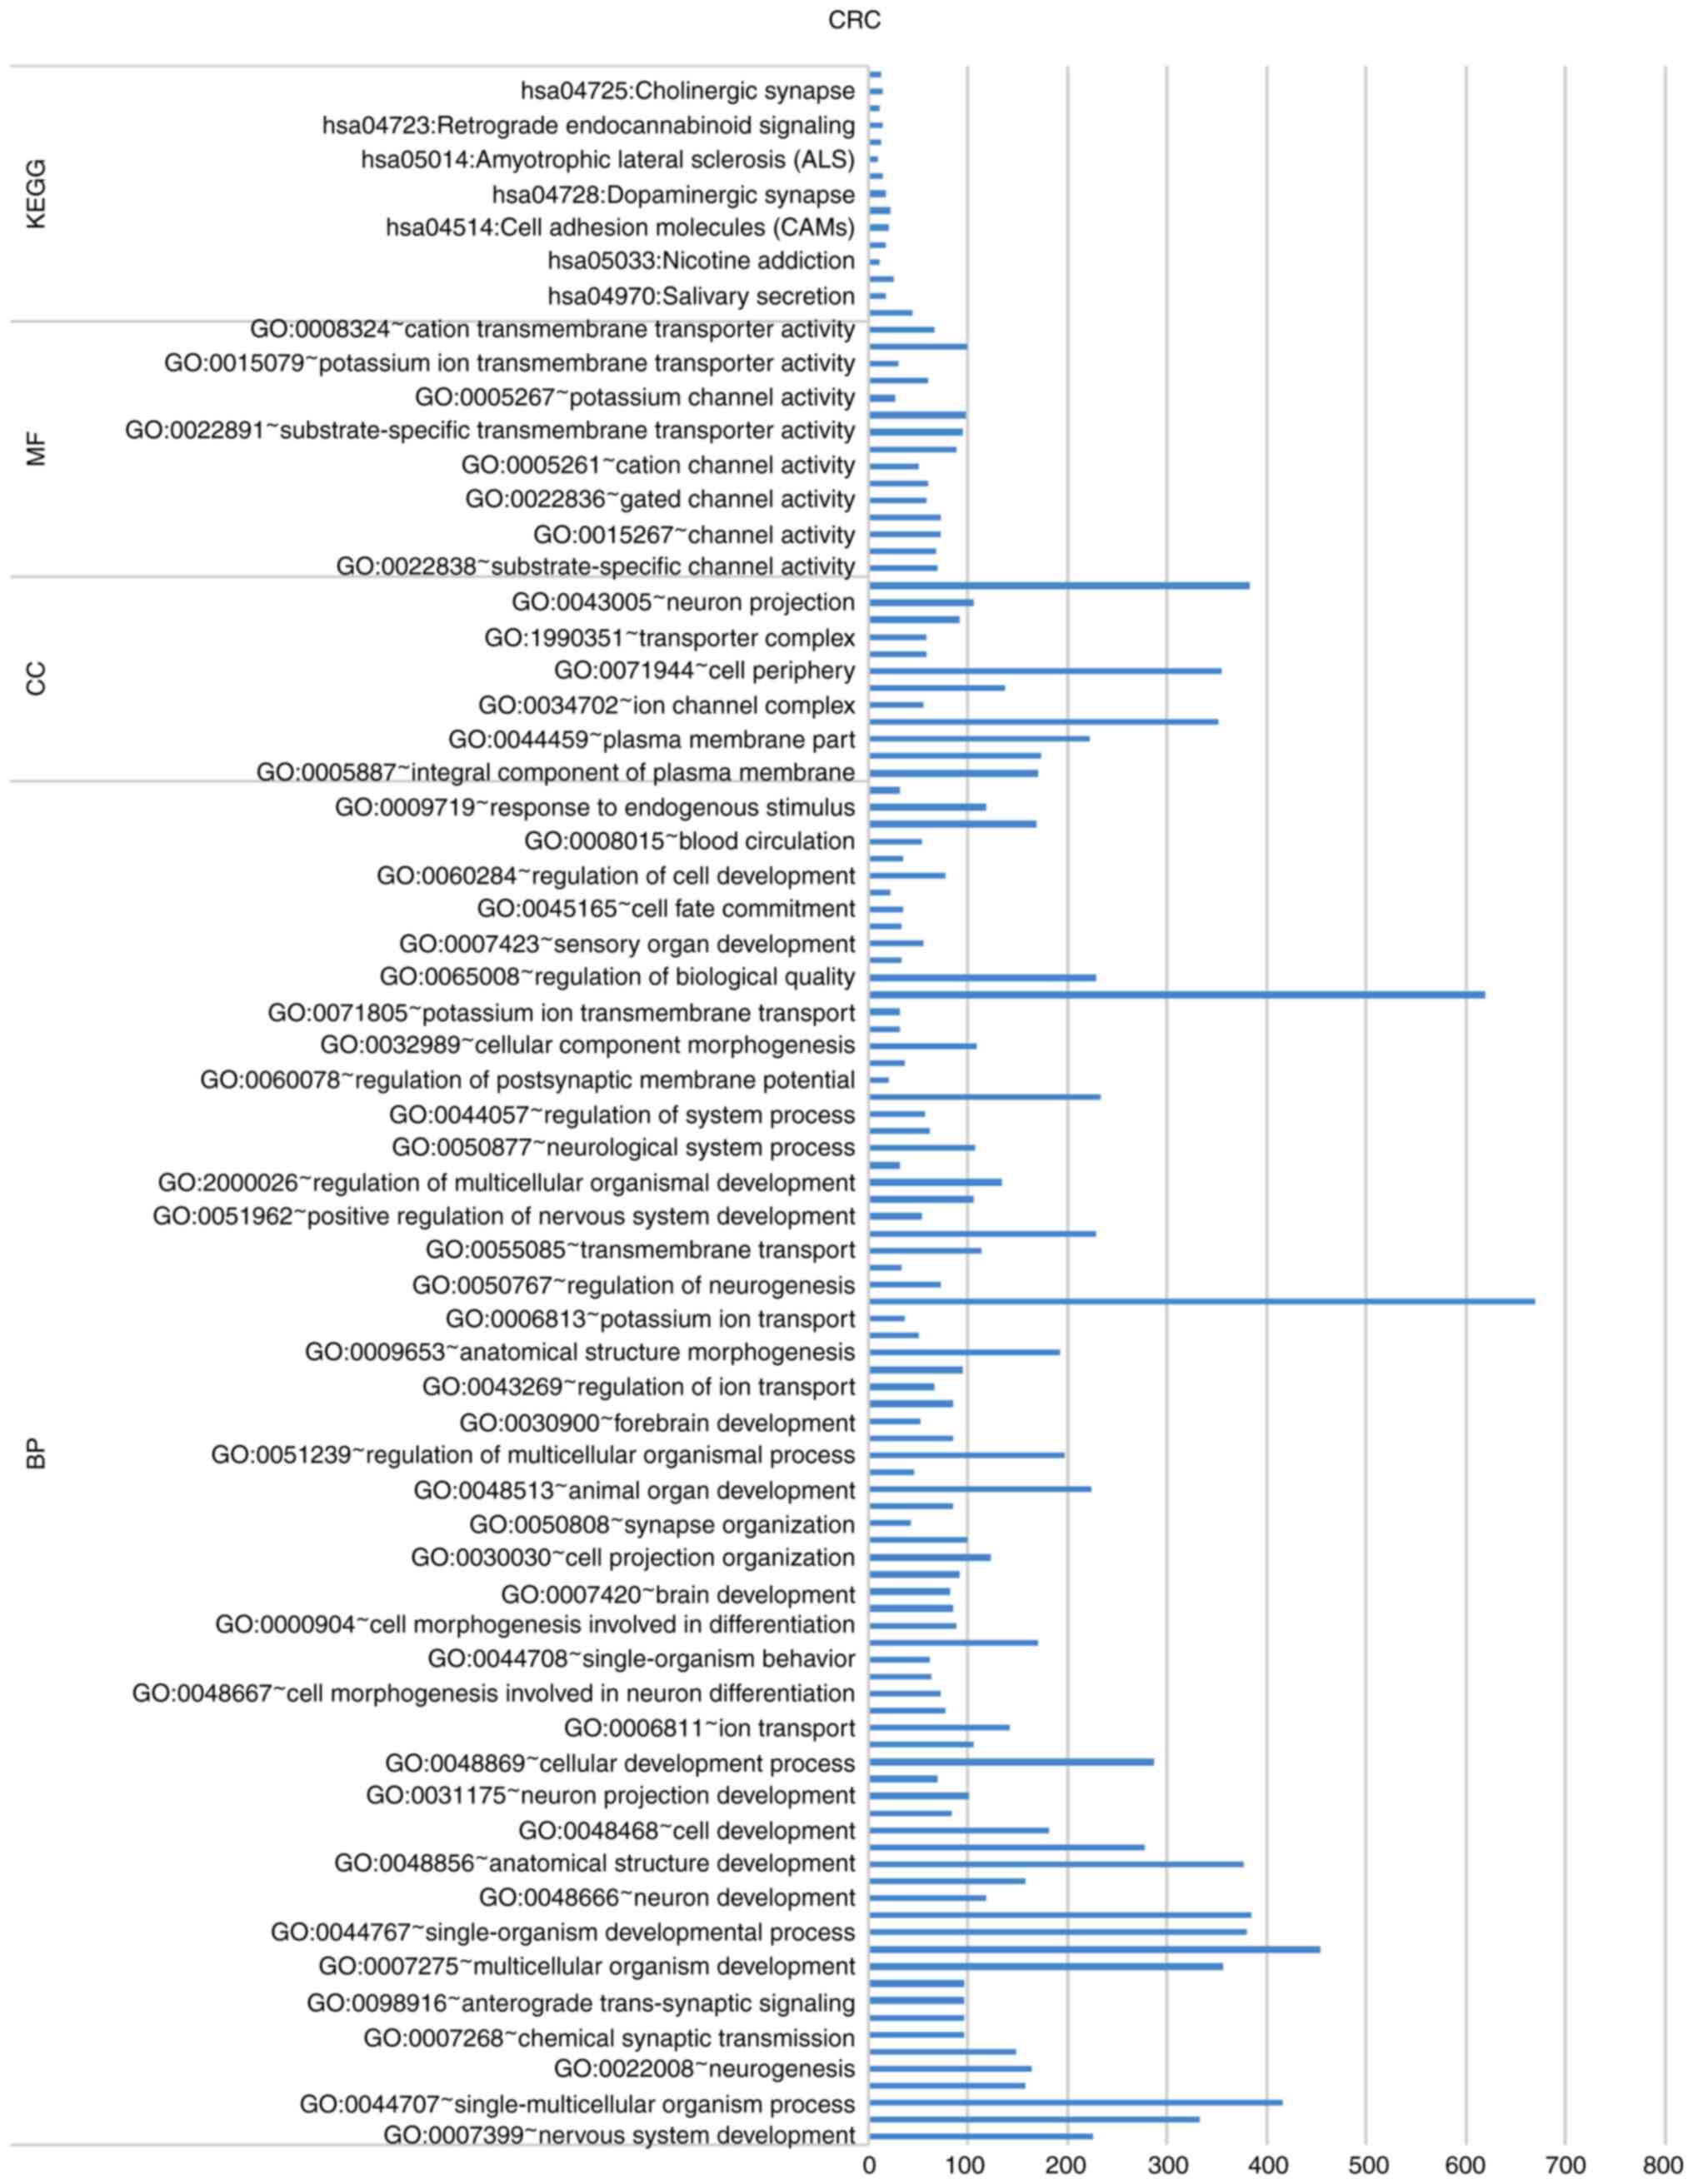
pathway. DE-MGs of CRC were annotated to 412 important GO gene
functions and 11 important KEGG pathways. The top 20% of GO
functions and all KEGG pathways are revealed in Fig. 2. The complete results are revealed
in Fig. S1,Fig. S2,Fig. S3,Fig. S4.
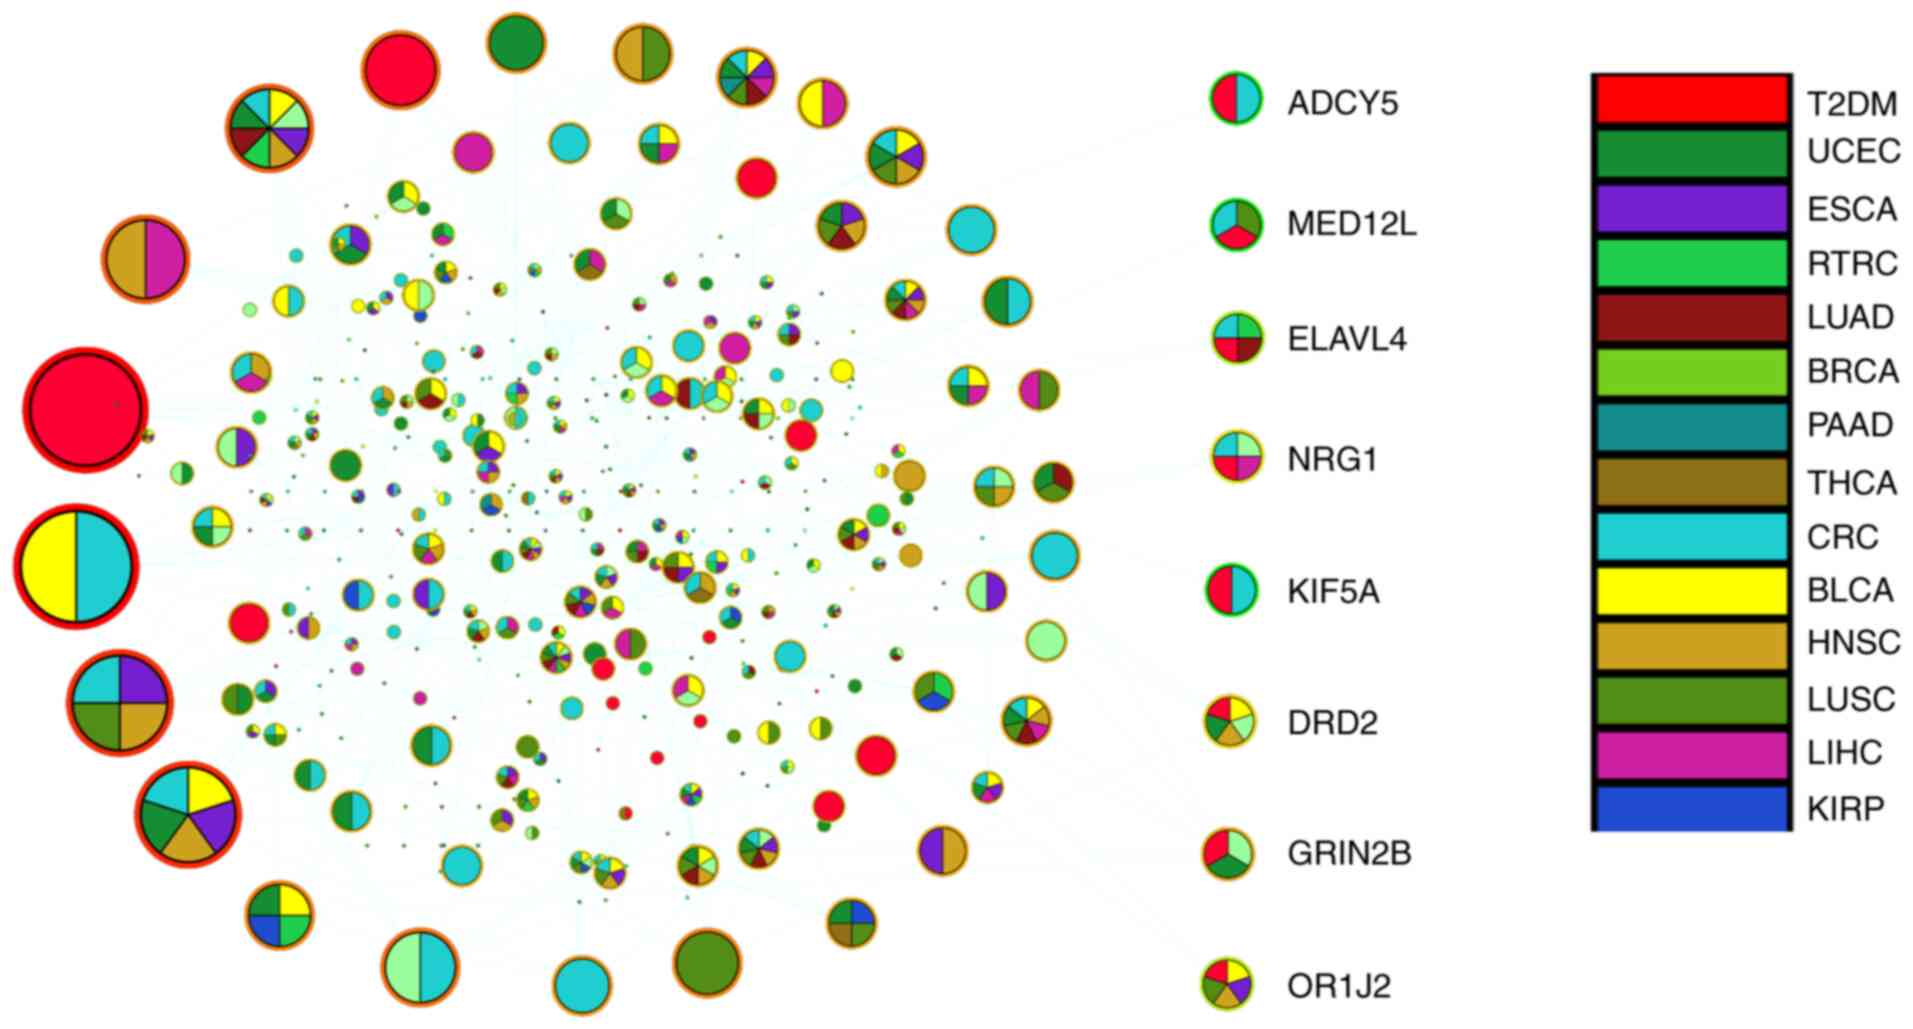
Establishment and analysis of gene
interaction network
As background, the PPI network consists of 13,368
proteins and 80,977 pairs of interactions. Spearman's correlation
analysis was performed pairwise according to the methylation level
of DE-MGs in each disease, and significant gene pairs (P<0.01)
were mapped to PPI. Then, the DE-MGs and their one-step neighbors
were extracted to obtain a sub-network (Fig. 3), including 373 nodes and 416
edges. The topological properties of the sub-network were analyzed,
and the size of the nodes represents the connection value.
Different colors are used to mark different diseases, such as T2DM
in red.
In the sub-network, a node with multiple colors
means that it participates in the process of multiple diseases. In
Fig. 3, there are 8 comorbid genes
of T2DM with types of cancer. Of these, 5 were associated with CRC,
which was the highest frequency among all 8 comorbid genes.
Therefore, at the DNA methylation level, T2DM was more closely
related to CRC than the other 12 types of cancer. Adenylate cyclase
5 (ADCY5), neuregulin 1 (NRG1), mediator complex subunit 12L
(MED12L), drive protein family member 5A (kinesin family member 5A,
KIF5A) and ELAV-like RNA-binding protein 4 (ELAVL4) genes were
further examined.
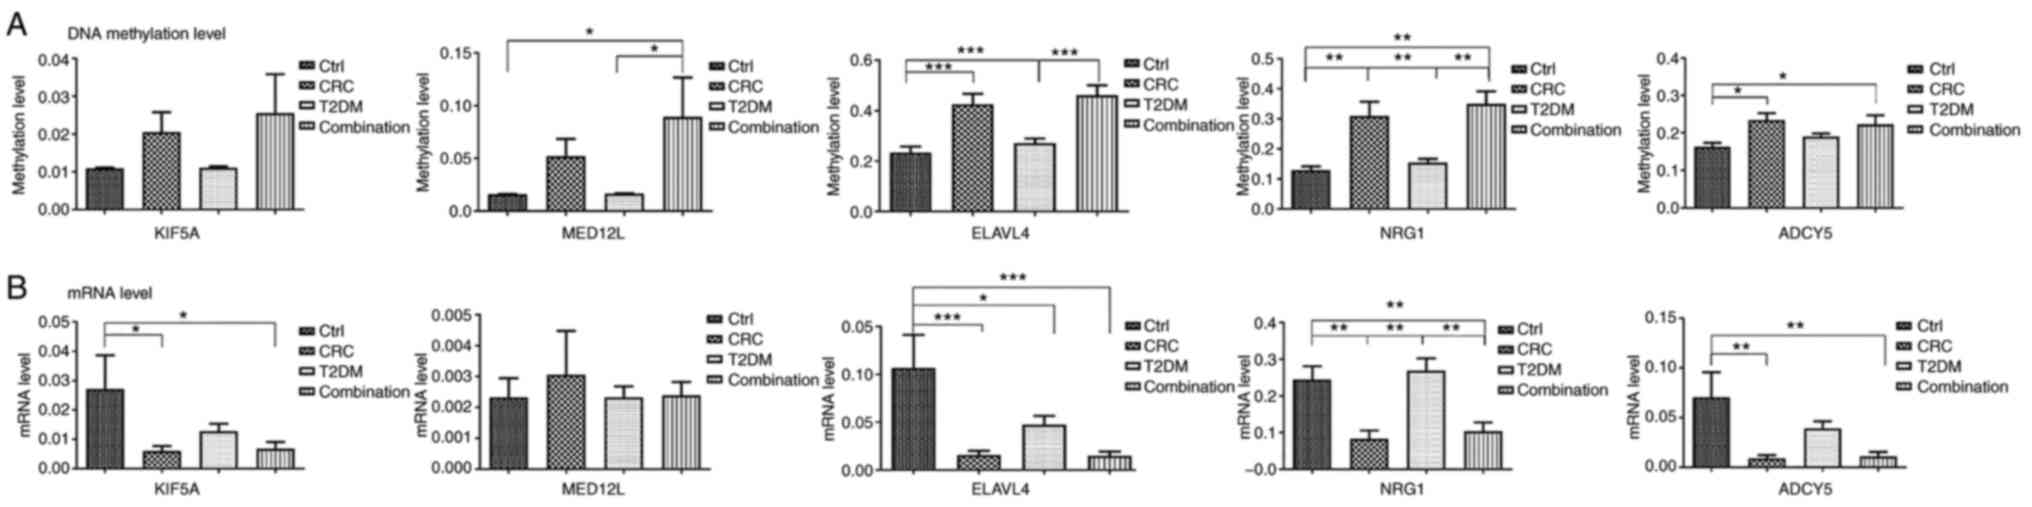
Clinical validation results
Compared with the control group, the methylation
levels of candidate genes in the disease groups (CRC group, T2DM
group, combined group) were increased. Compared with non-cancer
group (control group, T2DM group), the methylation level of
candidate genes in the cancer group (CRC group, combination group)
was higher. At the same time, the mRNA expression levels were
completely opposite (Fig. 4).
First, compared with the control group, ADCY5, NRG1
and ELAVL4 were significantly upregulated in the combination group,
and their mRNA levels were significantly downregulated. However,
MED12L only differed at the methylation level, and KIF5A only
differed at the mRNA level. Furthermore, ADCY5 exhibited no
significant difference between the combination group and the T2DM
group and between the combination group and the CRC group regarding
both methylation or mRNA level. However, the methylation and mRNA
levels of NRG1 were different between the combination group and the
T2DM group, and the methylation levels of ELAVL4 were different
between the two aforementioned groups (Fig. 4). In addition, analysis of the
correlation between ADCY5 and methylation levels in the
combination, the T2DM group and the CRC group was also conducted.
The correlation coefficient between the combination and the T2DM
group was r=0.732. The correlation coefficient between the
combination and the CRC group was r=0.688. The former is greater
than the latter. The scatter plot for these correlation analyses is
revealed in Fig. S5.
The data generated in the present study are also
presented in Table SIII.
Discussion
DNA methylation is specific, particularly in gene
promoter regions, and can be used as cancer marker (15). In the present study, DNA
methylation and mRNA expression data were retrieved from databases
for T2DM and 13 types of cancer and bioinformatics analysis was
used to identify key genes associated with differential gene
expression and differential methylation. Gene interaction weighted
networks were constructed and analyzed using the correlations of
methylation levels of these genes, to understand the interactions
between genes in an improved way. Ultimately, 8 genes were
identified as co-morbid genes for T2DM and cancer.
Since the information of different diseases is
integrated in our network, the types of cancer involved in comorbid
genes and their frequencies, as well as the connectivity values of
gene nodes, all reflect the close relationship between T2DM and
cancer. The results showed that among these 8 genes, the frequency
of CRC was the highest (5/8). Therefore, it is considered that T2DM
is more likely to be comorbid with CRC than the other 12 types of
cancer, at least in terms of DNA methylation signatures.
Then, these 5 genes were examined. There were
significant differences in the methylation and mRNA levels of
ADCY5, NRG1 and ELAVL4 between the combination and the control
group, suggesting that they may be pathogenic methylated genes in
T2DM with CRC. Furthermore, only ADCY5 showed no difference between
the combination and the T2DM group or the CRC group, indicating
that its methylation status and mRNA expression pattern in the
combination group were similar to both T2DM and CRC. Therefore,
ADCY5 may be a comorbid gene in T2DM with CRC. Finally, the ADCY5
of the combined group was found to have a greater correlation
coefficient with the T2DM group than the CRC group, indicating that
changes of DNA methylation level of ADCY5 in T2DM with CRC were
more likely related to T2DM.
ADCY5 is a member of the membrane-bound adenylate
cyclase family. ADCY5 can affect glucose metabolism through
glucose-coupled insulin secretion in human islets (16). Studies have shown that the levels
of ADCY5 mRNA (17), methylation
(12) and single nucleotide
polymorphism (16) are closely
related to T2DM, and the differences between different ethnic
groups are consistent (16).
Furthermore, ADCY3 of the same family is at present a promising
target for anti-obesity therapeutics. Although it was reported that
intervention with ADCY5 in rodents does not improve insulin
sensitivity (18), evidence is
still lacking in primates, particularly in humans.
In addition, ADCY5 has been reported in numerous
types of tumors, such as glioma (19), prostate cancer (20) and lung cancer (21), and is involved in
neovascularization and inflammatory infiltration (22). However, there are few reports on
CRC, and the present findings suggested a new direction.
Most previous studies have investigated the
relationship between T2DM and one type of cancer, lacking a
systematic and holistic view. In addition, studies involving
numerous types of cancer are often limited to a certain molecular
level, thus the molecular mechanism cannot be well reflected. The
present study integrated data regarding T2DM and 13 types of cancer
in public databases; it was found that T2DM was more closely
related to CRC than other types of cancer from the perspective of
methylation signatures and their regulation of mRNA expression.
This finding provided new ideas for exploring the possible
mechanisms of T2DM and CRC.
The present study has certain limitations. The
bioinformatics analysis included reported data from different
populations, and the validated samples were all from China, which
may have biased the results. In addition, since normal human tissue
samples could not be obtained, the present study only used
paracancerous tissue as a control. In future studies, the sources
and types of samples will be enriched in order to obtain more
credible conclusions.
In conclusion, from the perspective of methylation
characteristics, T2DM is most likely to be associated with CRC
among 13 common types of cancer. When high DNA methylation level of
ADCY5 was detected, patients with T2DM were more likely to develop
CRC, and the possible mechanism was that methylation was involved
in regulating mRNA expression.
Supplementary Material
Supporting Data
Supporting Data
Supporting Data
Acknowledgements
Not applicable.
Funding
The present study was supported by the National Natural Science
Foundation of China (grant nos. 82073491 and 81872560).
Availability of data and materials
The datasets generated and/or analyzed during the
current study are available in the NCBI repository (https://www.ncbi.nlm.nih.gov/sra/?term=PRJNA822645).
Authors' contributions
JW and YW completed the downloading and sorting of
data together, constructed the network and analyzed statistics. XZ,
JS and JianL collected clinical samples and performed statistical
analyses based on the information of the clinical characteristics
of the contributors of these samples. JinL and XY detected sample
expression level. HQ participated in the determination of the
research direction and the design of the project, and put forward
constructive opinions in the analysis of the results. JW and YW
confirm the authenticity of all the raw data. All authors read and
approved the final manuscript.
Ethics approval and consent to
participate
The present study was approved (approval no.
KY2016-017) by the Ethics Committee of the Second hospital of
Harbin Medical University (Harbin, China). Written informed consent
was obtained from all patients.
Patient consent for publication
Not applicable.
Competing interests
The authors declare that they have no competing
interests.
References
|
1
|
García-Jiménez C, García-Martínez JM,
Chocarro-Calvo A and De la Vieja A: A new link between diabetes and
cancer: Enhanced WNT/β-catenin signaling by high glucose. J Mol
Endocrinol. 52:R51–R66. 2013. View Article : Google Scholar
|
|
2
|
American Diabetes Association, . Standards
of medical care in diabetes-2013. Diabetes Care. 36 Suppl:1 (Suppl
1):S11–S66. 2013.
|
|
3
|
Giovannucci E, Harlan DM, Archer MC,
Bergenstal RM, Gapstur SM, Habel LA, Pollak M, Regensteiner JG and
Yee D: Diabetes and cancer: A consensus report. Diabetes Care.
33:1674–1685. 2010. View Article : Google Scholar : PubMed/NCBI
|
|
4
|
Yang YX, Hennessy S and Lewis JD: Type 2
diabetes mellitus and the risk of colorectal cancer. Clin
Gastroenterol Hepatol. 3:587–594. 2005. View Article : Google Scholar
|
|
5
|
Langenberg C and Lotta LA: Genomic
insights into the causes of type 2 diabetes. Lancet. 391:2463–2474.
2018. View Article : Google Scholar
|
|
6
|
Wendt C and Margolin S: Identifying breast
cancer susceptibility genes-a review of the genetic background in
familial breast cancer. Acta Oncol. 58:135–146. 2019. View Article : Google Scholar
|
|
7
|
Holy P, Kloudova A and Soucek P:
Importance of genetic background of oxysterol signaling in cancer.
Biochimie. 153:109–138. 2018. View Article : Google Scholar : PubMed/NCBI
|
|
8
|
Visscher PM, Wray NR, Zhang Q, Sklar P,
McCarthy MI, Brown MA and Yang J: 10 years of GWAS discovery:
Biology, function, and translation. Am J Hum Genet. 101:5–22. 2017.
View Article : Google Scholar
|
|
9
|
Wong CC, Caspi A, Williams B, Craig IW,
Houts R, Ambler A, Moffitt TE and Mill J: A longitudinal study of
epigenetic variation in twins. Epigenetics. 5:516–526. 2010.
View Article : Google Scholar : PubMed/NCBI
|
|
10
|
Issa JP: DNA methylation as a clinical
marker in oncology. J Clin Oncol. 30:2566–2568. 2012. View Article : Google Scholar
|
|
11
|
Lee EK, Kim W, Tominaga K, Martindale JL,
Yang X, Subaran SS, Carlson OD, Mercken EM, Kulkarni RN, Akamatsu
W, et al: RNA-binding protein HuD controls insulin translation. Mol
Cell. 45:826–835. 2012. View Article : Google Scholar
|
|
12
|
Sommese L, Benincasa G, Lanza M, Sorriento
A, Schiano C, Lucchese R, Alfano R, Nicoletti GF and Napoli C:
Novel epigenetic-sensitive clinical challenges both in type 1 and
type 2 diabetes. J Diabetes Complications. 32:1076–1084. 2018.
View Article : Google Scholar : PubMed/NCBI
|
|
13
|
Sohani ZN, Anand SS, Robiou-du-Pont S,
Morrison KM, McDonald SD, Atkinson SA, Teo KK and Meyre D: Risk
Alleles in/near ADCY5, ADRA2A, CDKAL1, CDKN2A/B, GRB10, and TCF7L2
elevate plasma glucose levels at birth and in early childhood:
Results from the FAMILY study. PLoS One. 11:e01521072016.
View Article : Google Scholar : PubMed/NCBI
|
|
14
|
Livak KJ and Schmittgen TD: Analysis of
relative gene expression data using real-time quantitative PCR and
the 2-(−Delta Delta C(T)) method. Methods. 25:402–408. 2001.
View Article : Google Scholar : PubMed/NCBI
|
|
15
|
Xu RH, Wei W, Krawczyk M, Wang W, Luo H,
Flagg K, Yi S, Shi W, Quan Q, Li K, et al: Circulating tumour DNA
methylation markers for diagnosis and prognosis of hepatocellular
carcinoma. Nat Mater. 16:1155–1161. 2017. View Article : Google Scholar : PubMed/NCBI
|
|
16
|
Hodson DJ, Mitchell RK, Marselli L, Pullen
TJ, Brias SG, Semplici F, Everett KL, Cooper DM, Bugliani M,
Marchetti P, et al: ADCY5 couples glucose to insulin secretion in
human islets. Diabetes. 63:3009–3021. 2014. View Article : Google Scholar : PubMed/NCBI
|
|
17
|
Elliott HR, Walia GK, Duggirala A, Groom
A, Reddy SU, Chandak GR, Gupta V, Laakso M, Dekker JM; RISC
Consortium, ; et al: Migration and DNA methylation: A comparison of
methylation patterns in type 2 diabetes susceptibility genes
between Indians and Europeans. J Diabetes Res Clin Metab. 2:62013.
View Article : Google Scholar : PubMed/NCBI
|
|
18
|
Dommel S, Hoffmann A, Berger C, Kern M,
Klöting N, Kannt A and Blüher M: Effects of whole-body Adenylyl
Cyclase 5 (Adcy5) deficiency on systemic insulin sensitivity and
adipose tissue. Int J Mol Sci. 22:43532021. View Article : Google Scholar
|
|
19
|
Pan X, Zeng T, Yuan F, Zhang YH, Chen L,
Zhu L, Wan S, Huang T and Cai YD: Screening of methylation
signature and gene functions associated with the subtypes of
isocitrate dehydrogenase-mutation gliomas. Front Bioeng Biotechnol.
7:3392019. View Article : Google Scholar
|
|
20
|
Rees SD, Hydrie MZ, O'Hare JP, Kumar S,
Shera AS, Basit A, Barnett AH and Kelly MA: Effects of 16 genetic
variants on fasting glucose and type 2 diabetes in South Asians:
ADCY5 and GLIS3 variants may predispose to type 2 diabetes. PLoS
One. 6:e247102011. View Article : Google Scholar : PubMed/NCBI
|
|
21
|
Liang B, Li C and Zhao J: Identification
of key pathways and genes in colorectal cancer using bioinformatics
analysis. Med Oncol. 33:1112016. View Article : Google Scholar
|
|
22
|
Chen H, Cai W, Chu ES, Tang J, Wong CC,
Wong SH, Sun W, Liang Q, Fang J, Sun Z and Yu J: Hepatic
cyclooxygenase-2 overexpression induced spontaneous hepatocellular
carcinoma formation in mice. Oncogene. 36:4415–4426. 2017.
View Article : Google Scholar : PubMed/NCBI
|