Introduction
Glioblastoma is a high-grade malignant tumor in the
human brain (1). Glioblastoma
patients have high recurrence rate and poor prognosis with only
14–18 months of survival after diagnosis (2). Current treatments include surgical
tumor removal and radiotherapy followed by Temozolomide
chemotherapy. These treatments only extend the survival period of
patients. Therefore, new therapeutic targets to control
glioblastoma development are needed. Female patients with
glioblastoma have an improved outcome than males who have a higher
glioblastoma incidence (3). These
sex differences could be associated with estrogens and their
receptors.
Glioblastoma tumor cells express aromatase and the
classic estrogen receptors α and β (ERα and ERβ) and can locally
produce estrogen, which promotes tumor growth (4,5).
Additionally, G-protein coupled estrogen receptor (GPER) is
responsible for the fast or non-genomic effects of estrogens.
Activated GPER initially induces the epidermal growth factor
receptor, triggering the mitogen-activated protein
kinase/extracellular signal-regulated kinase pathway. GPER also
activates the phospholipase C and phosphatidylinositol 3-kinase
pathways (6,7), promoting the transcription of genes
related to cell survival, proliferation and apoptosis (8).
GPER expression has been reported in different types
of cancer including breast, endometrial, lung, prostate, ovary and
oral cancers (9–14). This receptor has been described in
non-small cell lung cancer (NSCLC), and the administration of
17β-estradiol (E2) or GPER-selective agonist G1 promotes the
proliferation and metastasis of these cells. By contrast, the
administration of the GPER-selective antagonist G15 in the NSCLC
murine model reduces the number of tumoral nodules and the tumoral
index (15). However, the
participation of GPER in glioblastoma development has received
little attention so far, and its role in in vitro and in
vivo glioma progression, at present, has not been fully
elucidated.
In the present study, C6 rat glioblastoma cells were
used as a research model. The C6 rat glioma model is one of the
most common experimental models used in neuro-oncology (16,17).
This chemical-induced glioblastoma cell line is widely used for
testing therapeutics since its genetic profile resembles human
glioblastomas, and it offers an accurate representation of
glioblastoma characteristics. Moreover, in vivo C6 ×enograft
models can produce an invasive glioblastoma which allows studying
the growth and the invasion of high-grade gliomas and the
antitumoral potential of new therapeutic molecules (16).
Therefore, the present study aimed to assess the
participation of GPER in the fate of C6 murine glioblastoma cells.
Furthermore, the effect of the exposure to the agonists E2 and G1
or the antagonists G15 on the fate, proliferation, or apoptosis of
C6 glioblastoma cells was also evaluated.
Materials and methods
Reagents
17-β estradiol (E2758) (E2) was purchased from
MilliporeSigma. GPER-selective agonist G1 (CAS no. 881639-98-1) or
antagonist G15 (CAS no. 1161002-05-6) were purchased from Cayman
Chemical Company.
Cell culture and experimental
conditions
The glioblastoma C6 rat cell line was acquired from
the American Type Culture Collection (cat. no. CCL-107). The cells
were maintained in Dulbecco's modified Eagle's medium (DMEM)/F-12,
F12-K supplemented with 10% fetal bovine serum (both from Gibco;
Thermo Fisher Scientific, Inc.) with 1% penicillin/streptomycin
(Sigma-Aldrich; Merck KGaA) at 37°C, in an incubator with 95% air
and 5% CO2. The C6 cells were exposed for 48 h to the
GPER agonists (E2 and G1) or the GPER antagonist G15 alone or in
combination (E2-G1 and G1-G15). G1 and G15 were first diluted in
dimethyl sulfoxide (DMSO) and E2 in 70% ethanol and then diluted in
serum free culture media (vehicle) to reach their final
concentration in each experimental condition. The final
concentrations used were: 10 nM for E2 and G1 and 10 µM for G15
(15). Control cells received no
treatment. All evaluations were performed 48 h post-treatment as
previously described by Liu et al (15,18).
Immunofluorescence staining
C6 cells were cultured on poly-L-lysine coated
coverslips at a density of 50,000 cells/well in 24-well plates and
then exposed to the different aforementioned conditions. After 48 h
of treatment, cells were fixed at room temperature with 4%
paraformaldehyde for 15 min and then blocked at room temperature
with 1% IgG-free albumin and permeabilized with 0.25% Triton X-100
for 1 h. Subsequently, the cells were incubated overnight at 4°C
either with the primary rabbit polyclonal anti-GPER antibody
(1:200; cat. no. ab39742), or the mouse monoclonal anti-Ki67
antibody (1:200; cat. no. ab8191) (both from Abcam), or the mouse
monoclonal anti-caspase-3 antibody (1:200; cat. no. sc-271759;
Santa Cruz Biotechnology, Inc.). On the following day, the cells
were washed with PBS, and incubated for 2 h at room temperature
with the secondary antibodies: Goat polyclonal anti-Rabbit IgG
(H+L) Alexa Fluor 488 antibody (1:1,000; cat. no. A-11008) and a
Goat monoclonal anti-Mouse IgG (H+L) Alexa Fluor 594 antibody
(1:1,000; cat. no. A-11005) (both from Thermo Fisher Scientific,
Inc.). Finally, the cells were washed with PBS and stained at room
temperature for 5 min with Fluoroshield with DAPI to observe their
nuclei (cat. no. F6057; Sigma-Aldrich; Merck KGaA). Fluorescence
images were captured using a fluorescence microscope (Olympus
Corporation). A total of 20 microphotographs at ×40 magnification
were captured from each condition to evaluate immunopositive cells
from at least three different experiments. ImageJ software (version
1.8.0; National Institutes of Health) was used to count positively
stained cells representing ~400 cells manually counted per
condition.
Western blot analysis
Western blot analysis was performed as previously
described (19). Briefly, C6 cells
were seeded at a density of 1.4×10⁶ cells/well in 100-mm
Petri dishes and then exposed 48 h to the different treatments.
Cells were lysed in RIPA lysis buffer supplemented with a protease
inhibitor cocktail (cat. no. sc-24948A; Santa Cruz Biotechnology,
Inc.). Protein concentration was determined using the Bradford
microplate protocol using Coomassie Protein Assay Reagent (cat. no.
1856209; Thermo Fisher Scientific, Inc.) and the Quick Start Bovine
Serum Albumin Standard Set (cat. no. 5000207; Bio-Rad Laboratories,
Inc.). Total protein (50 µg) was separated by SDS-PAGE (12%) and
transferred onto a PVDF membrane (MilliporeSigma). The membrane was
blocked with 5% blotto, non-fat dry milk (cat. no. sc-2325; Santa
Cruz Biotechnology, Inc.) dissolved in TBS-T (0.1% Tween-20) for 1
h at room temperature. The membrane was incubated overnight at 4°C
with primary rabbit polyclonal anti-GPER antibody (1:5,000) or
primary rabbit polyclonal anti-GAPDH antibody (1:5,000; cat. no.
ab9485; Abcam) as a loading control. Following the primary
incubation, the membrane was incubated for 1 h at room temperature
with goat anti-rabbit IgG H&L (HRP-conjugated) secondary
antibody (1:10,000; cat. no. ab205718; Abcam). The proteins were
detected using the Western Sure Premium Chemiluminescent substrate
(cat. no. 926-95000; LI-COR Biosciences). The LI-COR C-DiGit Blot
Scanner was used for chemiluminescent detection (LI-COR
Biosciences). Data were analyzed using the Image Studio Software
3.1.4 (LI-COR Biosciences).
Reverse transcription-quantitative
(RT-q)PCR
RNA extraction was performed with TRIzol®
(400 µl of TRIzol/300,000 cells/well seeded in six-well plates)
according to the manufacturer's protocol (cat. no. 15596026; Thermo
Fisher Scientific, Inc.). The integrity of total RNA was determined
by 1% agarose gel electrophoresis stained with ethidium bromide and
observed under UV light, and the Nanodrop One spectrophotometer
(Thermo Fisher Scientific, Inc.) was used to quantify total RNA.
cDNAs were synthesized from 200 ng of total RNA using oligo-dt12-18
(cat. no. 18418-012) and M-MLV reverse transcriptase (cat. no.
28025-013; both from Invitrogen, Thermo Fisher Scientific, Inc.)
according to the manufacturer's protocol. The resulting cDNAs were
quantified by UV-spectrophotometry and used for qPCR. The following
primers were used: GPER forward, 5′-CTTCTGCCATGCCACGCT-3′, and
reverse, 5′-ACATCTGACTGCTCCGTGCTG-3′ (20); and GAPDH forward,
5′-GCTGGTCATCAACGGGAAAC-3′ and GAPDH reverse,
5′-GACTCCACGACATACTCAGCACC-3′ (21). The primers were synthesized by
Integrated DNA Technologies, Inc. qPCR was performed using Maxima
SYBR-Green/ROX qPCR master mix (cat. no. K0221; Thermo Fisher
Scientific, Inc.). The reaction conditions consisted of an initial
denaturation at 95°C for 10 min and 40 cycles at 95°C for 15 sec
and 60°C for 1 min, followed by a melt curve, using the Step One
Plus Real-Time PCR System (Thermo Fisher Scientific, Inc.).
Relative gene expression analysis was calculated using the
2−ΔΔCq method (22) and
normalized to GAPDH. Graphs show reciprocal 1/ΔCq values to allow a
more intuitive illustration of gene expression (23).
MTT assay
For the MTT assay, 10,000 cells/well were seeded in
96-well plates. MTT assay was carried out 48 h after the different
treatments. First, the cells were washed with a phenol red-free
DMEM medium, then 50 µl of phenol red-free DMEM and 50 µl of MTT
reagent (3-(4,5-Dimethyl-2-thiazolyl)-2,5-diphenyl-2H-tetrazolium
bromide) (cat. no. M6494; Invitrogen, Thermo Fisher Scientific,
Inc.) were added to each well and incubated at 37°C for 3 h. After
incubation, 150 µl of DMSO was added to each well and mixed on an
orbital shaker for 15 min. The absorbance was detected at the
optical density (OD) of 590 nm in the plate reader Multiskan Ascent
(Thermo Fisher Scientific, Inc.).
ELISA
A caspase-3 ELISA kit (cat. no. MBS1602954;
MyBioSource, Inc.) was used according to the manufacturer's
protocol. C6 cells were plated at 300,000 cells/well in six-well
plates, and the treatments were applied as aforementioned. The
cells were detached and diluted in PBS to ~1 million/ml cell
suspension. Repeated freeze-thaw cycles were conducted to lyse the
cells; the cell lysate was centrifuged at 704 × g for 20 min at
4°C, and the supernatants were collected. Absorbance was detected
at an OD of 450 nm in the plate reader Multiskan Ascent (Thermo
Fisher Scientific, Inc.).
Statistical analysis
Results were expressed as the mean ± standard
deviation (SD). Data for multiple variable comparisons were
analyzed by one-way analysis of variance followed by Tukey's post
hoc test to compare significance between groups. The probability
level of P<0.05 was considered to indicate a statistically
significant difference. Pearson's correlation coefficients were
also calculated to highlight possible relationships between GPER
and Ki67 immunopositivity and between GPER and caspase-3
immunopositivity. A total of 3 different experiments with
triplicate samples were completed for each of these conditions.
GraphPad Prism 8.0 software (GraphPad Software, Inc.) was used for
data analysis.
Results
Immunofluorescent staining of
GPER
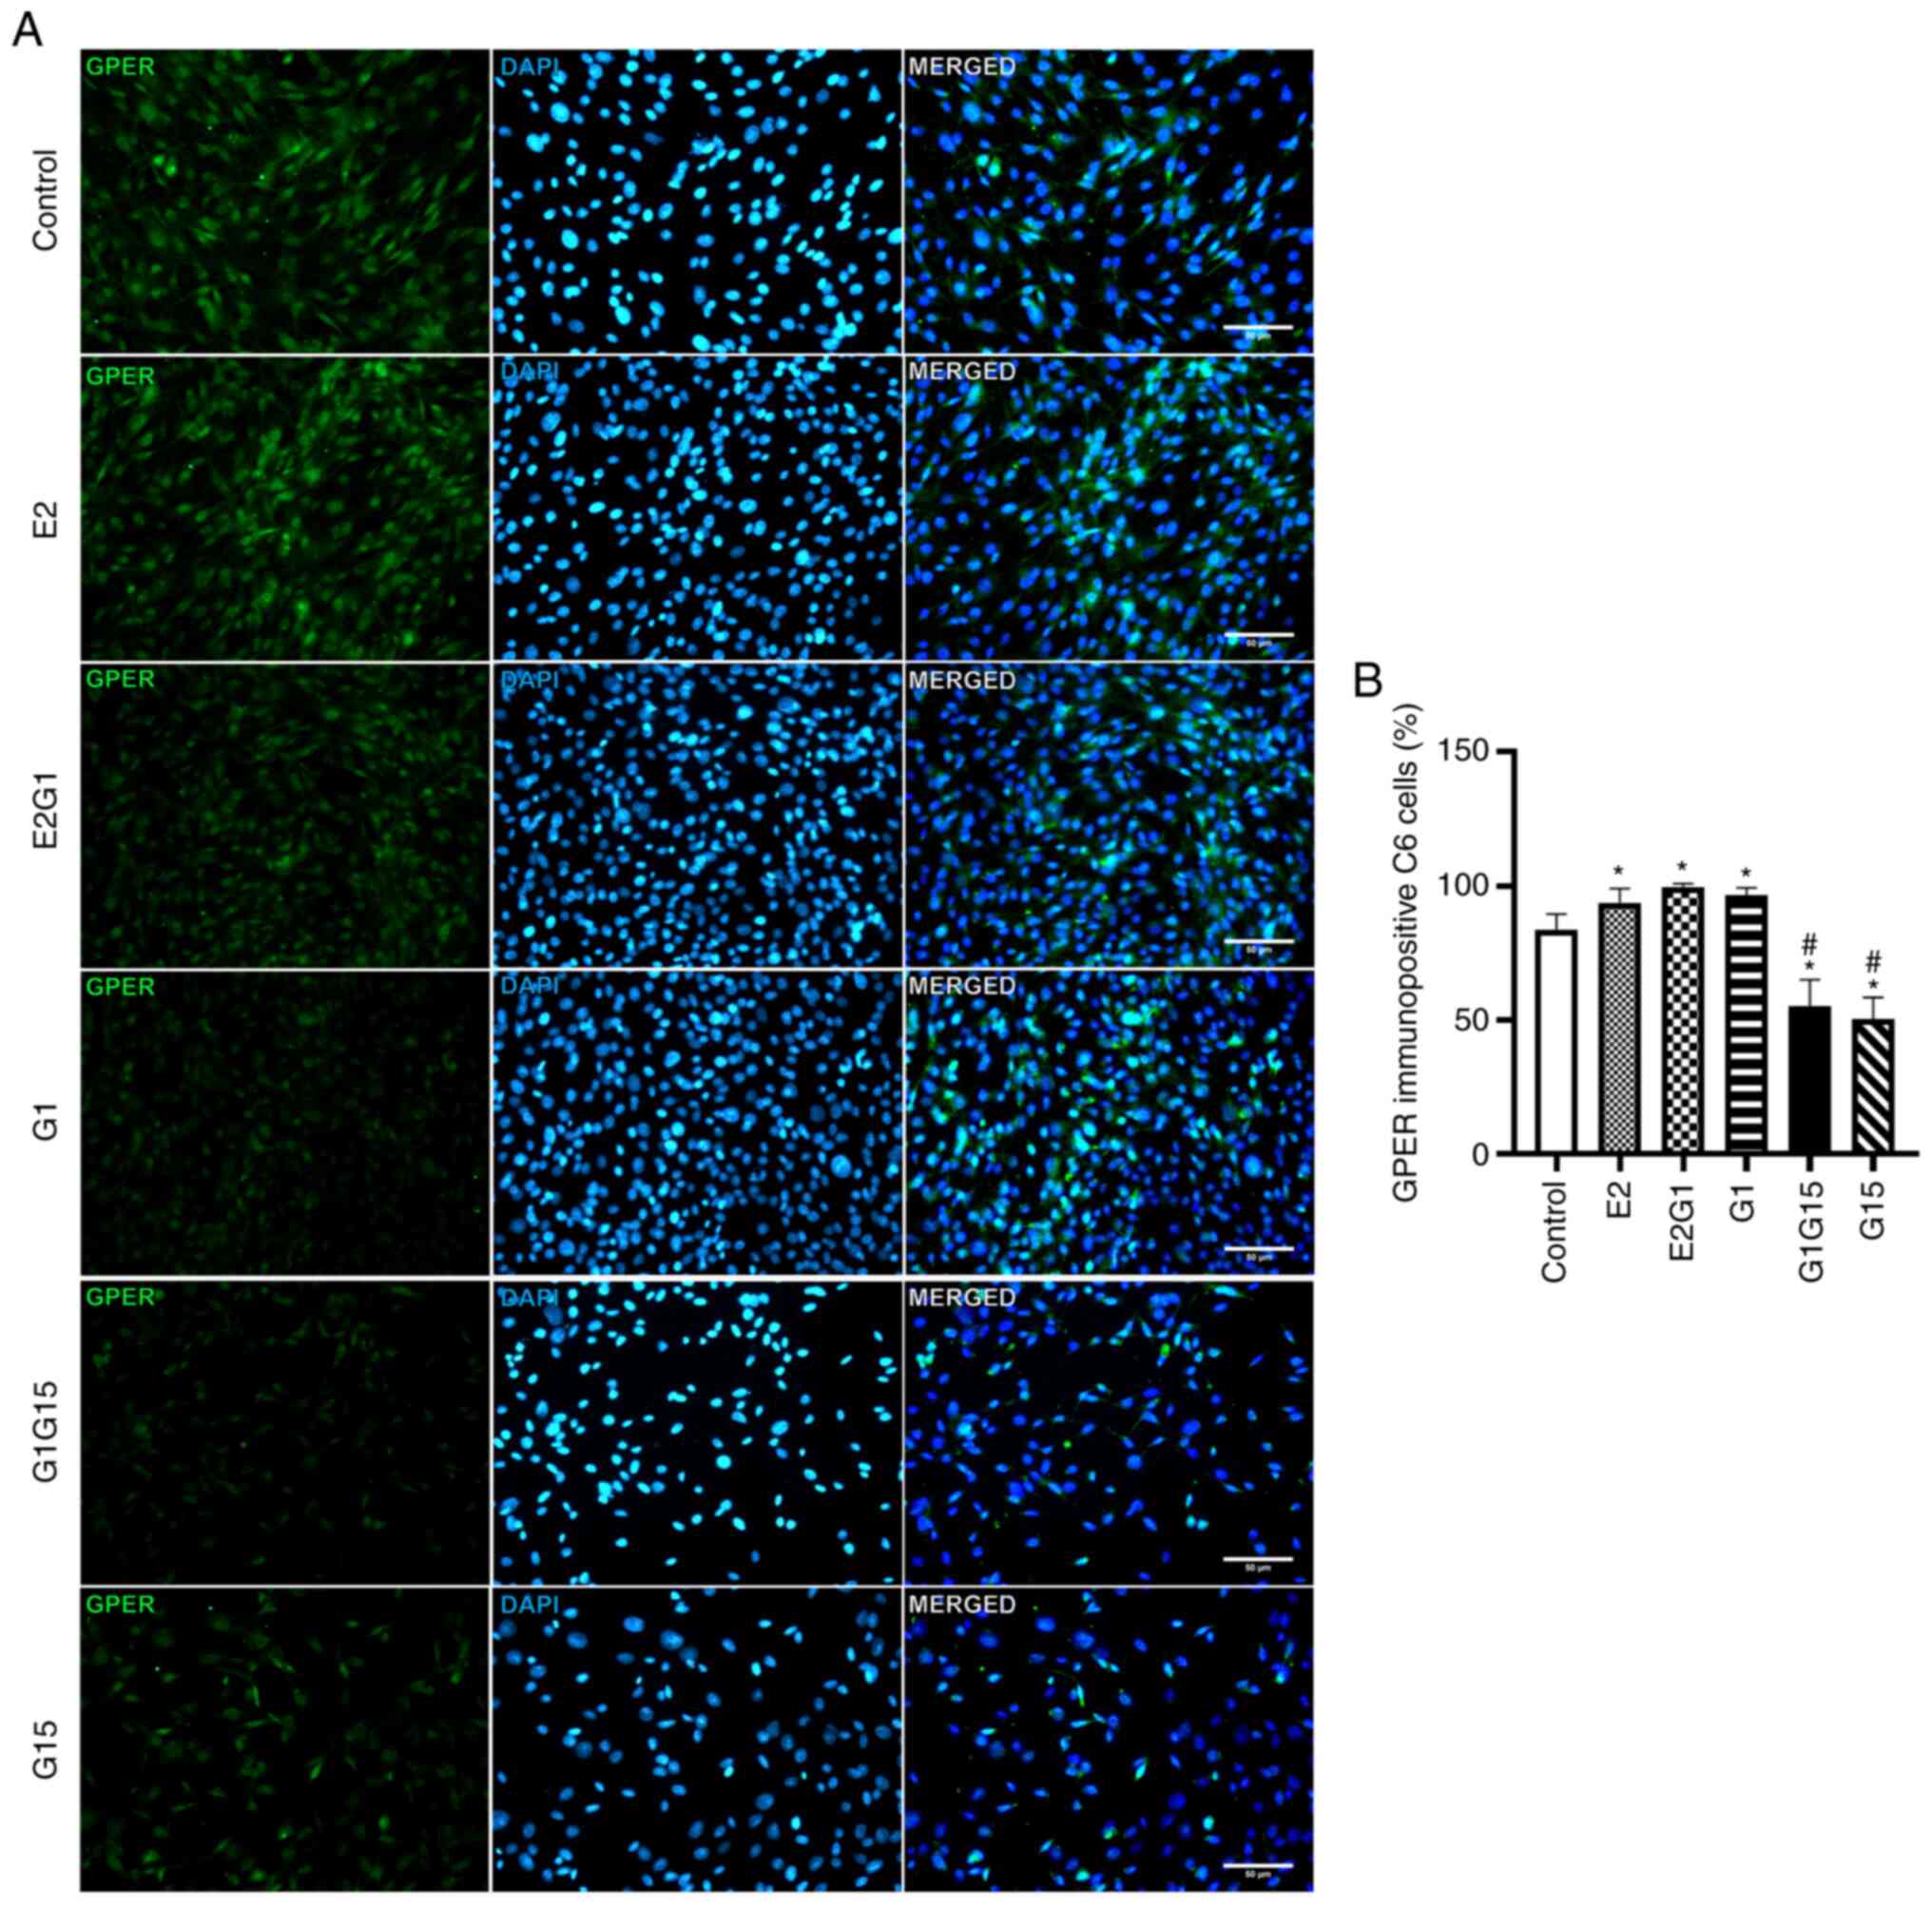
The immunofluorescence analyses demonstrated that C6
murine cells express GPER. Experimental data demonstrated that the
treatment of these cells for 48 h with the agonists E2 or G1 and
their combination (E2 and G1) significantly increased the
percentage of GPER immunopositivity compared with control
[P<0.05; F=237; degrees of freedom (DF)=118]. By contrast,
treatment of C6 cells with the antagonist G15 alone or in
combination with G1 significantly reduced this percentage compared
with control (P<0.05) (Fig. 1A and
B).
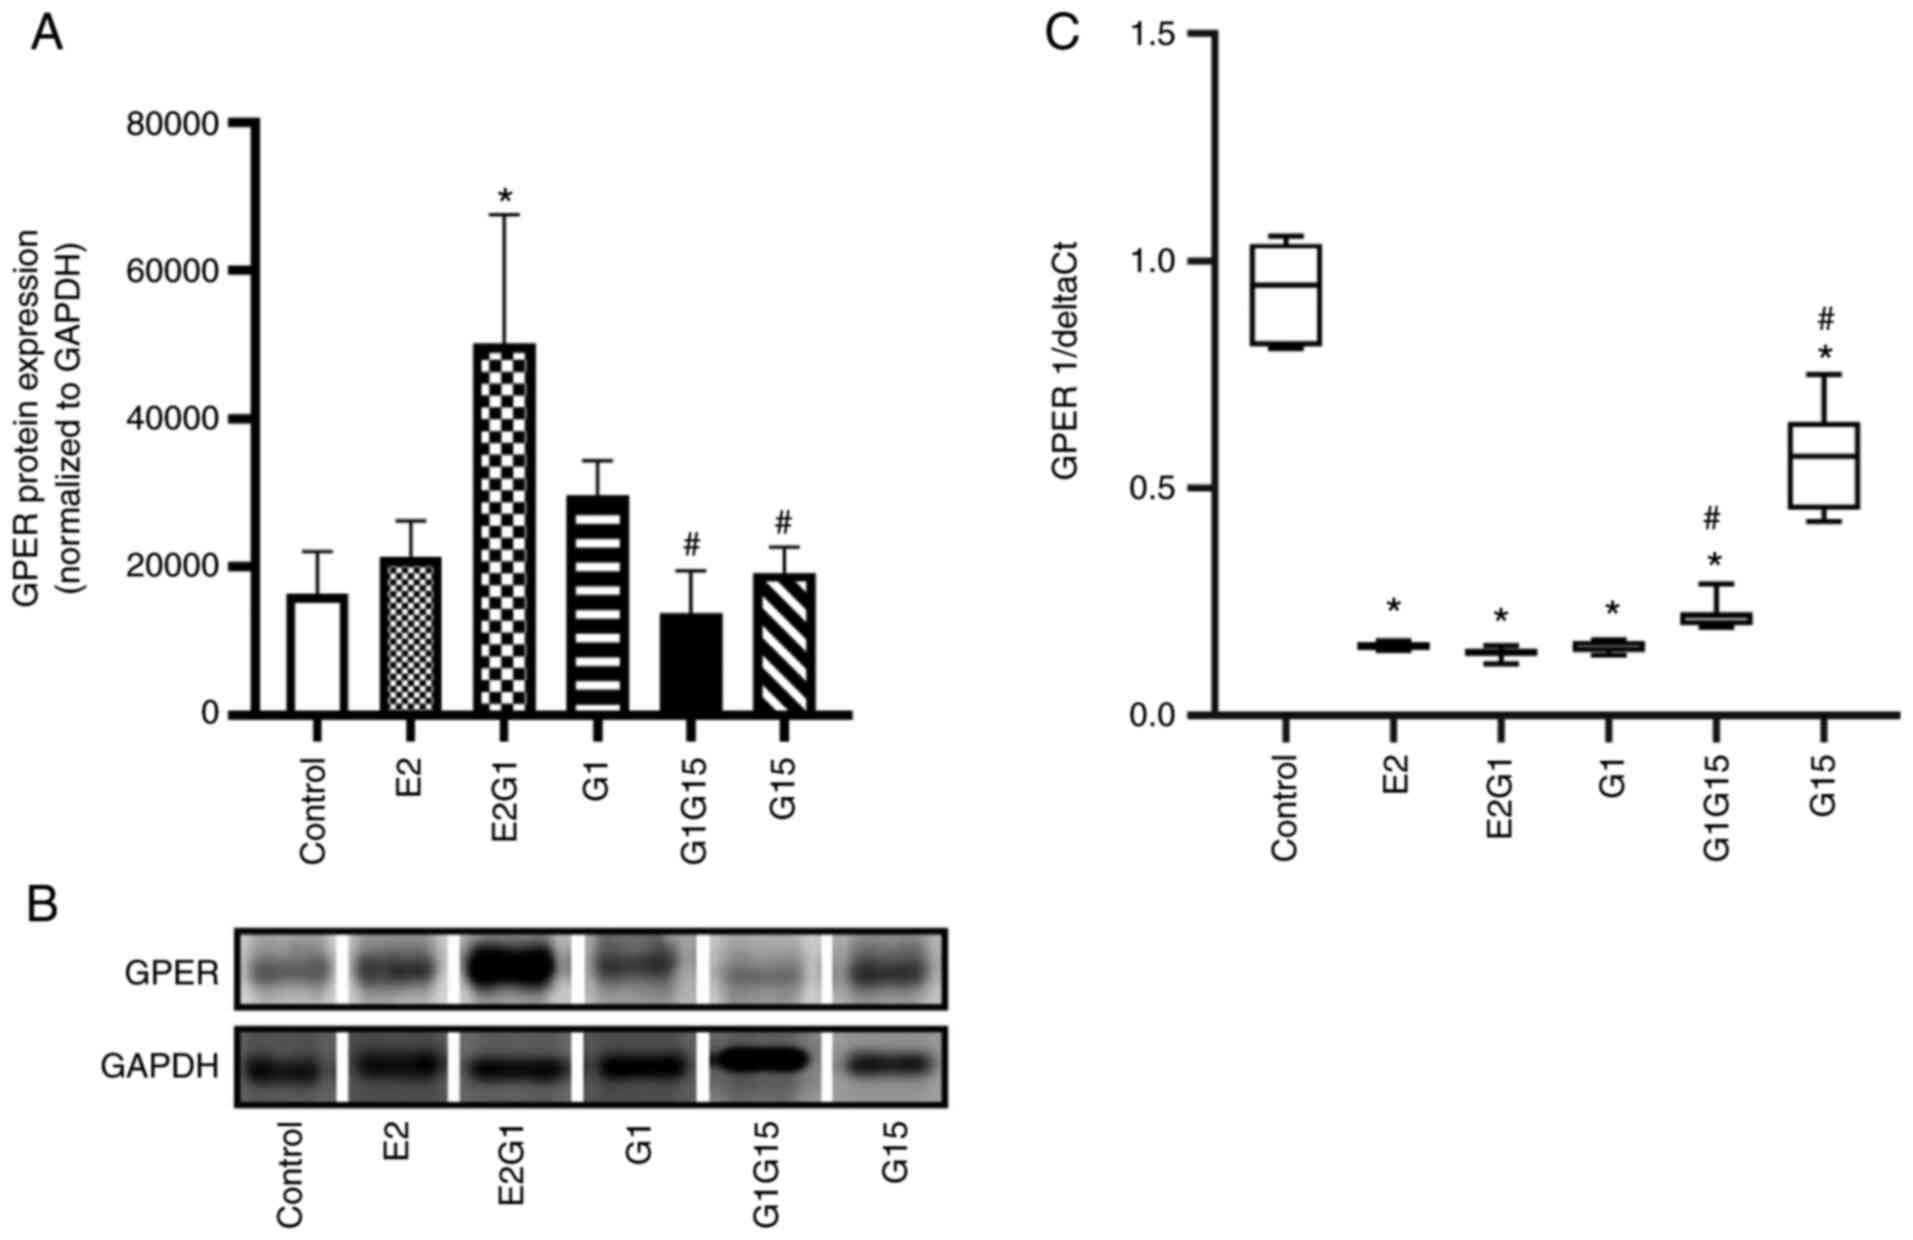
GPER expression in C6 cells
GPER expression in C6 cells was also evaluated by
western blotting and RT-qPCR. The treatment with E2 in combination
with G1 for 48 h significantly upregulated GPER protein expression
compared with control (P<0.05; F=8.35; DF=17). On the other
hand, the antagonist G15, alone or in combination with G1,
decreased this expression compared with E2-G1 combination
(P<0.05) (Fig. 2A and B).
Notably, the RT-qPCR data revealed that the GPER mRNA expression
decreased in C6 cells exposed to all treatments compared with
control (P<0.05; F=214; DF=63). The cells exposed to G15 alone
or in combination with G1 presented a higher GPER mRNA expression
compared with cells exposed to the agonists (P<0.05) (Fig. 2C).
Proliferation and viability of C6
glioblastoma cells
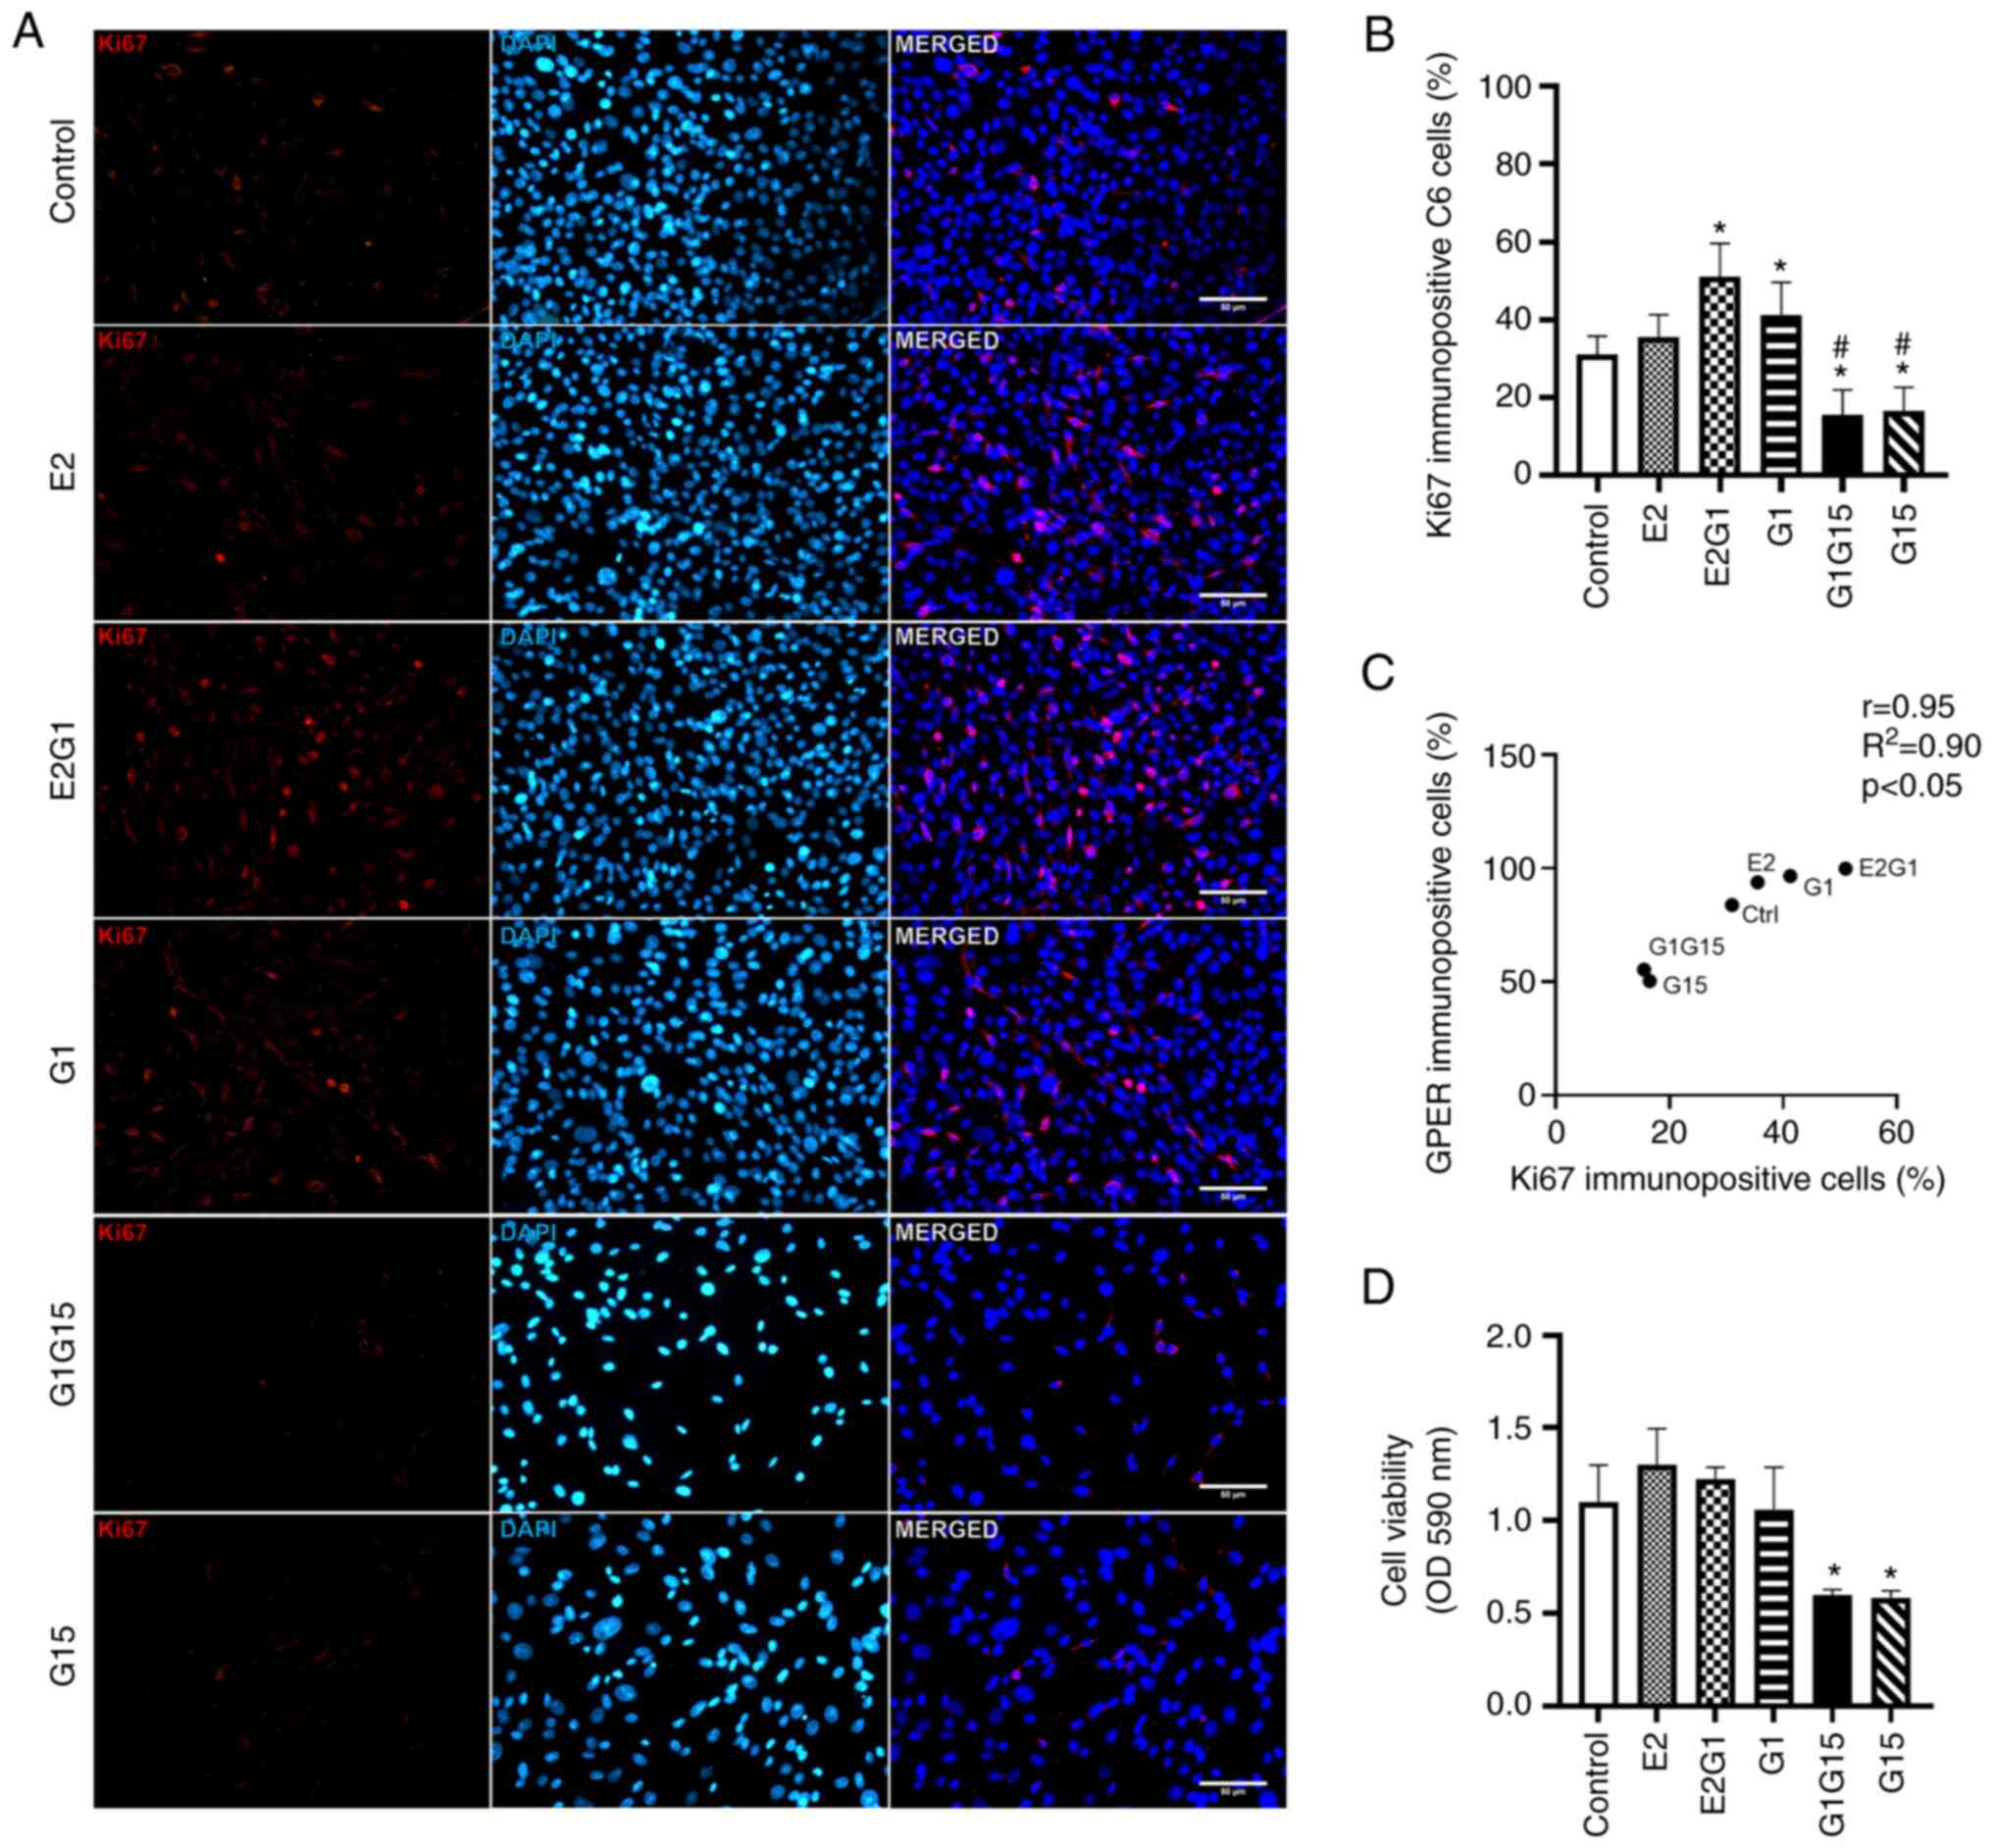
Ki67 immunopositivity (proliferation) was observed
in C6 cells treated with E2, G1, or their combination. A decrease
in Ki67 immunopositivity was observed after exposure to G15 alone
or in combination with G1 (Fig.
3A). As revealed in Fig. 3B, a
significant increase was observed in the percentage of Ki67
immunopositive cells under the effect of E2 in combination with G1
or G1 alone, compared with control (P<0.05; F=82.3; DF=117).
However, C6 cells under the effect of the antagonist G15 alone or
its combination with G1 showed a significant reduction in
proliferation compared with the rest of the groups (P<0.05)
(Fig. 3B). The Pearson's
correlation values (r=0.86; R2=0.71; P<0.05)
confirmed a positive correlation between GPER and Ki67
immunopositivity and proliferation of C6 cells (Fig. 3C). The experimental data from the
MTT assay demonstrated that E2 alone or combined with G1 tended to
increase the viability of C6 cells compared with the control. A
significant decrease was also identified in the viability of C6
cells treated with G15 alone or in combination with G1 compared
with control cells and cells exposed to agonists alone or in
combination (P<0.05; F=14.65; DF=21) (Fig. 3D). It is important to mention that
the Ki67 and MTT experimental data coincide in highlighting the
significant effect of G15 against proliferation and viability of C6
glioblastoma cells (Fig. 3B and
D).
Apoptosis of C6 glioblastoma
cells
Caspase-3 immunopositivity (apoptosis) was higher in
C6 cells treated with G15 alone or in combination with G1 compared
with E2, G1 and E2 plus G1 (Fig.
4A). As demonstrated in Fig.
4B, a significant increase was observed in the percentage of
caspase-3 immunopositive cells under the effect of the antagonist
G15 alone or its combination with G1 compared with the rest of the
groups (P<0.05; F=66.62; DF=119). Pearson's correlation values
(r=−0.97; R2=0.95; P<0.05) exhibited a negative
correlation between GPER and caspase-3 immunopositivity of C6 cells
(Fig. 4C). The ELISA also revealed
that the G1-G15 combination treatment significantly increased
caspase-3 concentration (1.66±0.302 ng/ml) in C6 cells compared
with control, E2 and E2-G1 combination conditions (P<0.05;
F=6.74; DF=17). Additionally, C6 cells exposed to G15 alone tended
to increase their caspase-3 levels (1.26±0.176 ng/ml) compared with
control (1.01±0.004 ng/ml) (Fig.
4D).
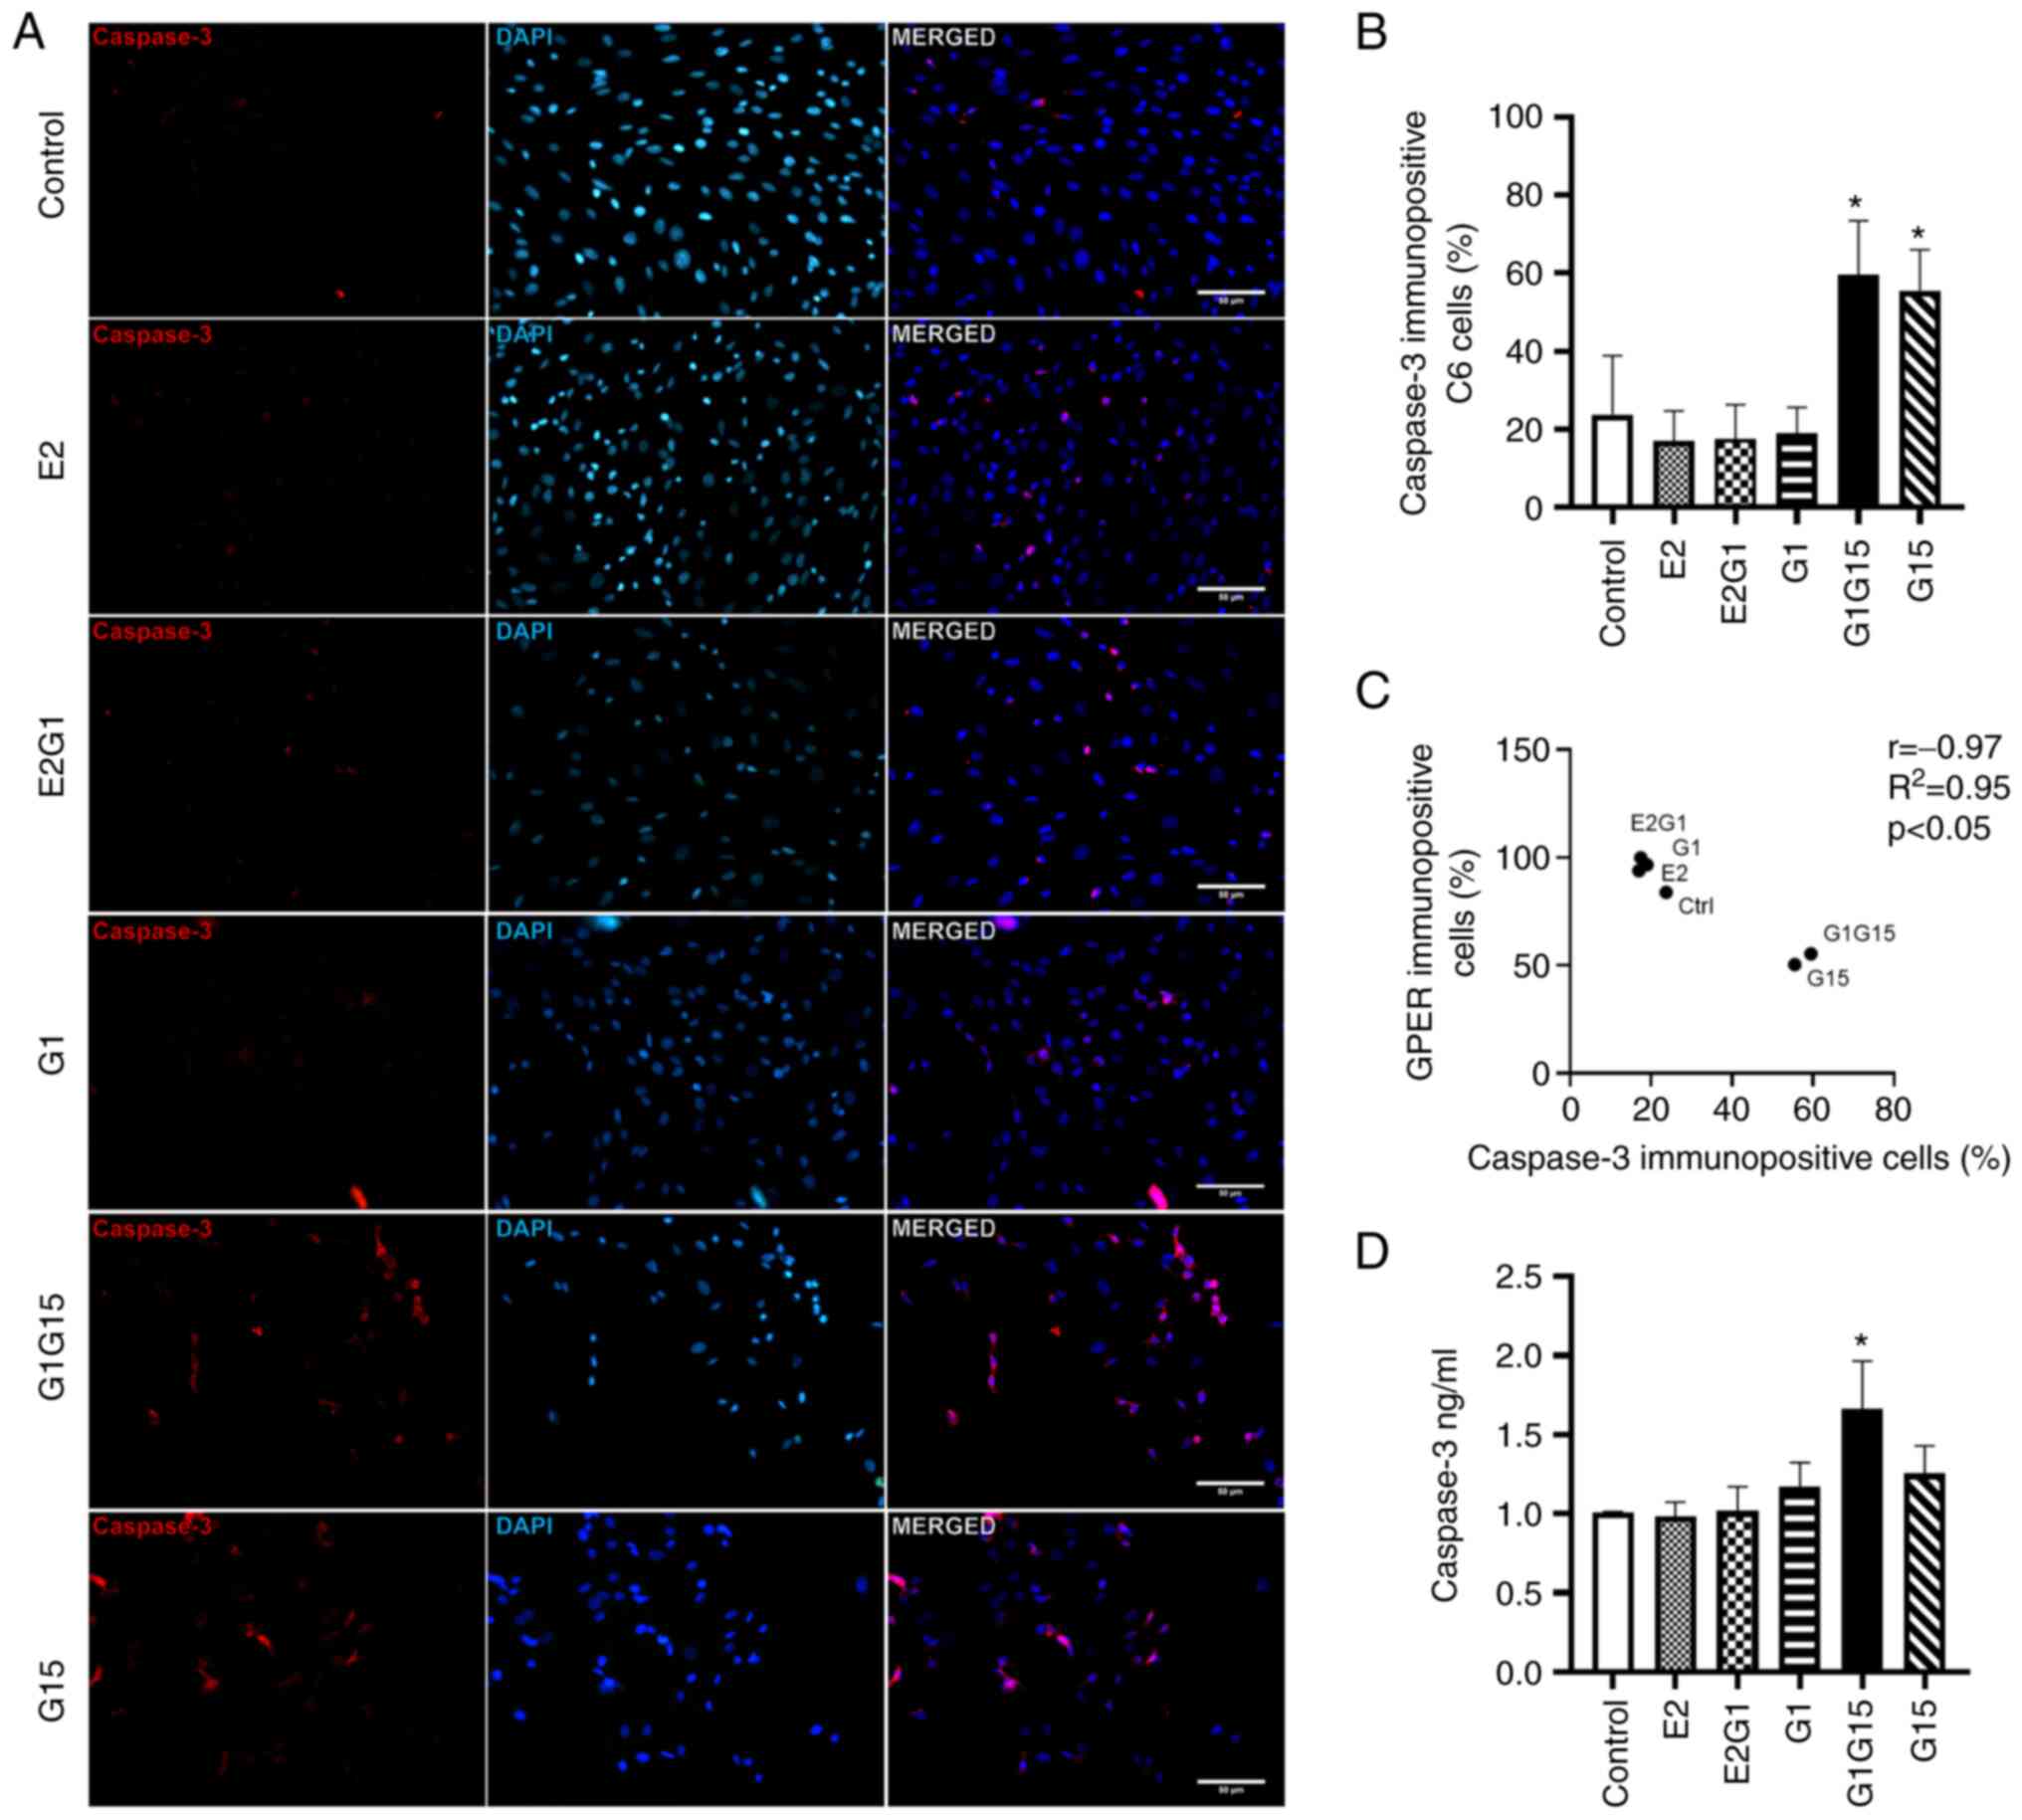 | Figure 4.Apoptosis evaluation in C6
glioblastoma cells under different conditions. (A) Representative
images of caspase-3 immunofluorescence staining of C6 cells under
E2, E2-G1 combination, G1, G1-G15 combination or G15 treatment. (B)
Percentage of caspase-3 immunopositive C6 cells. *P<0.05, vs.
Control, E2, E2-G1 combination and G1. (C) Pearson's correlation
analysis between the percentages of GPER and caspase-3
immunopositive cells. (D) Caspase-3 concentration (ng/ml) evaluated
by ELISA in C6 cells. *P<0.05, vs. Control, E2, and E2-G1
combination. E2, 17β-estradiol; GPER, G protein-coupled estrogen
receptor. |
Discussion
The search for new therapeutic targets for treating
glioblastoma is a priority in neuro-oncology. The present study
revealed the expression of GPER in C6 murine glioblastoma cells,
the effect of its agonists (E2 and G1) in increased cell
proliferation, and the opposite effect of the antagonist G15, which
decreased C6 cells proliferation and viability, and favored
apoptosis. Therefore, GPER expression plays a crucial role in
modulating the fate of glioblastoma as described for other types of
tumors and represents a target to develop new therapeutic
strategies against glioblastomas.
Firstly, an increase was observed in the
proliferation of C6 cells exposed to E2 in combination with G1 or
G1 alone. This result is consistent with Castracani et al
(24) in the U87-MG glioblastoma
cell line, who reported that E2 (5 nM) administration increased
cell proliferation. MCF-7 breast cancer cell line treated with
2,000 nM of tamoxifen, a GPER agonist, also presented increased
proliferation attributed to GPER activation (25). Similarly, E2 (1 nM) induced GPER
activation and cell proliferation in a human seminoma cell line
through ERK1/ERK2 and protein kinase A pathways (26). Additionally, the present results
indicated an additive proliferative effect of G1 and E2 where G1
was predominant over E2, probably related to its selectivity for
GPER.
Hirtz et al (27) recently described GPER protein
expression and localization in LN229 and U251 human glioblastoma
cell lines, reporting that the exposure of both cell lines to a
high dose of G1 (10 µM) decreased cell proliferation in a
time-dependent manner (24–96 h), with optimal results at 72 h. The
lowest dose (10 nM) induced a milder decrease in cell growth
compared with untreated control cells. The present experimental
data in C6 murine cells differ from the aforementioned study, as an
increase was observed in proliferation of C6 glioblastoma cells
exposed to 10 nM of G1 for 48 h. Therefore, the dose and time of
treatment with G1 are determinant factors for the fate of
glioblastoma cells, as previously described in other tumor cell
lines.
Notably, the present experimental results
demonstrated that C6 glioblastoma cell viability and proliferation
were substantially reduced under treatment with G15 (10 µM) alone
or combined with G1 (10 nM). These data are in consistency with Bai
et al (13), who
demonstrated a decreased cell viability of human oral squamous
carcinoma cells exposed to G15 (10–20 µM) for 48 h. Collectively,
the experimental data presented in the present study revealed that
GPER specific-antagonist G15 affects proliferation and viability of
C6 glioblastoma cells and inhibits the effects of G1. These data
supported the involvement of GPER in cell proliferation and
viability and the usefulness of GPER-specific antagonists in future
glioblastoma treatment schemes.
The increase in GPER protein expression observed in
C6 cells under E2-G1 combination treatment coincides with several
previous studies. Bustos et al (28) observed an increase in GPER protein
expression in HT-29 and DLD-1 colon cancer cells exposed for 24 h
to 10 nM E2. Liu et al (18) also identified increased GPER
protein expression in NSCLC cells (A549 and H1793) after exposure
to E2 (10 nM) or G1 (10 nM) for 48 h. The same effect was reported
in a urethane-induced lung adenocarcinoma murine model (15). In the present study, GPER
transcript results in C6 glioblastoma cells coincide with Ariazi
et al (29) in MCF-7 breast
cancer cells exposed to E2 (10 nM) for 24 and 48 h, which presented
a downregulation in GPER mRNA. By contrast, HT-29 and DLD-1 colon
cancer cells exposed for 24 h to 10 nM E2 showed an increase in
GPER mRNA (28). Thus, the effect
of E2 on transcription and translation of GPER depends on treatment
duration and cell type.
It was revealed that C6 cells exposed to the
combination of both agonists significantly increased their GPER
protein levels compared with control cells. The application of each
agonist on its own presented the same tendency. Therefore, E2 and
G1 probably exerted an accumulative effect on GPER protein
expression in the E2-G1 combination-treated cells, leading to
excessive proliferation. However, these same cells (E2, G1, and
E2-G1 combination groups) presented a downregulation of the GPER
transcript compared with control, suggesting that after 48 h of
exposure to the agonists, a transcriptional mechanism was involved
to avoid further excessive GPER expression. Thus, the discrepancy
between GPER protein and mRNA expression may correspond to a
characteristic mechanism of G protein-coupled receptors (GPCR) to
control their expression in the presence of high levels of agonist
and avoid excessive signaling, as reported by Rajagopal and Shenoy
(30). In the aforementioned
study, it was described how GPCR mRNA expression is downregulated
by its agonists to circumvent excessive production of GPCR proteins
and undue signaling. It has also been reported that continuous
stimulation by agonists may cause a redirection of the receptor to
the protein degradation pathways instead of the recycling pathway
(31,32). This process is long-term and is
associated with receptor internalization in vesicles for
degradation and decreased mRNA expression through unknown
mechanisms (30).
Notably, the exposure of C6 cells to the antagonist
G15 alone or in combination with G1 decreased GPER protein
expression compared with the agonists-exposed cells (E2, G1 and
E2-G1 combination), which also corresponds with the low
proliferation of these cells. This observation confirmed that G15
can compensate the effect of E2 or G1 agonists of GPER and control
GPER protein levels to that of control cells. Consequently, GPER is
a target for glioblastoma treatment, and further study of
GPER-specific antagonists is needed.
The role of GPER in the apoptosis of C6 cells was
also investigated through the evaluation of caspase-3. The agonists
E2 and G1, alone or combined, did not affect caspase-3 compared
with control. However, the exposure to G15 alone or combined with
G1 significantly increased caspase-3 immunopositivity percentage
compared with the rest of the conditions. Similarly, the ELISA
results indicated that G15 favored apoptosis and that this effect
was stronger when combined with G1. Similar to the present
experimental results, Wang et al (33) showed an increase in caspase-3
activity in ovarian cancer cells exposed to G1 (2 µM) plus G15 (4
µM). The present results are also in consistency with Bai et
al (13), who reported that
G15 (5–20 µM) induces G2/M phase cell arrest and apoptosis in human
oral squamous carcinoma cells. By contrast, in primary astrocytes
culture, GPER activation by high levels of G1 (100 nM), compared
with the ones used in the present study, increased apoptosis,
associated with a rise in intracellular calcium (34).
The Pearson's correlation analyses confirmed a
positive relationship between GPER expression and proliferation,
but a negative association between GPER expression and apoptosis of
C6 cells, indicating that high expression of GPER is linked with
proliferation; meanwhile, low GPER expression may favor apoptosis.
These results are consistent with several previous studies,
reporting that low GPER expression is associated with a favorable
prognosis in patients with cancer. Ulhaq et al (35) showed that certain GPER
single-nucleotide polymorphisms were related to cancer
predisposition and that GPER expression levels were associated with
higher tumor stages. Sjöström et al (36) reported that the absence of
immunohistochemical staining of GPER in breast cancer tissue is
associated with an excellent long-term prognosis in these patients.
Ino et al (37) also
reported that the elevated expression of GPER is associated with
poor prognosis in patients with uterine cervical adenocarcinoma.
These results highlighted GPER expression as a potential biomarker
in patients with glioblastoma. Therefore, the present experimental
data obtained in vitro deserve further in vivo study
in murine models of glioblastoma and patients with glioblastoma to
assess the participation of GPER in tumor malignancy and
survival.
The search for new biomarkers and therapeutic
targets to improve the prognosis of patients with glioblastoma is
of utmost importance. It was demonstrated that GPER expression is
present in C6 murine glioblastoma cells and that its expression is
regulated by its agonists of natural (E2) or synthetic origins (G1)
and antagonist (G15). A low dose of G1 increased proliferation of
C6 cells; by contrast, G15 had an opposite effect and favored
apoptosis. Thus, the results of the present study confirmed the
potential of GPER as an early detection prognosis marker and target
for developing new therapeutic strategies for glioblastoma
treatment. Nevertheless, based on the present results, further
studies in glioblastoma murine models and tissue from glioblastoma
patients with high or low levels of estrogens are needed to study
the antitumoral activity of G15 or other GPER specific
antagonists.
Acknowledgements
Not applicable.
Funding
The present study was supported by the Programa de Apoyo a la
Mejora en las Condiciones de Producción SNI y SNCA (PROSNI, 259639)
from the University of Guadalajara, Mexico.
Availability of data and materials
The datasets used and/or analyzed during the current
study are available from the corresponding author on reasonable
request.
Authors' contributions
CEGA and JMDJ designed the study. CEGA performed the
experiments. CEGA, LCLM, RCA and IGAG performed material
preparation and data collection. AS supervised cell viability,
RT-qPCR and western blotting experiments. CEGA and AS confirm the
authenticity of all the raw data. CEGA, AS, JMDJ and SHDJ analyzed
and interpreted data. CEGA and JMDJ wrote the first draft of the
manuscript. AS, JMDJ and SHDJ revised and edited the manuscript.
All authors read and approved the final manuscript.
Ethics approval and consent to
participate
Not applicable.
Patient consent for publication
Not applicable.
Competing interests
The authors declare that they have no competing
interests.
References
|
1
|
Ostrom QT, Patil N, Cioffi G, Waite K,
Kruchko C and Barnholtz-Sloan JS: CBTRUS statistical report:
Primary brain and other central nervous system tumors diagnosed in
the United States in 2013-2017. Neuro Oncol. 22:iv1–iv96. 2020.
View Article : Google Scholar
|
|
2
|
Stupp R, Taillibert S, Kanner A, Read W,
Steinberg D, Lhermitte B, Toms S, Idbaih A, Ahluwalia MS, Fink K,
et al: Effect of tumor-treating fields plus maintenance
temozolomide vs maintenance temozolomide alone on survival in
patients with glioblastoma: A randomized clinical trial. JAMA.
318:2306–2316. 2017. View Article : Google Scholar : PubMed/NCBI
|
|
3
|
Ostrom QT, Rubin JB, Lathia JD, Berens ME
and Barnholtz-Sloan JS: Females have the survival advantage in
glioblastoma. Neuro Oncol. 20:576–577. 2018. View Article : Google Scholar
|
|
4
|
Yague JG, Lavaque E, Carretero J, Azcoitia
I and Garcia-Segura LM: Aromatase, the enzyme responsible for
estrogen biosynthesis, is expressed by human and rat glioblastomas.
Neurosci Lett. 368:279–284. 2004. View Article : Google Scholar
|
|
5
|
Dueñas Jiménez JM, Candanedo Arellano A,
Santerre A, Orozco Suárez S, Sandoval Sánchez H, Feria Romero I,
López-Elizalde R, Alonso Venegas M, Netel B, de la Torre Valdovinos
B and Dueñas Jiménez SH: Aromatase and estrogen receptor alpha mRNA
expression as prognostic biomarkers in patients with astrocytomas.
J Neurooncol. 119:275–284. 2014. View Article : Google Scholar
|
|
6
|
Prossnitz ER and Maggiolini M: Mechanisms
of estrogen signaling and gene expression via GPR30. Mol Cell
Endocrinol. 308:32–38. 2009. View Article : Google Scholar
|
|
7
|
Maggiolini M and Picard D: The unfolding
stories of GPR30, a new membrane-bound estrogen receptor. J
Endocrinol. 204:105–114. 2010. View Article : Google Scholar
|
|
8
|
Hsu LH, Chu NM, Lin YF and Kao SH:
G-protein coupled estrogen receptor in breast cancer. Int J Mol
Sci. 20:3062019. View Article : Google Scholar
|
|
9
|
Filardo EJ: Epidermal growth factor
receptor (EGFR) transactivation by estrogen via the
G-protein-coupled receptor, GPR30: A novel signaling pathway with
potential significance for breast cancer. J Steroid Biochem Mol
Biol. 80:231–238. 2002. View Article : Google Scholar
|
|
10
|
Vivacqua A, Bonofiglio D, Recchia AG,
Musti AM, Picard D, Andò S and Maggiolini M: The G protein-coupled
receptor GPR30 mediates the proliferative effects induced by
17beta-estradiol and hydroxytamoxifen in endometrial cancer cells.
Mol Endocrinol. 20:631–646. 2006. View Article : Google Scholar
|
|
11
|
Smith HO, Arias-Pulido H, Kuo DY, Howard
T, Qualls CR, Lee SJ, Verschraegen CF, Hathaway HJ, Joste NE and
Prossnitz ER: GPR30 predicts poor survival for ovarian cancer.
Gynecol Oncol. 114:465–471. 2009. View Article : Google Scholar
|
|
12
|
Tu G, Hu D, Yang G and Yu T: The
correlation between GPR30 and clinicopathologic variables in breast
carcinomas. Technol Cancer Res Treat. 8:231–234. 2009. View Article : Google Scholar
|
|
13
|
Bai LY, Weng JR, Hu JL, Wang D, Sargeant
AM and Chiu CF: G15, a GPR30 antagonist, induces apoptosis and
autophagy in human oral squamous carcinoma cells. Chem Biol
Interact. 206:375–384. 2013. View Article : Google Scholar
|
|
14
|
Yang DL, Xu JW, Zhu JG, Zhang YL, Xu JB,
Sun Q, Cao XN, Zuo WL, Xu RS, Huang JH, et al: Role of GPR30 in
estrogen-induced prostate epithelial apoptosis and benign prostatic
hyperplasia. Biochem Biophys Res Commun. 487:517–524. 2017.
View Article : Google Scholar : PubMed/NCBI
|
|
15
|
Liu C, Liao Y, Fan S, Fu X, Xiong J, Zhou
S, Zou M and Wang J: G-protein-coupled estrogen receptor antagonist
G15 decreases estrogen-induced development of non-small cell lung
cancer. Oncol Res. 27:283–292. 2019. View Article : Google Scholar : PubMed/NCBI
|
|
16
|
Giakoumettis D, Kritis A and Foroglou N:
C6 cell line: The gold standard in glioma research. Hippokratia.
22:105–112. 2018.
|
|
17
|
Grobben B, De Deyn PP and Slegers H: Rat
C6 glioma as experimental model system for the study of
glioblastoma growth and invasion. Cell Tissue Res. 310:257–270.
2002. View Article : Google Scholar : PubMed/NCBI
|
|
18
|
Liu C, Liao Y, Fan S, Tang H, Jiang Z,
Zhou B, Xiong J, Zhou S, Zou M and Wang J: G protein-coupled
estrogen receptor (GPER) mediates NSCLC progression induced by
17β-estradiol (E2) and selective agonist G1. Med Oncol. 32:1042015.
View Article : Google Scholar
|
|
19
|
Irecta-Nájera CA, del Rosario Huizar-López
M, Casas-Solís J, Castro-Félix P and Santerre A: Protective effect
of lactobacillus casei on DMH-induced colon carcinogenesis
in mice. Probiotics Antimicrob Proteins. 9:163–171. 2017.
View Article : Google Scholar
|
|
20
|
Trejter M, Jopek K, Celichowski P,
Tyczewska M, Malendowicz LK and Rucinski M: Expression of estrogen,
estrogen related and androgen receptors in adrenal cortex of intact
adult male and female rats. Folia Histochem Cytobiol. 53:133–144.
2015. View Article : Google Scholar
|
|
21
|
Villalpando-Vargas F, Medina-Ceja L,
Santerre A and Enciso-Madero EA: The anticonvulsant effect of
sparteine on pentylenetetrazole-induced seizures in rats: A
behavioral, electroencephalographic, morphological and molecular
study. J Mol Histol. 51:503–518. 2020. View Article : Google Scholar
|
|
22
|
Livak KJ and Schmittgen TD: Analysis of
relative gene expression data using real-time quantitative PCR and
the 2(−Delta Delta C(T)) method. Methods. 25:402–408. 2001.
View Article : Google Scholar : PubMed/NCBI
|
|
23
|
Üçeyler N, Riediger N, Kafke W and Sommer
C: Differential gene expression of cytokines and neurotrophic
factors in nerve and skin of patients with peripheral neuropathies.
J Neurol. 262:203–212. 2015. View Article : Google Scholar
|
|
24
|
Castracani CC, Longhitano L, Distefano A,
Anfuso D, Kalampoka S, La Spina E, Astuto M, Avola R, Caruso M,
Nicolosi D, et al: Role of 17β-estradiol on cell proliferation and
mitochondrial fitness in glioblastoma cells. J Oncol.
2020:23146932020. View Article : Google Scholar
|
|
25
|
Molina L, Bustamante F, Ortloff A, Ramos
I, Ehrenfeld P and Figueroa CD: Continuous exposure of breast
cancer cells to tamoxifen upregulates GPER-1 and increases cell
proliferation. Front Endocrinol (Lausanne). 11:5631652020.
View Article : Google Scholar : PubMed/NCBI
|
|
26
|
Chevalier N, Vega A, Bouskine A, Siddeek
B, Michiels JF, Chevallier D and Fénichel P: GPR30, the
non-classical membrane G protein related estrogen receptor, is
overexpressed in human seminoma and promotes seminoma cell
proliferation. PLoS One. 7:e346722012. View Article : Google Scholar : PubMed/NCBI
|
|
27
|
Hirtz A, Lebourdais N, Rech F, Bailly Y,
Vaginay A, Smaïl-Tabbone M, Dubois-Pot-Schneider H and Dumond H:
GPER agonist G-1 disrupts tubulin dynamics and potentiates
temozolomide to impair glioblastoma cell proliferation. Cells.
10:34382021. View Article : Google Scholar : PubMed/NCBI
|
|
28
|
Bustos V, Nolan ÁM, Nijhuis A, Harvey H,
Parker A, Poulsom R, McBryan J, Thomas W, Silver A and Harvey BJ:
GPER mediates differential effects of estrogen on colon cancer cell
proliferation and migration under normoxic and hypoxic conditions.
Oncotarget. 8:84258–84275. 2017. View Article : Google Scholar
|
|
29
|
Ariazi EA, Brailoiu E, Yerrum S, Shupp HA,
Slifker MJ, Cunliffe HE, Black MA, Donato AL, Arterburn JB, Oprea
TI, et al: The G protein-coupled receptor GPR30 inhibits
proliferation of estrogen receptor-positive breast cancer cells.
Cancer Res. 70:1184–1194. 2010. View Article : Google Scholar : PubMed/NCBI
|
|
30
|
Rajagopal S and Shenoy SK: GPCR
desensitization: Acute and prolonged phases. Cell Signal. 41:9–16.
2018. View Article : Google Scholar
|
|
31
|
Cheng S Bin, Quinn JA, Graeber CT and
Filardo EJ: Down-modulation of the G-protein-coupled estrogen
receptor, GPER, from the cell surface occurs via a
trans-Golgi-proteasome pathway. J Biol Chem. 286:22441–22455. 2011.
View Article : Google Scholar : PubMed/NCBI
|
|
32
|
Jean-Alphonse F and Hanyaloglu AC:
Regulation of GPCR signal networks via membrane trafficking. Mol
Cell Endocrinol. 331:205–214. 2011. View Article : Google Scholar
|
|
33
|
Wang C, Lv X, Jiang C and Davis JS: The
putative G-protein coupled estrogen receptor agonist G-1 suppresses
proliferation of ovarian and breast cancer cells in a
GPER-independent manner. Am J Transl Res. 4:390–402.
2012.PubMed/NCBI
|
|
34
|
Roque C, Mendes-Oliveira J and Baltazar G:
G protein-coupled estrogen receptor activates cell type-specific
signaling pathways in cortical cultures: Relevance to the selective
loss of astrocytes. J Neurochem. 149:27–40. 2019. View Article : Google Scholar : PubMed/NCBI
|
|
35
|
Ulhaq ZS, Soraya GV, Milliana A and Tse
WKF: Association between GPER gene polymorphisms and GPER
expression levels with cancer predisposition and progression.
Heliyon. 7:e064282021. View Article : Google Scholar : PubMed/NCBI
|
|
36
|
Sjöström M, Hartman L, Grabau D, Fornander
T, Malmström P, Nordenskjöld B, Sgroi DC, Skoog L, Stål O,
Leeb-Lundberg LM and Fernö M: Lack of G protein-coupled estrogen
receptor (GPER) in the plasma membrane is associated with excellent
long-term prognosis in breast cancer. Breast Cancer Res Treat.
145:61–71. 2014. View Article : Google Scholar
|
|
37
|
Ino Y, Akimoto T, Takasawa A, Takasawa K,
Aoyama T, Ueda A, Ota M, Magara K, Tagami Y, Murata M, et al:
Elevated expression of G protein-coupled receptor 30 (GPR30) is
associated with poor prognosis in patients with uterine cervical
adenocarcinoma. Histol Histopathol. 35:351–359. 2020.
|