Introduction
Colorectal cancer (CRC) is a prevalent neoplastic
disease (1). The incidence of
patients with CRC aged <50 years has increased worldwide
substantially over the past decade (1). The 5-year overall survival rate from
CRC ranges from 90% if diagnosed at early stages), which declines
to 10% if diagnosed at late metastatic stages (2). Therefore, earlier detection of this
disease is paramount. However, difficulty remains in achieving this
due to the late manifestation of symptoms from CRC (1). Therefore, enhancing the understanding
into the pathological mechanism of colorectal cancer coupled with
optimized national screening programs would serve a key role in
facilitating the early detection of CRC.
Epigenetic changes, in particular DNA methylation,
has been reported to serve a vital role in colorectal
carcinogenesis (3) probably
through modification of gene expression. Aberrant DNA methylation
regulates the carcinogenesis of CRC, since unmethylated CpG islands
located in the gene can become strongly methylated (3,4).
Previous studies have proposed the concept of the involvement of
the colon cancer stem cells (cCSCs) during the early stages of
carcinogenesis and during relapse (5). cCSCs are multipotent neoplastic cells
that can regulate tumor growth, recurrence (6) and, in some cases, resistance to
chemotherapeutic agents (7).
Detection of CSCs is mostly performed by investigating the
expression profile of surface CD markers. In CRC, several CD
markers have been previously documented to be relevant for cancer
stem cell identification: CD133, CD166 and leucine-rich
repeat-containing G-protein-coupled receptor 5 (LGR5). Although
CD133 expression is an important parameter for the identification
and characterization of CSCs (8),
its functional role in CRC physiology remains unclear. CD133 can
activate the Wnt/β-catenin pathway, which lead to cancer cell
proliferation (9,10). A number of studies have attempted
to assess the role of CD133 (8–10).
However, doubts remain regarding the association between CD133 and
tumor recurrence (7), tumor size
and tumor differentiation (8).
Tumors with high expression levels of CD133 were found to be more
likely to be resistant to standard chemotherapy (11). By contrast, it remains
controversial whether CD133 expression can be used as an indicator
for liver metastasis and overall survival (6,12–15).
It was also previously reported that methylation of CpG islands in
the CD133 promotor region has significant effects towards
protein expression on primary tumors in colorectal cancer, GIST
stromal tumors and glioblastomas (16–18).
Therefore, further studies are required for the characterization of
CD133 function in cancer.
CD166 [(activated leukocyte cell adhesion molecule
(ALCAM)] is a transmembrane type-1 glycoprotein (19). Due to its adhesive properties, it
has been previously associated with CRC tumor growth (19). Several studies have revealed the
role of CD166 in CRC stem cells (20,21).
Detection of CD166, epithelial cellular adhesion molecule (EpCAM)
and CD44 expression together was shown to be viable for identifying
colorectal cancer stem cells more precisely (22) compared with to other markers, such
as CD133. Other studies have also suggested that CD166 can be used
as another stem cell marker in cancer stem cells from various types
of cancer e.g., colorectal, breast, prostate and non-small cell
lung cancer (20–23). The ALCAM gene also harbors
several CpG islands that can be regulated by DNA methylation, which
appear to represent the typical mechanism involved in repressing
the expression of stemness markers in non-stem cancer cells
(24). CD166 has been previously
shown to be an adequate marker for CSCs from various types of
malignancies, including digestive (gastric, pancreatic) and
non-digestive cancers, where they are epigenetically regulated
(25). However, the role of CD166
in CRC remains unclear due to inconclusive results reported by a
number of previous studies (23,26–28).
Leucine-rich repeat-containing G protein-coupled
receptor 5 (Lgr5) belongs to the G protein-coupled receptors family
and is located on the surfaces of intestinal stem cells (29). In total, ~80% CRC tissues express
Lgr5 (17). In addition, the
expression of Lgr5 could be found in both tumor and normal
colorectal tissues (17), the
overexpression of which has been associated with advanced stages of
CRC, distant metastases, 5-fluorouracil resistance and recurrence
(30–32). Lgr5 appears to be a possible
predictor of advanced CRC (33),
such that high levels of Lgr5 expression at stage IV CRC have been
associated with poor prognosis (34,35).
The expression of Lgr5 is tightly regulated by methylation in its
promotor region (36). A previous
study has reported that positive Lgr5 methylation is
inversely associated with higher tumor grades and invasiveness,
which is consistent with the observations that the overexpression
of Lgr5 is associated with the severity of malignancy and
CRC invasiveness (36).
O6-methyguanine-DNA methyltransferase (MGMT) is a
DNA repair enzyme that removes mutagenic and cytotoxic adducts from
O6-guanine molecules in the DNA (37,38).
Hypermethylation of this gene can be used as a clinical biomarker
for the early diagnosis and prognostic assessment of patients with
CRC (37,38). Hypermethylation of its promoter
region results in the silencing of MGMT gene, which has been
previously observed in various types of CRC (37–39).
CRC-associated adenomas are predicted to have worse prognosis,
whilst hypermethylation in the MGMT gene in malignant CRC is
associated with favorable therapeutic responses following treatment
with alkylating agents (39). The
A disintegrin and metalloproteinase with thrombospondin motifs
(ADAMTS) family of proteins is a key component of CRC and
other epithelial cancer carcinogenesis. Information on the effects
of ADAMTS16 hypermethylation on CRC remain scarce, though a
previous study has suggested that DNA methylation at its CpG loci
can be found in CRC and other epithelial tumors, which reduces its
expression (40).
Therefore, the aim of presented study was to
determine the abundance of selected stem cell markers (CD133, CD166
and Lgr5) on the surfaces of CRC cancer cells isolated from
surgically resected colorectal tissues from patients using flow
cytometry. In addition, the methylation status in the promoter
regions of selected genes (ADAMTS16, MGMT, PROM1, LGR5 and
ALCAM) was determined. A secondary aim of the present study
was to determine the statistical relationship among the expression
levels of stem cell markers and their methylation status, grade
(G), TNM staging (TNM), lymphatic (L), perineural (Pn) and venous
(V) invasion and other factors (e.g., sex, age, tumor
sidedness).
Materials and methods
Patients and tissue specimens
Primary (PT) and metastatic tumor (MTS) samples were
obtained during surgical resection from 30 patients with diagnosed
CRC in collaboration with The Department of Pathological Anatomy
and Clinic of Surgery and Transplant Center, Martin University
Hospital, Comenius University in Bratislava, Jessenius Faculty of
Medicine in Martin (Martin, Slovakia). Sample collection and
processing protocols were reviewed and approved by The Ethics
Committee of Jessenius Faculty of Medicine in Martin (approval no.
EK 1856/2016). All patients signed the informed consent document
prior to surgery. The patient's clinical protocols were reviewed
for clinical data, diagnosis, sex and age (Table I). A total of 30 samples [sex, 17
males and 13 females; origin, 21 PT and 9 MTS, age, 68.7±9.7 years
(mean ± SD)] were analyzed by flow cytometry and pyrosequencing.
Tissue samples were collected between April 2018 and June 2020.
Inclusion criteria for recruitment of patients into the study were
i) diagnosis [colorectal cancer (stage I–IV)], ii) written informed
consent and ii) the tissue sample size, provided by pathologist
[tumors >0.5 cm (or 5 grams of tissue) were processed].
 | Table I.Patient characteristics. |
Table I.
Patient characteristics.
| Parameter | N (%) |
|---|
| Sex |
|
|
Male | 17 (56) |
|
Female | 13 (44) |
| Age |
|
|
MTS | 9
(30) |
| PT | 21 (70) |
| Side of primary
tumor |
|
| R | 11 (37) |
| L | 10 (33) |
| N/A
(metastasis) | 9
(30) |
| TNM stage |
|
| 1 | 7
(23) |
| 2 | 4
(14) |
| 3 | 9
(30) |
| 4 | 10 (33) |
| Grade |
|
|
Low | 22 (73) |
|
High | 8
(27) |
| Lymphatic
invasion |
|
| No | 14 (47) |
|
Yes | 16 (53) |
| Venous
invasion |
|
| No | 20 (67) |
|
Yes | 10 (33) |
| Perineural
invasion |
|
| No | 24 (80) |
|
Yes | 6
(20) |
| Mismatch
repair |
|
|
Proficient | 19 (63) |
|
Deficient | 5
(17) |
|
N/A | 6
(20) |
Histology
Paraffin blocks were generated from the CRC tissues
and fixed in 10% formalin. (room temperature, 24 h). Tissue was
dehydrated by passing the tissue through series of alcohol [70%
ethanol (1×), 96% ethanol (4×) and xylene (3×)] and finally placed
in warm paraffin wax. Tissue sections (5 µm) rehydrated with
decreasing strengths of alcohol and finally with water were then
submitted for hematoxylin-eosin staining. The hematoxylin nuclei
staining step (8 min, room temperature) was followed by washing
with tap water and then distilled water. The histology sections
were counterstained with 1% eosin alcoholic solution (1 min, room
temperature) and washed again. The slides were then observed and
images were recorded using a BX53 light microscope (Olympus
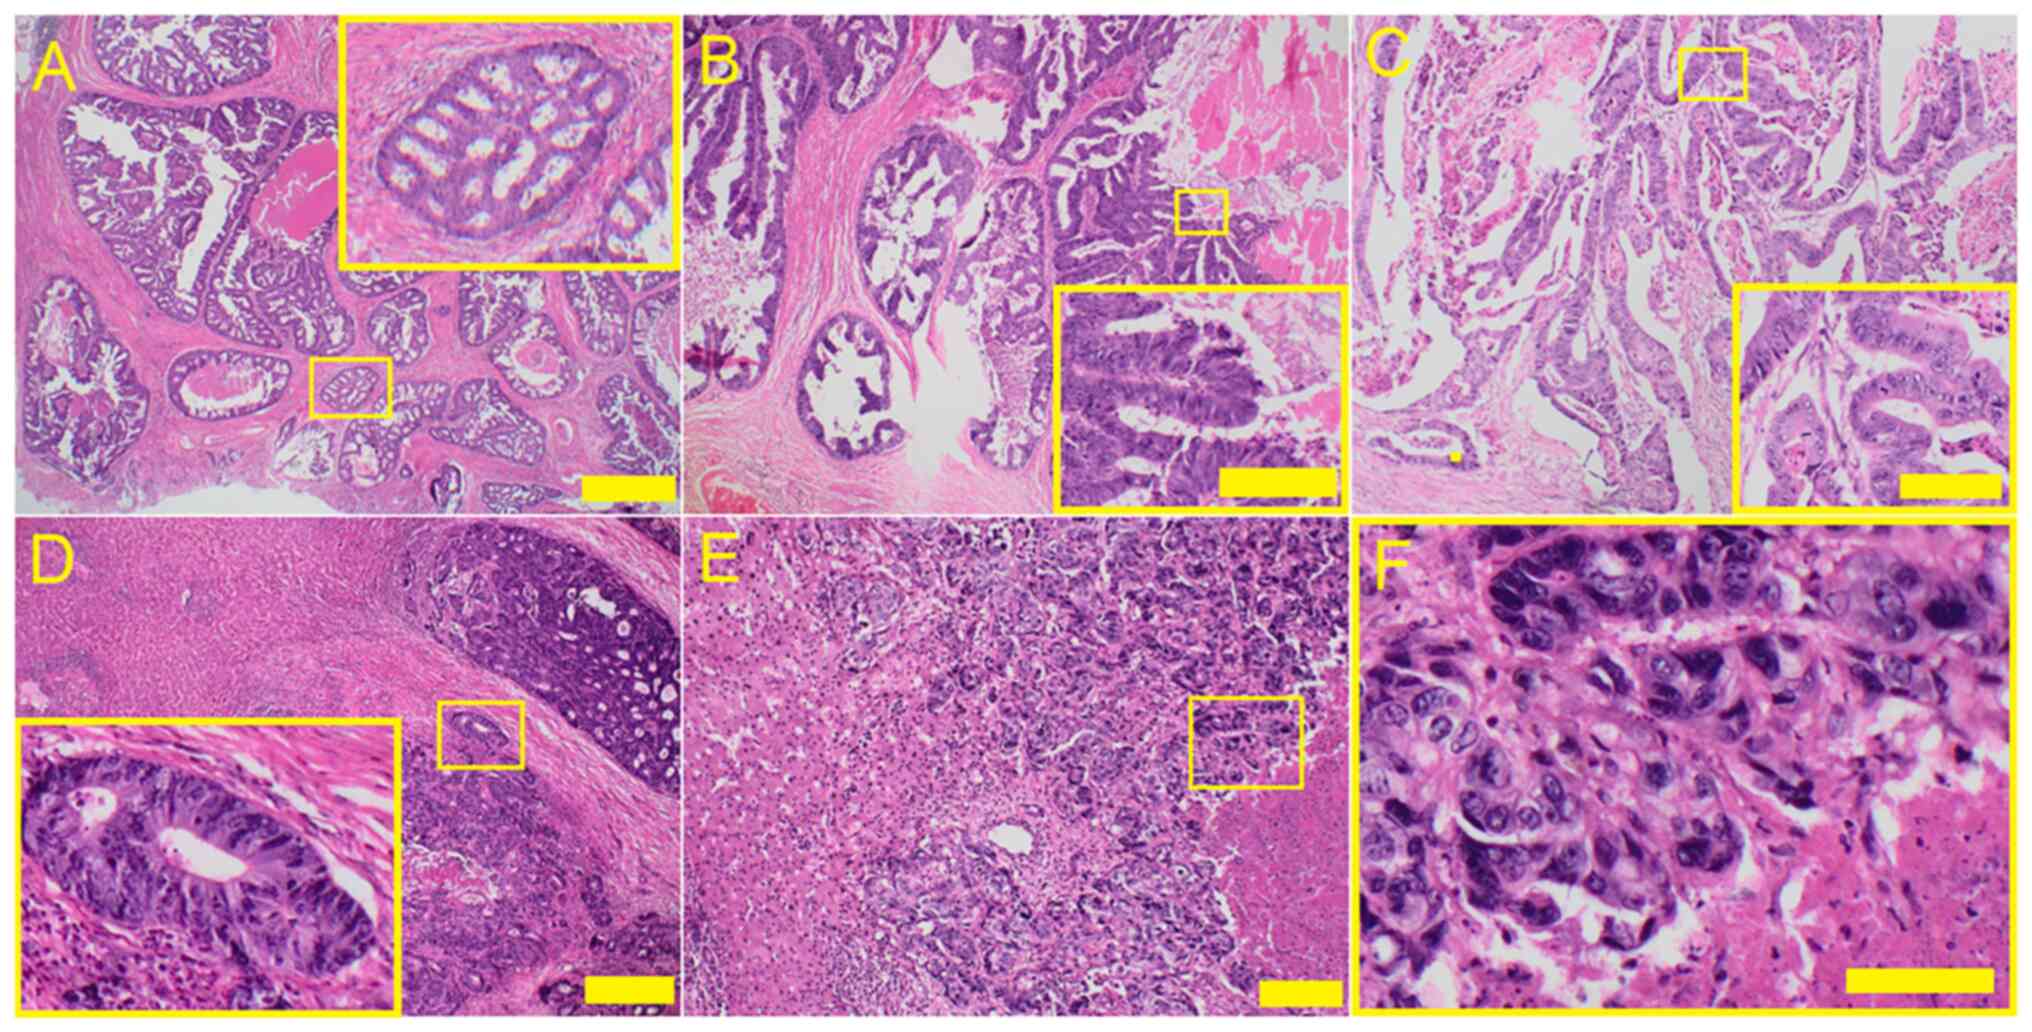
Corporation). Representative images are shown in Fig. 1A-C, showing primary colonic
adenocarcinoma with (A) cribriform (B) papillary and (C)
tubular/tubulocystic growth pattern with typical ‘dirty’ necrosis
and peritumoral desmoplastic reaction. Fig. 1D-F shows metastatic colorectal
adenocarcinoma in liver with ‘high-grade’ architectural morphology
(D) glandular structures with abortive luminas, (E) solid
trabecular growth pattern and ‘high-grade’ histocytologic
morphology (F) enlarged pleomorphic nuclei with high
nucleus/cytoplasmic ratio and hyperchromasia. Scale bars represent
100 µm.
Single cell suspension
preparation
After surgical resection, the tumors were
transferred to the Department of Pathological Anatomy and dissected
for histological evaluation. Small pieces (~0.5 cm) of tissue were
stored in RNAlater buffer (cat. no. AM7020; Thermo Fisher
Scientific, Inc.) at −80°C for future DNA analysis. Any residual
tissues were placed into a 50-ml Falcon tube containing DMEM/F-12 +
GlutaMAX™ medium (cat. no. 10565-018; Gibco; Thermo
Fisher Scientific, Inc.) supplemented with Penicillin-Streptomycin
(cat. no. 15070063; Gibco; Thermo Fisher Scientific, Inc.) and 10%
FBS (cat. no. 10082-147, Gibco; Thermo Fisher Scientific, Inc.) and
stored at 4°C until further analysis. Before analysis, tumor
samples were sterilized with 30–50% ethanol for 10 sec (at room
temperature) as described previously (41) and processed further in a sterile
environment (BSL-2 laminar hood). Briefly, tumor samples were
washed with sterile PBS, pH 7.4 (cat. no. 10010-031; Gibco; Thermo
Fisher Scientific, Inc.) and ~5 g tissue was minced into smaller
pieces (1.5-3.5 mm3) with a surgical razor and incubated
for 1 h at 37°C in 1X Hank's balanced salt solution (cat. no.
14025-050; Gibco; Thermo Fisher Scientific, Inc.) containing 1
mg/ml collagenase, type IV (cat. no. 17104019; Gibco; Thermo Fisher
Scientific, Inc.). After incubation, the single cell suspension was
isolated with trituration using a 10-ml Pasteur pipette and
filtered through a sterile 70-µm nylon cell MACS Smart Strainer
(cat. no. 130-098-462; Miltenyi Biotec GmbH), washed with 10 ml 1X
PBS and centrifuged at 400 × g (room temperature) for 3 min. Cell
count was then performed using a TC10 Automated Cell Counter
(Bio-Rad, Laboratories, Inc.) and ~1×10⁶
−3×10⁶ of cells were aliquoted for freezing. The cell
suspensions were then frozen in 1 ml freezing medium (culture
medium containing 10% DMSO) and inserted into a Mr. Frosty cell
freezer before being stored at −80°C until flow cytometry analysis
(Table SI).
Flow cytometry analysis
After the collection of samples, frozen aliquots
were quickly defrosted, washed 2X with sterile PBS and counted.
Cells were first blocked using a FACS buffer [PBS, pH 7.4; 0.001 M
EDTA; and 5% mouse serum (cat. no. ab7486, Abcam)] for 30 min on
ice. After blocking, ~100,000 primary cancer cells were again
re-suspended in 100 µl FACS buffer, transferred into 5-ml FACS
tubes and stained with fluorescently-labeled antibodies
[PE-anti-human Lgr5 (GPR49) antibody, PE-anti-human CD166 antibody
and APC-anti-human CD133/2 antibody, see Table SI for manufacturers] according to
manufacturer's protocols for 1 h on ice in the dark. Cells that
were not stained served as negative controls and 1×10⁶
cells/test were used (1 test was equal to 100 µl of cell
suspension, for the amount of antibody/test see Table SI). Subsequently, cells were
washed with PBS and analyzed using the BD FACSARIA II flow
cytometer (BD Biosciences) and processed using the BD FACSDiva
software v9.0 (BD Biosciences). Cell debris and dead cells were
excluded from measurement by gating and 7-Aminoactinomycin D
staining. Fig. S1 shows the
representative histograms from the flow cytometry analyses of
isolated tumor cells. Data from flow cytometry analyses were
uploaded to Mendeley (https://data.mendeley.com/datasets/vknp983sbf/1). High
levels of auto-fluorescence is common for primary cancer cells.
Therefore, to avoid artifacts associated with fluorescence
bleed-through into non-specific channels, single-factor (CD marker)
measurements were performed per test.
Extraction of DNA and bisulfite
treatment of DNA
From the total of 30 CRC samples, three samples were
excluded due to insufficient DNA concentration (Table II). Nucleic acids were extracted
using a DNase Blood and Tissue kit (Qiagen GmbH) according to the
manufacturer's protocol. Subsequently, 1–2 µg DNA was
bisulfite-treated using an EpiTect Bisulfite kit (Qiagen, Inc.) and
≤1 µg DNA was used in a total reaction volume of 20 µl. Previously
described protocols were then followed (42). DNA was placed into a thermal cycler
with the following program: denaturation (95°C, 5 min), incubation
(60°C, 25 min), denaturation (95°C, 5 min), incubation (60°C, 85
min), denaturation (95°C, 175 min), incubation (60°C, 25 min),
incubation (20°C). After bisulfite modification (in accordance to
manufacturer's protocol), genomic DNA was stored at −20°C until
PyroMark PCR analysis.
| Table II.Patient characteristics after the
exclusion of three samples due to insufficient DNA
concentration. |
Table II.
Patient characteristics after the
exclusion of three samples due to insufficient DNA
concentration.
| Parameter | N (%) |
|---|
| Sex |
|
|
Male | 16 (60) |
|
Female | 11 (40) |
| Age |
|
|
MTS | 8
(30) |
| PT | 19 (70) |
| Side of primary
tumor |
|
| R | 10 (37) |
| L | 9
(33) |
| N/A
(metastasis) | 8
(30) |
| TNM Stage |
|
| 1 | 6
(22) |
| 2 | 4
(15) |
| 3 | 8
(30) |
| 4 | 9
(33) |
| Grade |
|
|
Low | 19 (70) |
|
High | 8
(30) |
| Lymphatic
invasion |
|
| No | 11 (41) |
|
Yes | 16 (59) |
| Venous
invasion |
|
| No | 17 (63) |
|
Yes | 10 (37) |
| Perineural
invasion |
|
| No | 22 (81) |
|
Yes | 5
(19) |
| Mismatch
repair |
|
|
Proficient | 16 (60) |
|
Deficient | 5
(20) |
|
N/A | 6
(22) |
Pyrosequencing and CpG assays
Bisulfite-converted DNA was amplified using the
PyroMark PCR kit (Qiagen, Inc.) in accordance with manufacturer's
protocol. For the analysis of the selected regions of CD133
(4 CpG), CD166 (4 CpG), LgR5 (4 CpG), ADAMTS16
(3 CpG) and MGMT (7 CpG), commercially available CpG assays
[PyroMark CpG Assay (200), URL
address:https://geneglobe.qiagen.com/product-groups/pyromark-cpg-assays:
Hs_PROM1_05_PM (cat. no. PM00110194), Hs_ALCAM_03_PM (cat. no.
PM00108717), Hs_LGR5_01_PM (cat. no. PM00052416), Hs_ADAMTS16_01_PM
(cat. no. PM00022106), Hs_MGMT_01_PM (cat. no. PM00149702)] were
used. Protocol and PCR reaction conditions were as follows: DNA
polymerase activation (95°C, 15 min), followed by a three-step
cycle of denaturation (94°C, 30 sec), annealing (56°C, 30 sec) and
extensions (72°C, 30 sec), a process repeated 45 cycles in a row.
The final extension was carried out (72°C, 10 min).
PCR products were visualized by electrophoretic
analysis (1.75% agarose gel) under UV light. Analyses were
conducted according to the manufacturer's protocol, which was
described previously (42). Data
(% methylation for the indicated gene) from analyses were uploaded
to Mendeley (https://data.mendeley.com/datasets/vknp983sbf/1).
Completely methylated and unmethylated DNA were used as control
samples (EpiTect Control DNA, methylated (cat. no. 59655)/EpiTect
Control DNA, unmethylated (cat. no. 59665); Qiagen GmbH.
Statistical analysis
The data were explored and analyzed in R ver. 4.0.5
(43). The clinicopathological
parameters were presented as N (%), whereas continuous variables
were presented as the median (lower and upper quartiles). The null
hypothesis of independence between two categorical factors was
tested using Fisher's exact test. The null hypothesis of equality
of the population medians was tested using the
Wilcoxon-Mann-Whitney test. Kruskal-Wallis test was used if there
were more than two populations. In cases of significance, Dunn's
post hoc test was used. P<0.05 was considered to indicate a
statistically significant difference, whereas 0.05< P<0.1 was
considered to indicate a weakly significant difference. The tests
were two-sided. If the P-value from the two-sided alternative
testing was <0.05, the direction (increase, decrease) was
reported.
Random forest (RF) data analysis
The discriminative ability of the studied markers
for discriminating between PT and MTS was assessed using the RF
machine learning algorithm as implemented in R library
randomForestSRC (https://luminwin.github.io/randomForestSRC/). RF was
trained without TNM staging. Predictors were then ranked by the
variable importance measure (vimp); see Fig. S2B. The predictive power of the
trained RF was measured using the receiver operating characteristic
curve (see Fig. S2A) obtained
from the Out-Of-Bag data and quantified by the area under curve
(AUC). Due to the imbalanced representation of the two groups, the
imbalanced RF was used.
Results
Flow cytometry
Expression of CD133, CD166 and Lgr5 markers was
detected with fluorescent antibodies by flow cytometry on the
surface of the cells isolated from tumor samples in a cohort of
patients diagnosed with CRC and the percentage of the cells
positive for these markers was recorded. All 30 tissue samples were
analyzed for the expression of CD133 and Lgr5 markers. However,
only 24 samples were analyzed for the expression of CD166, due to
the insufficient number of cells in the six clinical samples. Tumor
cells showed the highest average rate of CD166 (63. 7% of positive
cells), followed by Lgr5 (31%) and CD133 (26.5%). For Lgr5 and
CD166 expression, the difference were not found to be significant
between the MTS and PT subgroups. Kruskal-Wallis test of the median
expression of CD133 at stages 1, 2, 3 and 4 [Stage 1 represents
(T1-T2, N0 and M0), Stage 2 (T3-T4,N0,M0), Stage 3 (any T, N1-N2,
M0) and Stage 4 (any T, any N, M1) on TNM scale] revealed
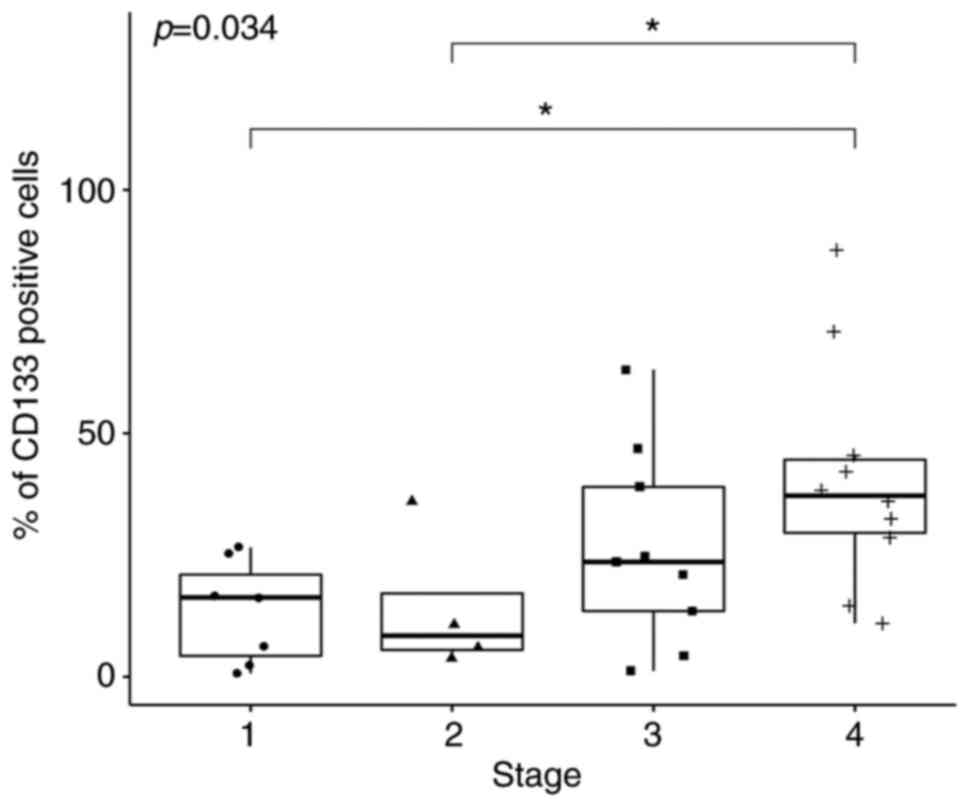
significance (P=0.034; Fig. 2). In
total, two of the Dunn's post hoc comparisons revealed statistical
significance. Specifically, expression of CD133 at Stage 4 was
significantly higher compared with that at Stage 1 (P=0.01) whereas
the median expression in Stage 4 was significantly higher compared
with that in Stage 2 (P=0.03; Fig.
2; Table III). For Lgr5 and
CD166, the ANOVA null hypothesis was not rejected. Using the
Wilcoxon-Mann-Whitney test with the one-side alternative, the
percentage of CD133, CD166 and Lgr5 positive cells in all samples
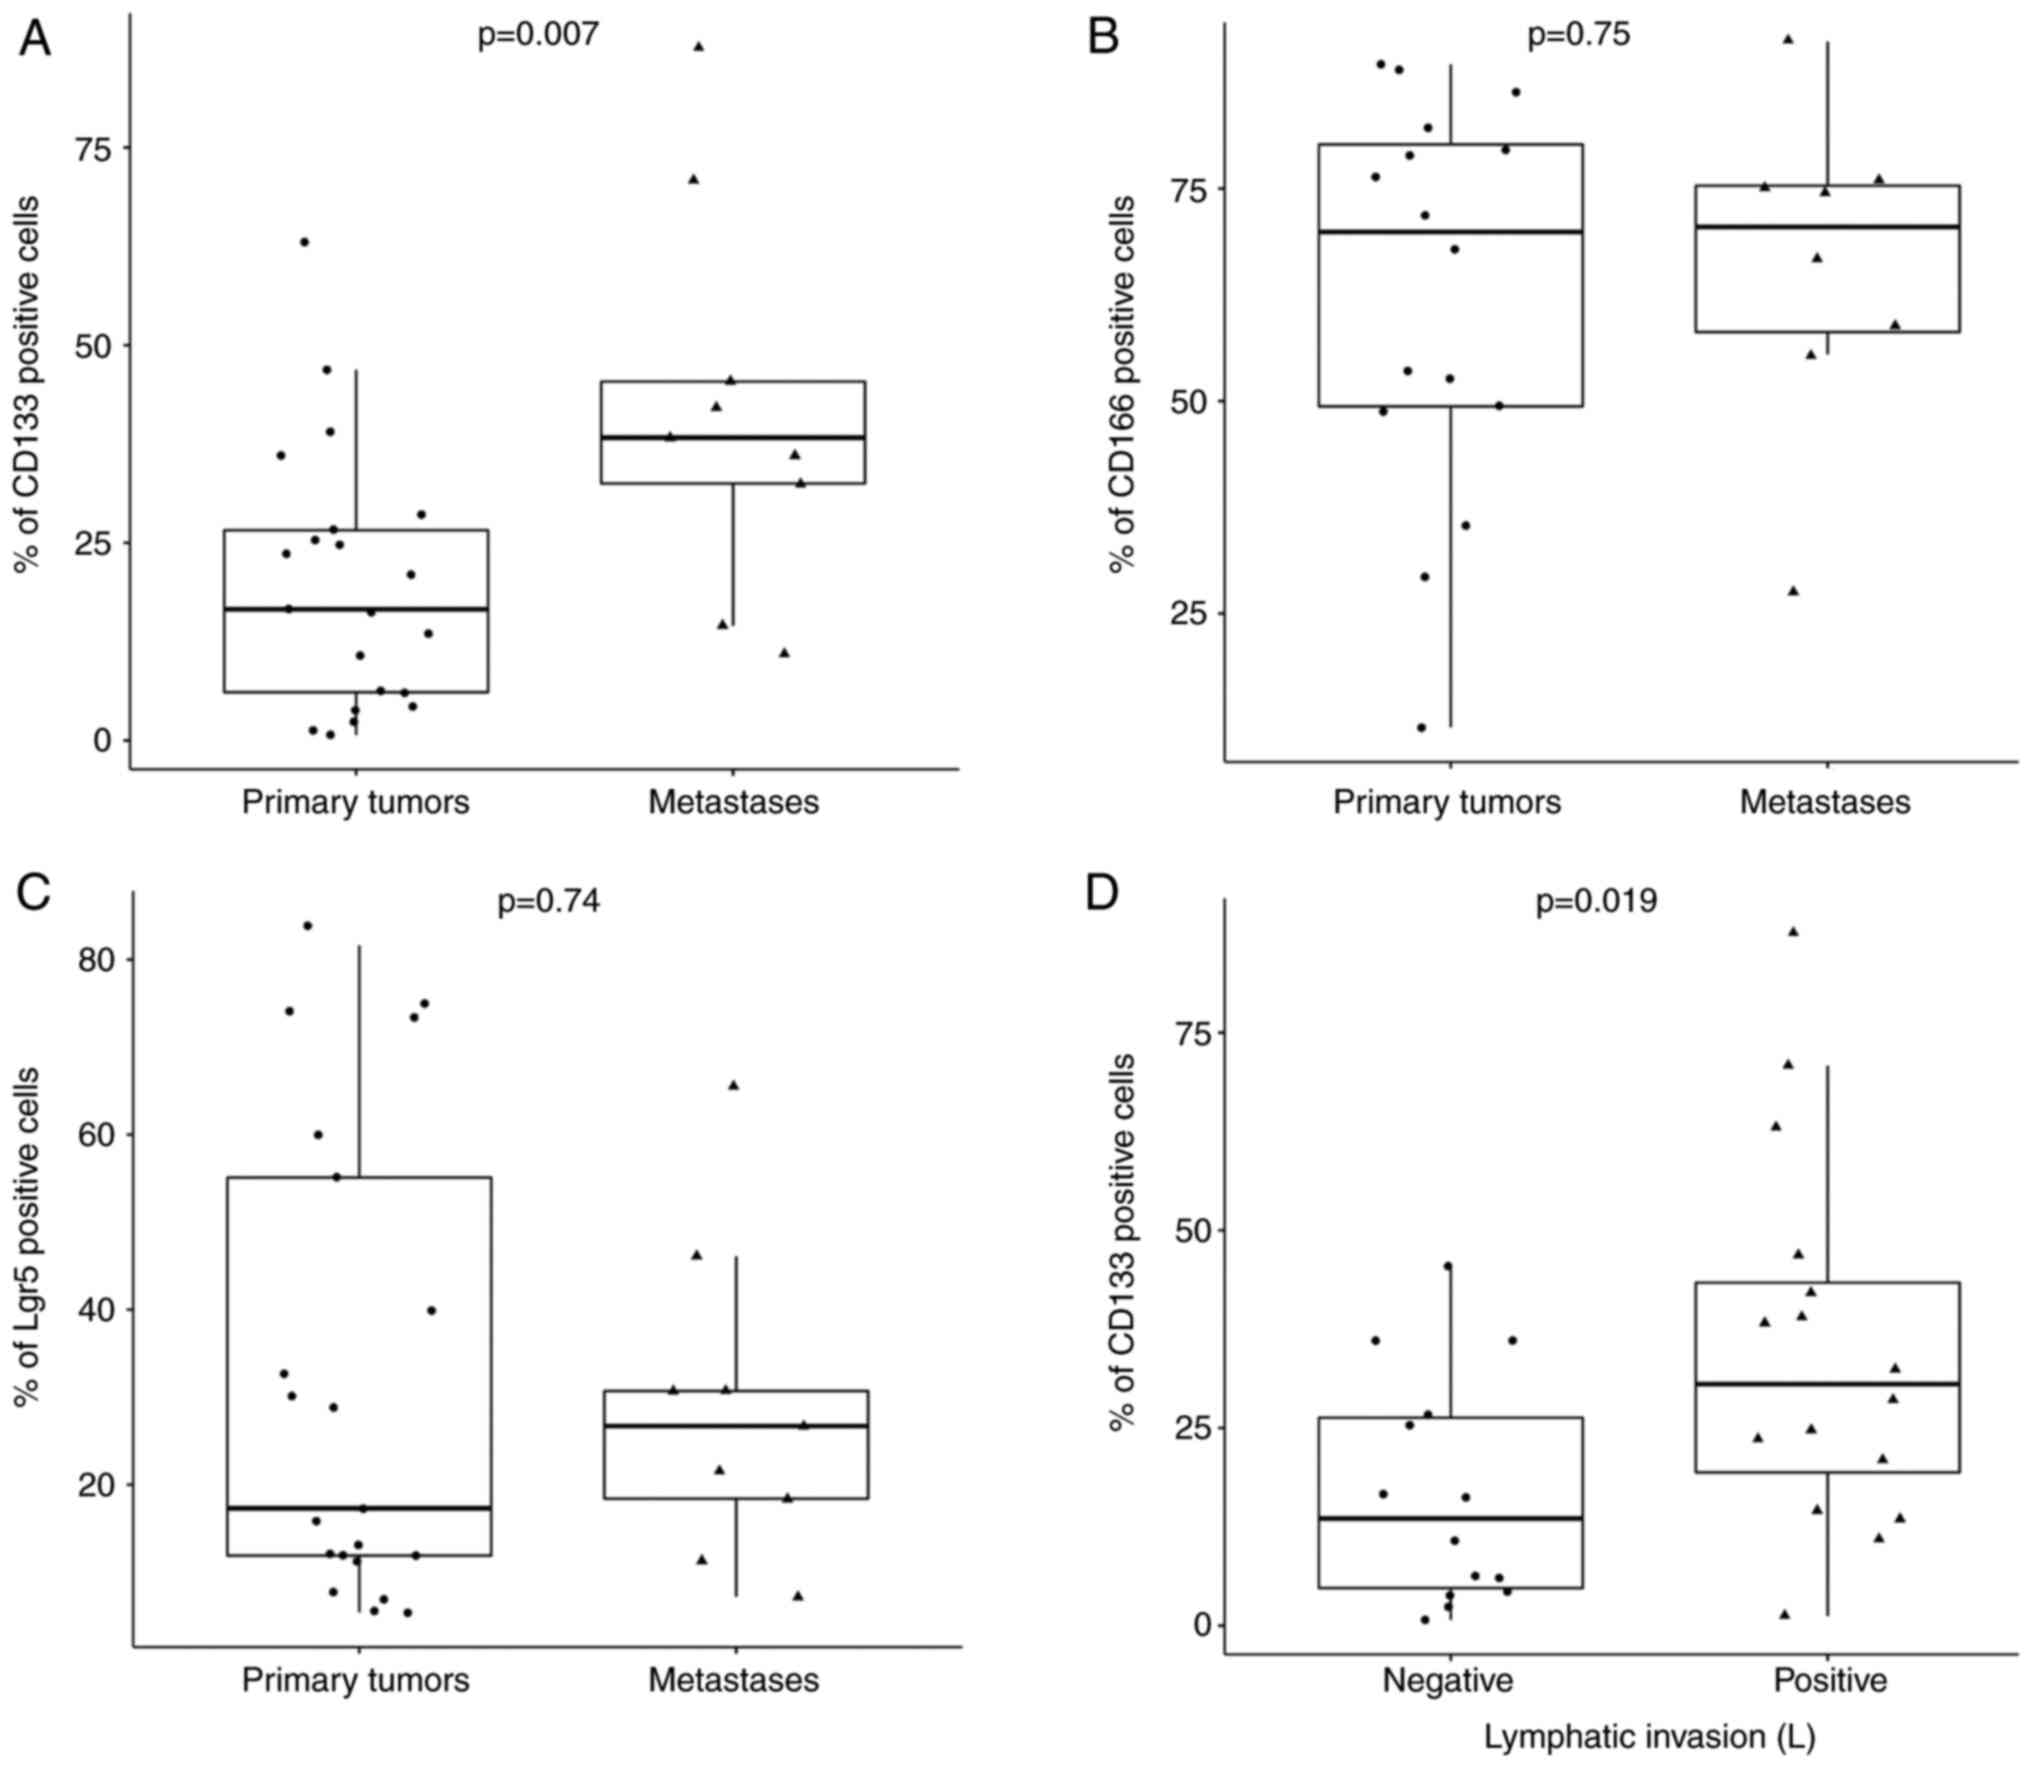
was compared between PTs and MTS. The percentage of
CD133+ cells (Fig. 3A)
was found to be significantly higher in MTS compared with that in
PTs (P=0.007). For CD166 and Lgr5 (Fig. 3B and C), although percentage of
positive cells was also markedly higher in MTS compared with that
in PTs, statistical significance could not be reached (Fig. 3B and C). Subsequently, using the
Wilcoxon-Mann-Whitney test, the median expression of all three
markers was compared within each category of grade (low vs. high),
lymphatic invasion (yes vs. no), venous invasion (yes vs. no),
perineural invasion (yes vs. no) and sidedness of tumor (right vs.
left). CD133 showed statistical significance within the lymphatic
invasion category (P=0.019; Fig.
3D). A weak statistical significance was found for
CD166+ cells within the grade category (P=0.087), sex
compared with venous invasion (P=0.017), sex compared with
sidedness of tumor (P=0.008) and venous invasion compared with
lymphatic invasion (P=0.058). However, for the other factors the
differences in the median expression were not statistically
significant (Table IV). For the
comparison of CD166 and Lgr5 with the TNM staging category, one-way
ANOVA test was used. However, for these markers (CD166 and Lgr5) no
statistical significance could be detected. As mentioned above,
only CD133 was significantly associated with TNM staging.
Representative flow cytometry diagrams for all groups quantified in
corresponding graphs in Figs. 2
and 3 are shown in Fig. S1.
| Table III.P-values from the Dunn's post hoc
comparisons of CD133 expression, CD133 DNA methylation and
MGMT DNA methylation among the four TNM stages. |
Table III.
P-values from the Dunn's post hoc
comparisons of CD133 expression, CD133 DNA methylation and
MGMT DNA methylation among the four TNM stages.
| TNM stage
comparison | CD133 expression
(flow cytometry) | CD133 DNA
methylation | MGMT DNA
methylation |
|---|
| 1 vs. 2 | 0.96 | 0.06 | 0.02 |
| 1 vs. 3 | 0.21 | 0.05 | 0.83 |
| 1 vs. 4 | 0.01 | 0.01 | 0.06 |
| 2 vs. 3 | 0.27 | 0.86 | 0.03 |
| 2 vs. 4 | 0.03 | 0.82 | 0.44 |
| 3 vs. 4 | 0.16 | 0.61 | 0.07 |
| Table IV.Comparisons of each marker among each
clinicopathological parameter. |
Table IV.
Comparisons of each marker among each
clinicopathological parameter.
| A, Grade |
|---|
|
|---|
|
|
|
|
| Venous
invasion | Sex |
|---|
| Category | CD133 | CD166 | Lgr5 | Positive | Negative | Male | Female |
|---|
| Low (n=22) | 19 (11,38) | 67 (49,76) | 20 (11,32) | 8 (36) | 14 (64) | 13 (59) | 9 (41) |
| High (n=8) | 26 (19,37) | 79 (64,86) | 38 (15,56) | 2 (25) | 6 (75) | 4 (50) | 4 (50) |
| P-value | 0.8 | 0.087 | 0.3 | 0.7 |
| 0.7 |
|
|
| B, Lymphatic
invasion |
|
|
|
|
|
|
|
| Sex |
|
|
|
|
|
|
|
|
| Category | CD133 | CD166 | Lgr5 | Venous
invasion | Male | Female |
|
| Negative
(n=14) | 14 (5,26) | 70 (50,76) | 15 (8,32) | 2 (14) | 12 (86) | 7 (50) | 7 (50) |
| Positive
(n=16) | 31 (19,43) | 71 (54,85) | 29 (15,53) | 8 (50) | 8 (50) | 10 (62) | 6 (38) |
| P-value | 0.026 | 0.6 | 0.12 | 0.058 |
| 0.5 |
|
|
| C, Venous
invasion |
|
|
|
|
|
|
|
| Sex |
|
|
|
|
|
|
|
|
| Category | CD133 | CD166 | Lgr5 | Venous
invasion | Male | Female |
|
| Negative
(n=20) | 24 (10,37) | 73 (50,81) | 23 (11,48) | - | 8 (40) | 12 (60) |
| Positive
(n=10) | 25 (12,37) | 63 (53,76) | 24 (14,31) | - | 9 (90) | 1 (10) |
| P-value | >0.9 | 0.6 | 0.8 | - | 0.017 |
|
|
| D, Perineural
invasion |
|
|
|
|
|
|
|
| Sex |
|
|
|
|
|
|
|
|
| Category | CD133 | CD166 | Lgr5 | Venous
invasion | Male | Female |
|
| Negative
(n=24) | 25 (11,40) | 68 (49,78) | 20 (11,41) | 7 (29) | 17 (71) | 14 (58) | 10 (42) |
| Positive (n=6) | 22 (8,30) | 75 (59,80) | 29 (19,63) | 3 (50) | 3 (50) | 3 (50) | 3 (50) |
| P-value | 0.5 | 0.4 | 0.4 | 0.4 |
| >0.9 |
|
|
| E, Sidedness of
tumor |
|
|
|
|
|
|
|
| Sex |
|
|
|
|
|
|
|
|
| Category | CD133 | CD166 | Lgr5 | Venous
invasion | Male | Female |
|
| Right (n=11) | 21 (9,32) | 78 (64,81) | 33 (13,67) | 4 (36) | 7 (64) | 8 (73) | 3 (27) |
| Left (n=10) | 16 (3,24) | 52 (45,74) | 14 (9,30) | 1 (10) | 9 (90) | 1 (10) | 9 (90) |
| P-value | 0.3 | 0.4 | 0.14 | 0.3 |
| 0.008 |
|
To assess the ability of the studied markers for
discriminating between PT and MTS, the imbalanced RF machine
learning algorithm was trained before the importance measure was
used to rank the predictors. Since TNM staging appeared to be the
most important predictor, another RF was trained without TNM
staging. The discriminative ability of the RF without TNM staging
was found to be substantially lower (AUC=64%, Fig. S2A). CD133 was found to be the most
important predictor, followed by other factors, including Lgr5,
tumor sidedness, ADAMTS16_1 and ADAMTS16_2, which had lower
importance compared with CD133 (Fig.
S2B). Furthermore, imbalanced RF with CD133, CD166, LGR5, sex
and age were also trained.
Pyrosequencing
Samples treated with sodium bisulfite were used for
pyrosequencing analysis. In the PCR reaction, cytosine was
converted to uracil or thymine in the PCR product, whereas
methylated cytosines remained unchanged. In this part of the study
detection of methylated regions in the sequences of five genes,
ALCAM, PROM1, LgR5, MGMT and ADAMTS16, were focused
upon by pyrosequencing. The average percentage of methylation for
ALCAM was found to be 3% (3% in CpG1, 2% in CpG2 and 4% in
CpG3), whereas for PROM1 it was 6.5% (4% in CpG1, 13% in
CpG2, 3% in CpG3 and 6% in CpG4). For Lgr5, it was 6.25% (8%
in CpG1, 6% in CpG2, 6% in CpG3 and 5% in CpG4). These three stem
cell markers showed hypomethylation in their selected regions
according to pyrosequencing. The average percentage of methylation
for unmethylated and methylated DNA was 6.25% (unmethylated) and
76% (methylated) for ALCAM, 7.5% (unmethylated) and 88%
(methylated) for PROM1 and 8% (unmethylated) and 90%
(methylated) for LgR5. The other two CRC biomarkers
MGMT and ADAMTS16 showed a degree of hypermethylation
in their selected regions according to pyrosequencing analysis. The
average percentage of methylation for MGMT was 22.14% (24%
in CpG1, 20% in CpG2, 17% in CpG3, 18% in CpG4, 20% in CpG5, 21% in
CpG6 and 33% in CpG7) and for ADAMTS16 it was 75% (79% in
CpG1, 72% in CpG2 and 74% in CpG3). The unmethylated and methylated
DNA showed average methylation in MGMT to be 1 unmethylated)
and 94% (methylated), and to be 3.3 (unmethylated) and 93%
(methylated) in ADAMTS16, respectively. ADAMTS16
methylation was found to be markedly higher in MTS samples compared
with that in the PT subpopulations. In addition, PROM1
methylation was significantly higher in the subpopulation without
venous invasion compared with that in the subpopulation with venous
invasion (P=0.049). PROM1 methylation was also significantly
higher in the subpopulation without perineural invasion compared
with that in samples with perineural invasion (P=0.012). In the
subpopulation without lymphatic invasion, PROM1 methylation
was markedly higher compared with that in the population with
lymphatic invasion. For ALCAM methylation, only markedly higher
levels were found in the subpopulation without lymphatic invasion
compared with that in the subpopulation with lymphatic invasion.
Similarly, markedly higher methylation levels of ALCAM were found
in the subpopulation without perineural invasion compared with
those in samples with perineural invasion. No statistical
significance could be found for other categories (Table V).
| Table V.Comparisons of each marker among each
clinicopathological parameter. |
Table V.
Comparisons of each marker among each
clinicopathological parameter.
| A, Grade |
|---|
|
|---|
| Category | ALCAM | CD133 | Lgr5 | MGMT | ADAMTS16 |
|---|
| Low (n=22) | 3.00
(2.75,3.25) | 5.00
(4.50,5.75) | 6.00
(5.50,6.75) | 15 (8,24) | 77 (63,82) |
| High (n=8) | 3.12
(2.69,3.38) | 4.75
(4.44,5.25) | 6.38
(5.88,7.06) | 22 (9,46) | 81 (77,86) |
| P-value | 0.9 | 0.6 | 0.3 | 0.4 | 0.2 |
|
| B, Lymphatic
invasion |
|
| Category | ALCAM | CD133 | Lgr5 | MGMT | ADAMTS16 |
|
| Negative
(n=14) | 3.25
(3.00,3.38) | 5.50
(4.75,6.88) | 6.25
(5.88,6.75) | 13 (8,27) | 78 (76,84) |
| Positive
(n=16) | 3.00
(2.75,3.25) | 4.75
(4.25,5.31) | 6.12
(5.50,7.00) | 15 (9,27) | 77 (63,83) |
| P-value | 0.085 | 0.063 | 0.6 | 0.6 | 0.5 |
|
| C, Venous
invasion |
|
| Category | ALCAM | CD133 | Lgr5 | MGMT | ADAMTS16 |
|
| Negative
(n=20) | 3.00
(3.00,3.25) | 5.25
(4.75,6.25) | 6.25
(5.50,7.00) | 23 (8,42) | 77 (73,83) |
| Positive
(n=10) | 2.88
(2.75,3.25) | 4.62
(4.06,4.94) | 6.00
(4.94,6.25) | 11 (8,15) | 80 (66,84) |
| P-value | 0.6 | 0.049 | 0.2 | 0.1 | 0.7 |
|
| D, Perineural
invasion |
|
| Category | ALCAM | CD133 | Lgr5 | MGMT | ADAMTS16 |
|
| Negative
(n=24) | 3.00
(2.81,3.25) | 5.12
(4.75,6.00) | 6.25
(5.56,7.00) | 15 (8,25) | 78 (68,83) |
| Positive (n=6) | 2.75
(2.50,3.00) | 4.25
(4.00,4.50) | 5.50
(4.75,6.25) | 14 (10,42) | 81 (73,83) |
| P-value | 0.078 | 0.012 | 0.2 | 0.8 | >0.9 |
|
| E, Sidedness of
tumour |
|
| Category | ALCAM | CD133 | Lgr5 | MGMT | ADAMTS16 |
|
| Left (n=11) | 3.12
(3.00,3.25) | 5.25
(4.75,6.62) | 6.00
(5.31,6.50) | 14 (10,23) | 76 (61,79) |
| Right (n=10) | 3.00
(3.00,3.25) | 4.75
(4.50,5.50) | 6.25
(5.75,6.25) | 33 (15,50) | 77 (73,79) |
| P-value | >0.9 | 0.6 | 0.6 | 0.11 | 0.6 |
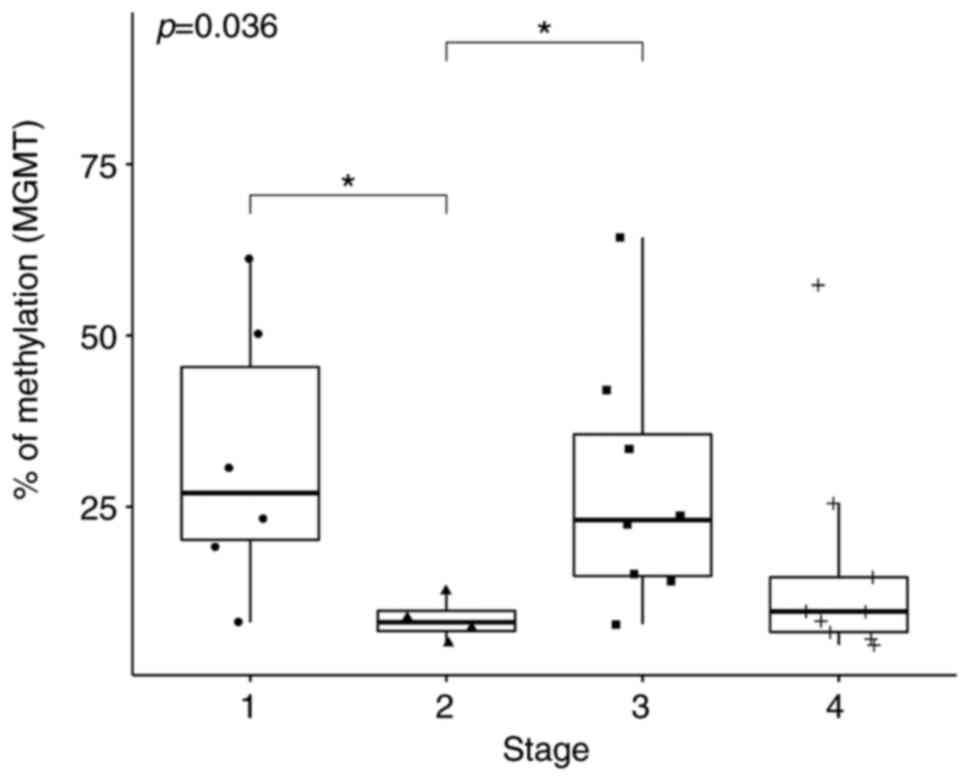
Following the application of Kruskal-Wallis test on
the median expression levels of MGMT at TNM stages 1-4, the
null hypothesis was rejected (P=0.036; Fig. 4). In total, two of the Dunn's post
hoc comparisons were statistically significant. Specifically,
MGMT methylation at TNM stage 1 was statistically
significantly higher compared with that at Stage 2 (P=0.02) whereas
the extent of MGMT methylation at Stage 3 was significantly
higher compared with that at Stage 2 (P=0.03; Table III). For PROM1,
Kruskal-Wallis test of the four TNM stages only yielded a weak
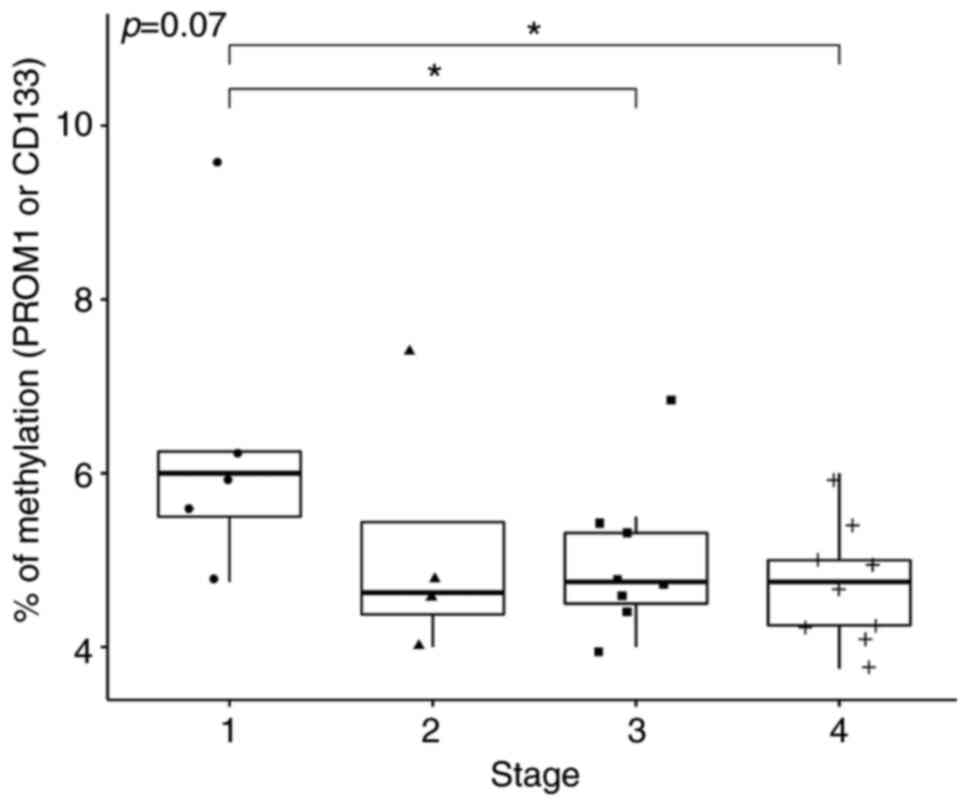
significance (P=0.070; Fig. 5).
According to Dunn's post hoc test, the median methylation of
PROM1 at Stage 1 was significantly higher compared with that
at Stages 3 (P=0.05) and 4 (P=0.01; Table III).
Patients/tissue specimens
There was a significant association between Sex and
the origin of the tumor (P=0.042; Table VI). The median population age was
also found to be significantly higher in the PT group compared with
that in the MTS group (P=0.041; Table
VI). Frequency distribution of tissues among the TNM stages was
also significantly associated with that of tumor origin
(P<0.001; Table VI). Sidedness
of tumors (Left or Right) was significantly associated with sex
(P=0.008; Table VI) and with MMR
status (P=0.012; Table VI). In
addition, the four TNM histological stages were found to
significantly associate with sex (P=0.021; Table VII), with lymphatic invasion
(P<0.001) and with venous invasion (P=0.048) but not with age
(Table VII). TNM staging also
associated significantly with the origin of tumor (P<0.001),
CD133 (P=0.034) and MGMT (P=0.036) but not with PROM1 (P=0.070;
Table VII).
| Table VI.Assessment of association between
origin of tumor and each clinicopathological parameter. |
Table VI.
Assessment of association between
origin of tumor and each clinicopathological parameter.
| Parameter | Metastasis
(n=9) | Primary tumor
(n=21) | P-value | Right-side tumor
(n=11) | Left-side tumor
(n=10) | P-value |
|---|
| Sex |
|
| 0.042 |
|
| 0.008 |
|
Male | 8 (89) | 9 (43) |
| 8 (73) | 1 (10) |
|
|
Female | 1 (11) | 12 (57) | | 3 (27) | 9 (90) |
|
| Age | 68 (60,71) | 73 (65,77) | 0.041 | 73 (65,76) | 74 (70,78) | 0.5 |
| Stage |
|
| <0.001 | | | 0.4 |
| 1 | 0 (0) | 7 (33) |
| 2 (18) | 5 (50) |
|
| 2 | 0 (0) | 4 (19) |
| 3 (27) | 1 (10) |
|
| 3 | 0 (0) | 9 (43) |
| 5 (45) | 4 (40) |
|
| 4 | 9 (100) | 1 (4.8) |
| 1 (9.1) | 0 (0) |
|
| Mismatch
repair |
|
| >0.9 |
|
| 0.012 |
|
Deficient | 0 (0) | 5 (24) |
| 0 (0) | 5 (50) |
|
|
Proficient | 3 (100) | 16 (76) |
| 11 (100) | 5 (50) |
|
| Table VII.Association between each parameter
and TNM staging. |
Table VII.
Association between each parameter
and TNM staging.
|
| TNM |
|
|---|
|
|
|
|
|---|
| Parameters | 1 | 2 | 3 | 4 | P-value |
|---|
| Sex |
|
|
|
| 0.021 |
|
Male | 2 (29) | 3 (75) | 3 (33) | 9 (90) |
|
|
Female | 5 (71) | 1 (25) | 6 (67) | 1 (10) |
|
| Age | 71 (64,76) | 73 (70,76) | 76 (71,79) | 66 (61,70) | 0.068 |
| Origin of
tumour |
|
|
|
| <0.001 |
|
Metastasis | 0 (0) | 0 (0) | 0 (0) | 9 (90) |
|
| Primary
tumour | 7 (100) | 4 (100) | 9 (100) | 1 (10) |
|
| Lymphatic
invasion |
|
|
|
| <0.001 |
|
Positive | 0 (0) | 0 (0) | 8 (89) | 8 (80) |
|
|
Negative | 7 (100) | 4 (100) | 1 (11) | 2 (20) |
|
| Venous
invasion |
|
|
|
| 0.048 |
|
Positive | 0 (0) | 2 (50) | 2 (22) | 6 (60) |
|
|
Negative | 7 (100) | 2 (50) | 7 (78) | 4 (40) |
|
Discussion
The main aim of the present study was to measure the
expression of three previously reported cancer stem cell markers
CD133, CD166 and Lgr5 in addition to assessing the methylation
status of specific regions of selected genes ALCAM, PROM1, LgR5,
MGMT and ADAMTS1 in a cohort of 30 patients with CRC.
According to the American Institute for Cancer Research (44), Slovakia ranks second in terms of
the incidence of colon cancer worldwide, after Hungary. In
addition, >1.93 million new cases were reported worldwide in
2020 (44). CRC remains to be one
of the most common malignancies worldwide (44). Therefore, deepening the
understanding of CRC physiology and the mechanism underlying CRC
tumor growth and progression is in urgent demand for the
development of novel therapies. A previous ‘stochastic’ model
predicted that every cancer cell in the tumor is equally
tumorigenic (17). However,
subsequent studies have led to the establishment of a more
hierarchical model of cancer, in particular highlighting the
presence of a core population of CSCs (17,33,35).
This model predicts that only specific cell types are responsible
for tumor growth, such that the unsuccessful elimination of this
cell population increases the risk of tumor relapse and formation
of metastases (17). CSCs have
been extensively studied, since they are considered to be the
cancer cell population that is responsible for resistance to
therapy and tumor recurrence. Several cell surface markers were
previously identified alongside stem-like transcriptional factors
for cCSCs (45–47). Their expression was verified mostly
on histological levels and their biological impact was supported
in vitro using tumor sphere formation assays (48,49).
However, CRC carcinogenesis is a complex process that is poorly
understood. This process has been reported to include both genetic
and epigenetic alterations, with DNA methylation serving a
particularly key role in tumor growth and cancer progression
(38,50). Therefore, studies into CRC on
multiple molecular levels are required.
In present study, flow cytometry analysis of
selected surface markers on tumor tissues isolated by surgery was
performed, to measure their levels of expression in CRC. In
addition, the extent of DNA methylation of five selected genes that
have been previously documented to serve a role in CRC
carcinogenesis was measured. The percentage of cells, positive for
CD133, a known stem cell marker for colon CSCs (51), was found to be significantly higher
in cells isolated from metastases compared with that in cells
isolated from primary tumors. The percentage of CD133+
cells detected in tumor tissue (primary or metastatic) was also
higher compared with that reported previously (52). Although the role of CD133 was
initially found to be controversial, a number of clinical studies
reported its value as a possible prognostic marker for the survival
rates of patients with CRC (14,53).
However, more recently CD133 was identified to be a pivotal
if not one of the most prominent cCSC cell markers (53). Park et al (53) examined a cohort of 303 patients and
found that the overall 5-year survival and disease-free survival
were inversely associated with CD133 expression, such that
poorer survival was associated with higher levels of
CD133+ cells. In the present study, the
percentage of CD133+ cells expression also showed
statistically significant differences between the two groups of
samples from lymphatic invasion (samples with positive lymphatic
invasion have significantly higher percentage of CD133+
cells). Therefore, the nature of the regulation of CD133 expression
on an epigenetic level was assessed. Although a statistically
significant association could not be detected between CD133
gene methylation and CD133 protein expression, the results did
indicate that higher (3 and 4) stages of CRC were associated with
increased expression levels of CD133 compared with those in stages
1 and 2. In addition, methylation of CD133 was significantly
decreased from stages 1 to 4. Yi et al (18) previously suggested that the
potential epigenetic mechanism involved in the regulation of
CD133 expression in CRC was by the dysregulation of DNA
hypermethylation of the CD133 gene in CRC cells. In another
study, a high degree of CD133 methylation was found in
GIST48b and GIST882 cells by bisulfite pyrosequencing (16). This previous study also
interrogated human gastrointestinal stromal tumor samples, which
found lower mean CD133 gene methylation percentages in
primary tumors compared with those in the cell lines (16). However, further studies are
necessary to verify this form of regulation of CD133
expression, since other authors have also shown that
CD133+ cells lacked methylation on their corresponding
promoter CpG islands, but were methylated in the cultured cell
lines isolated from human tissues (18,54).
According to study performed by Yi et al (18) hypermethylation patterns of CpG
islands are preserved in cultured cells but are highly
heterogeneous in intact tumors (18). Pellacani et al (54) revealed that CD133 expression is
regulated by DNA methylation only in cell lines in vitro,
where methylation of its promoter correlated inversely with gene
expression (54). The relationship
between DNA methylation and its dynamics is therefore a field that
requires additional experimental exploration to gain further
insights into its mechanism.
Differences in the expression of CD166, another
marker that has been previously found to be associated with CSCs in
CRC (19), was found to be
greater, but not to a level of statistical significance between
primary tumors and metastatic tumors. Similar results were obtained
for Lgr5, another potential stem cell marker (55). Compared with results from previous
studies that utilized flow cytometry for the detection of
Lgr5+ cells (51,55,56),
higher levels of positive cells could be detected in all samples in
the present study. Leng et al (56) previously showed that the
tumorigenicity of isolated cancer cells was restricted to
Lgr5+ populations. In particular, the Lgr5+
CD44+EpCAM+ cell population exhibited more
characteristics typical of the CSC-like phenotype, as predicted
from results from colony formation assays, tumor sphere formation,
tumorigenicity and expression of stem cell markers (Lgr5, CD44,
EpCAM), compared with those in other cell populations
(Lgr5+CD44+EpCAM−,
Lgr5+CD44−EpCAM+,
Lgr5−CD44+EpCAM+ and
Lgr5−CD44−EpCAM-) within CRC (56).
Subsequently, the methylation status of two
biomarkers, MGMT and ADAMTS16, which are frequently
reported to be methylated in CRC (40,57,58),
was examined. Several previous studies have reported that
transcriptional silencing of the MGMT gene in various tumor
types may be one of the causes of hypermethylation in the CpG
islands in a specific promotor region (57–59).
Hypermethylated MGMT genomic regions have been previously
observed in adenomas, in addition to in the non-malignant colonic
mucosa of patients with CRC, where it was found to be associated
with more favorable therapeutic responses following treatment with
alkylating agents (39,60). The present study found that the
MGMT methylation fluctuated among the stages and no clear
trend could be deduced even at higher stages. Lower methylation of
this gene could be found at stages 2 and 4, however. Indeed, the
prognostic role of MGMT remains controversial (38,59,61).
Cancer-specific promoter hypermethylation of
ADAMTS16 has also been proposed to be a viable biomarker for
CRC (40). It is predicted that
changes in DNA methylation contribute to the downregulation of
ADAMTS16 expression, which can result in development of CRC
(40). However, further epigenetic
analyses and functional studies of this component in CRC tumors are
required.
To conclude, flow cytometry analysis of three
cancer stem cell markers was performed in a cohort of 30 patients
with CRC. Positivity for each of the three individual marker was
found to be associated with age, sex, PTs and MTS, TNM stage,
grade, presence of invasions (lymphatic, venous and perineural
invasion) and the sidedness of tumor. Analysis of DNA methylation
in the specified genomic regions of the five CRC biomarkers was
also performed, which revealed the highest level of methylation in
the ADAMTS16 and MGMT genes whilst the lowest level
of methylation was found in the PROM1, Lgr5 and ALCAM
genes. This decrease of methylation in the CD133 gene from
stages 1 to 4 was found to be associated with the trend of
increased CD133 protein expression. Furthermore, tumor tissues from
metastases showed significantly higher expression of CD133 protein
compared with that in primary tumors. Higher levels of
CD133+ cells were associated with TNM stage and the
invasiveness of CRC into the lymphatic system. Although the
significant limitation of the present study was the relatively
small number of samples processed, CD133 marker can be considered
to be important marker in pathology of CRC.
Supplementary Material
Supporting Data
Supporting Data
Acknowledgements
Not applicable.
Funding
The present study was supported by following grants: Research
and Development Support Agency (grant no. APVV 16/0066) and
Ministry of Education, Science, Research and Sport of the Slovak
Republic (grant no. 1/0279/18). The present study was also created
thanks to support of the Operational Programme Integrated
Infrastructure projects no.: IMTS: 313011V446 and ITMS: 313011AFG5,
co-financed by the European Regional Development Fund.
Availability of data and materials
The datasets used and/or analyzed during the
current study are available from the corresponding author on
reasonable request.
Authors' contributions
JS, SM and ZL designed the study. SM, JS and KJ
performed the experiments. MG conducted the statistical analysis.
MK, JM, MV, RK, MP, JJ, PM, LL and EG obtained and handled
colorectal specimens and clinical data. JS, SM, MG, ZL and EM
analyzed the data and were major contributors in writing the
manuscript. MK and JM performed the histological examination of the
samples and clinical data. ZL, JS and EH supervised the entire
study and participated in study design and coordination. SJ and MS
confirm the authenticity of all the raw data. All authors read and
approved the final manuscript.
Ethics approval and consent to
participate
Sample collection and processing protocols were
reviewed and approved by The Ethics Committee of Jessenius Faculty
of Medicine in Martin (approval no. EK 1856/2016; Martin,
Slovakia). All patients signed the informed consent document prior
to surgery.
Patient consent for publication
Not applicable.
Competing interests
The authors declare that they have no competing
interests.
References
|
1
|
Pop MG: Stem cell markers in colon cancer.
Basic Princ Pract Surg. 2019.
|
|
2
|
Coppedè F, Lopomo A, Spisni R and Migliore
L: Genetic and epigenetic biomarkers for diagnosis, prognosis and
treatment of colorectal cancer. World J Gastroenterol. 20:943–956.
2014. View Article : Google Scholar
|
|
3
|
Orjuela S, Menigatti M, Schraml P,
Kambakamba P, Robinson MD and Marra G: The DNA hypermethylation
phenotype of colorectal cancer liver metastases resembles that of
the primary colorectal cancers. BMC Cancer. 20:2902020. View Article : Google Scholar : PubMed/NCBI
|
|
4
|
de Vogel S, Wouters KA, Gottschalk RW, van
Schooten FJ, de Goeij AF, de Bruïne AP, Goldbohm RA, van den Brandt
PA, Weijenberg MP and van Engeland M: Genetic variants of methyl
metabolizing enzymes and epigenetic regulators: Associations with
promoter CpG island hypermethylation in colorectal cancer. Cancer
Epidemiol Biomarkers Prev. 18:3086–3096. 2009. View Article : Google Scholar : PubMed/NCBI
|
|
5
|
Gupta R, Bhatt LK, Johnston TP and
Prabhavalkar KS: Colon cancer stem cells: Potential target for the
treatment of colorectal cancer. Cancer Biol Ther. 20:1068–1082.
2019. View Article : Google Scholar : PubMed/NCBI
|
|
6
|
Spelt L, Sasor A, Ansari D, Hilmersson KS
and Andersson R: The prognostic role of cancer stem cell markers
for long-term outcome after resection of colonic liver metastases.
Anticancer Res. 38:313–320. 2018.PubMed/NCBI
|
|
7
|
Nosrati A, Naghshvar F, Maleki I and
Salehi F: Cancer stem cells CD133 and CD24 in colorectal cancers in
Northern Iran. Gastroenterol Hepatol Bed Bench. 9:132–139.
2016.PubMed/NCBI
|
|
8
|
Kazama S, Kishikawa J, Kiyomatsu T, Kawai
K, Nozawa H, Ishihara S and Watanabe T: Expression of the stem cell
marker CD133 is related to tumor development in colorectal
carcinogenesis. Asian J Surg. 41:274–278. 2018. View Article : Google Scholar : PubMed/NCBI
|
|
9
|
Schmohl JU and Vallera DA: CD133,
selectively targeting the root of cancer. Toxins (Basel).
8:1652016. View Article : Google Scholar
|
|
10
|
Barzegar Behrooz A, Syahir A and Ahmad S:
CD133: Beyond a cancer stem cell biomarker. J Drug Target.
27:257–269. 2019. View Article : Google Scholar
|
|
11
|
Sahlberg SH, Spiegelberg D, Glimelius B,
Stenerlöw B and Nestor M: Evaluation of cancer stem cell markers
CD133, CD44, CD24: Association with AKT isoforms and radiation
resistance in colon cancer cells. PLoS One. 9:e946212014.
View Article : Google Scholar : PubMed/NCBI
|
|
12
|
Yamamoto S, Tanaka K, Takeda K, Akiyama H,
Ichikawa Y, Nagashima Y and Endo I: Patients with CD133-negative
colorectal liver metastasis have a poor prognosis after
hepatectomy. Ann Surg Oncol. 21:1853–1861. 2014. View Article : Google Scholar
|
|
13
|
Narita M, Oussoultzoglou E, Chenard MP,
Fuchshuber P, Yamamoto T, Addeo P, Jaeck D and Bachellier P:
Predicting early intrahepatic recurrence after curative resection
of colorectal liver metastases with molecular markers. World J
Surg. 39:1167–1176. 2015. View Article : Google Scholar : PubMed/NCBI
|
|
14
|
Chen S, Song X, Chen Z, Li X, Li M, Liu H
and Li J: CD133 expression and the prognosis of colorectal cancer:
A systematic review and meta-analysis. PLoS One. 8:e563802013.
View Article : Google Scholar : PubMed/NCBI
|
|
15
|
Wang K, Xu J, Zhang J and Huang J:
Prognostic role of CD133 expression in colorectal cancer: A
meta-analysis. BMC Cancer. 12:5732012. View Article : Google Scholar : PubMed/NCBI
|
|
16
|
Geddert H, Braun A, Kayser C, Dimmler A,
Faller G, Agaimy A, Haller F and Moskalev EA: Epigenetic regulation
of CD133 in gastrointestinal stromal tumors. Am J Clin Pathol.
147:515–524. 2017. View Article : Google Scholar
|
|
17
|
Fanali C, Lucchetti D, Farina M, Corbi M,
Cufino V, Cittadini A and Sgambato A: Cancer stem cells in
colorectal cancer from pathogenesis to therapy: Controversies and
perspectives. World J Gastroenterol. 20:923–942. 2014. View Article : Google Scholar
|
|
18
|
Yi JM, Tsai HC, Glöckner SC, Lin S, Ohm
JE, Easwaran H, James CD, Costello JF, Riggins G, Eberhart CG, et
al: Abnormal DNA methylation of CD133 in colorectal and
glioblastoma tumors. Cancer Res. 68:8094–8103. 2008. View Article : Google Scholar : PubMed/NCBI
|
|
19
|
Dana H, Marmari V, Mahmoodi G,
Mahmoodzadeh H, Ebrahimi M and Mehmandoost N: CD166 as a stem cell
marker? A potential target for therapy colorectal cancer? J Stem
Cell Res Ther. 1:226–229. 2016.
|
|
20
|
Lugli A, Iezzi G, Hostettler I, Muraro MG,
Mele V, Tornillo L, Carafa V, Spagnoli G, Terracciano L and Zlobec
I: Prognostic impact of the expression of putative cancer stem cell
markers CD133, CD166, CD44s, EpCAM, and ALDH1 in colorectal cancer.
Br J Cancer. 103:382–390. 2010. View Article : Google Scholar : PubMed/NCBI
|
|
21
|
Weichert W, Knösel T, Bellach J, Dietel M
and Kristiansen G: ALCAM/CD166 is overexpressed in colorectal
carcinoma and correlates with shortened patient survival. J Clin
Pathol. 57:1160–1164. 2004. View Article : Google Scholar
|
|
22
|
Dalerba P, Dylla SJ, Park IK, Liu R, Wang
X, Cho RW, Hoey T, Gurney A, Huang EH, Simeone DM, et al:
Phenotypic characterization of human colorectal cancer stem cells.
Proc Natl Acad Sci USA. 104:10158–10163. 2007. View Article : Google Scholar : PubMed/NCBI
|
|
23
|
Darvishi B, Boroumandieh S, Majidzadeh-A
K, Salehi M, Jafari F and Farahmand L: The role of activated
leukocyte cell adhesion molecule (ALCAM) in cancer progression,
invasion, metastasis and recurrence: A novel cancer stem cell
marker and tumor-specific prognostic marker. Exp Mol Pathol.
115:1044432020. View Article : Google Scholar
|
|
24
|
Chen C, Zhao S, Karnad A and Freeman JW:
The biology and role of CD44 in cancer progression: Therapeutic
implications. J Hematol Oncol. 11:642018. View Article : Google Scholar
|
|
25
|
Vincent A, Ouelkdite-Oumouchal A, Souidi
M, Leclerc J, Neve B and Van Seuningen I: Colon cancer stemness as
a reversible epigenetic state: Implications for anticancer
therapies. World J Stem Cells. 11:920–936. 2019. View Article : Google Scholar : PubMed/NCBI
|
|
26
|
Tachezy M, Zander H, Gebauer F, Marx A,
Kaifi JT, Izbicki JR and Bockhorn M: Activated leukocyte cell
adhesion molecule (CD166)-its prognostic power for colorectal
cancer patients. J Surg Res. 177:e15–e20. 2012. View Article : Google Scholar : PubMed/NCBI
|
|
27
|
Levin TG, Powell AE, Davies PS, Silk AD,
Dismuke AD, Anderson EC, Swain JR and Wong MH: Characterization of
the intestinal cancer stem cell marker CD166 in the human and mouse
gastrointestinal tract. Gastroenterology. 139:2072–2082.e5. 2010.
View Article : Google Scholar : PubMed/NCBI
|
|
28
|
Han S, Yang W, Zong S, Li H, Liu S, Li W,
Shi Q and Hou F: Clinicopathological, prognostic and predictive
value of CD166 expression in colorectal cancer: A meta-analysis.
Oncotarget. 8:64373–64384. 2017. View Article : Google Scholar
|
|
29
|
Beumer J and Clevers H: Regulation and
plasticity of intestinal stem cells during homeostasis and
regeneration. Development. 143:3639–3649. 2016. View Article : Google Scholar
|
|
30
|
Wu XS, Xi HQ and Chen L: Lgr5 is a
potential marker of colorectal carcinoma stem cells that correlates
with patient survival. World J Surg Oncol. 10:2442012. View Article : Google Scholar
|
|
31
|
Zheng Z, Yu H, Huang Q, Wu H, Fu Y, Shi J,
Wang T and Fan X: Heterogeneous expression of Lgr5 as a risk factor
for focal invasion and distant metastasis of colorectal carcinoma.
Oncotarget. 9:30025–30033. 2018. View Article : Google Scholar
|
|
32
|
Hsu HC, Liu YS, Tseng KC, Hsu CL, Liang Y,
Yang TS, Chen JS, Tang RP, Chen SJ and Chen HC: Overexpression of
Lgr5 correlates with resistance to 5-FU-based chemotherapy in
colorectal cancer. Int J Colorectal Dis. 28:1535–1546. 2013.
View Article : Google Scholar : PubMed/NCBI
|
|
33
|
Wahab SMR, Islam F, Gopalan V and Lam AK:
The identifications and clinical implications of cancer stem cells
in colorectal cancer. Clin Colorectal Cancer. 16:93–102. 2017.
View Article : Google Scholar : PubMed/NCBI
|
|
34
|
Wu W, Cao J, Ji Z, Wang J, Jiang T and
Ding H: Co-expression of Lgr5 and CXCR4 characterizes cancer
stem-like cells of colorectal cancer. Oncotarget. 7:81144–81155.
2016. View Article : Google Scholar
|
|
35
|
Zhou Y, Xia L, Wang H, Oyang L, Su M, Liu
Q, Lin J, Tan S, Tian Y, Liao Q and Cao D: Cancer stem cells in
progression of colorectal cancer. Oncotarget. 9:33403–33415. 2017.
View Article : Google Scholar
|
|
36
|
Jang BG, Kim HS, Chang WY, Bae JM, Kim WH
and Kang GH: Expression profile of LGR5 and its prognostic
significance in colorectal cancer progression. Am J Pathol.
188:2236–2250. 2018. View Article : Google Scholar
|
|
37
|
Alizadeh Naini M, Kavousipour S,
Hasanzarini M, Nasrollah A, Monabati A and Mokarram P:
O6-methyguanine-DNA Methyl transferase (MGMT) promoter methylation
in serum DNA of Iranian patients with colorectal cancer. Asian Pac
J Cancer Prev. 19:1223–1227. 2018.PubMed/NCBI
|
|
38
|
Inno A, Fanetti G, Di Bartolomeo M, Gori
S, Maggi C, Cirillo M, Iacovelli R, Nichetti F, Martinetti A, de
Braud F, et al: Role of MGMT as biomarker in colorectal cancer.
World J Clin Cases. 2:835–839. 2014. View Article : Google Scholar : PubMed/NCBI
|
|
39
|
Cervena K, Siskova A, Buchler T, Vodicka P
and Vymetalkova V: Methylation-based therapies for colorectal
cancer. Cells. 9:15402020. View Article : Google Scholar
|
|
40
|
Kordowski F, Kolarova J, Schafmayer C,
Buch S, Goldmann T, Marwitz S, Kugler C, Scheufele S, Gassling V,
Németh CG, et al: Aberrant DNA methylation of ADAMTS16 in
colorectal and other epithelial cancers. BMC Cancer. 18:7962018.
View Article : Google Scholar : PubMed/NCBI
|
|
41
|
Strnadel J, Woo SM, Choi S, Wang H,
Grendar M and Fujimura K: 3D culture protocol for testing gene
knockdown efficiency and cell line derivation. Bio Protoc.
8:e28742018. View Article : Google Scholar
|
|
42
|
Meršaková S, Holubeková V, Grendár M,
Višňovský J, Ňachajová M, Kalman M, Kúdela E, Žúbor P, Bielik T,
Lasabová Z and Danko J: Methylation of CADM1 and MAL together with
HPV status in cytological cervical specimens serves an important
role in the progression of cervical intraepithelial neoplasia.
Oncol Lett. 16:7166–7174. 2018.
|
|
43
|
R Core Team (2021). R, . A language and
environment for statistical computing. R Foundation for Statistical
Computing; Vienna, Austria: https://www.R-project.org/
|
|
44
|
World Cancer Research Fund International,
. Colorectal cancer statistics. https://www.wcrf.org/cancer-trends/colorectal-cancer-statistics/April
26–2022
|
|
45
|
Horst D, Kriegl L, Engel J, Kirchner T and
Jung A: Prognostic significance of the cancer stem cell markers
CD133, CD44, and CD166 in colorectal cancer. Cancer Invest.
27:844–850. 2009. View Article : Google Scholar
|
|
46
|
Fang C, Fan C, Wang C, Huang Q, Meng W, Yu
Y, Yang L, Hu J, Li Y, Mo X and Zhou Z: Prognostic value of
CD133+ CD54+ CD44+ circulating
tumor cells in colorectal cancer with liver metastasis. Cancer Med.
6:2850–2857. 2017. View Article : Google Scholar : PubMed/NCBI
|
|
47
|
Morgan RG, Mortensson E and Williams AC:
Targeting LGR5 in colorectal cancer: Therapeutic gold or too
plastic? Br J Cancer. 118:1410–1418. 2018. View Article : Google Scholar : PubMed/NCBI
|
|
48
|
Miller TJ, McCoy MJ, Hemmings C, Bulsara
MK, Iacopetta B and Platell CF: The prognostic value of cancer
stem-like cell markers SOX2 and CD133 in stage III colon cancer is
modified by expression of the immune-related markers FoxP3, PD-L1
and CD3. Pathology. 49:721–730. 2017. View Article : Google Scholar : PubMed/NCBI
|
|
49
|
Mărgaritescu C, Pirici D, Cherciu I,
Bărbălan A, Cârtână T and Săftoiu A: CD133/CD166/Ki-67 triple
immunofluorescence assessment for putative cancer stem cells in
colon carcinoma. J Gastrointest Liver Dis. 23:161–170. 2014.
View Article : Google Scholar
|
|
50
|
Pietrantonio F, Perrone F, de Braud F,
Castano A, Maggi C, Bossi I, Gevorgyan A, Biondani P, Pacifici M,
Busico A, et al: Activity of temozolomide in patients with advanced
chemorefractory colorectal cancer and MGMT promoter methylation.
Ann Oncol. 25:404–408. 2014. View Article : Google Scholar
|
|
51
|
Atlasy N, Amidi F, Mortezaee K, Fazeli MS,
Mowla SJ and Malek F: Expression patterns for TETs, LGR5 and BMI1
in cancer stem-like cells isolated from human colon cancer.
Avicenna J Med Biotechnol. 11:156–161. 2019.
|
|
52
|
Wang BB, Li ZJ, Zhang FF, Hou HT, Yu JK
and Li F: Clinical significance of stem cell marker CD133
expression in colorectal cancer. Histol Histopathol. 31:299–306.
2016.
|
|
53
|
Park YY, An CH, Oh ST, Chang ED and Lee J:
Expression of CD133 is associated with poor prognosis in stage II
colorectal carcinoma. Medicine (Baltimore). 98:e167092019.
View Article : Google Scholar : PubMed/NCBI
|
|
54
|
Pellacani D, Packer RJ, Frame FM, Oldridge
EE, Berry PA, Labarthe MC, Stower MJ, Simms MS, Collins AT and
Maitland NJ: Regulation of the stem cell marker CD133 is
independent of promoter hypermethylation in human epithelial
differentiation and cancer. Mol Cancer. 10:942011. View Article : Google Scholar : PubMed/NCBI
|
|
55
|
Dame MK, Attili D, McClintock SD, Dedhia
PH, Ouillette P, Hardt O, Chin AM, Xue X, Laliberte J, Katz EL, et
al: Identification, isolation and characterization of human
LGR5-positive colon adenoma cells. Development. 145:dev1530492018.
View Article : Google Scholar
|
|
56
|
Leng Z, Xia Q, Chen J, Li Y, Xu J, Zhao E,
Zheng H, Ai W and Dong J:
Lgr5+CD44+EpCAM+ strictly defines
cancer stem cells in human colorectal cancer. Cell Physiol Biochem.
46:860–872. 2018. View Article : Google Scholar : PubMed/NCBI
|
|
57
|
Costello JF, Futscher BW, Tano K, Graunke
DM and Pieper RO: Graded methylation in the promoter and body of
the O6-methylguanine DNA methyltransferase (MGMT) gene correlates
with MGMT expression in human glioma cells. J Biol Chem.
269:17228–17237. 1994. View Article : Google Scholar : PubMed/NCBI
|
|
58
|
Qian X, von Wronski MA and Brent TP:
Localization of methylation sites in the human O6-methylguanine-DNA
methyltransferase promoter: Correlation with gene suppression.
Carcinogenesis. 16:1385–1390. 1995. View Article : Google Scholar : PubMed/NCBI
|
|
59
|
Shen L, Kondo Y, Rosner GL, Xiao L,
Hernandez NS, Vilaythong J, Houlihan PS, Krouse RS, Prasad AR,
Einspahr JG, et al: MGMT promoter methylation and field defect in
sporadic colorectal cancer. J Natl Cancer Inst. 97:1330–1338. 2005.
View Article : Google Scholar
|
|
60
|
Fornaro L, Vivaldi C, Caparello C,
Musettini G, Baldini E, Masi G and Falcone A: Pharmacoepigenetics
in gastrointestinal tumors: MGMT methylation and beyond. Front
Biosci (Elite Ed). 8:170–180. 2016. View
Article : Google Scholar : PubMed/NCBI
|
|
61
|
Margison GP, Povey AC, Kaina B and
Santibáñez Koref MF: Variability and regulation of
O6-alkylguanine-DNA alkyltransferase. Carcinogenesis. 24:625–635.
2003. View Article : Google Scholar : PubMed/NCBI
|