Introduction
Cancer is one of the leading causes of death
worldwide. Liver cancer has risen from the third highest
cancer-related mortality rate in 2018 to the second highest-related
cancer mortality rate in 2020 (1).
Globally, liver cancer is the most common fatal malignant tumor. In
all cases of liver cancer, more than 90% are hepatocellular
carcinoma (HCC) (2). Patients
diagnosed for advanced HCC result in poor prognosis. At present,
the first-line treatments for advanced HCC are mainly
sorafenib-based treatment in combination with chemotherapy, other
targeted therapy, or immunotherapy (3). However, the treatment efficacy
remains limited. One problem is that the response rate of sorafenib
is significantly low (4). Numerous
approaches have been made to improve the drug efficacy, but
reliable markers to predict the drug response are still needed. In
addition, combination of other anticancer drugs with sorafenib are
also widely studied to improve the HCC treatment; for example,
targeting cancer metabolism has attracted increasing attention in
cancer therapy (5–8).
One of the hallmarks of cancer is the reprogramming
of metabolism (9). Cancer cells
mainly rely on aerobic glycolysis to maintain cell proliferation.
Even in the presence of oxygen, the increase of glucose uptake,
also known as ‘Warburg effect’, is more favorable for cancer cell
proliferation (10,11). Glycogen is one of the important
glucose sources for cancer cells. It is a high molecular weight
branched polysaccharide of glucose, which is the main glucose
storage macromolecule in animals. Glycogen stored in liver is
essential for maintaining blood glucose level (12). Glycogen phosphorylase (GP) is the
key enzyme of glycogen catabolism, which is responsible for the
decomposition of glycogen. There are three isoforms of GP: PYGB,
PYGL and PYGM (13). GP is
activated by phosphorylase kinase and allosteric stimulator
glucose-6-phosphate (G6P) at Ser-14. A previous study revealed that
the absence of PYGL leads to the increase of reactive oxygen
species clusters, cell aging and death (14). In glucose starvation-resistant
pancreatic cancer cells, PYGB is a necessary condition for
resistance. Inhibition or loss of PYGB leads to cell death
(15). Another study also showed
that knockdown of PYGB gene significantly inhibits proliferation,
invasion and migration of ovarian cancer cells (16). PYGM is usually associated with type
V glycogen storage disease, which is a disorder of carbohydrate
metabolism in skeleton muscle (17). In the present study, it was
demonstrated that PYGB expression was elevated in HCC tumor tissue,
which is associated with poor survival in patients with HCC.
Clinical data analysis also showed that patients with HCC at late
stage have higher PYGB level, which may indicate that PYGB may
correlate with the disease progression. Further Gene Ontology (GO)
analysis revealed that PYGB is involved in neutrophil activation,
cytoplasmic vesicle and coenzyme biding function. Kyoto
Encyclopedia of Genes and Genomes (KEGG) analysis indicated that
PYGB is involved in insulin signaling, where FBP1, CALM1, CAML2,
CAML3 and PHKA2 may have direct interaction with PYGB. Furthermore,
in the in vitro models, HCC cells were inhibited by a GP
inhibitor, CP91149. In the tumor model, combination of CP91149 and
sorafenib produced significant tumor suppression effect.
Collectively, the present study suggested that glycogen metabolism
and GP play important roles in HCC progression and may provide new
therapeutic targets for HCC therapy. It may be also possible to
combine standard antiangiogenic therapy and anti-metabolism therapy
to improve the treatment of HCC.
Materials and methods
Data analysis
The survival curves of PYGB, PYGL, and PYGM in HCC
were analyzed by the online data analysis tool GEPIA (http://gepia.cancer-pku.cn/) (18). The gene expression in pan-cancer,
tumor stage, gene methylation analysis of PYGB, PYGL and PYGM were
performed at The University of Alabama at Birmingham Cancer data
analysis Portal (19) (UALCAN)
(www.ualcan.path.uab.edu/) according to
the website instructions. The dataset TCGA-LIHC and TCGA-Pan-cancer
from study accession phs000178.v11.p8.v11.p8 (20) was used. The welch's t-test was used
for gene expression analysis in HCC and pan-cancer of PYGB, PYGL
and PYGM. The protein 3-D structures were obtained from the Protein
Data Bank (PDB) (www.rcsb.org) (21–23).
The gene mutation analysis was conducted in cBioportal (www.cbioportal.org) (24,25).
The prediction of protein-protein interactions was analyzed in
String database (www.string-db.org) (26). The analysis of receiver operating
characteristic (ROC) curve, GEO data, GO and KEGG were performed by
the online tool Xiantao according to the instructions (https://www.xiantao.love/products). The detailed
analysis methods are listed below:
UALCAN data analysis for gene
expression and clinical clinicopathological factors
The screening conditions set in the present study
were: ‘Enter gene symbol(s): PYGB, PYGL, or PYGM’; ‘TCGA dataset:
Liver HCC’; ‘Explore’. Results of individual cancer stages, age,
sex and tumor grade, methylation and Pan-cancer view will be
revealed under each tab. T-test was used for gene expression by the
website.
GEPIA data analysis for survival
The screening conditions set in the present study
were: ‘survival analysis; Gene: PYGB, PYGL, or PYGM’; ‘Datasets
selection: LIHC’; ‘plot’. Log rank test was used for survival by
the website.
cBioPortal data analysis for gene
mutation
The screening conditions set in the present study
were: ‘Liver HCC (TCGA, PanCancer Atlas)’; ‘query by gene’;
‘patient/case set all samples (372)’; ‘genes: PYGB, PYGL, or PYGM’;
‘submit query’.
STRING data analysis for
protein-protein interactions
The screening conditions set in the present study
were: ‘select Multiple proteins’; ‘Gene list: ACACA, ACACB, AKT1,
CALM1, CALM2, CALM3, CRKL, EIF4EBP1, FBP1, FOXO1, G6PC, HRAS, PCK1,
PCK2, PHKA2, PIK3CD, PIK3R1, PIK3R2, PPP1CA, PPP1CB, PPP1CC,
PRKAA1, PRKAB1, PRKAG1, PRKAR1A, PRKAR2A, PRKCI, PRKCZ, MAPK3,
MAPK9, MAP2K1, PYGB, RHEB, RPS6, SREBF1, SOCS2, SOCS3, FLOT1,
SORBS1, PPARGC1A, PRKAG2’ ‘Organism: Homo sapiens’; ‘search’.
PDB database for protein
structures
The screening conditions set in the present study
were: ‘PYGB, PYGL, PYGM’; ‘Homo sapiens’; ‘search’.
Xiantao data analysis for ROC
curve
The screening conditions set in the present study
were: ‘Bioinformatics tools’; ‘clinical significance’; ‘ROC curve’;
‘project: TCGA-LIHC, sample size 424’; ‘Gene: PYGB, PYGL and PYGM’;
‘confirm’. Website inbuilt R package of pROC (version 1.17.0.1) and
ggplot2 package (version 3.3.3) were used to generate the figures.
For GO and KEGG analysis. ‘Search dataset’; ‘GSE84598’ (27); ‘select tumor or normal samples’;
‘Add to database’; ‘My database’; ‘experiment group: HCC, reference
group: normal liver tissue’; ‘Analysis’; ‘download analysis
results’. Genes with adjusted P<0.05 were subjected to GO and
KEGG analysis: ‘Bioinformatics tools’; ‘Function cluster’; ‘GO/KEGG
analysis’; ‘upload’; ‘Clustering analysis’; ‘GO-BP’, ‘GO-CC’,
‘GO-MF’, and KEGG options were selected to obtain the analyzed
data. Based on these data, genes with adjusted P<0.05 were
selected for preparation of the bubble chart under the function of
‘GO/KEGG’ visualization. Website inbuilt R packages ggplot2 (For
bubble chart, version 3.3.3) and clusterProfile (For data analysis,
Verstion 3.14.3) were used. For the univariate and multivariate cox
hazard analysis: ‘Bioinformatics tools’; ‘Univariate/multi-factor
cox regression’; ‘select TCGA-LIHC, sample size 424, platform
RNAseq, format TPM’; ‘T stage, pathologic stage, histologic grade,
sex, age, PYGB/PYGL/PYGM’; ‘confirm’. Website inbuilt R package
(survival, version 3.2-10).
Cell culture
Human HCC (MHCC97H) cell line was purchased from
Shanghai Yiyan Biological Technology Co., Ltd. Cells were cultured
in Dulbecco's Modified Eagle Medium (DMEM) (C11965500BT; Gibco;
Thermo Fisher Scientific, Inc.) containing 10% fetal bovine serum
(FSP500; Shanghai ExCell Biology, Inc.,) and 1%
penicillin/streptomycin.
Western blot analysis
MHCC97H cells were lysed in cell lysis buffer (cat.
no. P0013; Beyotime Institute of Biotechnology) with protease
inhibitors Cocktail (cat. no. B14001; bimake.com). The lysates were
purified by centrifugation 4°C at 13,800 × g for 15 min. Protein
concentration was determined by Bradford assay. Next, the protein
lysates (20 µg) were separated using SDS-PAGE on an 8% gel.
Subsequently, samples were separated on polyacrylamide gels and
transferred to PVDF membrane, and then blocked with 5% milk at room
temperature for 1 h. Membranes were incubated with primary
antibodies overnight at 4°C. After washing with TBST, the membranes
were incubated with the HRP-conjugated goat polyclonal
anti-mouse/rabbit IgG secondary antibody (anti-mouse: cat. no.
115-035-003; anti-rabbit: cat. no. 111-035-003; both 1:5,000;
Jackson ImmunoResearch Laboratories, Inc.) was incubated at room
temperature for 1 h and processed for western blotting with
chemiluminescence detection (cat. no. BL520B; Biosharp Life
Sciences). Membranes were incubated with the following primary
antibodies: PYGB (1:1,000; cat. no. AB154969; Abcam), PYGL
(1:1,000; cat. no. DF12134; Affinity Biosciences, Ltd.), PYGM
(1:1,000; cat. no. 19716-1-AP; ProteinTech Group, Inc.) and β-actin
(1:5,000; cat. no. A00702-100; GenScript) were used.
Cell proliferation assay
A total of 1×10⁴ cells/well were seeded
in a 96-well plate in a 200-µl culture medium. Cells were placed in
the incubator and cultured at 37°C for 12 h. After cells attached
to the plate, medium containing CP91149 (25, 50, 75 and 100 µM) or
Sorafenib were added to replace the normal culture medium. After
culturing for 48 h, the culture medium was discarded and 100 µl
medium + 10 µl Cell Counting Kit-8 (cat. no. B34304; bimake.com)
were added to each well. After 2 h of incubation in the dark, the
OD value was measured under the wavelength of 450 nm by enzyme
labeling instrument, and the proliferation rate was measured
according to the OD value.
In vivo tumor model
In the in vivo study, 33 female nude mice
were used to establish the human HCC xenograft tumor model, and
finally 6 mice per group were used for the tumor experiment. Mice
were purchased from the GemPharmatech. The mice were kept under the
following housing conditions: 20–24°C, 40–70% humidity, 12h/12h
light/dark cycle, with free access to water and food. The
experiment started when the mice were six-week old, and the average
of body weight was 19–20 g. To establish the tumor models,
5×10⁶ MHCC97H cells in/0.1 ml PBS: Matrigel mix (1:1)
were inoculated subcutaneously on the flank of each mouse under
anesthesia using isoflurane [cat. no. R510-22; Shenzhen Reward Life
Technology Co., Ltd.) (3.0-3.5% for induction and 2.5% for
maintenance)]. The drug treatment started when tumor size reached
~50 mm3. CP91149 (cat. no. S2717; Selleck Chemicals) at
dose of 60 mg/kg per mouse was administered every other day and
sorafenib (cat. no. M1827; Abmole Bioscience Inc.) at dose of 60
mg/kg per mouse was administered daily by gavage. The tumor volume
was calculated using the following equation: 1/2 length ×
width2. Mice were sacrificed by cervical dislocation
when the tumor volume was reaching 1,500 mm3. The tumor
tissues were harvested and fixed in 4% paraformaldehyde for 24 h at
room temperature for further experiments. All animal experiments in
the present study were approved (approval no. 2021-201) by the
Ethics Committee of Binzhou Medical University (Yantai, China).
Immunohistochemistry
Paraffin sections (4-µm thick) were incubated at
65°C for 1.5-2 h, followed with deparaffinization in xylene and
rehydration in descending ethanol series (99, 95 and 70%). Paraffin
sections were then placed in the sodium citrate buffer for antigen
retrieval at full power in microwave for 5 min and then 20% power
for 30 min. Next, paraffin sections were placed at room temperature
for 1 h. Then slides were rinsed in PBS for 5 min × 3 times.
Following incubation with 3% H2O2 solution at
room temperature for 15 min, sections were then rinsed in PBS for 5
min × 3 times. Samples were incubated in 0.2% Triton X-100 at room
temperature for 10 min, then washed in PBS for 5 min × 3 times.
After washing, paraffin sections were blocked with 5% BSA (cat. no.
9048-46-8; Dalian Meilun Biology Technology Co., Ltd.) at 37°C for
45 min-1 h. Sections were incubated with the primary antibody KI67
(1:1,000; cat. no. 27309-1-AP; ProteinTech Group, Inc.) at 4°C
overnight. On the next day, the paraffin sections were rinsed with
PBS for 5 min × 3 times. Subsequently, sections were incubated with
the HRP-conjugated goat anti-rabbit and mouse secondary antibody
polymer according to the DAB kit instructions (kit cat. no.
GK600510; cat. no. Gene Tech Co., Ltd.) at 37°C for 30–45 min and
the paraffin sections were washed with PBS for 5 min × 3 times. DAB
staining solution (kit cat. no. GK600510; Gene Tech Co., Ltd.) was
used for the color development of paraffin sections. The paraffins
were soaked in hematoxylin solution for 3 min, then rinsed under
tap water for 10 min. The sections were differentiated in
hydrochloric alcohol for 10 sec, followed by rinsing under tap
water for 10 min. The dehydration of sections was performed in the
cylinder by the reversed ethanol gradient. The paraffin sections
were sealed by the neutral resin and images were captured using a
light microscope.
Whole-Mount staining
Briefly, the fixed mouse tumor was cut into thin
slices as much as possible. A total of 20 µg/ml of protease K (cat.
no. AG12004; Hunan Aikerui Biological Engineering Co., Ltd.) was
added to permeabilize the tissue. Tissues were blocked at 4°C
overnight with 3% milk. Then, tissues were incubated with the
primary antibody goat anti-mouse CD31 (1:200; AF3628; R&D
Systems, Inc.) at 4°C overnight. The samples were incubated with
0.3% Triton X-100 in PBS at 4°C for 1.5 h, then with 3% milk for
1.5 h at room temperature. Subsequently, the samples were incubated
with the secondary antibody (donkey anti-goat Alex 555; 1:200; cat.
no. A21432; Invitrogen; Thermo Fisher Scientific, Inc.) in the dark
for 2 h at room temperature, and then washed again with 1.5% milk
for 1 h at room temperature. Samples were washed with 0.3% Triton
X-100 in PBS at 4°C overnight and tissues were mounted with
anti-fluorescence quenching agent. Images were captured using a
confocal microscope.
Statistical analysis
The statistics for in vitro and in
vivo experiments were performed using ANOVA followed by
Dunnett's post hoc test. Data were presented as the mean ± SEM.
P<0.05 was considered to indicate a statistically significant
difference. Statistical analysis was performed using GraphPad Prism
version 9.3.1 (471) (GraphPad Software, Inc.).
Results
Expression of PYGB, PYGL and PYGM in
cancer
To evaluate the general expression pattern of GPs,
the expression of the three GPs was compared in different types of
cancer to obtain a general expression pattern. The database UALCAN
was used to analyze the mRNA expression of PYGB, PYGL and PYGM in
tumor and normal tissues. The results showed that PYGB expression
levels were significantly higher in liver HCC (LIHC) compared with
other types of cancer. In addition, there was an increase of PYGB
expression in the HCC compare with normal liver tissue (Fig. S1A). PYGL expression level was
depending on different types of cancer, where there were no
significant changes of PYGL in LIHC (Fig. S1B). Notably, most types of cancer
had markedly low PYGM expression (Fig. S1C). These data showed that PYGB
and PYGL are relatively high expressed, whereas PYGM is low
expressed in most types of cancer. In HCC, PYGB is significantly
increased in tumor tissue, whereas PYGL had no differences and PYGM
showed a nearly detectable expression. This data indicated that
PYGB may play an important role in HCC.
The expression of PYGB, PYGL and PYGM
in HCC
As the expression of PYGB mRNA was increased in HCC
tissue (Fig. 1A), the protein
expression in HCC cells was investigated. PYGB, PYGL, and PYGM were
analyzed in a human HCC cell line (MHCC97H). Western blot analysis
confirmed the high expression of PYGB in a human HCC cell line, but
not PYGL or PYGM (Fig. 1B). As the
gene methylation may be involved in the phosphorylase expression
levels, the methylation level on these isoforms in HCC was
explored. Compared with normal tissues, methylation levels of PYGB
and PYGM are significantly lower in tumor tissues. However, there
was no significant difference of PYGL between tumor tissues and
normal tissues (Fig. 1C). These
data indicated that the high PYGB expression may be due to the low
methylation level, which also implies that epigenetic regulation
may play a role in PYGB gene expression.
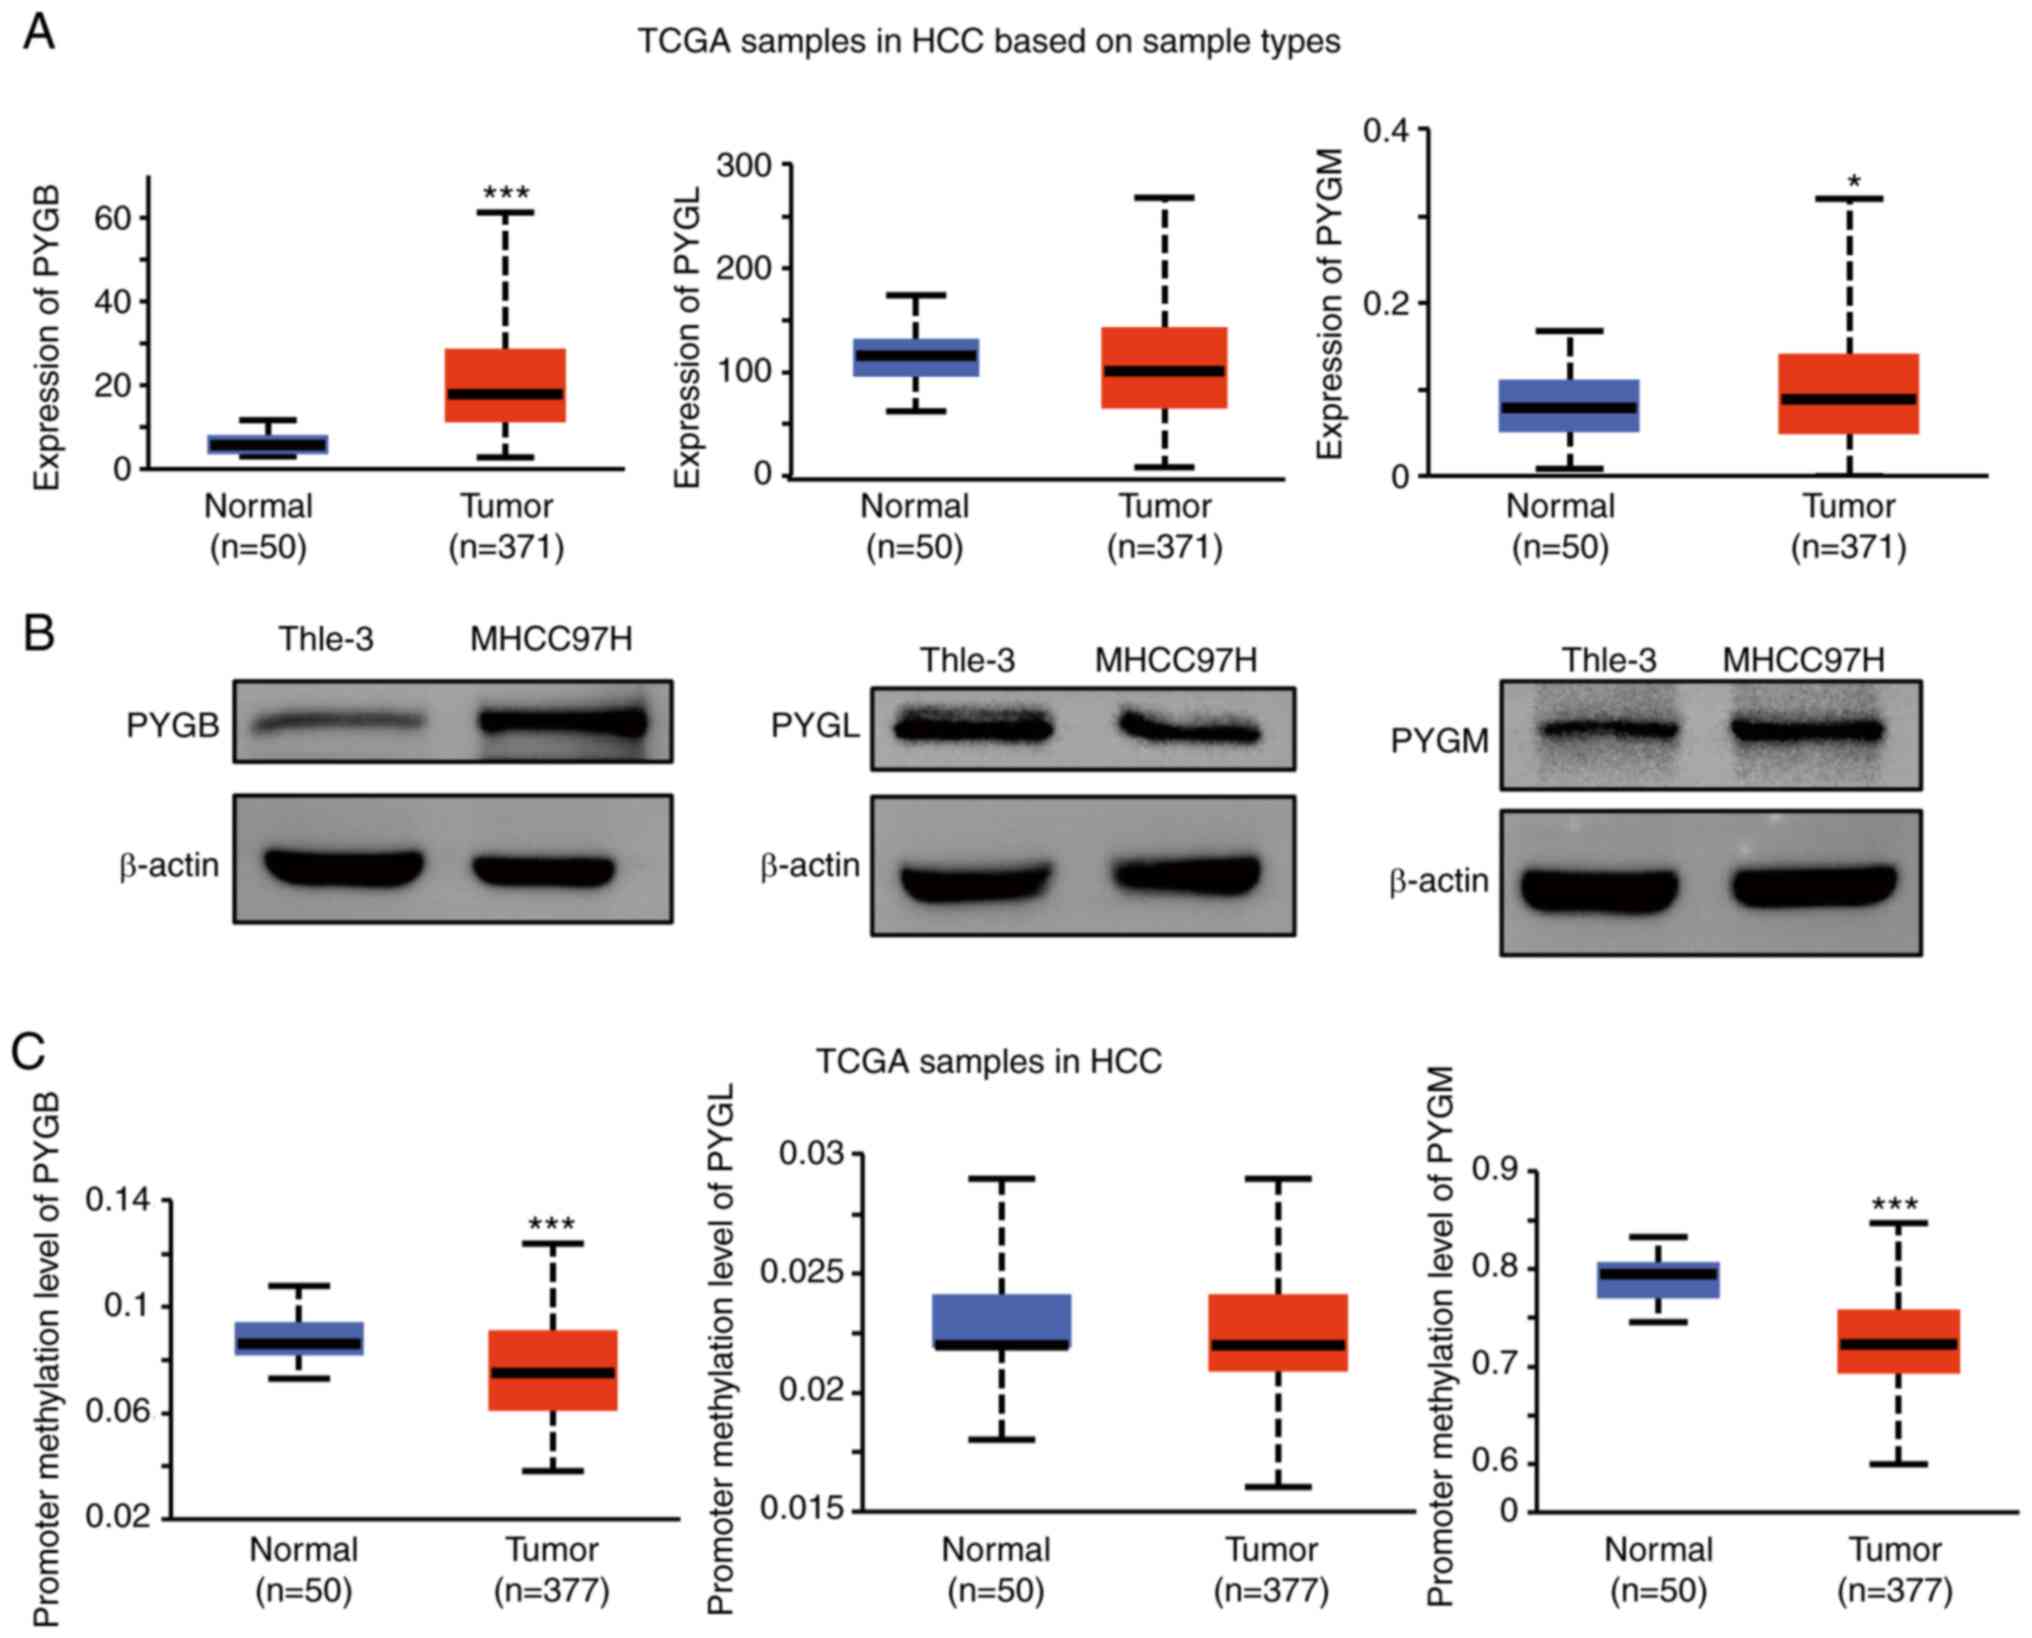 | Figure 1.Analysis of the expression of PYGB,
PYGL and PYGM in HCC. (A) Analysis of PYGB, PYGL and PYGM mRNA
expression in HCC from UALCAN (http://ualcan.path.uab.edu/analysis.html). Dataset
TCGA-LIHC from study accession phs000178.v11.p8 was used. (B)
Analysis of PYGB, PYGL and PYGM protein expression in a human HCC
cell line (MHCC97H) by western blotting. (C) Promoter methylation
level analysis of PYGB, PYGL and PYGM in HCC from UALCAN. The
dataset TCGA-LIHC from study accession phs000178.v11.p8 was used.
*P<0.05, ***P<0.001. PYGB, brain isoform of glycogen
phosphorylase; PYGL, liver form of glycogen phosphorylase; PYGM,
muscle form of glycogen phosphorylase; HCC, hepatocellular
carcinoma; TCGA-LIHC, The Cancer Genome Atlas-liver hepatocellular
carcinoma. |
Gene alterations in PYGB, PYGL and
PYGM in HCC
Since there are few studies on GP in HCC, the
present study focused on the analysis in HCC. The natural 3D
structures of the three isoforms of GPs, retrieved from PDB
database, were compared. Although these isoforms share similar DNA
sequences, the protein structures are not exactly the same,
indicating a slight activity difference of PYGB, PYGL and PYGM
(Fig. S2A). PYGB, PYGL and PYGM
were found to have mutations of 0.5, 0.5 and 1.3% of the sequenced
cases, respectively (data obtained from the OncoPrint schematic of
cBioPortal; Fig. S2B). The data
showed that these mutations include missense mutation, truncating
mutation, amplification and deep deletion. The overall alteration
frequency is ~2.5%, consisting of mutation, amplification and other
multiple alterations (Fig. S2B).
Further analysis showed the mutations in these 3 isoforms. PYGM has
5 mutation sites, whereas both PYGL and PYGB have only one mutation
site (Fig. 2C). These results
indicated that GPs are quite conserved in structure and they have
stable functions.
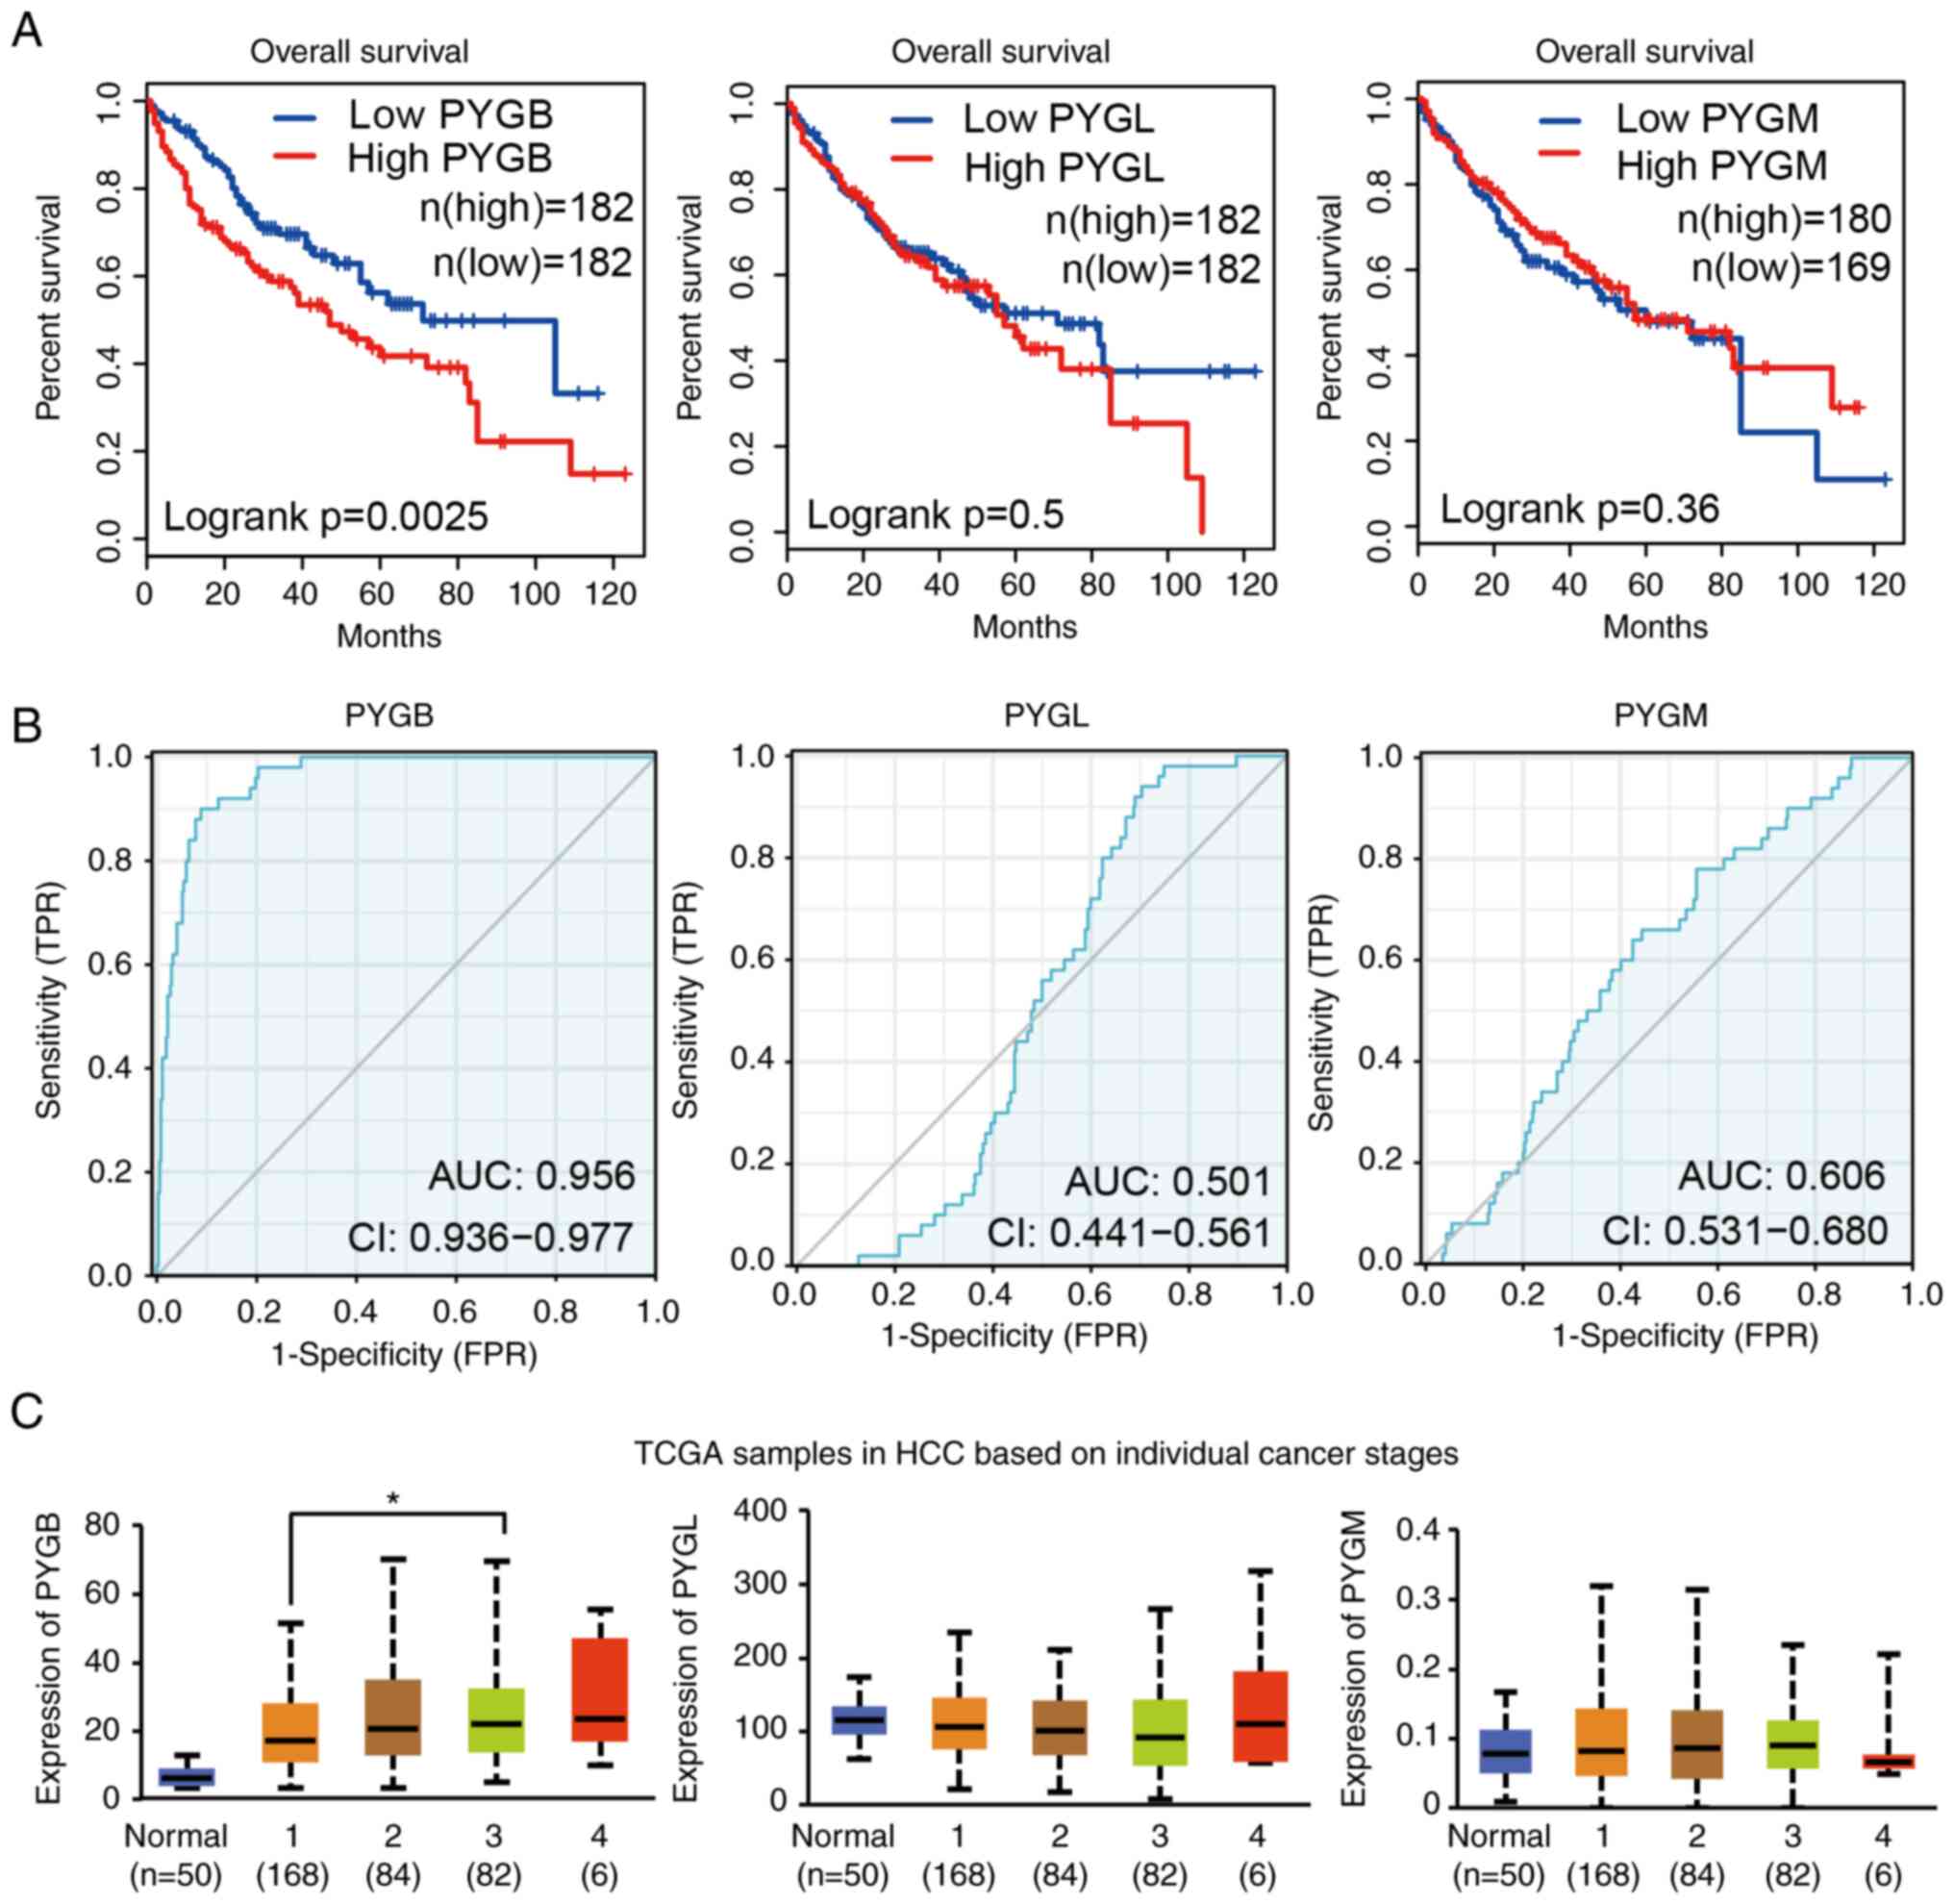
Association of PYGB, PYGL, and PYGM
expression with clinicopathological factors in HCC
To explore the relation between GPs and the
prognosis of patients with HCC, survival of patients with high or
low GP expression was we analyzed by GEPIA. It was identified that
patients with high PYGB expression had poor survival, but the high
expression of PYGL and PYGM had no effect on the survival of
patients with HCC (Fig. 2A). By
using the ROC curve, the distinguishing efficacy of PYGB, PYGL and
PYGM between HCC tissues and normal liver tissue was analyzed. The
area under the curve (AUC) of PYGB was 0.956, suggesting that PYGB
may be a potentially marker for prognosis of patients with HCC
(Fig. 2B), but not PYGL or PYGM.
Analysis of patient individual cancer stage revealed that the PYGB
expression are markedly higher in stage 1–4 [stage classification
is based on American Joint Committee on Cancer pathologic tumor
stage information (19)]. There
was also a trend that PYGB expression increases along with the
stage. PYGB expression in stage 3 showed a significant increase
compared with stage 1. Although stage 4 exhibited the highest PYGB
expression, but it did not reach statistically significant
difference, which may be due to the small number of samples
(Fig. 2C). However, PYGL and PYGM
expression did not exhibit significant changes. Additionally, PYGB
expression was the only isoform to be increased with age of
patients, but not PYGL or PYGM (Fig.
S3A). The sex did not show any association with the expression
of PYGB, PYGL, or PYGM (Fig.
S3B). Regarding the tumor grade, PYGB expression increased in
all the grades, whereas PYGL decreased in stage 4 and no changes
were found in PYGM expression (Fig.
S3C). To analyze if GP could predict the prognosis of patients
with HCC, univariate and multivariate cox hazard analysis was
applied for PYGB, PYGL and PYGM. The data showed that only PYGB
reached statistical significance in associating with prognosis of
patients (Table SI). These data
demonstrated that PYGB is associated with poor survival in patients
with HCC and high level of PYGB may indicate a poor prognosis.
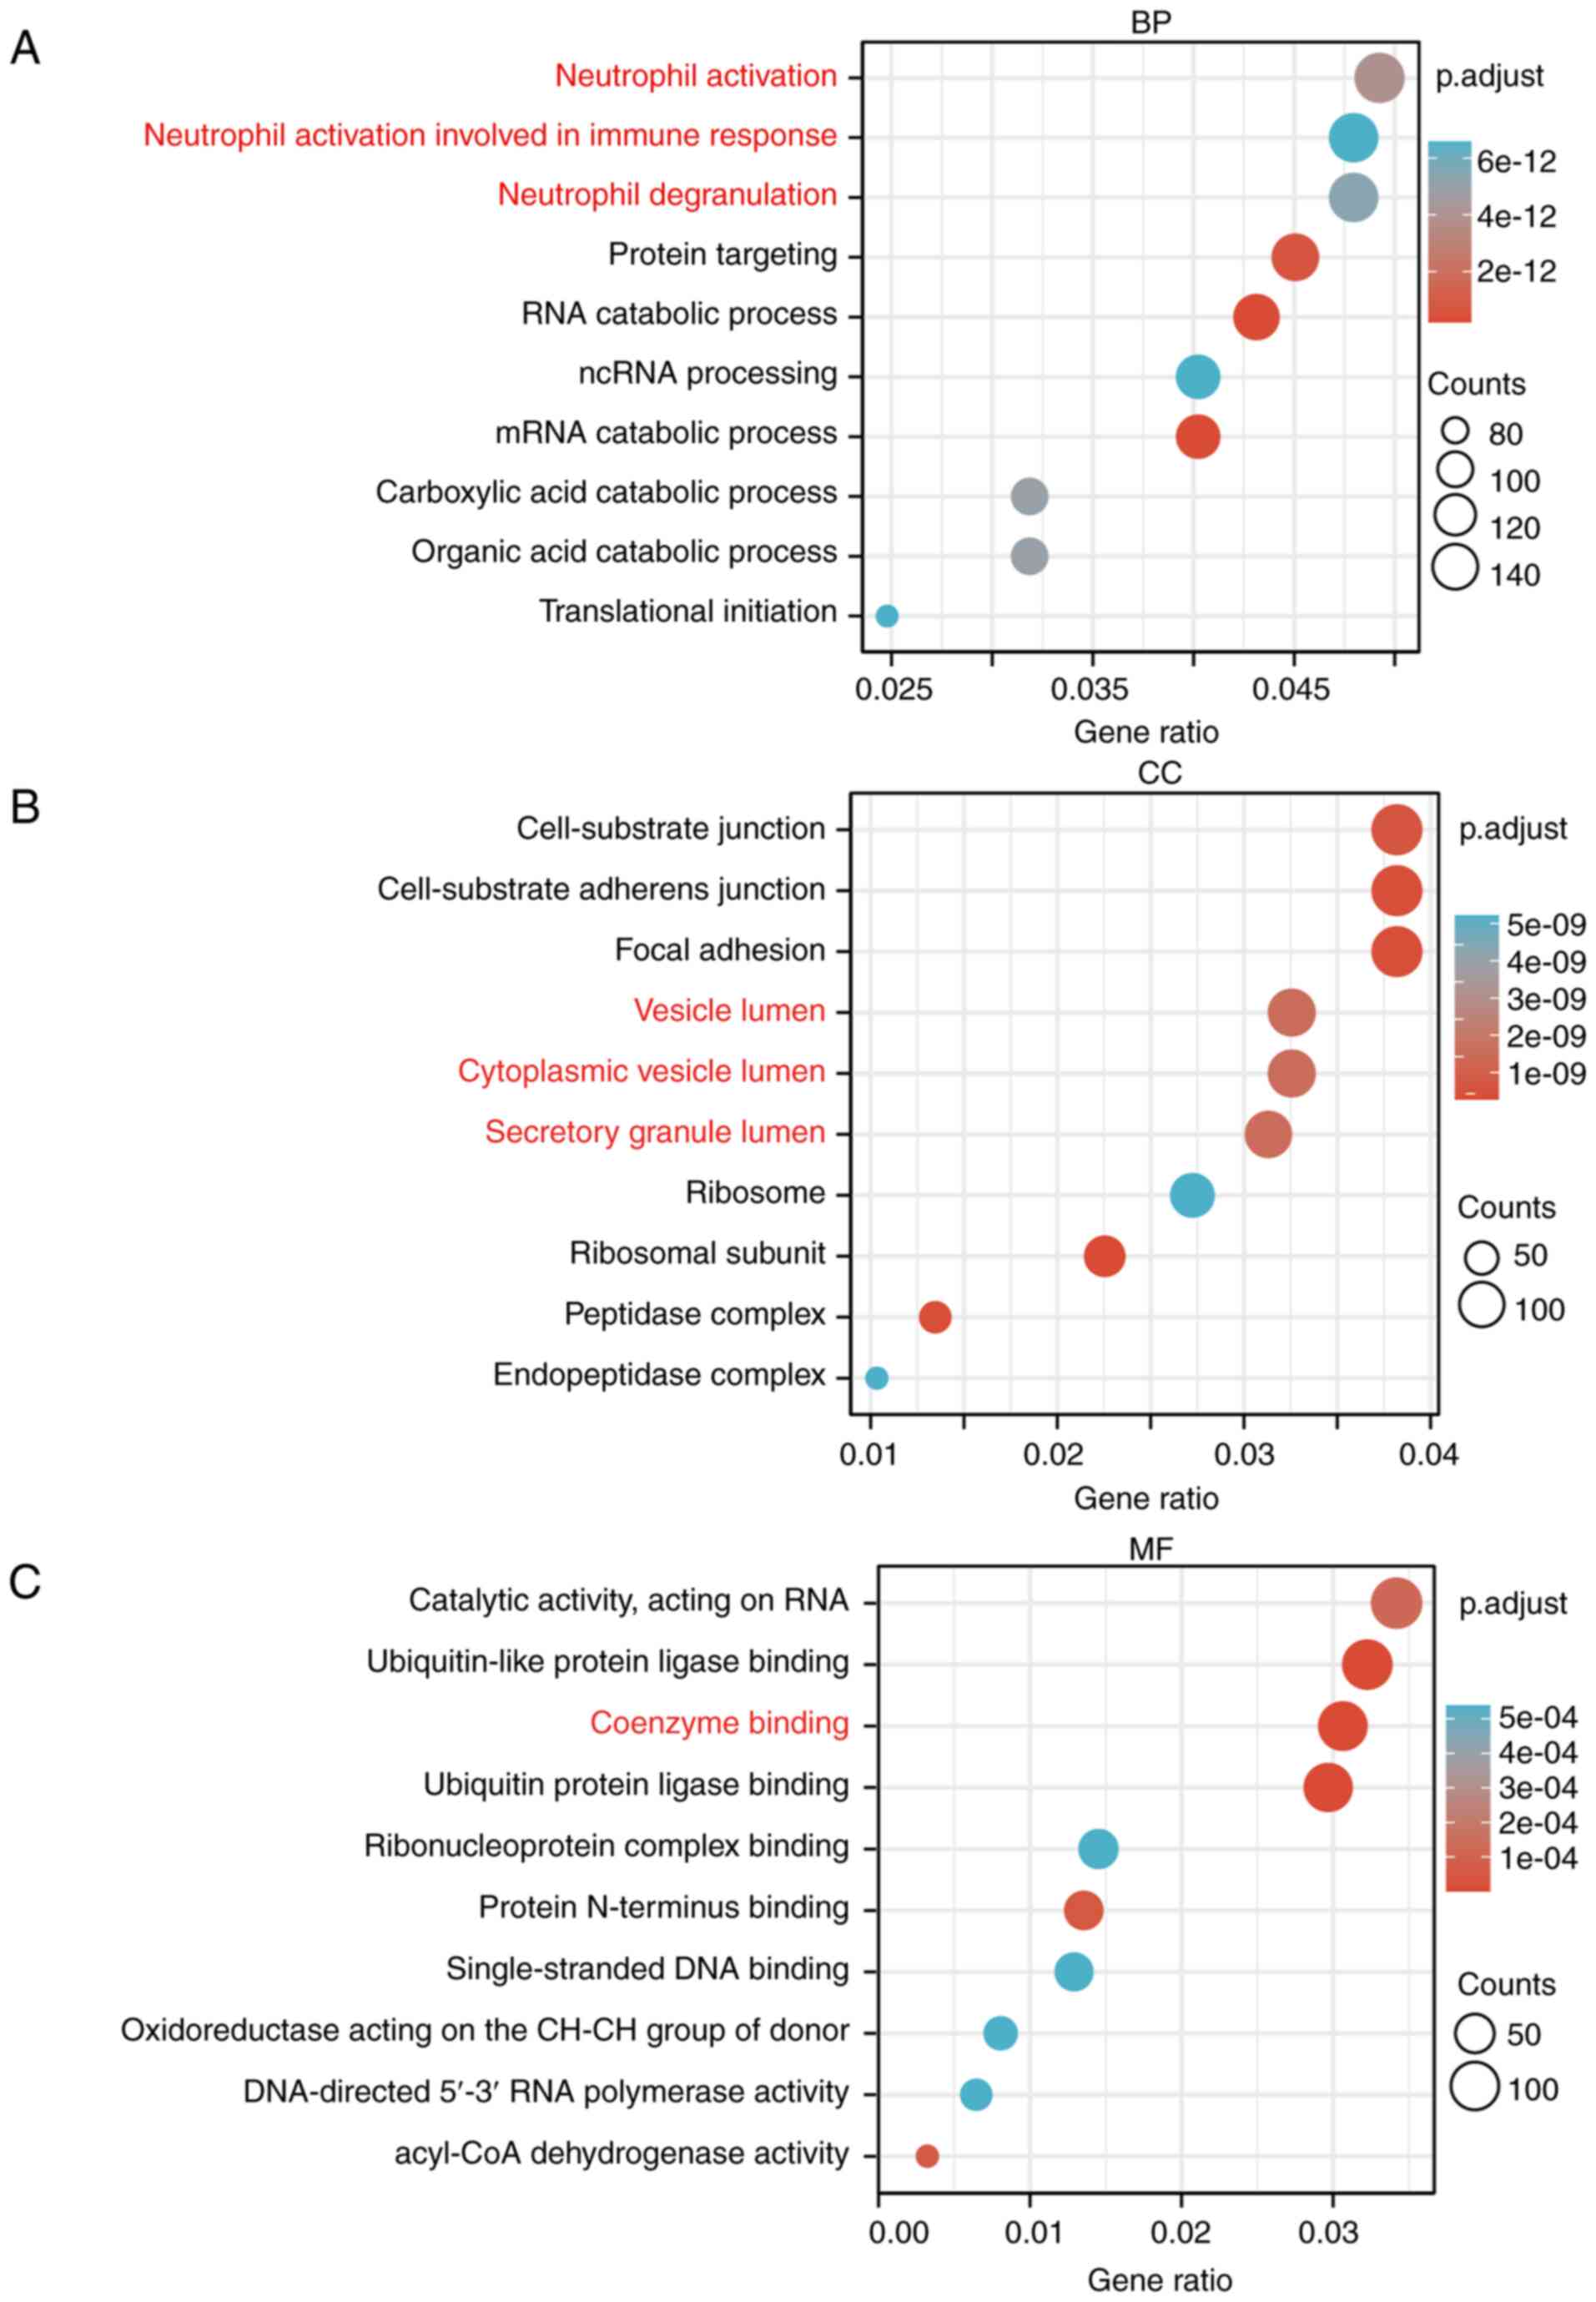
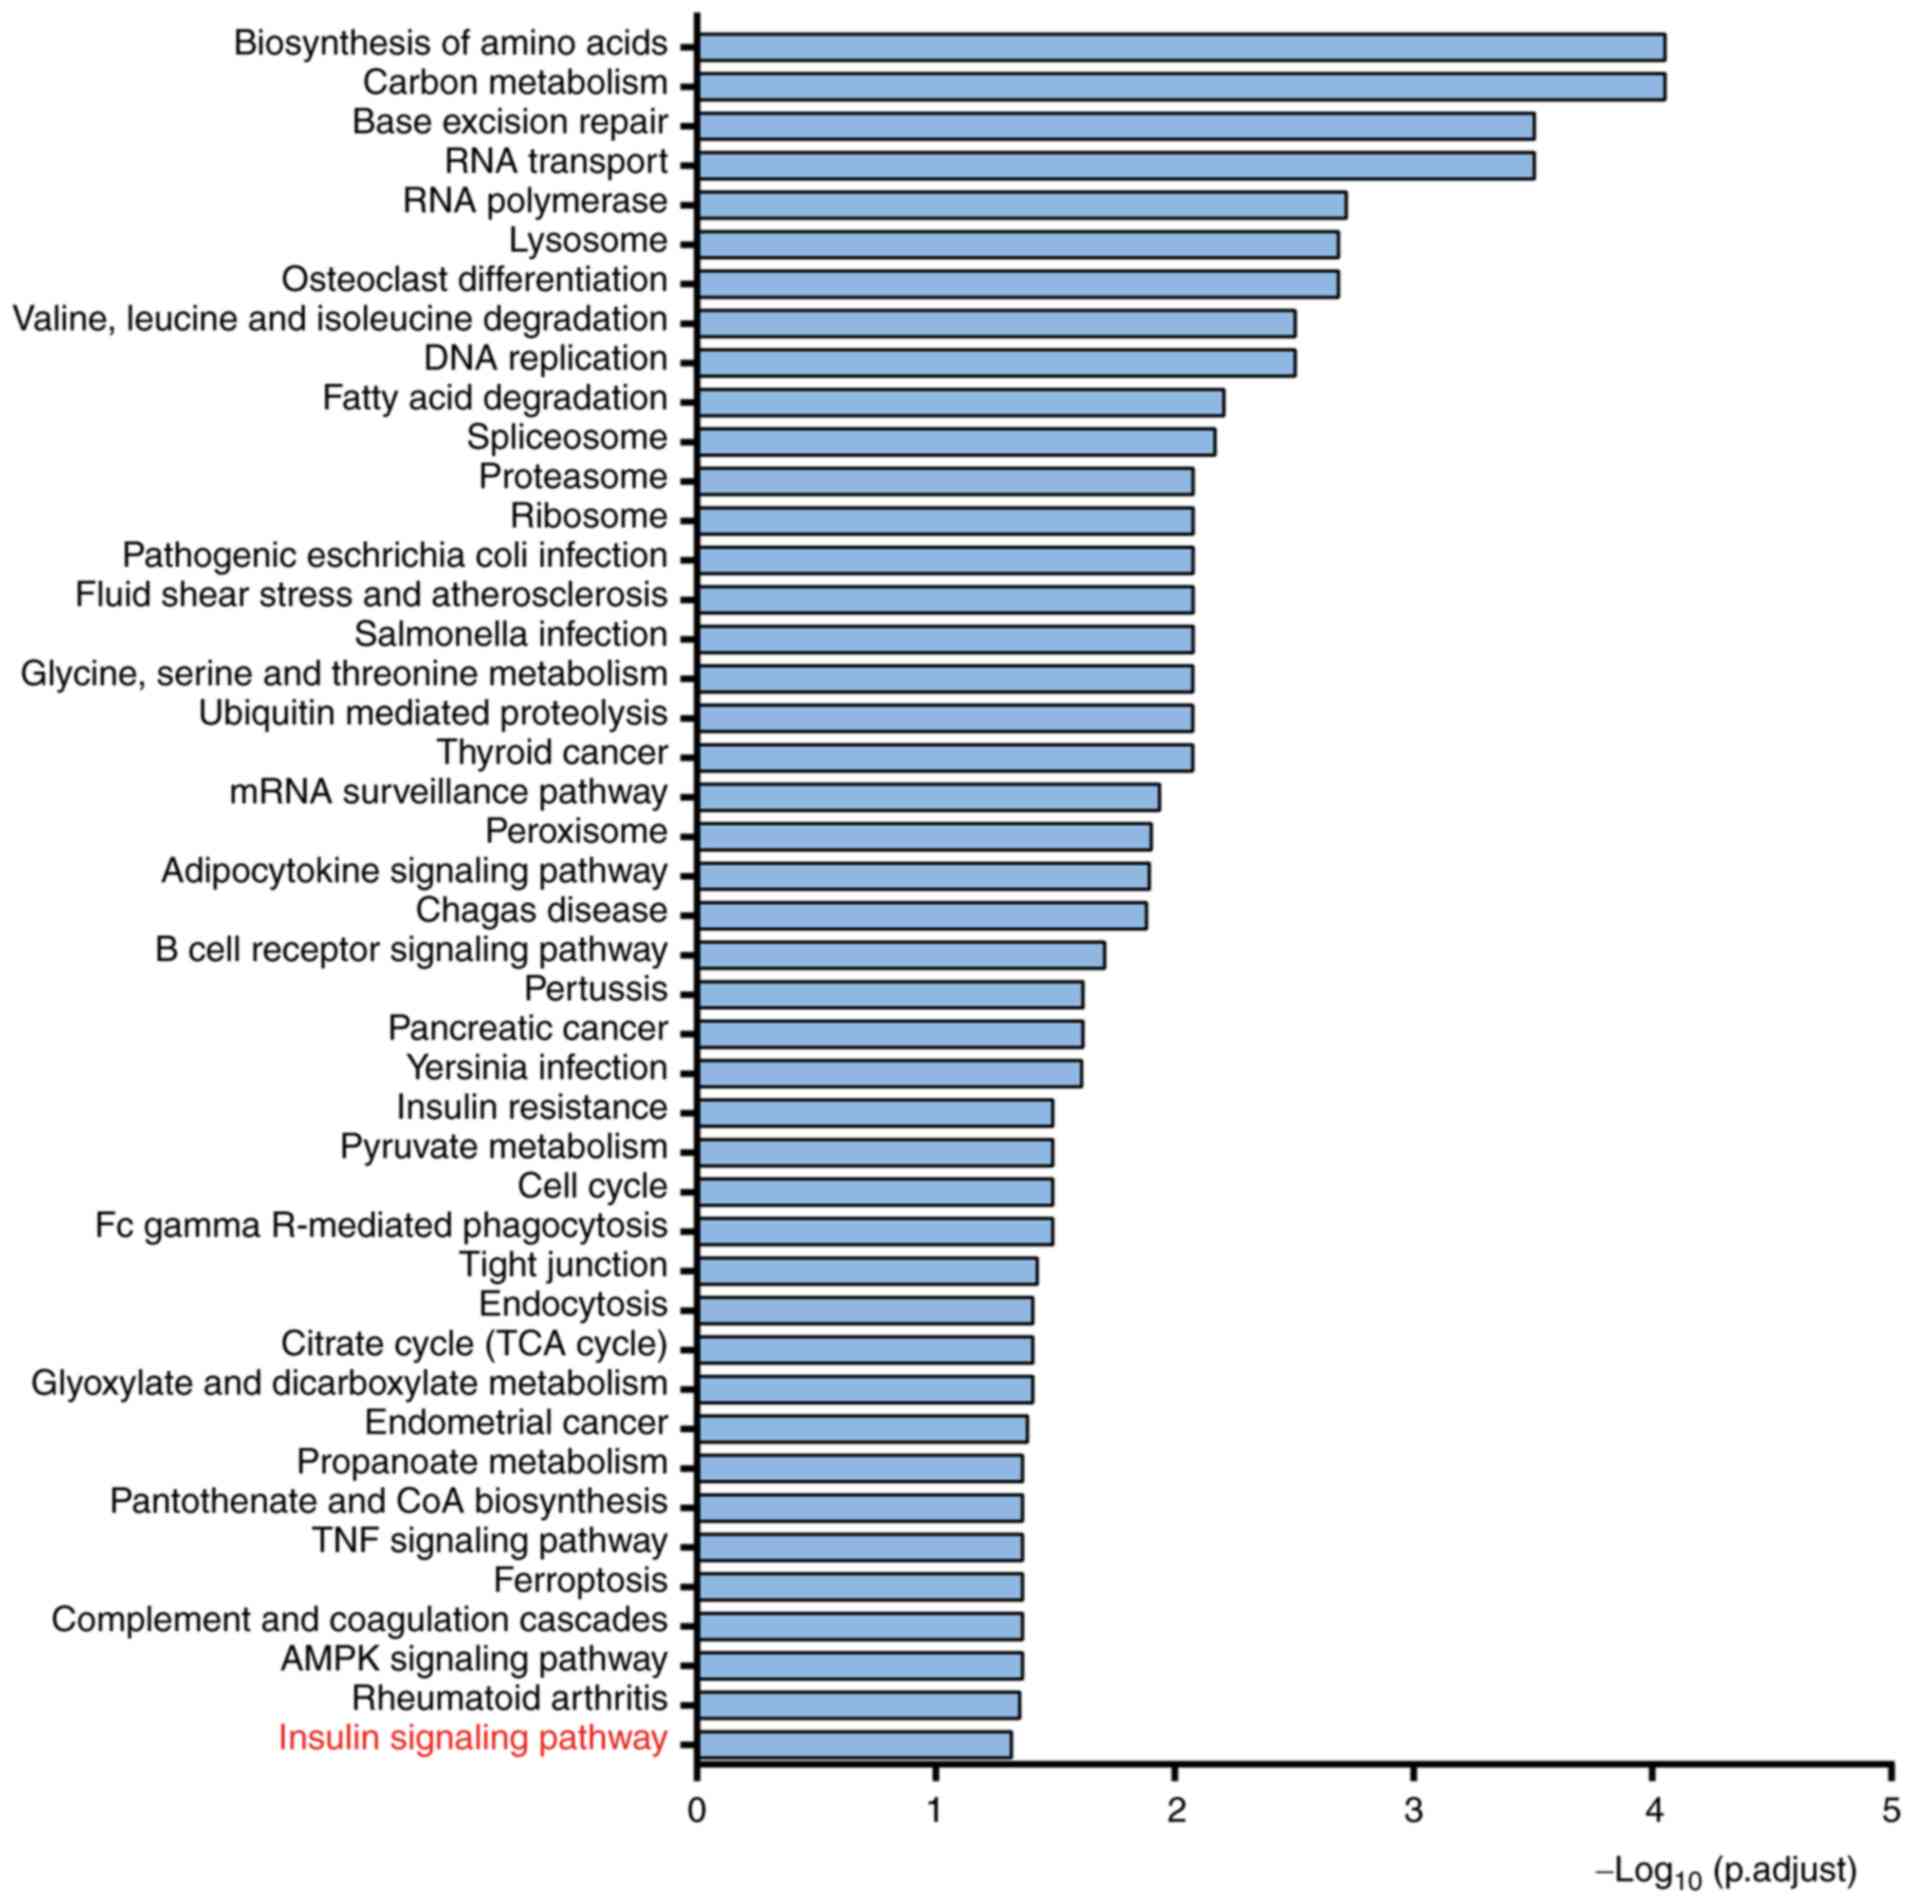
Go and KEGG analysis of PYGB in HCC
datasets
The HCC dataset GSE84598 from GEO database was
analyzed, among which normal liver tissues as well as HCC tissues
were selected for KEGG analysis and GO enrichment analysis,
including biological process, cellular component and molecular
function. A total of 4609 genes from 12581 genes were obtained by
adjusting P<0.05. Biological process analysis identified that
PYGB is involved in neutrophil activation and degranulation.
Cellular components analysis revealed that PYGB participates in
vesicle lumen, cytoplasmic vesicle lumen, and secretory granule
lumen. Molecular function analysis revealed that PYGB is involved
in coenzyme binding (Fig. 3A-C).
KEGG analysis found that PYGB may regulate the insulin signaling
pathway (Fig. 4). These data
suggested possible functions, biological process and signaling
pathways where PYGB plays a role. These results needed to be
further validated in both in vitro and in vivo
models.
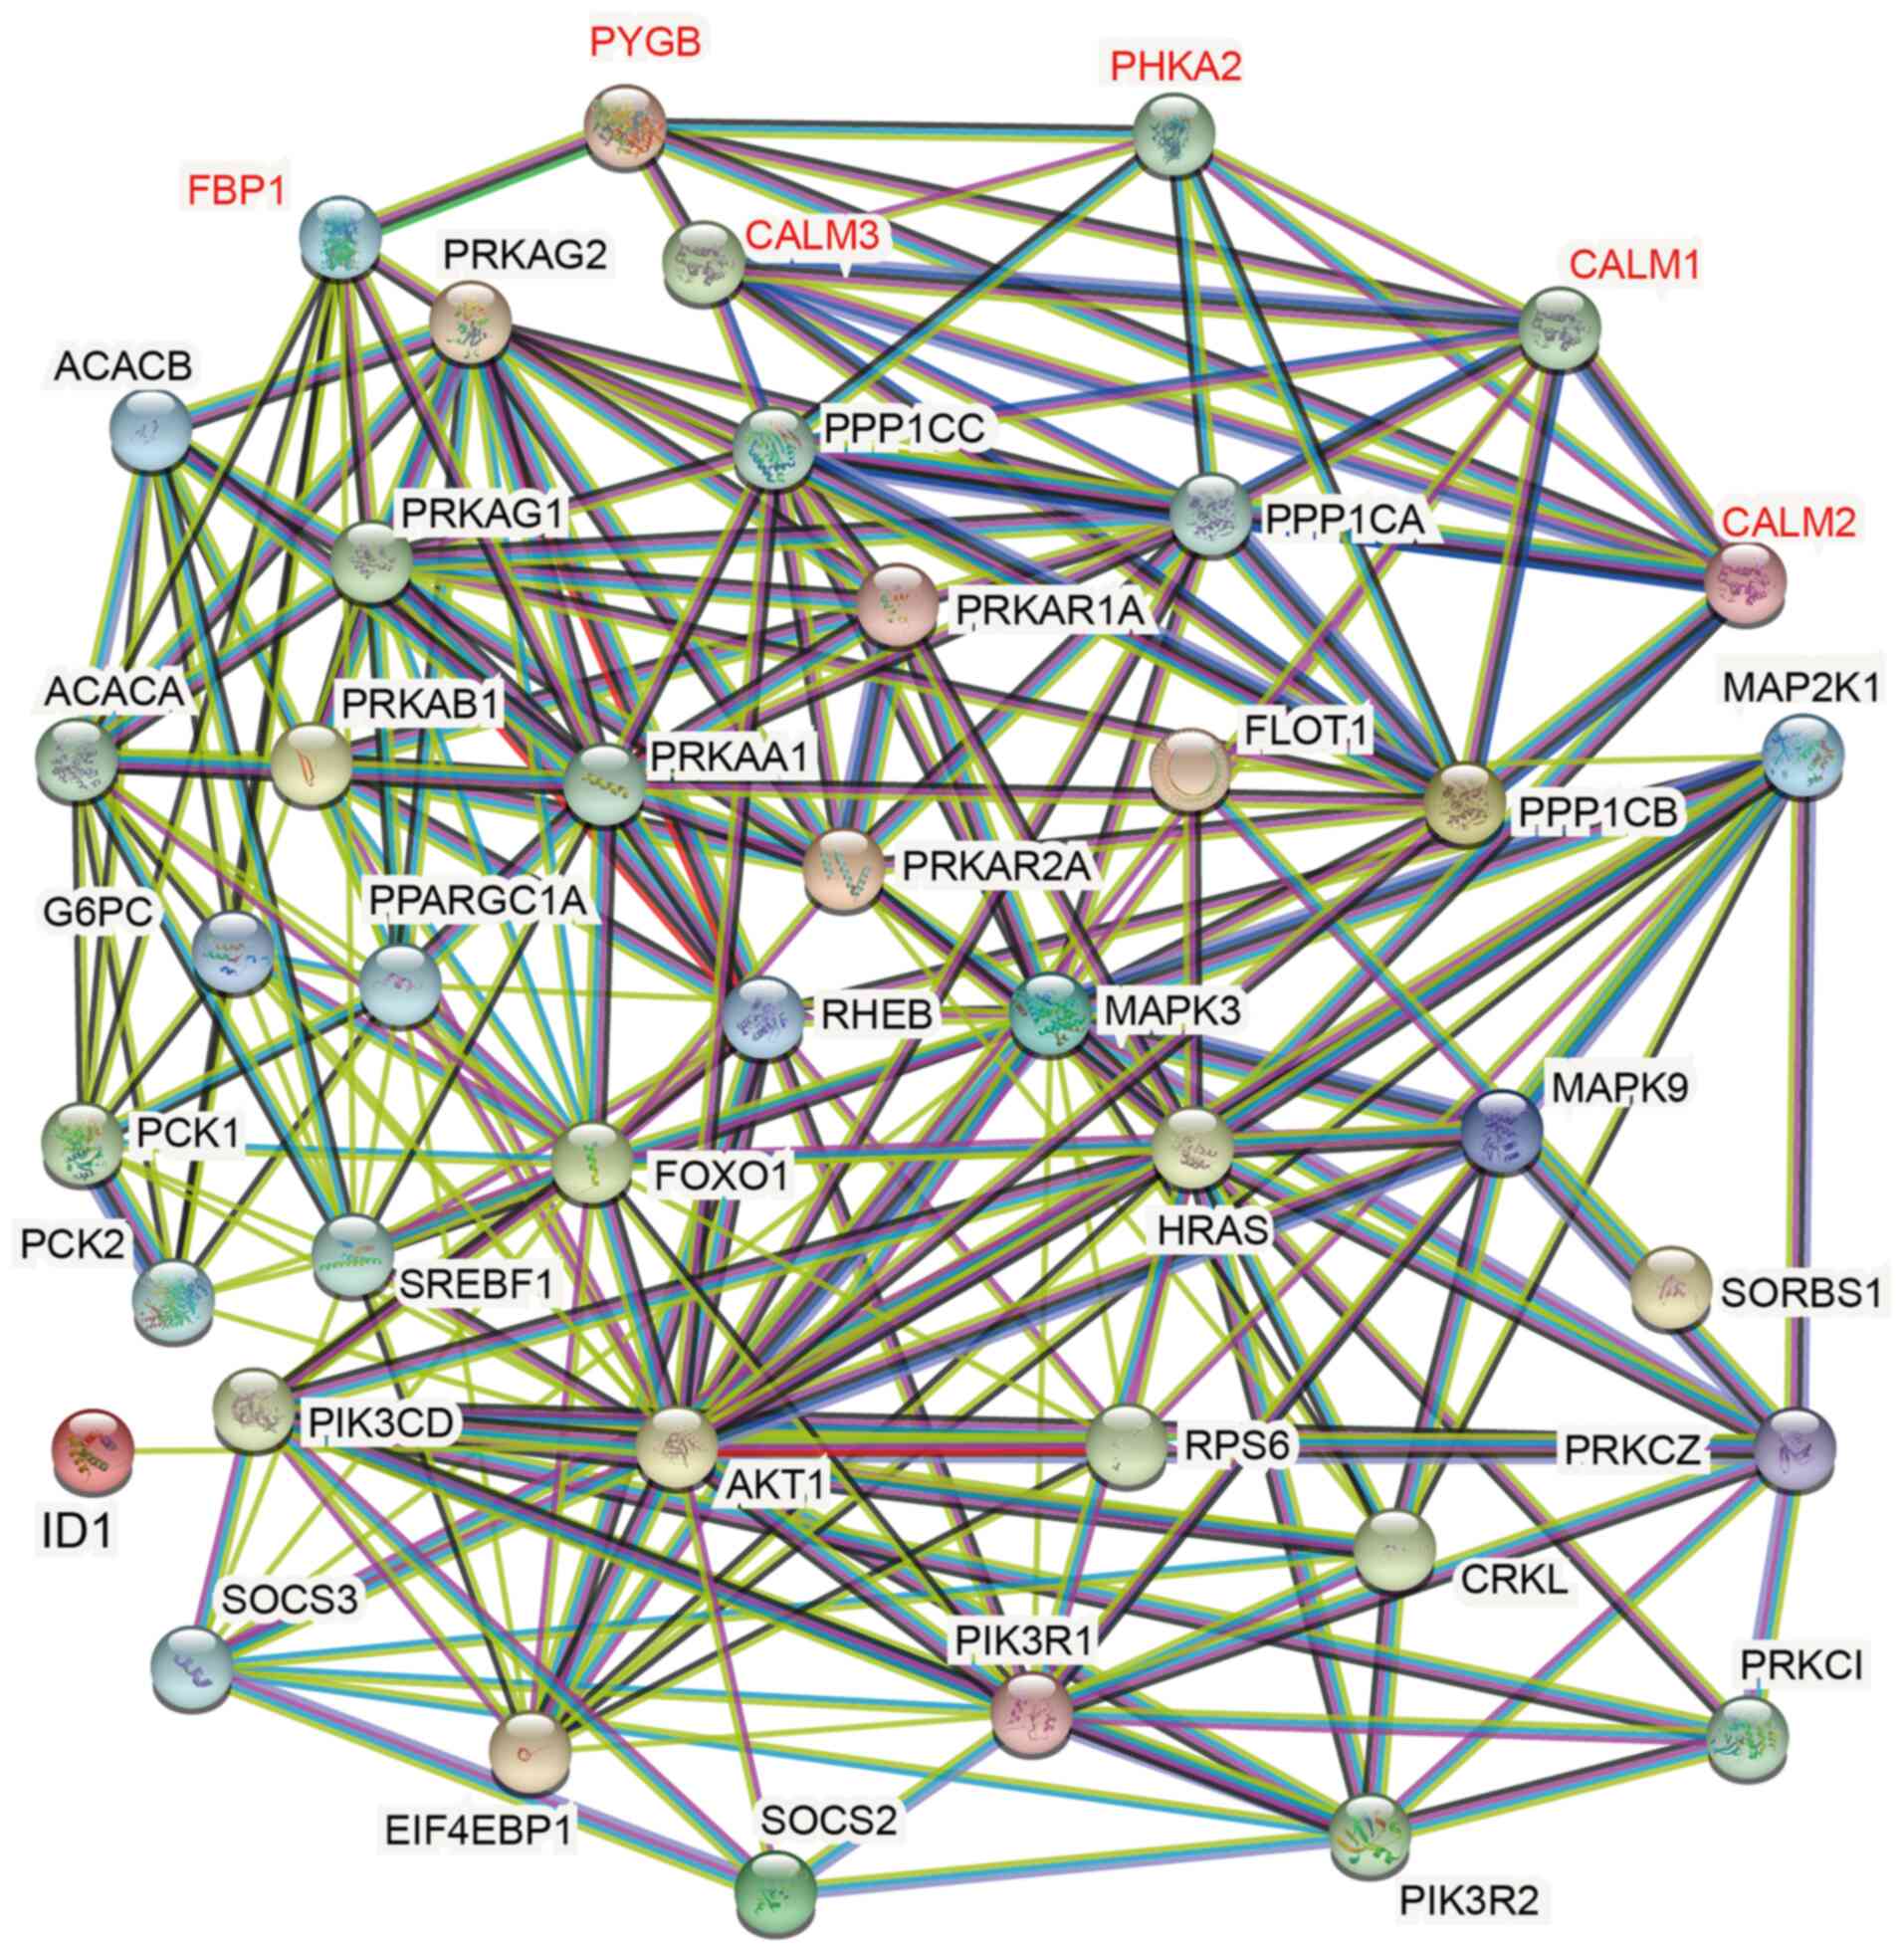
Gene regulatory network is directly
related to PYGB in insulin signaling pathway
Further analysis using String identified 41 proteins
that play a role in the insulin signaling pathway involved in
regulation by PYGB; and five that are directly related to PYGB were
CALM1, CALM2, CALM3, PHKA2 and FBP1 (Fig. 5). CALM1-3 as well as PHKA2 both
belong to phosphatase kinases (28,29).
CALM1-3 is a calmodulin that mediates the control of a large number
of enzymes, ion channels, aquaporins and other proteins through
calcium binding. Among the calmodulin calcium complex-stimulated
enzymes are a number of protein kinases and phosphatases (28,30);
PHKA2 is a phosphorylase b kinase that catalyzes the
phosphorylation of serine in certain substrates. α chain can bind
Calmodulin (29). FBP1, the rate
limiting enzyme in gluconeogenesis, catalyzes the hydrolysis of
fructose 1,6-bisphosphate to sugar 6-phosphate in the presence of
divalent cations and plays a role in regulating glucose sensing and
insulin secretion of pancreatic β-cells and appears to regulate
gluconeogenesis from glycerol in the liver (31), but the specific mechanism in which
PYGB acts needs to be validated by further studies.
Inhibition of PYGB activity suppresses
HCC growth
To verify the role in PYGB in HCC development, the
compound CP91149 was used, which can inhibit GP activity (32) to treat the human HCC cell line
MHCC97H. As revealed in Fig. 6A,
CP91149 could significantly suppress HCC viability in a
dose-dependent manner. As sorafenib is widely used for HCC
treatment, sorafenib was also combined with CP91149 to examine if
there would be a synergistic antitumor effect. Indeed, the
combination therapy produced increasing significant inhibition on
HCC along with the CP91149 dose gradient (Fig. 6B). Next, the result was further
validated in the xenograft mouse tumor model with the human HCC
cell line MHCC97H. Vehicle, CP91149 (60 mg/kg), sorafenib (60
mg/kg) and sorafenib + CP91149 were administered to the
tumor-bearing mice when the tumor started to increase in size.
Combination therapy increased tumor inhibition effect compared with
control or single drug treatment (Fig.
6C-E). Sorafenib at 60 mg/kg did not show tumor inhibition, as
usually the dose at 100 mg/kg can suppress tumors (33) in similar settings (34). Similarly, CP91149 produced no tumor
inhibition effect, which may be due to insufficient effectiveness
of the dose used. As there are no studies on the effectiveness of
CP91149 on HCC tumors, further investigations of the dose effect
are needed. Differences in terms of necrotic area changes in tumor
tissues were not revealed using H&E staining. However,
immunohistochemical analysis showed that the proliferation marker
of Ki67 was decreased in the combination treatment group compared
with the control group, which is consistent with the tumor growth
and tumor weight (Fig. 6F and G).
Surprisingly, the CP91149-treated tumor showed a trend of decreased
blood vessel density, where the combination treatment largely
suppressed vessels. This result indicated that CP91149 may have
potential to induce the inhibition of tumor angiogenesis, and the
combination treatment may further inhibit blood vessels (Fig. 6F and H). Although mono-treatment of
either sorafenib or CP91149 did not produce tumor inhibition,
however, the combination showed significant tumor suppression. This
phenomenon indicatesdthat there may be a synergistic effect due to
the inhibition of glycogen metabolism by CP91149 and tumor
angiogenesis by sorafenib even at relatively low dose. Taken
together, all the aforementioned data indicated that PYGB plays an
important role in HCC growth, and it may be developed as a
therapeutic target for treatment of HCC.
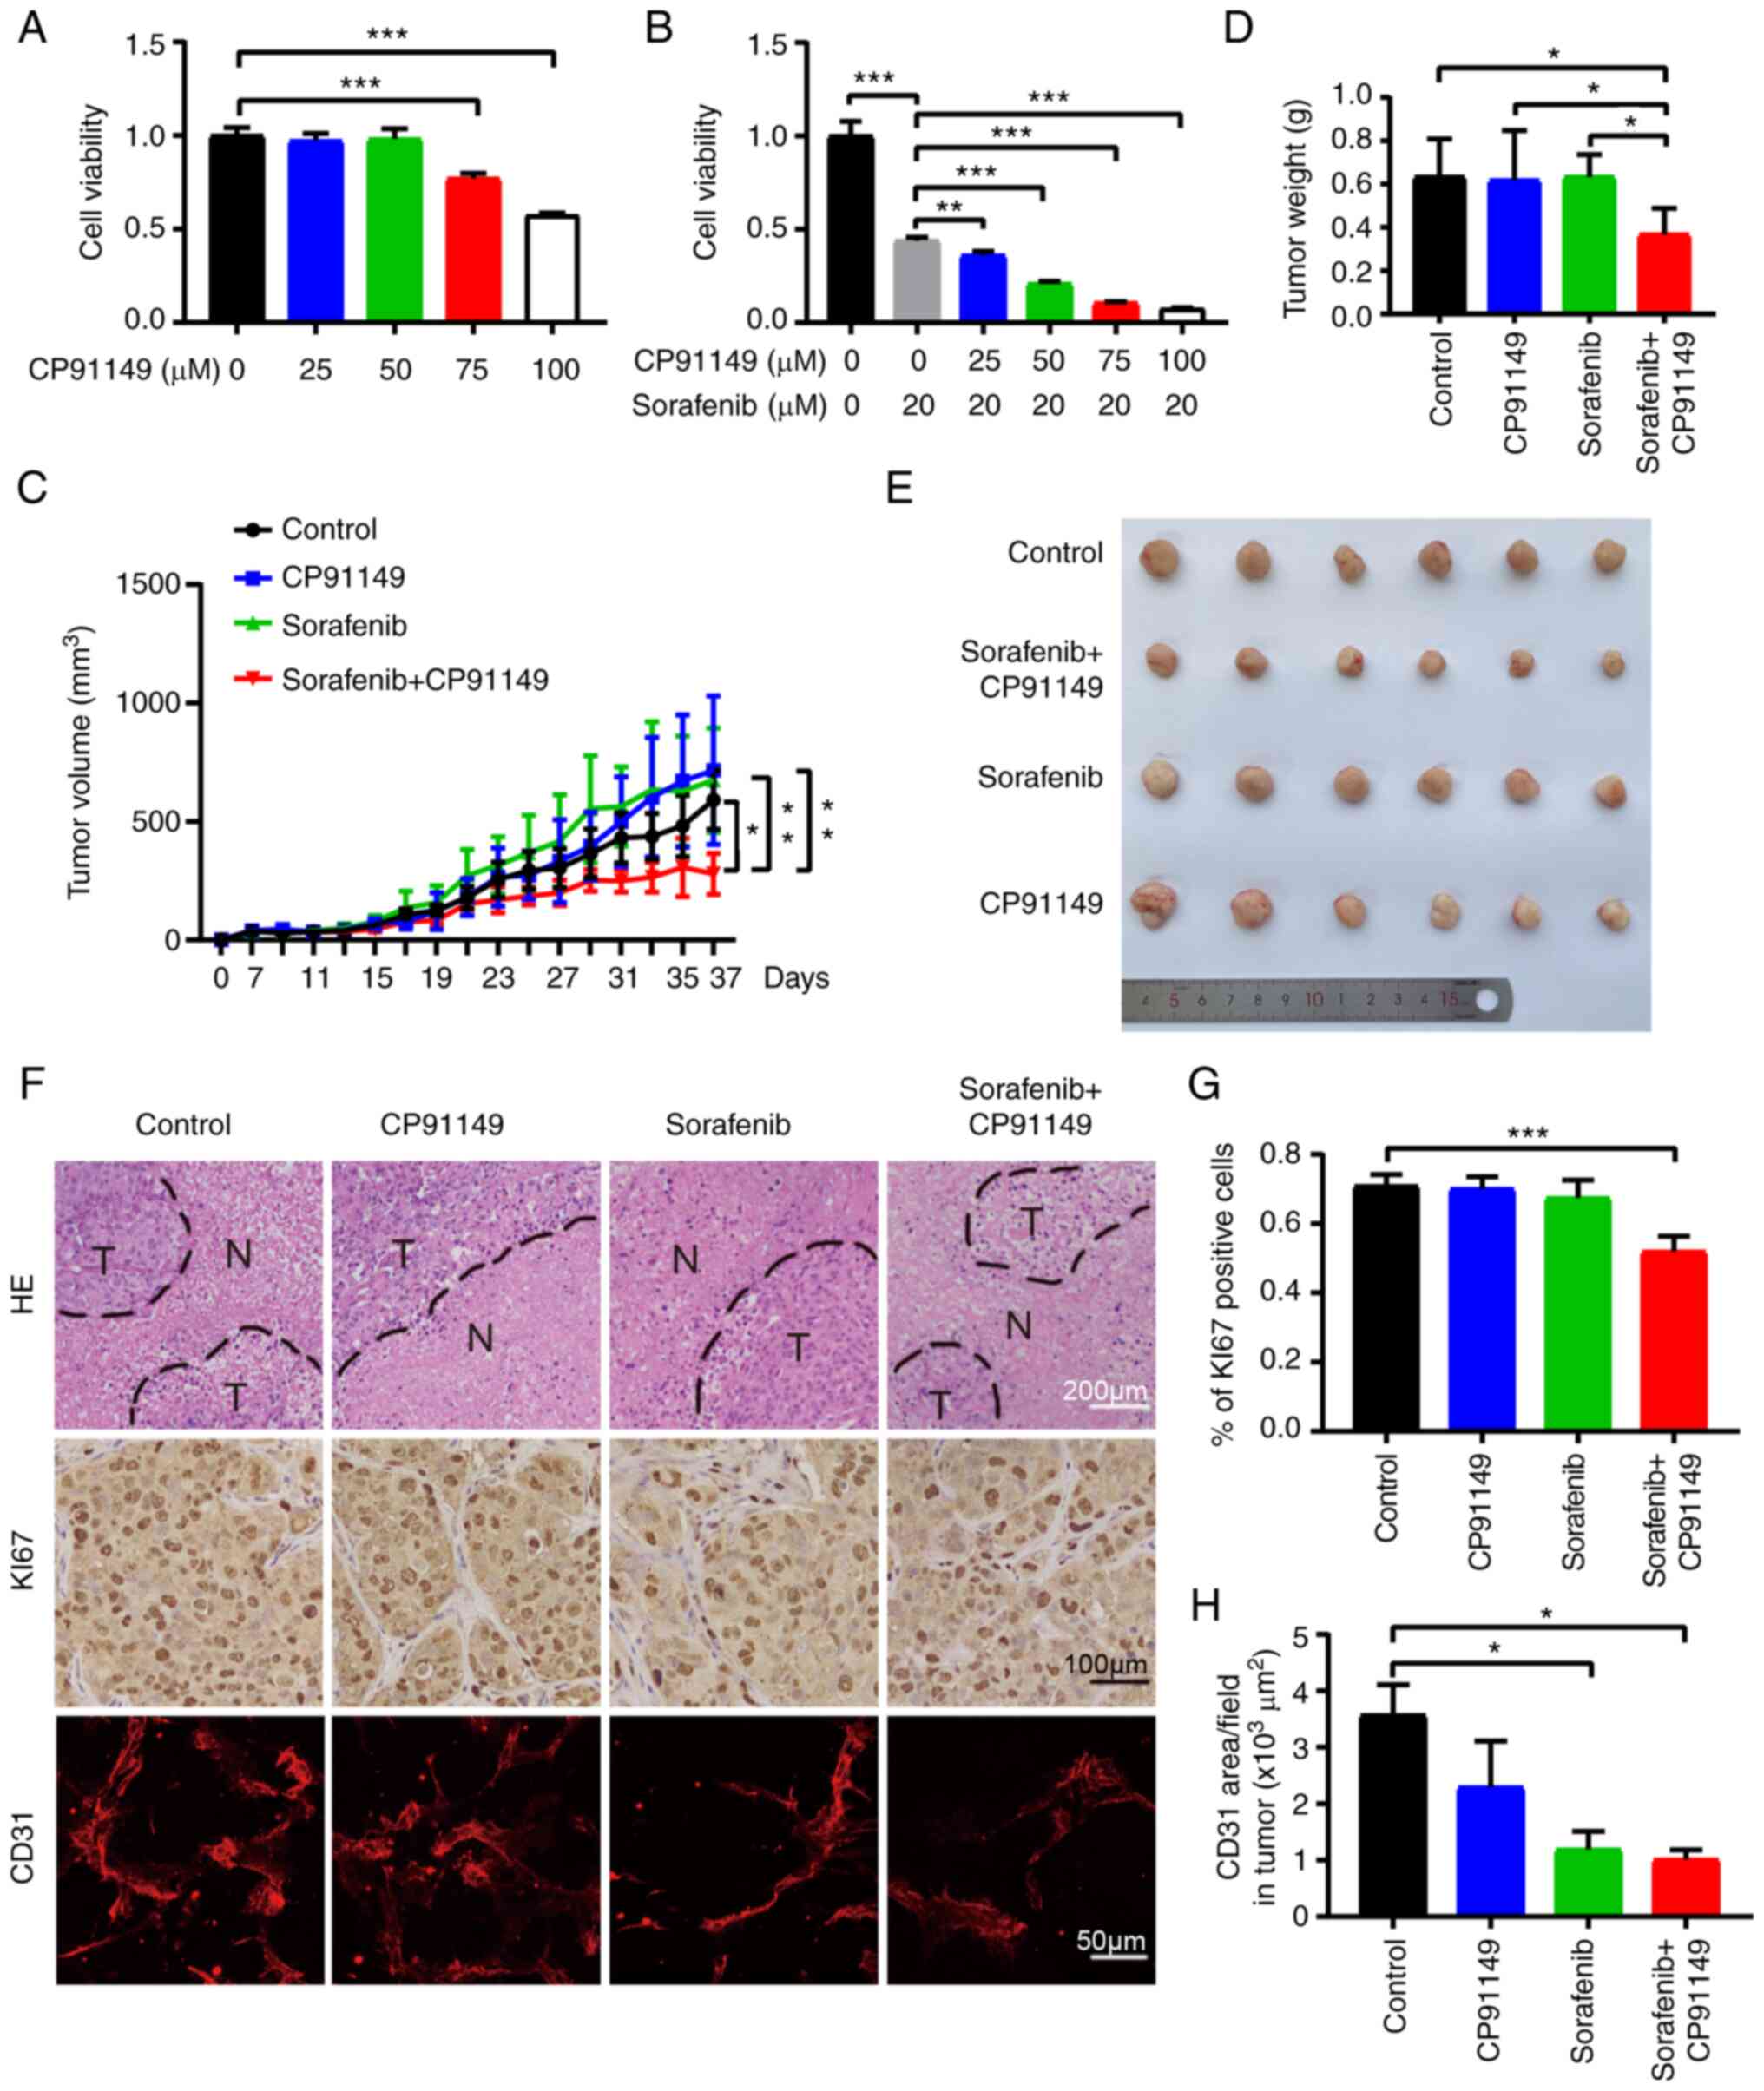 | Figure 6.Inhibition of PYGB suppresses HCC
growth. (A) HCC cell viability analysis of CP91149 treatment. (B)
HCC cell viability analysis of CP91149 treatment combined with
sorafenib. (C) Tumor growth curve of HCC under vehicle (n=6),
CP91149 (n=6), sorafenib (n=6), or combination treatment (n=6). (D)
HCC tumor weight. (E) HCC tumor pictures. (F) H&E (scale bar,
200 µm) staining of tumor tissues and immunohistochemical analysis
of Ki67 (scale bar, 100 µm) and CD31 (scale bar, 50 µm). (G)
Quantification of Ki67 positive cells. (H) Quantification of blood
vessel density. *P<0.05, **P<0.01 and ***P<0.001. N,
necrotic tissue; T, tumor tissue; n, number of mice; PYGB, brain
isoform of glycogen phosphorylase; HCC, hepatocellular
carcinoma. |
Discussion
HCC is one of the major causes of death among other
cancer-related mortality. Current treatments for advanced HCC have
limited benefits in improving the survival of patients (35,36).
Targeting cancer cell metabolism is one of the promising directions
for anticancer drug development, as an increasing number of studies
have revealed the key roles of glucose and lipid in regulating
cancer cell proliferation and metastasis (37,38).
Glucose is the major source of energy for cancer cells, and
glycolysis produces not only energy, but also essential substrates
for cancer cells to synthesize materials for cell proliferation, as
well as maintaining a favorable tumor microenvironment (39–41).
Although cancer cells uptake glucose from blood, the glycogen
stored in cells is also an important source to balance the glucose
level. Studies have demonstrated that the process of degradation of
glycogen into glucose is also significantly involved in cancer cell
metabolism through the GP (42–45).
Numerous studies have reported that overexpression of GP promotes
cancer cell proliferation and metastasis in different types of
cancer (46–48), and further studies also proposed
several inhibitors for drug development. However, there is no
approved drug available at present, thus further investigations are
needed.
In the present study, the expression of 3 GP
isoforms in different types of cancer were systematically analyzed
using UALCAN databases. PYGB and PYGL exhibited increased
expression in numerous types of cancer whereas PYGM expression
remained unchanged or decreased. The comparison of the structures
showed a very conserved protein sequence indicating the similar
functions. Nevertheless, the 3D structures also imply the activity
difference. It was found that among these 3 GPs, PYGB has low DNA
methylation level in HCC, accompanied with significantly elevated
expression. Survival curve also showed an association of PYGB
expression with poor survival rate. Clinical classification also
revealed that PYGB expression increases along with the disease
progression, but not the other two isoforms. Further analysis
identified certain potential molecules in connection with the PYGB
pathway and signaling in HCC. These data demonstrated that PYGB may
play an important role in regulation of HCC development. In the
validation experiments, the present data showed that inhibition of
PYGB activity could suppress HCC cell viability. Although the
compound CP91149 did not reach significance due to dose issues, the
combination of PYGB inhibitor and sorafenib greatly retarded tumor
growth and tumor angiogenesis. Therefore, targeting PYGB may be a
new approach in the treatment of HCC.
Supplementary Material
Supporting Data
Supporting Data
Acknowledgements
Not applicable.
Funding
The present study was supported by Taishan Scholar's program of
Shandong Provincial Natural Science Foundation (grant no.
ZR2021MH292), the National Natural Science Foundation of China
(grant no. 82103391) and the Youth Science Foundation project of
Shandong Province Natural Science Foundation (grant no.
ZR2020QH242).
Availability of data and materials
The datasets used and analyzed during the current
study are available from the corresponding author on reasonable
request.
Authors' contributions
YZ generated the ideas and designed experiments. LJ,
SL and TD performed the database analysis, and the cell and animal
experiments. YY supervised the in vivo assays. YZ, YY and LJ
analyzed the data, organized the figures, and wrote the manuscript.
All authors read and approved the final manuscript. YY and LJ
confirm the authenticity of all the raw data.
Ethics approval and consent to
participate
All animal experiments in the present study were
approved by the Ethics Committee of Binzhou Medical University
(Yantai, China).
Patient consent for publication
Not applicable.
Competing interests
The authors declare that they have no competing
interests.
References
|
1
|
Cao W, Chen HD, Yu YW, Li N and Chen WQ:
Changing profiles of cancer burden worldwide and in China: A
secondary analysis of the global cancer statistics 2020. Chin Med J
(Engl). 134:783–791. 2021. View Article : Google Scholar : PubMed/NCBI
|
|
2
|
Anwanwan D, Singh SK, Singh S, Saikam V
and Singh R: Challenges in liver cancer and possible treatment
approaches. Biochim Biophys Acta Rev Cancer. 1873:1883142020.
View Article : Google Scholar : PubMed/NCBI
|
|
3
|
Kudo M: Systemic therapy for
hepatocellular carcinoma: 2017 update. Oncology. 93 (Suppl
1):135–146. 2017. View Article : Google Scholar : PubMed/NCBI
|
|
4
|
Shao YY, Hsu CH and Cheng AL: Predictive
biomarkers of sorafenib efficacy in advanced hepatocellular
carcinoma: Are we getting there? World J Gastroenterol.
21:10336–10347. 2015. View Article : Google Scholar
|
|
5
|
Mossenta M, Busato D, Dal Bo M and Toffoli
G: Glucose metabolism and oxidative stress in hepatocellular
carcinoma: Role and possible implications in novel therapeutic
strategies. Cancers (Basel). 12:16682020. View Article : Google Scholar
|
|
6
|
Lai Y, Huang H, Abudoureyimu M, Lin X,
Tian C, Wang T, Chu X and Wang R: Non-coding RNAs: Emerging
regulators of glucose metabolism in hepatocellular carcinoma. Am J
Cancer Res. 10:4066–4084. 2020.PubMed/NCBI
|
|
7
|
Li Z and Zhang H: Reprogramming of
glucose, fatty acid and amino acid metabolism for cancer
progression. Cell Mol Life Sci. 73:377–392. 2016. View Article : Google Scholar
|
|
8
|
Hay N: Reprogramming glucose metabolism in
cancer: Can it be exploited for cancer therapy? Nat Rev Cancer.
16:635–649. 2016. View Article : Google Scholar : PubMed/NCBI
|
|
9
|
Hanahan D and Weinberg RA: Hallmarks of
cancer: The next generation. Cell. 144:646–674. 2011. View Article : Google Scholar
|
|
10
|
Lunt SY and Vander Heiden MG: Aerobic
glycolysis: Meeting the metabolic requirements of cell
proliferation. Annu Rev Cell Dev Biol. 27:441–464. 2011. View Article : Google Scholar
|
|
11
|
Warburg O: On the origin of cancer cells.
Science. 123:309–314. 1956. View Article : Google Scholar : PubMed/NCBI
|
|
12
|
Praly JP and Vidal S: Inhibition of
glycogen phosphorylase in the context of type 2 diabetes, with
focus on recent inhibitors bound at the active site. Mini Rev Med
Chem. 10:1102–1126. 2010. View Article : Google Scholar : PubMed/NCBI
|
|
13
|
Agius L: Role of glycogen phosphorylase in
liver glycogen metabolism. Mol Aspects Med. 46:34–45. 2015.
View Article : Google Scholar : PubMed/NCBI
|
|
14
|
Favaro E, Bensaad K, Chong MG, Tennant DA,
Ferguson DJ, Snell C, Steers G, Turley H, Li JL, Günther UL, et al:
Glucose utilization via glycogen phosphorylase sustains
proliferation and prevents premature senescence in cancer cells.
Cell Metab. 16:751–764. 2012. View Article : Google Scholar : PubMed/NCBI
|
|
15
|
Philips KB, Kurtoglu M, Leung HJ, Liu H,
Gao N, Lehrman MA, Murray TG and Lampidis TJ: Increased sensitivity
to glucose starvation correlates with downregulation of glycogen
phosphorylase isoform PYGB in tumor cell lines resistant to
2-deoxy-D-glucose. Cancer Chemother Pharmacol. 73:349–361. 2014.
View Article : Google Scholar
|
|
16
|
Zhou Y, Jin Z and Wang C: Glycogen
phosphorylase B promotes ovarian cancer progression via
Wnt/β-catenin signaling and is regulated by miR-133a-3p. Biomed
Pharmacother. 120:1094492019. View Article : Google Scholar : PubMed/NCBI
|
|
17
|
de Luna N, Brull A, Guiu JM, Lucia A,
Martin MA, Arenas J, Martí R, Andreu AL and Pinós T: Sodium
valproate increases the brain isoform of glycogen phosphorylase:
Looking for a compensation mechanism in McArdle disease using a
mouse primary skeletal-muscle culture in vitro. Dis Model Mech.
8:467–472. 2015. View Article : Google Scholar : PubMed/NCBI
|
|
18
|
Tang Z, Li C, Kang B, Gao G, Li C and
Zhang Z: GEPIA: A web server for cancer and normal gene expression
profiling and interactive analyses. Nucleic Acids Res.
45(W1):W98–W102. 2017. View Article : Google Scholar
|
|
19
|
Chandrashekar DS, Bashel B, Balasubramanya
SAH, Creighton CJ, Ponce-Rodriguez I, Chakravarthi BVSK and
Varambally S: UALCAN: A portal for facilitating tumor subgroup gene
expression and survival analyses. Neoplasia. 19:649–658. 2017.
View Article : Google Scholar
|
|
20
|
Cancer Genome Atlas Research Network, .
Comprehensive genomic characterization defines human glioblastoma
genes and core pathways. Nature. 455:1061–1068. 2008. View Article : Google Scholar : PubMed/NCBI
|
|
21
|
Rath VL, Ammirati M, LeMotte PK, Fennell
KF, Mansour MN, Danley DE, Hynes TR, Schulte GK, Wasilko DJ and
Pandit J: Activation of human liver glycogen phosphorylase by
alteration of the secondary structure and packing of the catalytic
core. Mol Cell. 6:139–148. 2000. View Article : Google Scholar
|
|
22
|
Lukacs CM, Oikonomakos NG, Crowther RL,
Hong LN, Kammlott RU, Levin W, Li S, Liu CM, Lucas-McGady D,
Pietranico S and Reik L: The crystal structure of human muscle
glycogen phosphorylase a with bound glucose and AMP: An
intermediate conformation with T-state and R-state features.
Proteins. 63:1123–1126. 2006. View Article : Google Scholar : PubMed/NCBI
|
|
23
|
Mathieu C, Li de la Sierra-Gallay I, Duval
R, Xu X, Cocaign A, Léger T, Woffendin G, Camadro JM, Etchebest C,
Haouz A, et al: Insights into Brain glycogen metabolism: The
structure of human brain glycogen phosphorylase. J Biol Chem.
291:18072–18083. 2016. View Article : Google Scholar : PubMed/NCBI
|
|
24
|
Gao J, Aksoy BA, Dogrusoz U, Dresdner G,
Gross B, Sumer SO, Sun Y, Jacobsen A, Sinha R, Larsson E, et al:
Integrative analysis of complex cancer genomics and clinical
profiles using the cBioPortal. Sci Signal. 6:pl12013. View Article : Google Scholar
|
|
25
|
Cerami E, Gao J, Dogrusoz U, Gross BE,
Sumer SO, Aksoy BA, Jacobsen A, Byrne CJ, Heuer ML, Larsson E, et
al: The cBio cancer genomics portal: An open platform for exploring
multidimensional cancer genomics data. Cancer Discov. 2:401–404.
2012. View Article : Google Scholar : PubMed/NCBI
|
|
26
|
Jensen LJ, Kuhn M, Stark M, Chaffron S,
Creevey C, Muller J, Doerks T, Julien P, Roth A, Simonovic M, et
al: STRING 8-a global view on proteins and their functional
interactions in 630 organisms. Nucleic Acids Res. 37:(Database
issue). D412–D416. 2009. View Article : Google Scholar : PubMed/NCBI
|
|
27
|
Castven D, Fischer M, Becker D, Heinrich
S, Andersen JB, Strand D, Sprinzl MF, Strand S, Czauderna C,
Heilmann-Heimbach S, et al: Adverse genomic alterations and
stemness features are induced by field cancerization in the
microenvironment of hepatocellular carcinomas. Oncotarget.
8:48688–48700. 2017. View Article : Google Scholar
|
|
28
|
Chin D and Means AR: Calmodulin: A
prototypical calcium sensor. Trends Cell Biol. 10:322–328. 2000.
View Article : Google Scholar
|
|
29
|
Fu J, Wang T and Xiao X: A novel PHKA2
mutation in a Chinese child with glycogen storage disease type IXa:
A case report and literature review. BMC Med Genet. 20:562019.
View Article : Google Scholar
|
|
30
|
Tsang WY, Spektor A, Luciano DJ, Indjeian
VB, Chen Z, Salisbury JL, Sánchez I and Dynlacht BD: CP110
cooperates with two calcium-binding proteins to regulate
cytokinesis and genome stability. Mol Biol Cell. 17:3423–3434.
2006. View Article : Google Scholar
|
|
31
|
Kebede M, Favaloro J, Gunton JE, Laybutt
DR, Shaw M, Wong N, Fam BC, Aston-Mourney K, Rantzau C, Zulli A, et
al: Fructose-1,6-bisphosphatase overexpression in pancreatic
beta-cells results in reduced insulin secretion: A new mechanism
for fat-induced impairment of beta-cell function. Diabetes.
57:1887–1895. 2008. View Article : Google Scholar : PubMed/NCBI
|
|
32
|
Rocha S, Lucas M, Araujo AN, Corvo ML,
Fernandes E and Freitas M: Optimization and validation of an in
vitro standardized glycogen phosphorylase activity assay.
Molecules. 26:46352021. View Article : Google Scholar : PubMed/NCBI
|
|
33
|
Caiola E, Frapolli R, Tomanelli M, Valerio
R, Iezzi A, Garassino MC, Broggini M and Marabese M: Wee1 inhibitor
MK1775 sensitizes KRAS mutated NSCLC cells to sorafenib. Sci Rep.
8:9482018. View Article : Google Scholar : PubMed/NCBI
|
|
34
|
Qu Z, Wu J, Wu J, Luo D, Jiang C and Ding
Y: Exosomes derived from HCC cells induce sorafenib resistance in
hepatocellular carcinoma both in vivo and in vitro. J Exp Clin
Cancer Res. 35:1592016. View Article : Google Scholar : PubMed/NCBI
|
|
35
|
Li S, Yang F and Ren X: Immunotherapy for
hepatocellular carcinoma. Drug Discov Ther. 9:363–371. 2015.
View Article : Google Scholar : PubMed/NCBI
|
|
36
|
Lurje I, Czigany Z, Bednarsch J, Roderburg
C, Isfort P, Neumann UP and Lurje G: Treatment strategies for
hepatocellular carcinoma− a multidisciplinary approach.
Int J Mol Sci. 20:14652019. View Article : Google Scholar
|
|
37
|
Luengo A, Gui DY and Vander Heiden MG:
Targeting metabolism for cancer therapy. Cell Chem Biol.
24:1161–1180. 2017. View Article : Google Scholar
|
|
38
|
Bose S, Zhang C and Le A: Glucose
metabolism in cancer: The Warburg effect and beyond. Adv Exp Med
Biol. 1311:3–15. 2021. View Article : Google Scholar
|
|
39
|
Abdel-Wahab AF, Mahmoud W and Al-Harizy
RM: Targeting glucose metabolism to suppress cancer progression:
Prospective of anti-glycolytic cancer therapy. Pharmacol Res.
150:1045112019. View Article : Google Scholar : PubMed/NCBI
|
|
40
|
Gomes AS, Ramos H, Soares J and Saraiva L:
p53 and glucose metabolism: An orchestra to be directed in cancer
therapy. Pharmacol Res. 131:75–86. 2018. View Article : Google Scholar : PubMed/NCBI
|
|
41
|
Ancey PB, Contat C and Meylan E: Glucose
transporters in cancer-from tumor cells to the tumor
microenvironment. FEBS J. 285:2926–2943. 2018. View Article : Google Scholar : PubMed/NCBI
|
|
42
|
Zois CE and Harris AL: Glycogen metabolism
has a key role in the cancer microenvironment and provides new
targets for cancer therapy. J Mol Med (Berl). 94:137–154. 2016.
View Article : Google Scholar : PubMed/NCBI
|
|
43
|
Ritterson Lew C, Guin S and Theodorescu D:
Targeting glycogen metabolism in bladder cancer. Nat Rev Urol.
12:383–391. 2015. View Article : Google Scholar
|
|
44
|
Zois CE, Favaro E and Harris AL: Glycogen
metabolism in cancer. Biochem Pharmacol. 92:3–11. 2014. View Article : Google Scholar
|
|
45
|
Favaro E and Harris AL: Targeting glycogen
metabolism: A novel strategy to inhibit cancer cell growth?
Oncotarget. 4:3–4. 2013. View Article : Google Scholar
|
|
46
|
Jin Y and Yang Y: Bioinformatics-based
discovery of PYGM and TNNC2 as potential biomarkers of head and
neck squamous cell carcinoma. Biosci Rep. 39:BSR201916122019.
View Article : Google Scholar : PubMed/NCBI
|
|
47
|
Altemus MA, Goo LE, Little AC, Yates JA,
Cheriyan HG, Wu ZF and Merajver SD: Breast cancers utilize hypoxic
glycogen stores via PYGB, the brain isoform of glycogen
phosphorylase, to promote metastatic phenotypes. PLoS One.
14:e02209732019. View Article : Google Scholar : PubMed/NCBI
|
|
48
|
Xia B, Zhang K and Liu C: PYGB promoted
tumor progression by regulating Wnt/β-catenin pathway in gastric
cancer. Technol Cancer Res Treat. 19:15330338209265922020.
View Article : Google Scholar
|