Introduction
The anti-PD-1 antibody pembrolizumab (PEM) is
currently approved as second line therapy for cisplatin-resistant
urothelial carcinoma (UC), but the objective response rate was only
21.1% (95% CI, 16.4 to 26.5) in the KEYNOTE-045 clinical trial
(1). Therefore, it is important to
find biomarkers to predict which patients will benefit from this
drug and to identify factors that reflect its lack of therapeutic
effect in UC patients. To this end, we investigated whether immune
profiling could yield biomarkers for the early prediction of
therapeutic effects in individual patients.
A commonly-used predictive biomarker of checkpoint
inhibitor efficacy is the tumor mutational burden (TMB), an
indirect indicator of tumor antigenicity resulting from mutations
in the cancer cells. A positive correlation between log (TMB) and
the mean response rate has been reported in a meta-analysis of 27
different cancers (2). Significant
correlations between high TMB and response to the anti-PD-L1
antibody atezolizumab have been reported in patients with
locally-advanced and metastatic UC after treatment with
platinum-based chemotherapy (3).
It has also been reported that a high neutrophil-to-lymphocyte
ratio in peripheral blood (PB) is associated with poorer responses
to anti-PD-1 antibodies in patients with non-small cell lung cancer
and melanoma (4). Other potential
predictive biomarkers for the efficacy of immune checkpoint
inhibitors (ICIs) include C-reactive protein (CRP) and Lactate
Dehydrogenase (LDH). In a retrospective study, baseline elevated
CRP was an independent predictor of worse progression-free survival
(PFS), worse overall survival (OS) and a lower overall response
rate (ORR) in patients treated with PD-1/PD-L1 ICIs (5). Baseline low serum LDH, high
eosinophil counts and high lymphocyte counts were independent
prognostic factors for PD-1 benefit in patients with advanced
melanoma (6). In addition, it has
been reported that phenotypes of inflammatory cells in PB influence
PD-1 ICI prognosis in non-small cell lung cancer; these included
higher baseline CD62LlowCD4+ T cells and lower
CD25+FOXP3+CD4+ T cells (7) and higher PD-1+CD8+ T cells and NK
cells (8). Notably, levels of
myeloid-derived suppressor cells (MDSC) in PB and tissues have been
reported as poor prognostic factors in UC (9). However, the dynamics of individual
immune cells and their phenotypes after PEM treatment and
associations with response or resistance to PEM have not yet been
explored.
In order to understand the dynamics of immune cells
and their phenotypes in early on-treatment samples, we evaluated PB
mononuclear cells (PBMCs) before and after the first administration
of PEM. We applied principal component analysis (PCA) on immune
profile data for different immune cells in order to evaluate the
immunological changes resulting from PEM administration. Finally,
we investigated whether immune profiling could provide biomarkers
for the early prediction of individual therapeutic effects.
Materials and methods
Patients
This clinical study analyzed the immunological
impact of the anti-PD-1 antibody PEM on chemotherapy-resistant
recurrent and metastatic UC patients at the University of Tokyo
Hospital. The research protocol was approved by the Ethical
Committee of The University of Tokyo [approval no. 3652-(6)] and written informed consent was
obtained from each patient before they entered the study. All
procedures in the present study were performed according to the
ethical standards of the institution and were in conformity with
the 1964 Helsinki Declaration and its later amendments, or
comparable ethical standards. Thirty-one chemotherapy-resistant
advanced UC patients were recruited from May 2018 to May 2020
(Table I).
 | Table I.Characteristics of patients with UC
treated with pembrolizumab. |
Table I.
Characteristics of patients with UC
treated with pembrolizumab.
|
Characteristics | Value (n=31) |
|---|
| Patient age,
years |
|
|
Median | 70 |
|
Range | 26-80 |
| Male, n (%) | 23 (74.2) |
| Ex-smoker, n
(%) | 19 (61.3) |
| Number of previous
chemotherapy cycles |
|
|
Median | 3 |
| Range
(1stQ, 3rdQ) | 1-21 (3, 5) |
| Primary tumor, n
(%) |
|
| BC | 10 (32.3) |
| Upper
UC | 16 (51.6) |
| BC and
upper UC | 5 (16.1) |
| TNM staging, n
(%) |
|
| 0 | 1 (3.2) |
| I | 5 (16.1) |
| II | 1 (3.2) |
|
III | 20 (64.5) |
| IV | 4 (12.9) |
| Numbers of visceral
metastases before pembrolizumab, n (%) |
|
| 1 | 17 (54.8) |
| 2 | 11 (35.5) |
| 3 | 3 (9.7) |
| Chemotherapy
regimen before pembrolizumab, n (%) |
|
|
DDMVAC | 5 (16.1) |
| GC | 11 (35.5) |
|
GCa | 13 (41.9) |
|
Others | 2 (6.5) |
Treatment
Patients received 200 mg of PEM intravenously every
3 weeks. Blood was collected just before the first and again just
before the second administration of PEM. The first dose was given
in the hospital, and the second dose was administered in the
outpatient chemotherapy room. The schedule of the second dose and
the timing of blood sampling were delayed in some patients,
resulting in the interval between the first and second dose ranging
from 17 to 29 days (Fig. S1).
However, these differences in the timing of dosing did not affect
the immunological parameters used in this study (Table SI). Therefore, all 31 patients'
data were accepted for the analysis.
PBMC isolation and flow cytometry
PBMCs were isolated from peripheral venous blood by
density gradient centrifugation at 1,100 × g for 20 min at room
temperature using Lymphoprep™ (cat. no. 1114547; Alere
Technologies AS) and were then cryopreserved in
Bambanker™ freezing medium (cat. no. CS-02-001; 01;
Nippon Genetics Co., Ltd.). Cryopreserved PBMCs were thawed in
RPMI-1640 (cat. no. 189-02025; Wako Pure Chemical Industries, Ltd.)
supplemented with 50 IU/ml Benzonase® Nuclease (cat. no.
E1014; Sigma-Aldrich; Merck KGaA). Cells (1×10⁶) were stained in
100 µl phosphate-buffered saline containing 1% FBS (cat. no. 17012;
Sigma-Aldrich; Merck KGaA) and 0.1% sodium azide (cat. no.
195-11092; Wako Pure Chemical Industries, Ltd.) using a 1:100
dilution of the antibodies (Abs) listed in Table SII. Dead cells were excluded by
staining using Zombie Yellow™ Fixable Viability kits
(cat. no. 423104; BioLegend, Inc.). For surface staining, cells
were incubated with the Abs at 4°C in the dark for 30 min. Cells
were fixed in 0.5% paraformaldehyde for nuclear staining before
data acquisition and incubated with mAbs at room temperature in the
dark for 45 min. Flow cytometry was performed on a CytoFLEXS
(Beckman Coulter, Inc.) and data were analyzed by
FlowJo™ v10 software (TreeStar) (Fig. S2). The gating strategies for CD4+
and CD8+ T cells were based on their expression of CD45RA, CD27 and
CCR7, as reported by Jones et al (10). Monocytic myeloid-derived suppressor
cells (mMDSCs) were defined as CD11b+CD14+HLA-DR-/lowCD15-CD33+,
based on the strategy of Bronte et al (11). The gating for regulatory T cells
(Treg) was set based on the analysis reported by Miyara et al
(12), i.e., FOXP3-high cells
based on FOXP3+Ki67+CD45RA-CD4+ staining were considered effector
Treg (eTreg).
Absolute counts of immune cells
Absolute counts of each immune cell fraction were
calculated by multiplying the percentage of each in PBMC and the
sum of lymphocyte and monocyte counts in whole blood. The degree of
change was calculated by subtracting the absolute counts before PEM
administration from those after PEM administration.
Transcriptome analysis
To analyze IMvigor210 (NCT02108652) data, the
expression data and clinical data were obtained from IMvigor 210
Core Biologies (http://research-pub.gene.com/IMvigor210CoreBiologies).
We then ran ssGSEA (13), using
gene-sets for MDSC (14) and
tumor-associated macrophages (TAM) (15).
Statistical analysis
All statistical analyses were performed using R
Statistical Software (version 4.1.0; R Foundation for Statistical
Computing, Vienna, Austria) and installed R packages. Data were
analyzed using the Wilcoxon signed-rank test when comparing two
groups between each set of matched pairs with the R software
package ‘exactRankTests’ (version 0.8-34). Data were analyzed using
the Mann-Whitney test when comparing two independent groups with
the R default installed package. The Kruskal-Wallis test was used
to compare three or more independent groups for non-parametric data
with the R default package. For post-hoc analysis, Steel-Dwass test
was performed with the R software package ‘NSM3’ (version 1.16).
Spearman's rank correlation coefficient analysis was used to
analyze the correlation with the R default installed package. A Cox
proportional hazards model was used in the univariate analyses of
overall survival with the R software package ‘survival’ (version
3.2-13). Kaplan-Meier estimation of survival of patients with high
or low mMDSC levels by log-rank testing used the R software package
‘survival’ (version 3.2-13). The degree of change of each immune
cell subset after PEM was analyzed using a multivariate PCA with
the R software package ‘factoextra’ (version 1.0.7). Data were
visualized with the R software package ‘ggplot2’ (version 3.3.5),
‘survminer’ (version 0.4.9), and ‘corrplot’ (version 0.92).
P<0.05 was considered to indicate a statistically significant
difference.
Results
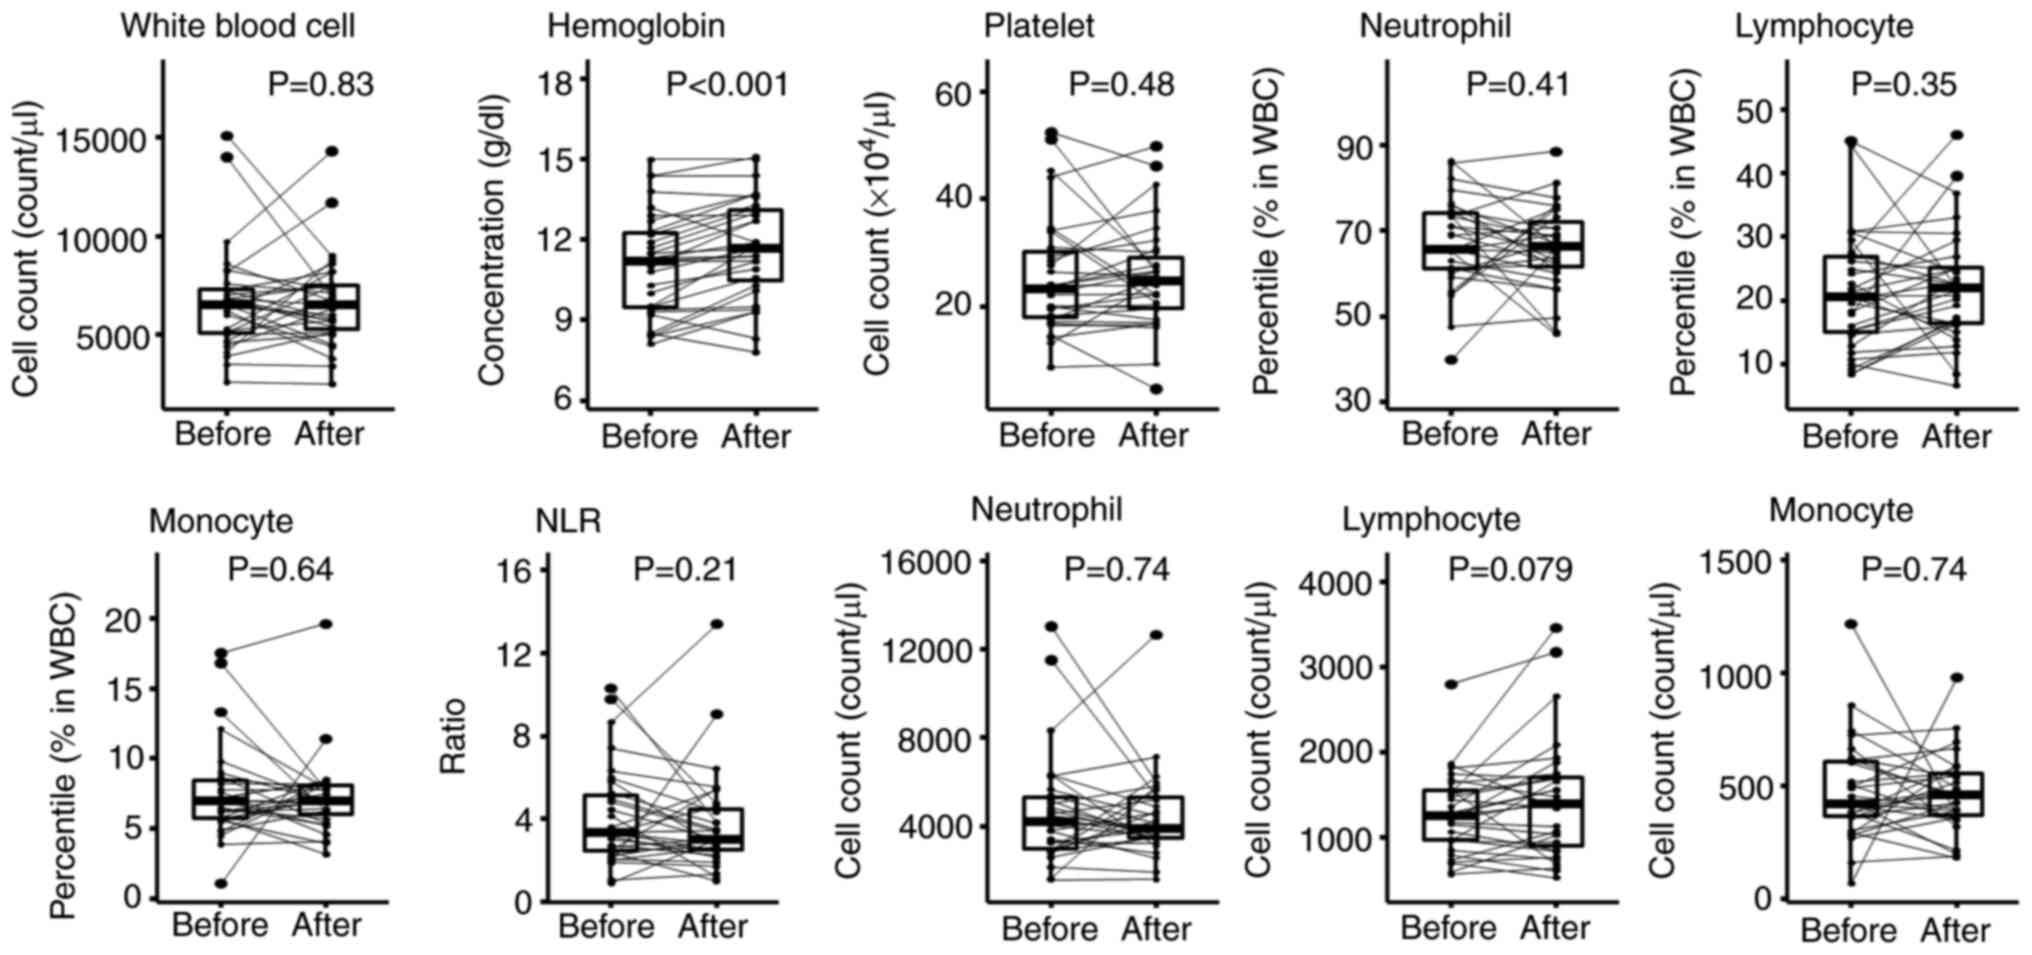
Changes in complete blood count (CBC)
and immune cells associated with PEM treatment
To identify predictive biomarkers for the outcome of
PEM treatment of UC, we focused on pre-treatment and early
on-treatment blood samples. First, to determine which parameters in
CBC were significantly changed after the initial dose of PEM, each
item of laboratory data was compared before and after its
administration. We found that hemoglobin was significantly
increased 3 weeks after starting PEM (P<0.001; Fig. 1, Table SIII). It is likely that hemoglobin
values improved with the recovery of hematopoietic capacity because
of the cessation of chemotherapy. Increases and decreases in white
blood cells, platelets, neutrophils, lymphocytes and monocytes
varied from patient to patient with no overall recognizable
pattern.
Next, PBMCs were phenotyped by flow cytometry
(Figs. S2 and 2). Three weeks after the initial dose of
PEM, the absolute numbers of PD-1+CD57-CD4+ T cells and
PD-1+CD57-CD8+ T cells were significantly decreased (P<0.001,
P=0.002, respectively; Fig. 2,
Table SIV). On the other hand,
PD-1-CD57+CD4+ T cell and PD-1-CD57+CD8+ T cell numbers were
significantly increased (P<0.001, P=0.008, respectively). The
decrease of PD-1+ cells and increased PD-1−
cells were artifacts caused by the competition of binding to PD-1
between PEM and the detection antibody, clone EH12.2H7 (16). Therefore, except for pre-treatment
samples, we removed the data containing PD-1 staining from further
analyses. CD45RA+CD27-CCR7- terminally differentiated (TD) CD8+ T
cells and KLRG1+CD57+ senescent CD8+ T cells were significantly
increased (P=0.042 and P=0.043, respectively). Thus, the profile of
CD8+ T cells in PB shifted towards a more differentiated
and senescent signature after PEM. In addition, eTregs
significantly decreased (P=0.015; Fig.
2 and Table SIV).
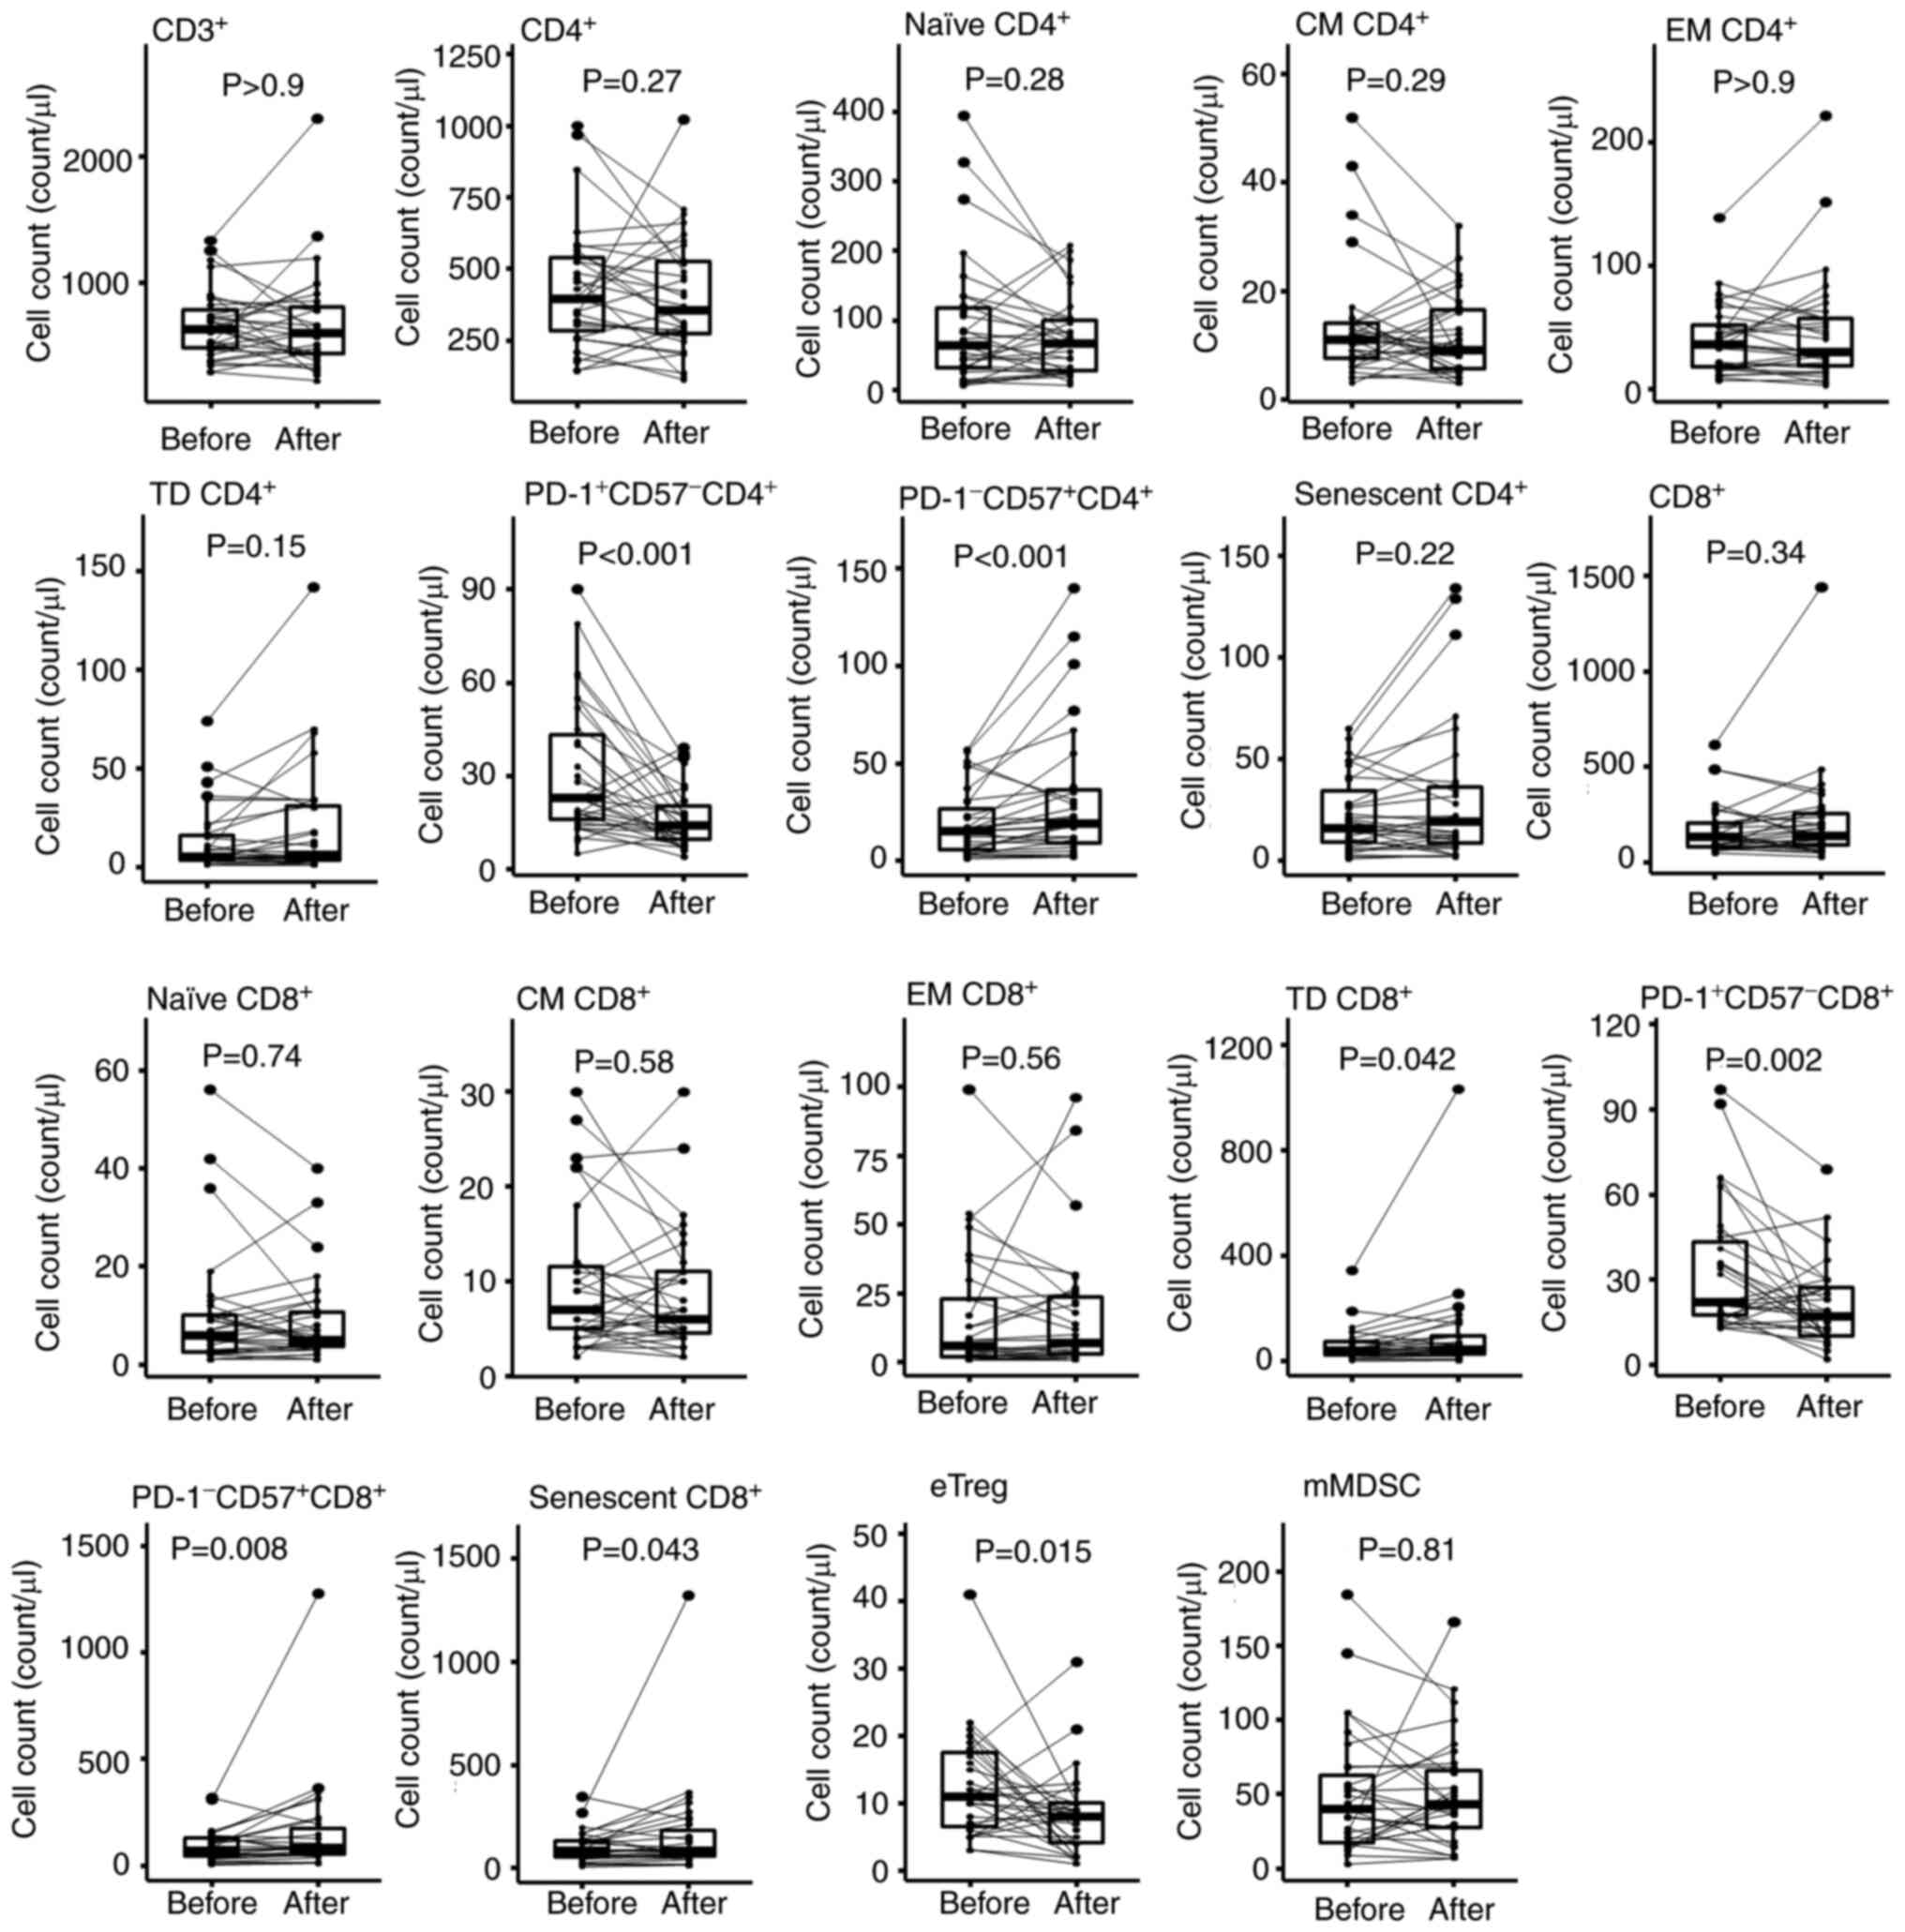 | Figure 2.Changes in immune cells after PEM
treatment. To investigate the changes in immune cells following PEM
administration, a comparison was made between the absolute counts
in each immune cell fraction of PBMCs just before PEM
administration and 3 weeks thereafter using the Wilcoxon
signed-rank test. Absolute cell counts were calculated by
multiplying the percentages of each immune cell fraction and the
PBMC counts; PBMC counts were calculated by the sum of lymphocyte
counts and the monocyte counts in whole blood cells. Naïve,
CD45RA+CD27+CCR7+; CM, central memory (CD45RA-CD27+CCR7+); EM,
effector memory (CD45RA-CD27-CCR7-); TD, terminally differentiated
(CD45RA+CD27-CCR7-); eTreg, effector regulatory T cell
(FOXP3highCD45RA- CD4+ T cell); mMDSC, monocytic myeloid-derived
suppressor cell (CD11b+CD14+CD15-HLA-DR-CD33+); PBMC, peripheral
blood mononuclear cell; PD-1, programmed cell death protein 1; PEM,
pembrolizumab. |
Next, we investigated whether these changes induced
by PEM affected the prognosis of UC patients. Univariate analysis
with Cox regression did not show any significant prognostic
relevance of the changes in CBC and different immune cell counts
before and after PEM treatment (Tables SV and SVI).
Integrated analysis of
immunophenotypic changes in PBMC
To integrate these changes in immune cells following
PEM treatment into a representation of the dynamics of the immune
system, changes in the different immune cell subsets were
comprehensively analyzed by PCA (Fig.
3 and Table SVII). First,
changes in cell counts for each immune cell phenotype before and
after PEM were calculated and entered into the PCA. Next, the
changes were plotted in the first two principal component spaces
(Fig. 3A). This showed that
CD4+ and CD8+T cells with effector memory (EM), TD, and
senescent phenotypes clustered closely around the first principal
component (PC1). Similarly, CD4+ and CD8+ T cells with
naïve and central memory (CM) phenotypes clustered more around PC2.
On the other hand, the contribution of eTregs and mMDSCs was
limited (Table SVII).
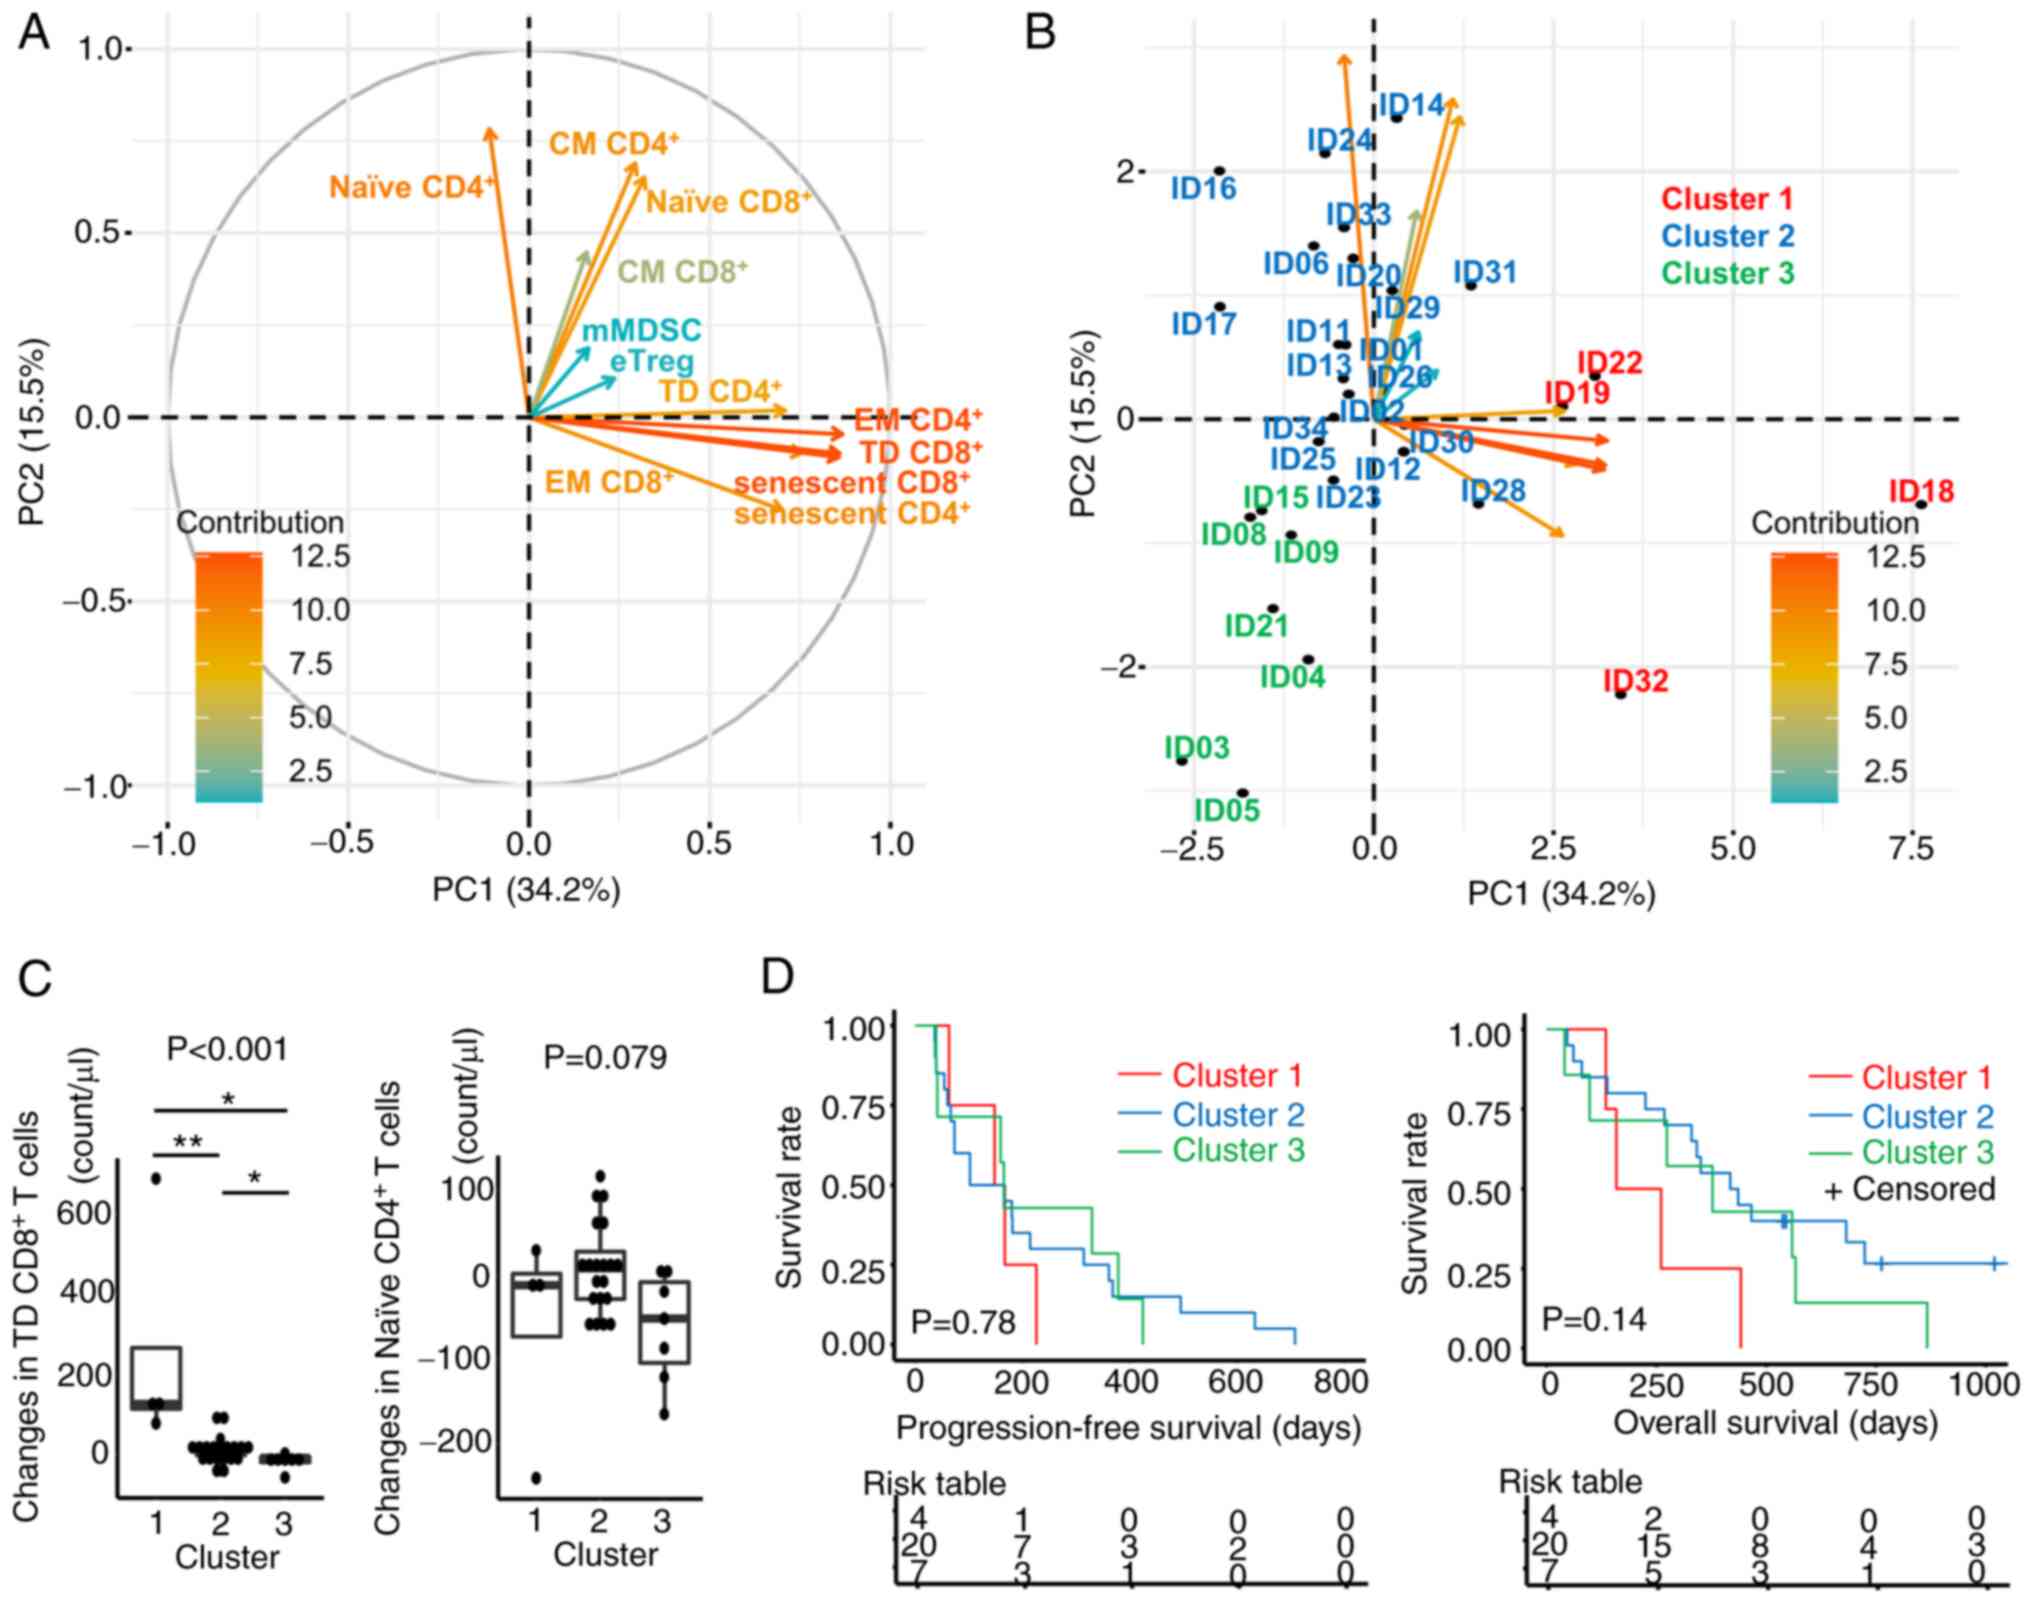 | Figure 3.PCA of changes in immune cells after
PEM treatment. (A) Correlation plots in PCA were constructed to
examine the changes of each immune cell phenotype in PBMCs. The
absolute counts of each immune cell fraction were calculated by
multiplying the percentages of each fraction and the PBMC counts;
PBMC counts were determined by the sum of lymphocyte counts and the
monocyte counts from the routine clinical laboratory data. The
changes were calculated by subtracting the values before PEM
administration from those after PEM administration. Vectors
indicate the increase of the respective changes in immune cells.
The color is defined by the contribution of variables for the first
two principal components. (B) Plots for individual patients were
loaded on the respective principal components. The patients were
divided into three groups by the k-means method using the first and
second principal components. (C) Changes in TD CD8+ T cells and
naïve CD4+ T cells were compared in these three clusters.
Kruskal-Wallis test was performed and the P-value was indicated on
the top of the panel. For post-hoc analysis, Steel-Dwass test was
performed: *P<0.05, **P<0.01. (D) Kaplan-Meier estimates of
progression-free survival and overall survival according to three
clusters based on the results of PCA. A log-rank test was
performed. naïve, CD45RA+CD27+CCR7+; CM, central memory
(CD45RA-CD27+CCR7+); EM, effector memory (CD45RA-CD27-CCR7-); TD,
terminally differentiated (CD45RA+CD27-CCR7-); eTreg, effector
regulatory T cell (FOXP3highCD45RA-CD4+ T cell); mMDSC, monocytic
myeloid-derived suppressor cell (CD11b+CD14+CD15-HLA-DR-CD33+);
PBMC, peripheral blood mononuclear cell; PC1, the first principal
component; PC2, the second principal component; PCA, principal
component analysis; PEM, pembrolizumab. |
Individual patient data were plotted based on the
variable correlations of changes in immune cell fractions after PEM
(Fig. 3B). The patients were
divided non-hierarchically into three groups by k-means clustering,
i.e., cluster 1 (PC1 side), cluster 2 (PC2 side), and cluster 3
(the opposite side of PC1 and PC2). The number of clusters 3 in
k-means was determined using the R package ‘NbClust’ (version 3.0).
This approach revealed that changes of TD CD8+ T cells were
significantly greater in cluster 1 (P<0.001) and changes of
naïve CD4+ T cells tended to be greater in cluster 2 (P=0.079)
(Fig. 3C). Next, we compared PFS
and OS from the initiation of PEM administration in these three
clusters to determine whether these commonly recognized changes in
PB immune cells were associated with prognosis (Fig. 3D). This approach showed that
patients in cluster 1 had a relatively poor prognosis, whereas
those in cluster 3 tended to have a better prognosis, but these
differences did not reach statistical significance in terms of OS
and PFS (P=0.14, P=0.78, respectively). These results suggest that
T cell activation is needed for a response, but excessive
activation and differentiation of T cells might not increase
patient survival. Thus, inhibition of senescence and excessive
differentiation of effector cells during PEM treatment might help
sustain the effect of immunotherapy over an extended period,
leading to a better prognosis.
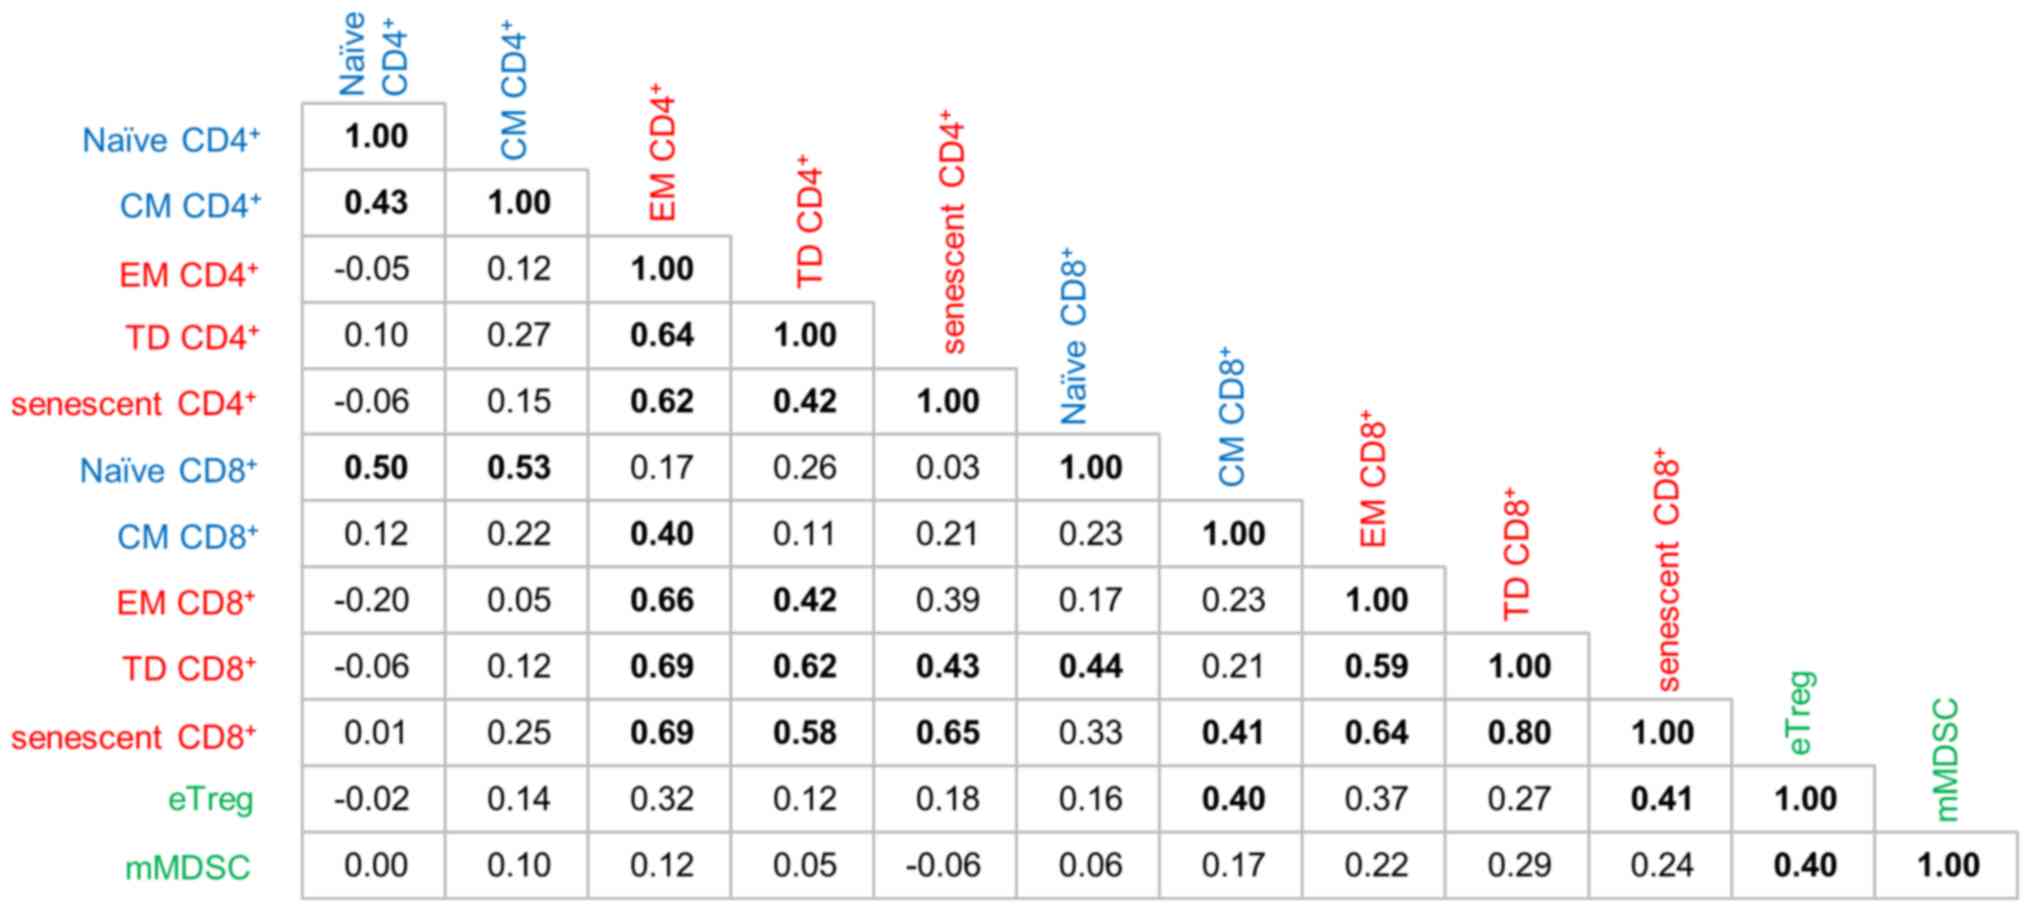
Relationships between immune cell
phenotypes
To investigate the relationships between immune
cells from different PCA directions, correlation coefficients were
calculated and verified together with the results of PCA. As shown
in Fig. 4, components in the same
axial direction with a strong contribution in Fig. 3 and Table SVII also correlate closely with
each other. For example, TD CD8+ T cells were well correlated with
EM CD4+ T cells (r=0.69), TD CD4+ T cells (r=0.62) and senescent
CD4+ T cells (r=0.43). Senescent CD8+ T cells
were well correlated with EM CD4+ T cells (r=0.69), TD CD4+ T cells
(r=0.58), senescent CD4+ T ells (r=0.65), EM
CD8+ T cells (r=0.64) and TD CD8+ T cells (r=0.80).
Conversely, eTregs and mMDSCs had notably lower coordinates and
contributions to PC1 and PC2 (Table
SVII). The absolute values of the correlation coefficients of
mMDSCs with other immune cell fractions were all <0.3 except for
eTregs with which mMDSCs had a weak correlation with a correlation
coefficient of only 0.4 (Fig. 4).
Therefore, we considered that eTregs and mMDSCs were not affected
by PEM treatment and behave relatively independently from other
immune cells on PEM treatment.
Impact of mMDSCs and eTregs on
prognosis
The T cell compartment moved in the direction of
differentiation and senescence even after only a single dose of
PEM. These results are consistent with the expected mode of action
of PEM. Therefore, to investigate whether the changes of mMDSCs,
that were not associated with T cell changes, determined the
clinical outcomes of UC patients receiving PEM, survival analysis
was performed for patients with increased or decreased mMDSCs on
treatment. This revealed that patients with decreased mMDSCs after
PEM had significantly longer OS (P=0.049, Fig. 5A). In addition, the association
between Treg dynamics following PEM treatment and patient survival
was examined (Fig. 5D-F). Patients
with increased eTregs also tended to enjoy better OS than those
with decreased eTregs, although this was also not statistically
significant (P=0.12, Fig. 5D).
These changes in mMDSCs and eTregs were not associated with PFS or
response to PEM (Fig. 5B, C, E and
F).
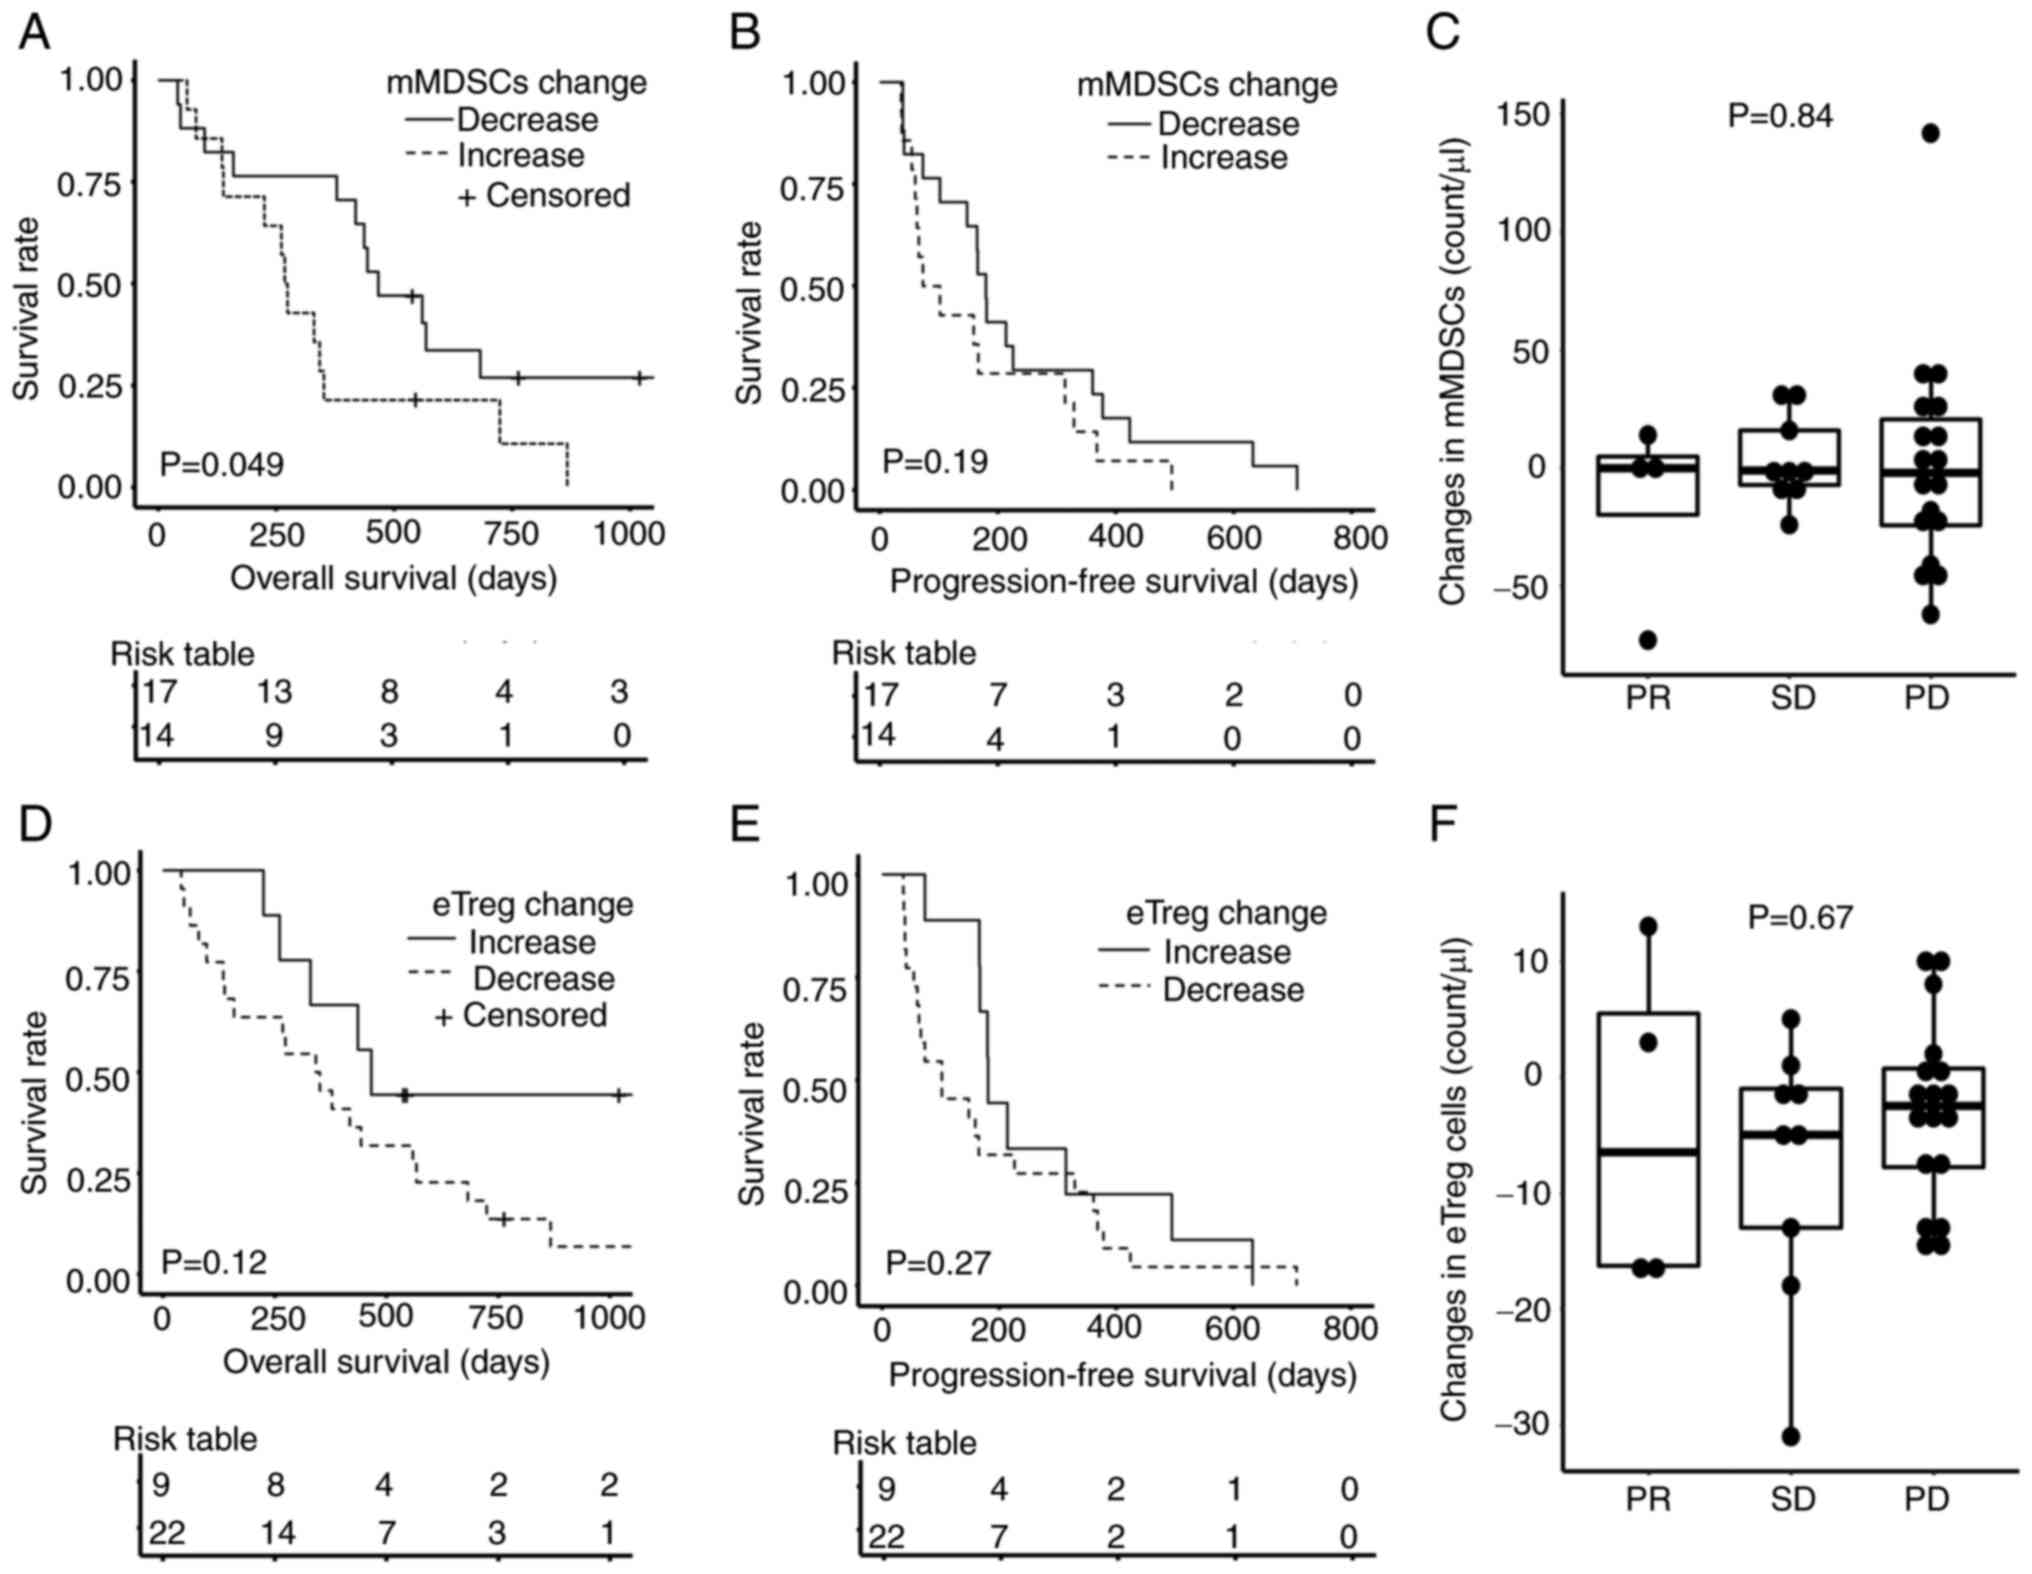 | Figure 5.Overall survival, progression-free
survival and responses to PEM according to the changes in mMDSCs
and eTregs after PEM. Kaplan-Meier estimates of (A) overall
survival and (B) progression-free survival according to the changes
in mMDSCs. Increase, group with increased mMDSCs after PEM
administration; decrease, group with decreased mMDSCs after PEM
administration. (C) Changes in mMDSC counts were compared according
to response to PEM. Kaplan-Meier estimates of (D) overall survival
and (E) progression-free survival according to the changes in
eTregs. Increase, group with increased eTreg after PEM
administration; decrease, group with decreased eTreg after PEM
administration; (F) Changes in eTreg counts were compared according
to response to PEM. A log-rank test was performed in (A, B, D and
E). Kruskal-Wallis test was performed in (C and F). eTreg, effector
regulatory T cell (FOXP3highCD45RA-CD4+ T cell); mMDSC, monocytic
myeloid-derived suppressor cell (CD11b+CD14+CD15-HLA-DR-CD33+);
PEM, pembrolizumab; PR, partial response; SD, stable disease; PD,
progressive disease. |
Because the changes in mMDSC count were associated
with OS after PEM, we compared clinical and laboratory data between
patients with increased vs. decreased mMDSCs after PEM. Those
patients with increased mMDSCs had received more cycles of
chemotherapy before PEM treatment than patients with decreased
mMDSCs (Table SVIII). However,
there were no statistically significant differences in the changes
of immune cells, especially T cells, before and after PEM between
patients who received >6 courses of chemotherapy vs. those who
received ≤6 courses (Table SIX).
Although patients who received fewer chemotherapy courses did not
necessarily exhibit decreased mMDSC counts after PEM, patients who
did have decreased mMDSC had all received fewer courses (Fig. S3). Thus, taken together, these
data suggest that pre-treatment chemotherapy influenced mMDSC but
not T cell dynamics on PEM treatment.
Peripheral blood might not represent the tumor
microenvironment in the advanced tumor. To compensate for this
limitation, we re-analyzed the RNA-Seq data of pre-treatment tumor
samples from a large phase 2 trial (IMvigor210) (17). ssGSEA using gene-sets for MDSC
(14) and TAM (15) was performed in the IMvigor210
cohort. Patients were divided into two groups, High and Low,
according to the median ssGSEA score of each gene set. None of them
had a statistically significant influence on OS (Fig. S4). The immunological status might
be different between PB and the tumor.
Discussion
In the present study, we performed immune profiling
just before and 3 weeks after administration of PEM using PBMCs
from 31 advanced UC patients refractory to chemotherapy. PEM
promoted the accumulation of senescent and late-differentiated
CD8+T cells and reduced eTreg cell numbers in peripheral blood. PCA
and correlation coefficient analysis demonstrated that the dynamics
of senescent and late-differentiated CD4+ and
CD8+ T cells were strongly associated with each other.
Although mMDSCs did not show a unified tendency in patients and
exhibited little correlation with other immune cell phenotypes,
decreased mMDSC counts after PEM were associated with better
overall survival.
This study demonstrated that PEM treatment was
associated with increased numbers of CD8+ T cells
carrying senescence and terminal differentiation markers in most
patients' peripheral blood (Fig.
2). Consistent with this, the contributions of both senescent
and TD CD8+ T cells to the first principal component in PCA were
high (senescent CD8+ T cells, PC1=0.86, TD CD8+ T cells,
contribution=0.86, Fig. 3A and
Table SVII). Tumor-specific CD8+
T cells may become dysfunctional, senescent, or terminally
differentiated due to repeated antigen stimulation (18–20),
and these cells have low proliferation capacity. Therefore, these
dysfunctional cells may not exert a sufficient antitumor effect by
themselves in vivo (21). These
data may explain why patients in cluster 1 had shorter OS than
patients in clusters 2 and 3 (Fig.
3D).
Peripheral eTreg counts were significantly decreased
by PEM (Fig. 2). eTregs had a weak
negative correlation with naïve CD4+ T cells (Fig. 4). A previous study had reported
that PD-L1 played an important role in differentiating naïve T
cells into Tregs in experiments using PD-L1 knockout mice (22). PEM might inhibit eTreg
differentiation, thereby increasing naïve CD4+ T cells and
decreasing eTreg after PEM. In addition, eTregs positively
correlated with CM and senescent CD8+ T cells (r=0.40
and 0.41, respectively, Fig. 4).
Although not statistically significant, patients with increased
eTreg displayed better OS (Fig.
5D). The presence of eTregs might limit the excessive
differentiation of T cells induced by PEM. In contrast, there was
no clear tendency regarding mMDSC changes before and after PEM when
examining the whole patient cohort, and mMDSC after PEM behaved
independently of other immune cells (Figs. 3 and 4). However, increased mMDSCs were
associated with shorter OS (Fig.
5). This is consistent with a previous report that increased
peripheral MDSCs were associated with unfavorable prognostic
changes (23). As one of the
mechanisms of resistance to nivolumab, a previous study reported
that mMDSCs expressing galectin-9 reduced the ability of
TIM-3+CD8+ T cells in PBMCs of NSCLC patients to secrete
IFNγ (24). mMDSC might have
affected the CD8+T cells described in the present study through
this mechanism. However, we did not confirm the expression of
either TIM3 or galectin-9 in our study.
Human MDSCs are commonly defined by the myeloid
markers CD14+, CD11b+, and CD33+, low HLA-DR and negativity for
lineage markers (CD3, CD19 and CD56). These markers define three
subsets of human MDSC, namely, monocytic MDSC
(Lin-HLA-DRlow/+CD11b+CD33+CD14+), granulocytic or
polymorphonuclear MDSC (CD11b+CD14-CD15+ or CD11b+CD14-CD66b+), and
early-stage MDSC (HLA-DR-CD33+) (25). MDSCs are thought to represent an
adverse prognostic factor in immunotherapy because they act
suppressively in the immune microenvironment through direct
cell-cell contact or indirect effects via remodeling the
microenvironment. However, which subtypes of MDSCs are most
prognostic is still controversial and may differ depending on the
type of cancer (26).
Unfortunately, density gradient purification of PBMCs from whole
blood results in the loss of granulocytes. Therefore, our study
could not examine granulocytic MDSCs. However, mMDSCs did clearly
impact the prognosis of patients treated with PEM in our study
(Fig. 5).
Chemotherapy before immunotherapy is a factor that
can affect MDSCs. For example, gemcitabine and 5-FU selectively
induce apoptotic cell death of MDSCs and increase IFN-γ production
by tumor-infiltrating tumor-specific CD8+T cells in in vitro and in
vivo experiments in mice (27).
However, even if the same chemotherapeutic agents are used, the
effects on MDSCs may differ according to the dose or number of
doses of chemotherapy (28). The
duration, dose, and type of chemotherapy before immunotherapy were
not standardized in the present study. However, granulocyte
colony-stimulating factor (G-CSF) that affects MDSCs always
followed chemotherapy in these patients. G-CSF promotes the
survival of granulocytes, the proliferation and migration of
neutrophils and, in addition, MDSCs (29). Therefore, the use of G-CSF for
neutropenia, which occurs as an adverse event of chemotherapy, may
contribute to the maintenance of MDSCs in the tumor
microenvironment and diminish the effectiveness of subsequent
immunotherapy.
Several molecules can be targeted to improve immune
checkpoint inhibition by regulating MDSCs. A previous study with
murine rhabdomyosarcoma showed that CXCR2-positive MDSCs inhibited
the antitumor effect of anti-PD-1 antibody treatment and that
anti-CXCR2 monoclonal antibody therapy enhanced it (30,31).
It has been reported that Sema4D induced MDSC in the tumor
microenvironment (32) and that
head and neck squamous cell carcinoma patients with high plasma
Sema4D levels had less infiltration of immune cells into the tumor
microenvironment (33).
Experiments with murine oral cancer-1 showed that Sema4D Ab
combined with either CTLA-4 or PD-1 blockade enhanced tumor
rejection or delayed tumor growth (34). Such combination therapy that
inhibits MDSCs may be effective for urothelial cancer.
The PCA algorithm can compress a dataset onto a
lower-dimensional feature subspace to maintain the most relevant
information. Therefore, PCA analysis was performed to characterize
the immunological changes in various immune phenotypes caused by
PEM. In fact, the results of Fig.
2 were summarized in Fig. 3.
Irrespective of the pre-treatment chemotherapy, PCA demonstrated
the T cells changes in PC1 and PC2. In addition, there were no
statistically significant differences in the changes of immune
cells, especially T cells, before and after PEM between patients
who received >6 courses of chemotherapy vs. those who received
≤6 courses (Table SIX).
Therefore, taken together, we considered PEM caused these T cell
changes. In contrast, changes in mMDSC were affected by
pre-treatment chemotherapy (Fig.
S3).
There are several limitations to this study. First,
the difficulties in accurately detecting all PD-1 receptors on T
cells from patients treated with anti-PD-1 antibodies create a
potential confounder because detecting antibodies compete for their
binding to PD-1 with therapeutic antibodies (16). There are two major anti-PD-1
monoclonal antibodies, EH12.2H7 and MIH4. The former is more
sensitive than the latter in the absence of PEM; however, EH12.2H7
competes for PD-1 binding with PEM and cannot detect PD-1
expression in the presence of PEM. On the other hand, MIH4 can bind
to PD-1 in the presence of PEM; however, it only detects a part of
PD-1 expression. We chose clone EH12.2H7; therefore, only the data
before PEM administration can be evaluated. A similar problem might
be observed in the previous report by Tzeng, reporting that
anti-PD-L1 treatment correlated with decreased PD-L1+
mMDSC, while doses of anti-PD-1 correlated with decreased
PD-1+ mMDSCs (35). A
reliable method for quantifying PD-1 expression on immune cells
from treated patients is warranted. Second, we only analyzed the
immune cell changes before and after the first dose to identify
predictive biomarkers for PEM response early during treatment.
Therefore, data were difficult to represent the long-term changes
in immune cells after PEM. The examination of the long-term changes
of immune cells after PEM is required in future studies. Third, the
type, timing, and dose of chemotherapy before administration of PEM
was not unified in the present study. However, the changes in
immune cell count between pre- and on-treatment samples were not
affected by the number of chemotherapy courses (Table SIX). Finally, only patients whose
peripheral blood could be collected twice, before and 3 weeks after
starting PEM administration, were surveyed, which may have biased
selection.
In conclusion, PEM treatment promoted the
accumulation of CD4+ and CD8+ T cells with a senescent or
late-differentiated phenotype and reduced the number of eTreg cells
in the PB of UC patients. T cell activation is necessary for
effective therapy, but excessive differentiation of T cells may be
harmful for long-term survival. Changes in mMDSCs after PEM were
different from those of other immune cells and their decrease in
individual patients was associated with better overall
survival.
Supplementary Material
Supporting Data
Supporting Data
Acknowledgements
The authors would like to thank Ms. Mikiko Shibuya
and Ms. Yaeko Furuhashi (Department of Immunotherapeutics, The
University of Tokyo Hospital, Tokyo, Japan) for processing blood
samples. The authors would also like to thank Dr Ken-ichi Hashimoto
(Department of Urology, The University of Tokyo Hospital, Tokyo,
Japan) for collecting blood samples.
Funding
Funding: No funding was received.
Availability of data and materials
The datasets used and/or analyzed during the current
study are available from the corresponding author on reasonable
request.
Authors' contributions
TTe processed the blood samples and carried out the
flow cytometry and biological analyses. YKo, YKu and KN designed
the study, provided technical guidance and analyzed the data. TK,
JM, YA, YY, YS and DY explained and obtained consent forms,
collected peripheral blood samples, and analyzed and interpreted
the data. NT and TTs provided guidance on statistical analysis and
analyzed the data. KK and HK contributed conceptional design,
interpreted the data, and confirmed the authenticity of all the raw
data and the analysis results. TTe and KK wrote and revised the
manuscript. All authors read and approved the final manuscript.
Ethics approval and consent to
participate
This clinical study on the immunological impact of
immunotherapy in patients with UC was conducted at The University
of Tokyo Hospital. All procedures in this study were performed
following the ethical standards of the institution, and in
conformity with the 1964 Helsinki Declaration and its later
amendments or comparable ethical standards. The research protocol
was approved by the Ethical Committee of The University of Tokyo
(Tokyo, Japan). Written informed consent to participate in the
study was obtained from each patient before they entered the
study.
Patient consent for publication
Patient consent for publication was covered by the
informed consent document.
Competing interests
The authors declare that they have no competing
interests.
Glossary
Abbreviations
Abbreviations:
|
PEM
|
pembrolizumab
|
|
PBMC
|
peripheral blood mononuclear cell
|
|
CBC
|
complete blood count
|
|
TMB
|
tumor mutational burden
|
|
CRP
|
C-reactive protein
|
|
LDH
|
lactate dehydrogenase
|
|
mMDSC
|
monocytic myeloid-derived suppressor
cell
|
|
OS
|
overall survival
|
|
UC
|
urothelial carcinoma
|
|
CM
|
central memory
|
|
EM
|
effector memory
|
|
TD
|
terminally differentiated
|
|
eTreg
|
effector regulatory T cell
|
|
G-CSF
|
granulocyte colony-stimulating
factor
|
|
ICI
|
immune checkpoint inhibitor
|
|
PCA
|
principal component analysis
|
References
|
1
|
Bellmunt J, de Wit R, Vaughn DJ, Fradet Y,
Lee JL, Fong L, Vogelzang NJ, Climent MA, Petrylak DP, Choueiri TK,
et al: Pembrolizumab as second-line therapy for advanced urothelial
carcinoma. N Engl J Med. 376:1015–1026. 2017. View Article : Google Scholar : PubMed/NCBI
|
|
2
|
Yarchoan M, Hopkins A and Jaffee EM: Tumor
Mutational Burden and response rate to PD-1 inhibition. N Engl J
Med. 377:2500–2501. 2017. View Article : Google Scholar : PubMed/NCBI
|
|
3
|
Rosenberg JE, Hoffman-Censits J, Powles T,
van der Heijden MS, Balar AV, Necchi A, Dawson N, O'Donnell PH,
Balmanoukian A, Loriot Y, et al: Atezolizumab in patients with
locally advanced and metastatic urothelial carcinoma who have
progressed following treatment with platinum-based chemotherapy: A
single-arm, multicentre, phase 2 trial. Lancet. 387:1909–1920.
2016. View Article : Google Scholar : PubMed/NCBI
|
|
4
|
Bagley SJ, Kothari S, Aggarwal C, Bauml
JM, Alley EW, Evans TL, Kosteva JA, Ciunci CA, Gabriel PE, Thompson
JC, et al: Pretreatment neutrophil-to-lymphocyte ratio as a marker
of outcomes in nivolumab-treated patients with advanced
non-small-cell lung cancer. Lung Cancer. 106:1–7. 2017. View Article : Google Scholar : PubMed/NCBI
|
|
5
|
Riedl JM, Barth DA, Brueckl WM, Zeitler G,
Foris V, Mollnar S, Stotz M, Rossmann CH, Terbuch A, Balic M, et
al: C-reactive protein (CRP) levels in immune checkpoint inhibitor
response and progression in advanced non-small cell lung cancer: A
Bi-center study. Cancers (Basel). 12:23192020. View Article : Google Scholar : PubMed/NCBI
|
|
6
|
Weide B, Martens A, Hassel JC, Berking C,
Postow MA, Bisschop K, Simeone E, Mangana J, Schilling B, Di
Giacomo AM, et al: Baseline biomarkers for outcome of melanoma
patients treated with pembrolizumab. Clin Cancer Res. 22:5487–5496.
2016. View Article : Google Scholar : PubMed/NCBI
|
|
7
|
Kagamu H, Kitano S, Yamaguchi O, Yoshimura
K, Horimoto K, Kitazawa M, Fukui K, Shiono A, Mouri A, Nishihara F,
et al: CD4+ T-cell immunity in the peripheral blood
correlates with response to anti-PD-1 therapy. Cancer Immunol Res.
8:334–344. 2020. View Article : Google Scholar : PubMed/NCBI
|
|
8
|
Mazzaschi G, Facchinetti F, Missale G,
Canetti D, Madeddu D, Zecca A, Veneziani M, Gelsomino F, Goldoni M,
Buti S, et al: The circulating pool of functionally competent NK
and CD8+ cells predicts the outcome of anti-PD1 treatment in
advanced NSCLC. Lung Cancer. 127:153–163. 2019. View Article : Google Scholar : PubMed/NCBI
|
|
9
|
Ornstein MC, Diaz-Montero CM, Rayman P,
Elson P, Haywood S, Finke JH, Kim JS, Pavicic PG Jr, Lamenza M,
Devonshire S, et al: Myeloid-derived suppressors cells (MDSC)
correlate with clinicopathologic factors and pathologic complete
response (pCR) in patients with urothelial carcinoma (UC)
undergoing cystectomy. Urol Oncol. 36:405–412. 2018. View Article : Google Scholar : PubMed/NCBI
|
|
10
|
Jones BR, Miller RL, Kinloch NN, Tsai O,
Rigsby H, Sudderuddin H, Shahid A, Ganase B, Brumme CJ, Harris M,
et al: Genetic diversity, compartmentalization, and age of HIV
proviruses persisting in CD4+ T cell subsets during
long-term combination antiretroviral therapy. J Virol.
94:e01786–19. 2020. View Article : Google Scholar : PubMed/NCBI
|
|
11
|
Bronte V, Brandau S, Chen SH, Colombo MP,
Frey AB, Greten TF, Mandruzzato S, Murray PJ, Ochoa A,
Ostrand-Rosenberg S, et al: Recommendations for myeloid-derived
suppressor cell nomenclature and characterization standards. Nat
Commun. 7:121502016. View Article : Google Scholar : PubMed/NCBI
|
|
12
|
Miyara M, Yoshioka Y, Kitoh A, Shima T,
Wing K, Niwa A, Parizot C, Taflin C, Heike T, Valeyre D, et al:
Functional delineation and differentiation dynamics of human
CD4+ T cells expressing the FoxP3 transcription factor.
Immunity. 30:899–911. 2009. View Article : Google Scholar : PubMed/NCBI
|
|
13
|
Subramanian A, Kuehn H, Gould J, Tamayo P
and Mesirov JP: GSEA-P: A desktop application for gene set
enrichment analysis. Bioinformatics. 23:3251–3253. 2007. View Article : Google Scholar : PubMed/NCBI
|
|
14
|
Angelova M, Charoentong P, Hackl H,
Fischer ML, Snajder R, Krogsdam AM, Waldner MJ, Bindea G, Mlecnik
B, Galon J and Trajanoski Z: Characterization of the
immunophenotypes and antigenomes of colorectal cancers reveals
distinct tumor escape mechanisms and novel targets for
immunotherapy. Genome Biol. 16:642015. View Article : Google Scholar : PubMed/NCBI
|
|
15
|
Cassetta L, Fragkogianni S, Sims AH,
Swierczak A, Forrester LM, Zhang H, Soong DYH, Cotechini T, Anur P,
Lin EY, et al: Human tumor-associated macrophage and monocyte
transcriptional landscapes reveal cancer-specific reprogramming,
biomarkers, and therapeutic targets. Cancer Cell. 35:588–602.e10.
2019. View Article : Google Scholar : PubMed/NCBI
|
|
16
|
Zelba H, Bochem J, Pawelec G, Garbe C,
Wistuba-Hamprecht K and Weide B: Accurate quantification of T-cells
expressing PD-1 in patients on anti-PD-1 immunotherapy. Cancer
Immunol Immunother. 67:1845–1851. 2018. View Article : Google Scholar : PubMed/NCBI
|
|
17
|
Mariathasan S, Turley SJ, Nickles D,
Castiglioni A, Yuen K, Wang Y, Kadel EE III, Koeppen H, Astarita
JL, Cubas R, et al: TGFβ attenuates tumour response to PD-L1
blockade by contributing to exclusion of T cells. Nature.
554:544–548. 2018. View Article : Google Scholar : PubMed/NCBI
|
|
18
|
Wei SC, Levine JH, Cogdill AP, Zhao Y,
Anang NAS, Andrews MC, Sharma P, Wang J, Wargo JA, Pe'Er D and
Allison JP: Distinct cellular mechanisms underlie anti-CTLA-4 and
anti-PD-1 checkpoint blockade. Cell. 170:1120–1133.e17. 2017.
View Article : Google Scholar : PubMed/NCBI
|
|
19
|
Shyer JA, Flavell RA and Bailis W:
Metabolic signaling in T cells. Cell Res. 30:649–659. 2020.
View Article : Google Scholar : PubMed/NCBI
|
|
20
|
Janelle V, Neault M, Lebel MÈ, De Sousa
DM, Boulet S, Durrieu L, Carli C, Muzac C, Lemieux S, Labrecque N,
et al: p16INK4a regulates cellular senescence in
PD-1-expressing human T cells. Front Immunol. 12:6985652021.
View Article : Google Scholar : PubMed/NCBI
|
|
21
|
Ruhland MK and Alspach E: Senescence and
immunoregulation in the tumor microenvironment. Front Cell Dev
Biol. 9:7540692021. View Article : Google Scholar : PubMed/NCBI
|
|
22
|
Francisco LM, Salinas VH, Brown KE,
Vanguri VK, Freeman GJ, Kuchroo VK and Sharpe AH: PD-L1 regulates
the development, maintenance, and function of induced regulatory T
cells. J Exp Med. 206:3015–3029. 2009. View Article : Google Scholar : PubMed/NCBI
|
|
23
|
Bagchi S, Yuan R and Engleman EG: Immune
checkpoint inhibitors for the treatment of cancer: Clinical impact
and mechanisms of response and resistance. Annu Rev Pathol.
16:223–249. 2021. View Article : Google Scholar : PubMed/NCBI
|
|
24
|
Limagne E, Richard C, Thibaudin M, Fumet
JD, Truntzer C, Lagrange A, Favier L, Coudert B and Ghiringhelli F:
Tim-3/galectin-9 pathway and mMDSC control primary and secondary
resistances to PD-1 blockade in lung cancer patients.
Oncoimmunology. 8:e15645052019. View Article : Google Scholar : PubMed/NCBI
|
|
25
|
Dumitru CA, Moses K, Trellakis S, Lang S
and Brandau S: Neutrophils and granulocytic myeloid-derived
suppressor cells: Immunophenotyping, cell biology and clinical
relevance in human oncology. Cancer Immunol Immunother.
61:1155–1167. 2012. View Article : Google Scholar : PubMed/NCBI
|
|
26
|
Hou A, Hou K, Huang Q, Lei Y and Chen W:
Targeting myeloid-derived suppressor cell, a promising strategy to
overcome resistance to immune checkpoint inhibitors. Front Immunol.
11:7832020. View Article : Google Scholar : PubMed/NCBI
|
|
27
|
Vincent J, Mignot G, Chalmin F, Ladoire S,
Bruchard M, Chevriaux A, Martin F, Apetoh L, Rébé C and
Ghiringhelli F: 5-Fluorouracil selectively kills tumor-associated
myeloid-derived suppressor cells resulting in enhanced T
cell-dependent antitumor immunity. Cancer Res. 70:3052–3061. 2010.
View Article : Google Scholar : PubMed/NCBI
|
|
28
|
Wang Z, Till B and Gao Q: Chemotherapeutic
agent-mediated elimination of myeloid-derived suppressor cells.
Oncoimmunology. 6:e13318072017. View Article : Google Scholar : PubMed/NCBI
|
|
29
|
Li W, Zhang X, Chen Y, Xie Y, Liu J, Feng
Q, Wang Y, Yuan W and Ma J: G-CSF is a key modulator of MDSC and
could be a potential therapeutic target in colitis-associated
colorectal cancers. Protein Cell. 7:130–140. 2016. View Article : Google Scholar : PubMed/NCBI
|
|
30
|
Highfill SL, Cui Y, Giles AJ, Smith JP,
Zhang H, Morse E, Kaplan RN and Mackall CL: Disruption of
CXCR2-mediated MDSC tumor trafficking enhances anti-PD1 efficacy.
Sci Transl Med. 6:237ra672014. View Article : Google Scholar : PubMed/NCBI
|
|
31
|
Li T, Liu T, Zhu W, Xie S, Zhao Z, Feng B,
Guo H and Yang R: Targeting MDSC for immune-checkpoint blockade in
cancer immunotherapy: Current progress and new prospects. Clin Med
Insights Oncol. Aug 5–2021.(Epub ahead of print). View Article : Google Scholar
|
|
32
|
Younis RH, Han KL and Webb TJ: Human head
and neck squamous cell carcinoma-associated semaphorin 4D induces
expansion of myeloid-derived suppressor cells. J Immunol.
196:1419–1429. 2016. View Article : Google Scholar : PubMed/NCBI
|
|
33
|
Younis RH, Ghita I, Elnaggar M,
Chaisuparat R, Theofilou VI, Dyalram D, Ord RA, Davila E, Tallon
LJ, Papadimitriou JC, et al: Soluble Sema4D in plasma of head and
neck squamous cell carcinoma patients is associated with underlying
non-inflamed tumor profile. Front Immunol. 12:5966462021.
View Article : Google Scholar : PubMed/NCBI
|
|
34
|
Clavijo PE, Friedman J, Robbins Y, Moore
EC, Smith E, Zauderer M, Evans EE and Allen CT: Semaphorin4D
inhibition improves response to immune-checkpoint blockade via
attenuation of MDSC recruitment and function. Cancer Immunol Res.
7:282–291. 2019. View Article : Google Scholar : PubMed/NCBI
|
|
35
|
Tzeng A, Diaz-Montero CM, Rayman PA, Kim
JS, Pavicic PG Jr, Finke JH, Barata PC, Lamenza M, Devonshire S,
Schach K, et al: Immunological correlates of response to immune
checkpoint inhibitors in metastatic urothelial carcinoma. Target
Oncol. 13:599–609. 2018. View Article : Google Scholar : PubMed/NCBI
|