Introduction
Pancreatic adenocarcinoma (PAAD), which is expected
to become the second leading cause of cancer-associated mortality
worldwide, is usually lethal despite treatment efforts (1). Furthermore, ~80% of patients exhibit
advanced cases at diagnosis due to the lack of specific tumor
markers and undefined early symptoms (2). Limited and delayed diagnostic
strategies increase the difficulty of diagnosis, thus severely
impeding various therapeutic options. Although increasing evidence
suggests that pancreatic cancer is linked to several variables,
such as smoking, alcohol consumption, coffee intake, a high-fat and
protein diet, and genetic background (3–5), the
causes of pancreatic cancer remain unknown.
At present, treatment options for PAAD focus mostly
on the clinicopathological evaluation of the malignancy, and
include surgery followed by chemotherapy and radiotherapy (6,7).
According to sequencing data, pancreatic cancer comprises markedly
diverse tumors that acquire resistance to standard chemotherapy and
radiation therapy (8,9). As a result, traditional chemotherapy
and radiotherapy often fail to produce the anticipated therapeutic
impact, while gemcitabine-targeted treatment fails to increase
overall survival (OS). Therefore, the identification of novel
effective biomarkers for early diagnosis and prognosis is required
to improve the survival rate of patients with PAAD.
In recent years, emerging data have demonstrated
that essential genes and signaling pathways, including KRAS, p53,
SMAD4, Wnt, PI3K/AKT and Notch signaling, are critical in the
tumorigenesis and progression of PAAD (10,11).
However, at present, there is no effective clinical treatment for
PAAD that targets these genes and signaling pathways. Novel
therapies to prevent pancreatic cancer growth and metastasis are
urgently required. It has been reported that numerous growth factor
signaling pathways are involved in PAAD tumorigenesis and
progression, and fibroblast growth factors (FGFs) signaling
pathways are an example of this (12,13).
FGFs are a large family of >20 members that encode secreted
polypeptides and act through tyrosine kinase receptors known as FGF
receptors (14). FGF is named for
its promotion of fibroblast proliferation, and is present in
various tissues (15). FGFs are
involved in various cellular activities, including cell
proliferation, metabolism, differentiation and tissue repair
(16). It has been reported that
FGFs participate in cancer progression in multiple types of tumor,
and are closely associated with prognosis. Bock et al
(17) found that FGF2 could be
released by cancer cells to enable apoptotic resistance upon
apoptotic stress, while an association existed among increased FGF
signaling, anti-apoptotic Bcl-2 protein expression and poor patient
prognosis. Additionally, FGF18 promotes the tumor proliferation and
metastasis of non-small cell lung cancer (NSCLC) via the histone
deacetylase 7-β-catenin-FGF18 pathway (18). However, high FGF9 expression is
associated with good prognosis in ovarian cancer (19). Cancer types that are triggered by
FGF signaling can be treated with targeted medicines such as
tyrosine kinase inhibitors (20).
Targeting FGF signaling is a realistic therapeutic strategy, as
evidenced by the fact that treatments are currently being utilized
in several patient populations (21–23).
Furthermore, previous studies have demonstrated that FGFs
participate in the development of chemoresistance in tumor cells
(24). However, the role and
mechanism of FGFs in PAAD are unclear. Therefore, the present study
aimed to further explore the role and potential mechanism of FGFs
in PAAD.
In the present study, the prognostic value of the
FGF gene family in PAAD was comprehensively analyzed using RNA-seq
data and clinical information from public databases, and a risk
score was constructed. It was revealed that FGF2 and FGF8 may be
useful independent prognostic biomarkers for the prognosis of
patients with PAAD. Immunohistochemistry (IHC) also validated that
FGF2 and FGF8 were more highly expressed in PAAD tissues compared
with that in normal tissues. The present findings may offer a novel
understanding of the selection of prognostic biomarkers of FGFs in
PAAD.
Materials and methods
Data acquisition and processing
mRNA expression datasets and corresponding clinical
information of The Cancer Genome Atlas (TCGA)-PAAD were obtained
from the Gene Expression Profiling Interactive Analysis (GEPIA)
database (http://gepia.cancer-pku.cn/). Data were analyzed using
R (version 4.0.3) (https://www.r-project.org/) and the matched version of
R Bioconductor package (http://bioconductor.org/). The Assistant for Clinical
Bioinformatics database (https://www.aclbi.com/static/index.html#/) was used
for cluster analysis and construction of the risk assessment model
for FGFs of the PAAD dataset. These data are open resources, and
thus, ethics approval or informed patient consent were not required
for the use of these data in the current study.
Protein-protein interaction (PPI)
network construction
A PPI network was constructed using the Search Tool
for the Retrieval of Interacting Genes/Proteins database (version
11.5) (https://cn.string-db.org/). FGFs,
including FGF1, FGF2, FGF3, FGF4, FGF5, FGF6, FGF7, FGF8, FGF9,
FGF10, FGF11, FGF12, FGF13, FGF14, FGF16, FGF17, FGF18, FGF19,
FGF20, FGF21, FGF22 and FGF23, were placed in the search box. The
minimum required interaction score was set at 0.4, and active
interaction sources included text mining, experiments, databases,
co-expression, neighborhood, gene fusion and co-occurrence.
Correlation analysis
RNA-sequencing expression profiles and corresponding
clinical information for TCGA-PAAD were downloaded from TCGA
dataset (https://portal.gdc.com). The two-gene
correlation map is realized by the R software package ggstatsplot,
and the multi-gene correlation pheatmap is displayed by the R
software package. Spearman's correlation analysis was used to
describe the correlation between quantitative variables without a
normal distribution. P<0.05 was considered to indicate a
statistically significant difference and correlation coefficients
with an absolute value of >0.3 were considered to show a
correlation. All these analyses were perform with a web tool called
ASSISTANT for Clinical Bioinformatics that combines all these
functions (https://www.aclbi.com/static/index.html#/advance_prognosis).
Functional and pathway enrichment
analysis
Gene Ontology (GO) (http://geneontology.org/) analysis was performed to
determine the potential biological functions of the FGF gene family
using the clusterProfiler R package (version 4.4.4; http://bioconductor.org/packages/release/bioc/html/clusterProfiler.html).
GO analysis was performed according to a threshold of P<0.05 and
q<1.
Identification of molecular
subtypes
Cluster analysis of 20 FGF family genes in
pancreatic cancer was performed. Raw counts of RNA-sequencing data
and corresponding clinical information were obtained from TCGA.
ConsensusClusterPlus (version 1.60.0) was used for consistency
analysis. The maximum number of clusters was 6, and 80% of the
total sample was drawn 100 times. Pheatmap package (version 1.0.12)
was used to generate clustering heatmaps. Prognostic differences
were analyzed among different subgroups (groups C1, C2 and C3), and
the survivalROC package was utilized to draw the survival curve.
All these analysis were perform with a web tool called ASSISTANT
for Clinical Bioinformatics that combines all these functions
(https://www.aclbi.com/static/index.html#/advance_prognosis).
Construction of a risk assessment
model
The least absolute shrinkage and selection operator
(LASSO) regression algorithm were used for feature selection, using
10-fold cross-validation, in the R software package glmnet (version
4.1-1). Kaplan-Meier plotter survival analysis with the log-rank
test was also used to compare the survival difference between the
low-risk and high-risk groups. timeROC (v 0.4) analysis was
performed to compare the predictive accuracy of each gene and risk
score. All these analysis were perform with a web tool called
ASSISTANT for Clinical Bioinformatics that combines all these
functions (https://www.aclbi.com/static/index.html#/advance_prognosis).
Survival prognosis analysis
GEPIA 2 (http://gepia2.cancer-pku.cn/) was used to obtain the
OS significance map data of FGFs in TCGA-PAAD. Cut-off-high (50%)
and cut-off-low (50%) values were used as the expression thresholds
for dividing the high- and low-expression cohorts. Unpaired
Student's t-test was performed for data analysis. P<0.05 was
considered to indicate a statistically significant difference.
Immune infiltration analysis
The ‘Immune-Gene’ module of Tumor Immune Estimation
Resource (TIMER; http://timer.cistrome.org/) was used to explore the
associations among FGF2, FGF8, FGF9, FGF13, FGF17 and FGF22
expression, and immune infiltrates across TCGA-PAAD. Immune
CD8+ T cells, CD4+ T cells, B cells,
macrophages and myeloid dendritic cells were selected. The TIMER
algorithm was applied for immune infiltration estimations. The
estimated P-value was calculated via the purity-adjusted Spearman's
rank correlation test to evaluate the associations between FGFs and
infiltrating immune cells.
Establishment of a six-gene-based
prognostic gene signature
Using the Cox regression model method, univariate
and multivariate analyses were performed to determine whether the
prognostic gene signature could be independent of other
clinicopathological characteristics, including age, sex,
pathological tumor-node-metastasis stage and tumor grade. P<0.05
was considered to indicate a statistically significant difference.
All independent prognostic factors determined by multivariate Cox
regression analysis were included to build a nomogram to
investigate the probability of 1-, 2-, 3- and 5-year OS of PAAD.
All these analysis were perform with a web tool called ASSISTANT
for Clinical Bioinformatics (https://www.aclbi.com/static/index.html#/advance_prognosis).
IHC analysis
PAAD tissue chips (cat. no. PanA020PG03; Shanghai
Xinchao Biological Technology Co., Ltd.) were fixed in 4%
paraformaldehyde at room temperature for 48 h and embedded in
paraffin with a section thickness of 5 µm. The tissue chips were
successively placed in xylene for 10 min each, placed in absolute
ethanol for 5 min, 75% alcohol for 5 min and washed with pure
water. The tissue sections were placed in Tris-EDTA antigen repair
buffer (pH9) in a microwave oven for antigen repair. The solution
was heated at medium heat for 8 min and kept warm for 8 min before
being transferred to medium and low heat for 7 min. After natural
cooling, the glass slides were placed in PBS (pH7.2-7.4) and washed
on a decolorization shaker 3 times, for 5 min each time. A total of
50 µl of 5–10% normal goat serum was added per chip for blocking
(1:19 fold dilution) at room temperature for 30 min.
Immunohistochemical staining of the paraffin-embedded tissues was
performed using FGF2 (1:200; sc-74412; Santa Cruz Biotechnology,
Inc.) and FGF8 (1:200; 20711-1-AP; ProteinTech Group, Inc.) primary
antibodies, anti-mouse secondary antibodies (1:200; GB23301; Wuhan
Servicebio Technology Co., Ltd.), anti-rabbit secondary antibodies
(1:200; GB23303; Wuhan Servicebio Technology Co., Ltd.), and an ABC
Elite immunoperoxidase kit (Wuhan Servicebio Technology Co., Ltd.)
according to the manufacturer's instructions. Subsequently, all
visual fields were observed under an optical microscope, and brown
particles in the cell cytoplasm represented positive staining. IHC
scoring was conducted according to the ratio and intensity of
positive-staining areas. The staining areas were scored as follow:
0–15%, score 1; 16–50%, score 2; 51–100%, score 3. The signal
intensity was scored on a scale of 0–3: 0, negative; 1, weak; 2,
moderate; and 3, strong. IHC scores were averaged from two
experienced pathologists who scored the IHC staining independently.
The IHC analysis involving human samples was approved by the West
China Second University Hospital Institutional Review Board
(Chengdu, China). All methods were performed in accordance with the
relevant guidelines and regulations.
Cell culture and reagents
MIA Paca-2 cells (CL-0627) were purchased from
Procell Life Science & Technology Co., Ltd., and maintained in
DMEM (Gibco; Thermo Fisher Scientific, Inc.) supplemented with 10%
FBS (Nanjing SenBeiJia Biological Technology Co., Ltd.) at 37°C in
an incubator with 5% CO2.
Cell colony formation assay
MIA Paca-2 cells were counted, plated in triplicate
at a density of 800 cells per well in 6-well plates, and cultured
in DMEM (supplemented with10% FBS) at 37°C in an incubator with 5%
CO2. After 24 h, DMSO or 10 µM alofanib was used to
treated the cells, and cultured for 6 days. Subsequently, the cells
were washed twice with PBS and fixed in methanol for ~10 min at
room temperature. After two additional washes with PBS, the cells
were stained with crystal violet for 30 min at room temperature.
Subsequently, the crystal violet was washed out, and the numbers of
colonies (a mass of stained cells visible to the naked eye) were
counted manually.
Statistical analysis
Statistical analysis was performed using R version
4.0.3 (https://www.R-project.org). Survival
curves were plotted using the Kaplan-Meier method. For Kaplan-Meier
curves, P-values were generated by log-rank tests or two-stage
hazard rate comparison analyses, and hazard ratios (HRs) with 95%
CIs was generated by univariate Cox proportional hazards
regression. IHC data (tumor and paired adjacent tumor tissues) was
analysed using Wilcoxon's signed rank test. All other comparisons
were analyzed using an unpaired two-tailed Student's t test.
P<0.05 was considered to indicate a statistically significant
difference.
Results
Associations among the FGF gene
family
The FGF family is one of the most diverse growth
factor groups in vertebrates. In humans, 22 FGF ligands have been
identified, including FGF1, FGF2, FGF3, FGF4, FGF5, FGF6, FGF7,
FGF8, FGF9, FGF10, FGF11, FGF12, FGF13, FGF14, FGF16, FGF17, FGF18,
FGF19, FGF20, FGF21, FGF22 and FGF23 (25). According to bioinformatics analysis
results, FGF6 and FGF23 cannot be detected in PAAD, so these two
FGF members were not included in the present study. The potential
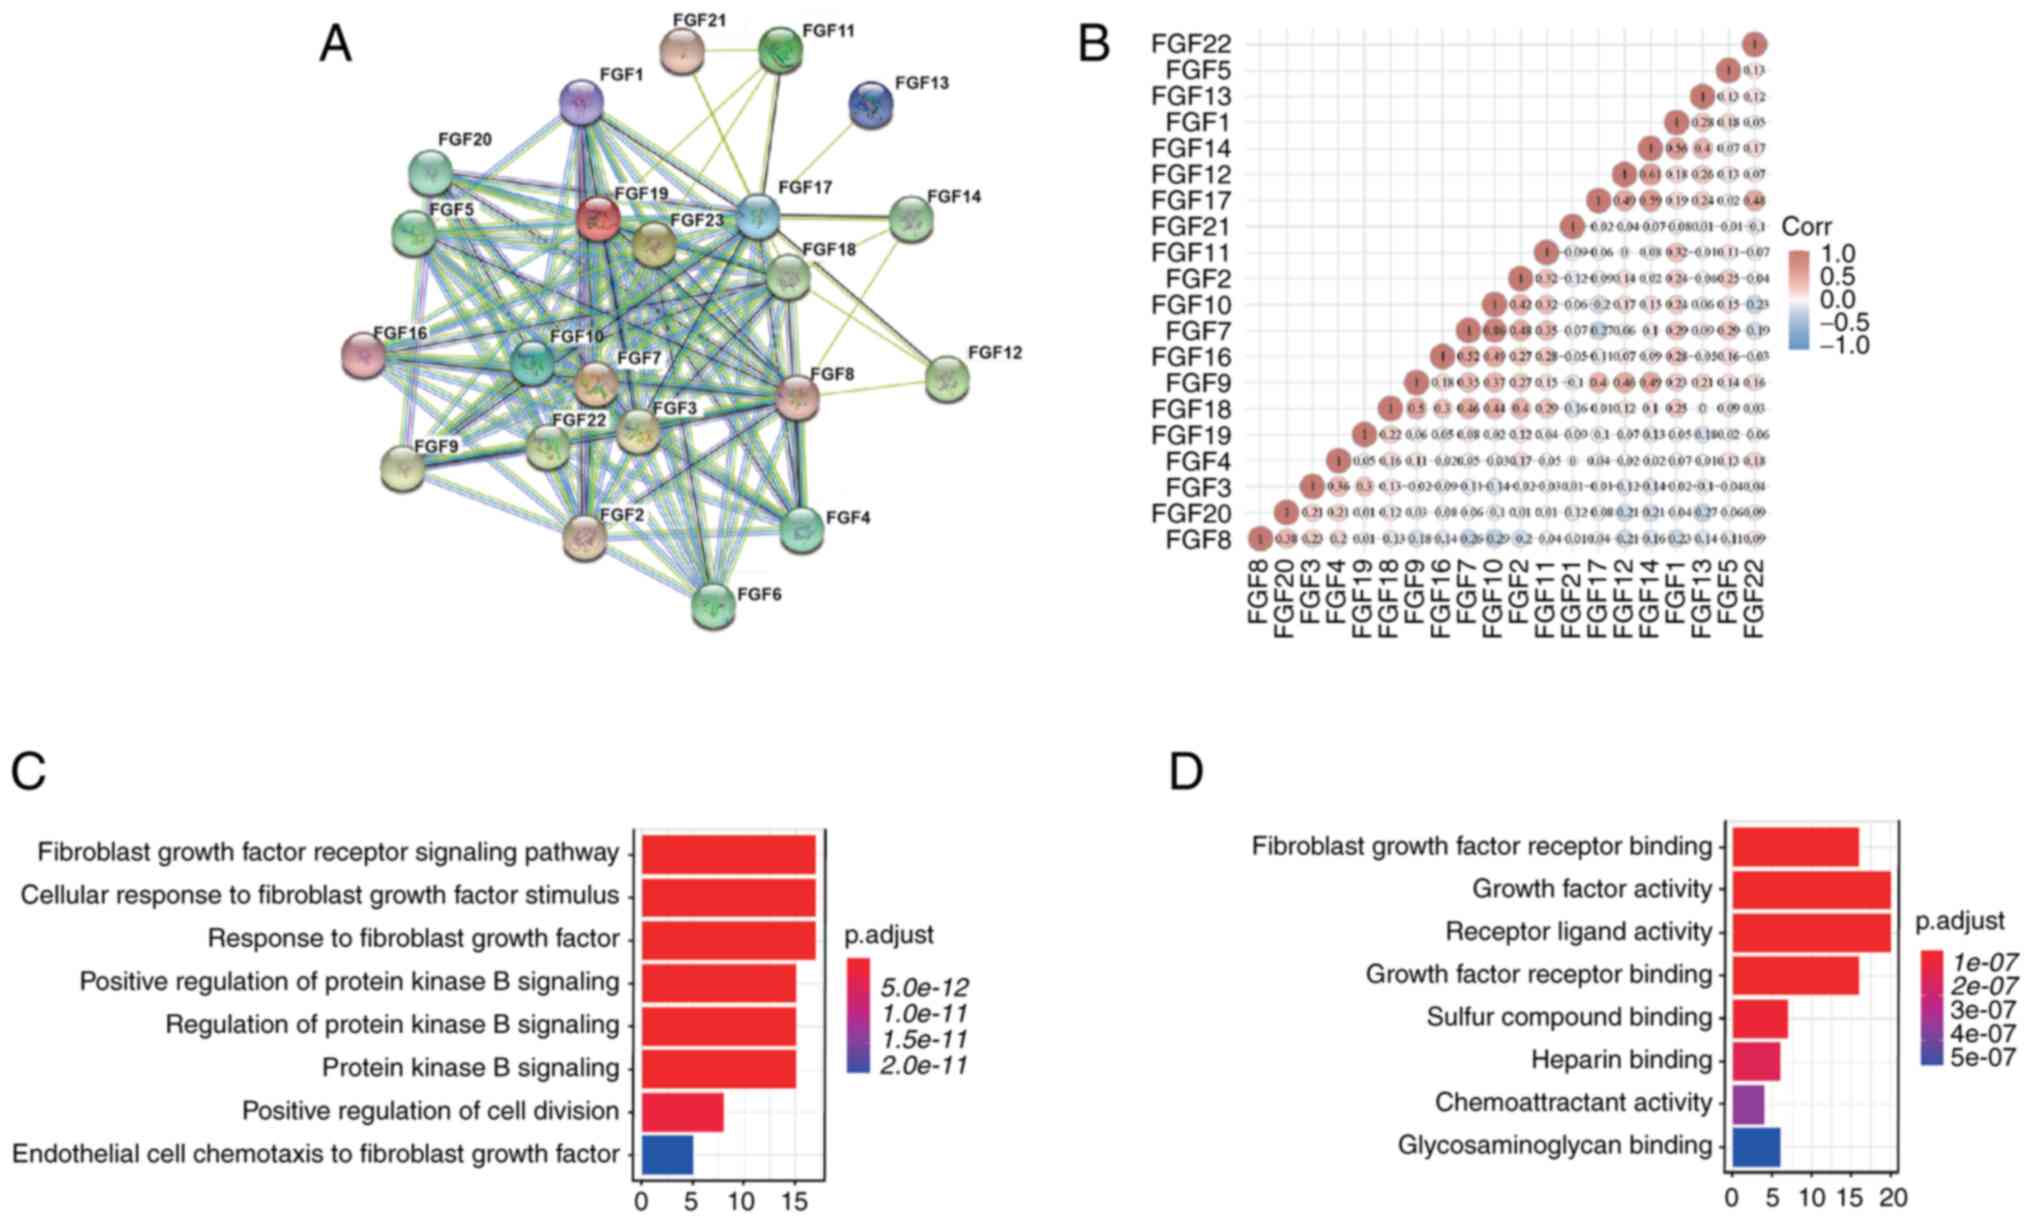
interactions among the FGFs were examined by PPI network analysis.
The details were as follows: Number of nodes, 22, number of edges,
124; average node degree, 11.3; and PPI enrichment,
P<1.0×10⁻¹⁶. These results indicated that there was a
strong interaction among FGF family genes (Fig. 1A). Furthermore, the correlations
between FGF family genes were also determined by analyzing their
mRNA expression using the R software package ggstatsplot for PAAD,
and Spearman's correlation analysis was included. The results
showed significant positive correlations between genes such as FGF1
with FGF14, FGF12 with FGF14, and FGF7 with FGF16 and FGF10, among
others (Fig. 1B). According to the
functional enrichment analysis, FGF family genes were mainly
associated with ‘fibroblast growth factor receptor signaling
pathway’, ‘cellular response to fibroblast growth factor stimulus’,
‘response to fibroblast growth factor’ and ‘protein kinase B
signaling’ (Fig. 1C). Furthermore,
‘growth factor activity’ and ‘receptor ligand activity’ were most
frequently found for molecular functions (Fig. 1D).
Molecular subtype of PAAD based on FGF
family genes
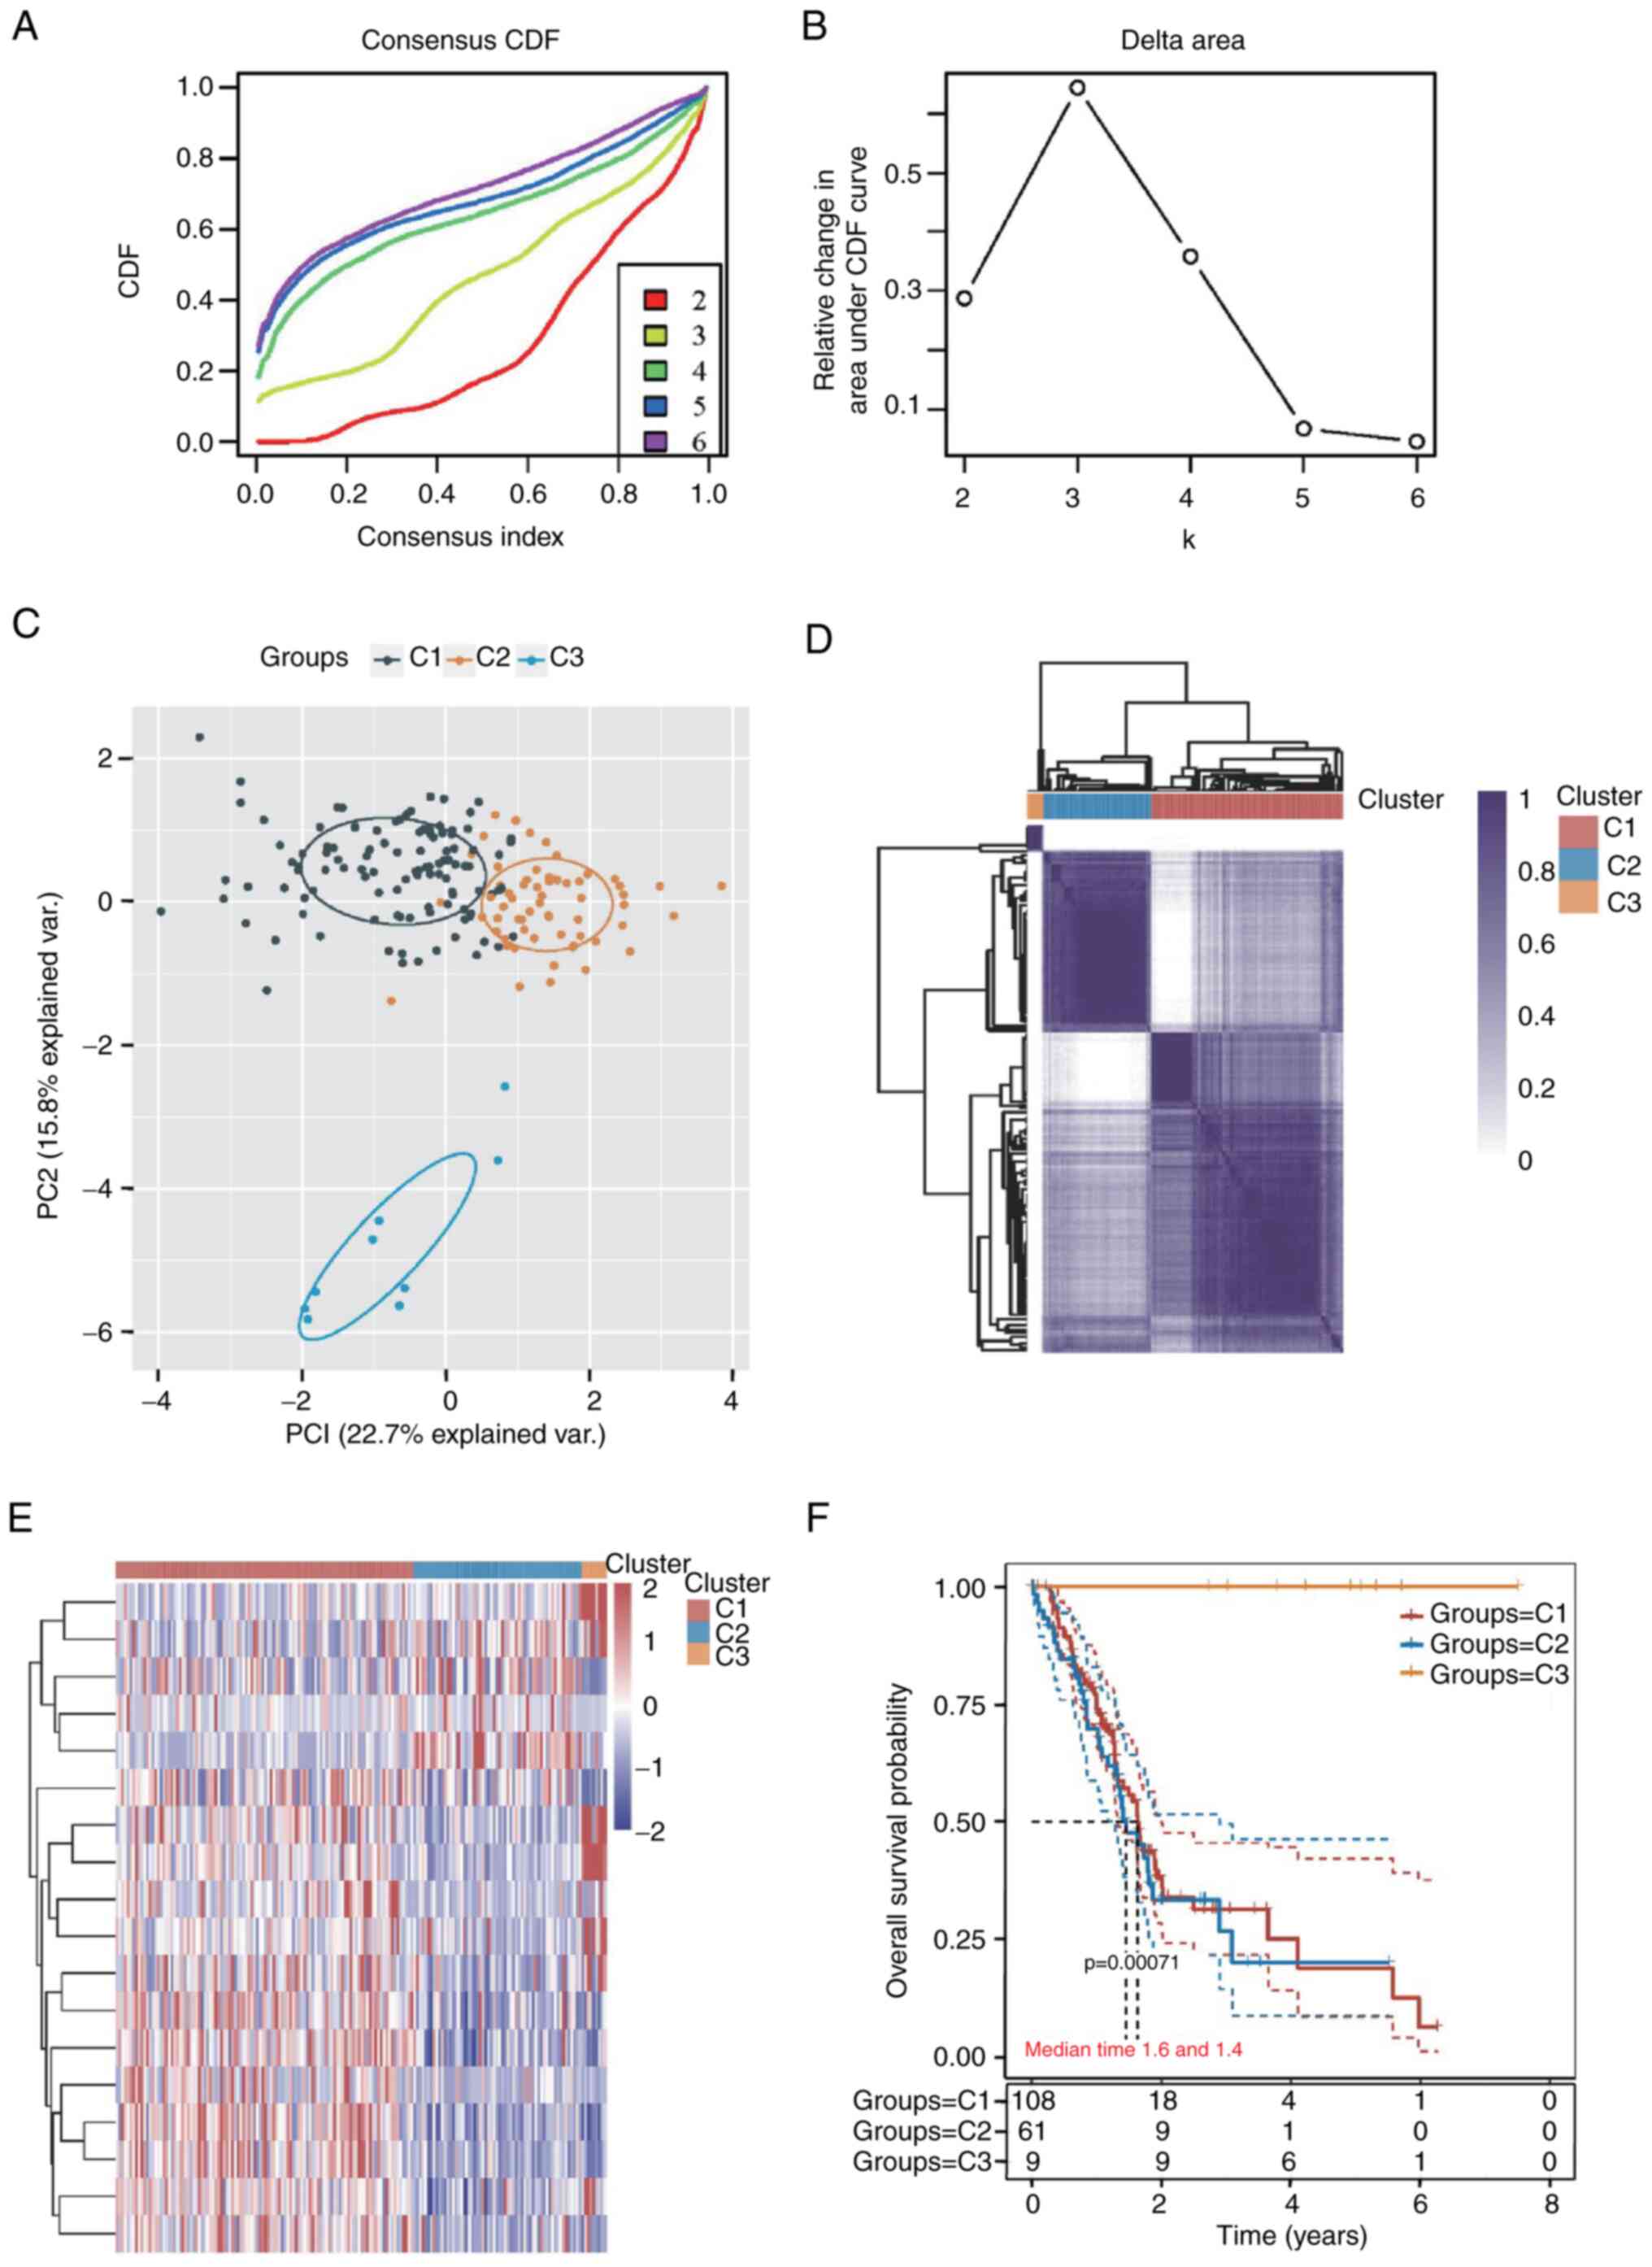
The Clusterplus package was used to perform
consensus unsupervised clustering of 178 samples from patients with
PAAD for FGF family genes, and the 178 PAAD samples are summarized
in Table SI. The maximum number
of clusters was 6 (Fig. 2A), and
the cumulative distribution function curve of the FGF family genes
indicated that k=3 appeared to be a suitable alternative for
clustering (Fig. 2B).
Additionally, the principal component analysis shown in Fig. 2C and consistency of the clustering
results heatmap shown in Fig. 2D
also indicated a relatively stable distribution of samples in the
three clusters. Patients with PAAD were therefore divided into C1,
C2 and C3 subtypes. A heatmap was drawn to show the gene expression
of FGFs in the three subtypes (Fig.
2E). There was a significant difference among the C1 (n=108),
C2 (n=61) and C3 (n=9) subtypes according to survival analysis
(P=0.00071). The prognosis of the C3 subtype was significantly
better than that of the C1 and C2 subtypes (Fig. 2F).
Construction and validation of the
6-gene signature
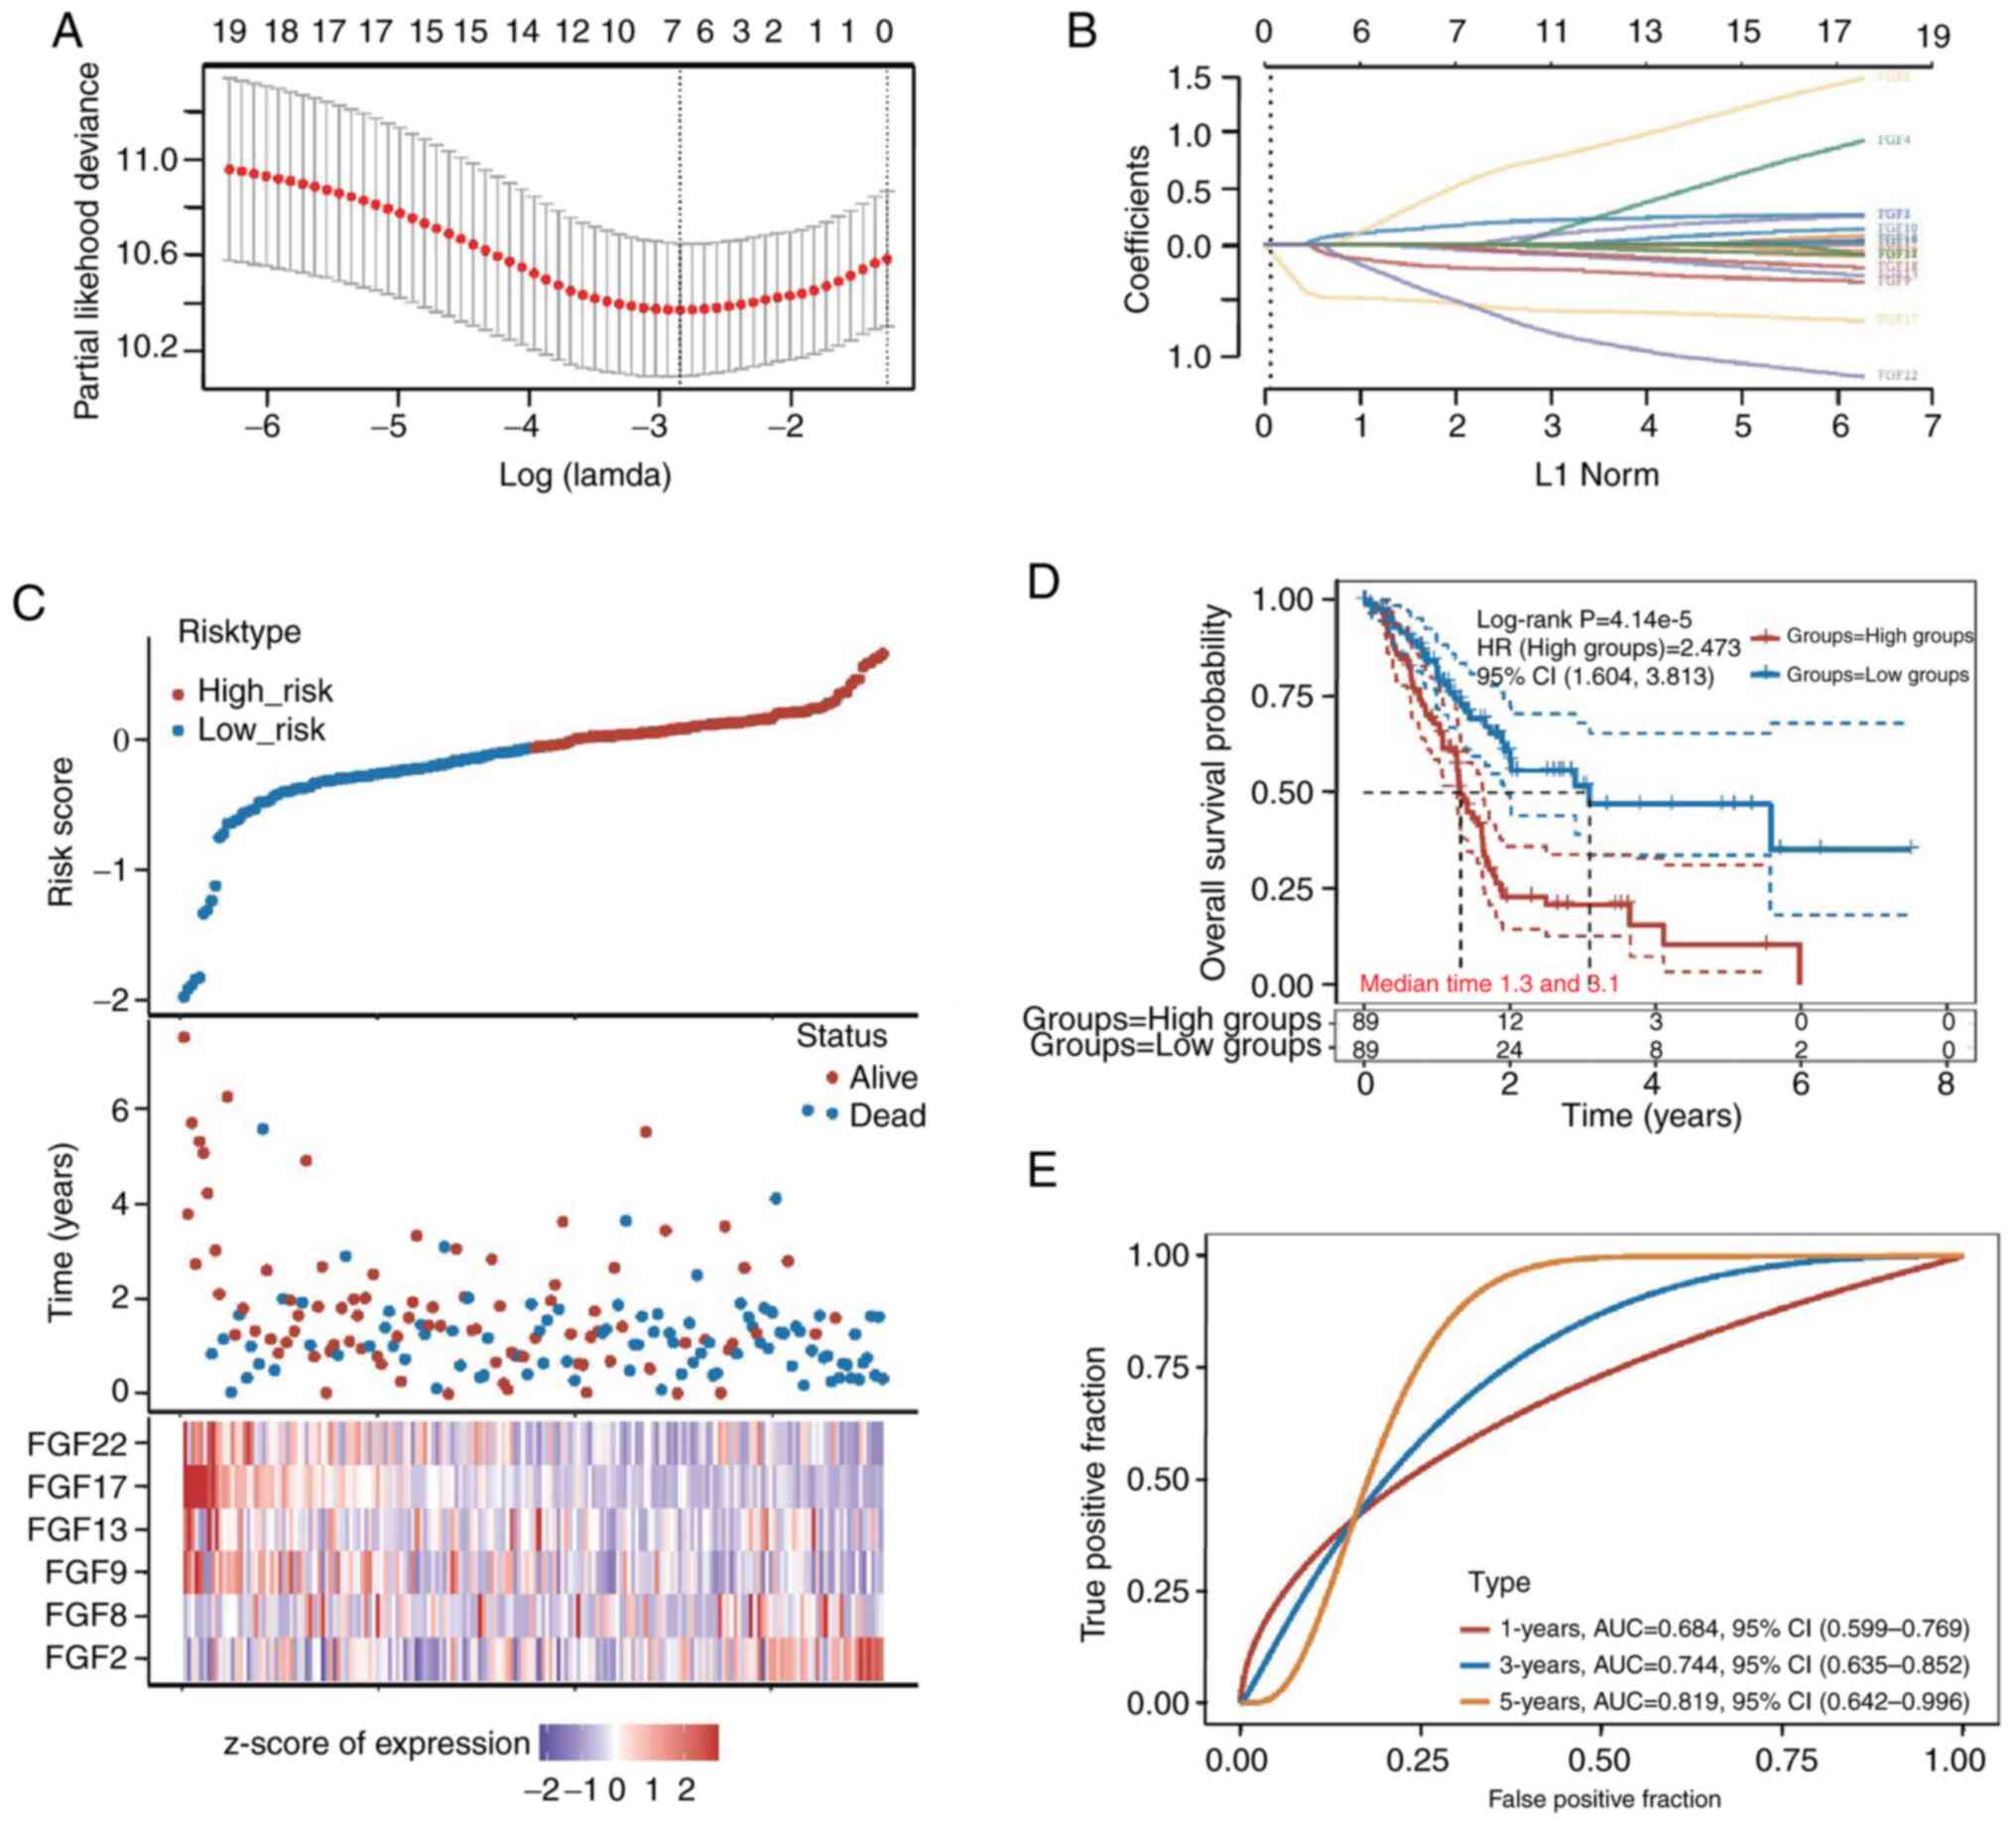
The LASSO regression method was utilized to identify
the most significant prognostic genes among FGF family genes. The
change trajectory of independent variables showed that the number
of independent variable coefficients tending toward zero gradually
increased with the gradual decrease in lambda. A risk model was
built using the 10-fold cross-validation method, and the CI under
each lambda was analyzed (Fig. 3A and
B). The risk model of the six genes was as follows: Risk score
= (0.1475)*FGF2 + (0.388)*FGF8 + (−0.1902)*FGF9 + (−0.0235)*FGF13 +
(−0.5041)*FGF17 + (−0.4054)*FGF22.
The risk score of each patient with PAAD was
computed, and the patients were assigned to the low-risk (n=89) or
high-risk (n=89) group based on the median cut-off value. The
distribution of the six genes across all samples revealed higher
FGF2 expression in the patients in the high-risk group. By
contrast, the patients in the low-risk group were likely to have
higher FGF17 expression (Fig. 3C).
The Kaplan-Meier analysis of all patients indicated that there was
a significant diference between the low-risk and high-risk groups.
The prognosis of the low-risk group was signifcantly better than
that of the high-risk group. The median survival time of the
high-risk group was 1.3 years and the median survival time of the
low-risk group was 3.1 years (P=4.14×10⁻⁵; Fig. 3D). The area under the curve of the
survival assessment model of the six genes was 0.684 at 1 year,
0.744 at 3 years and 0.819 at 5 years of OS (Fig. 3E).
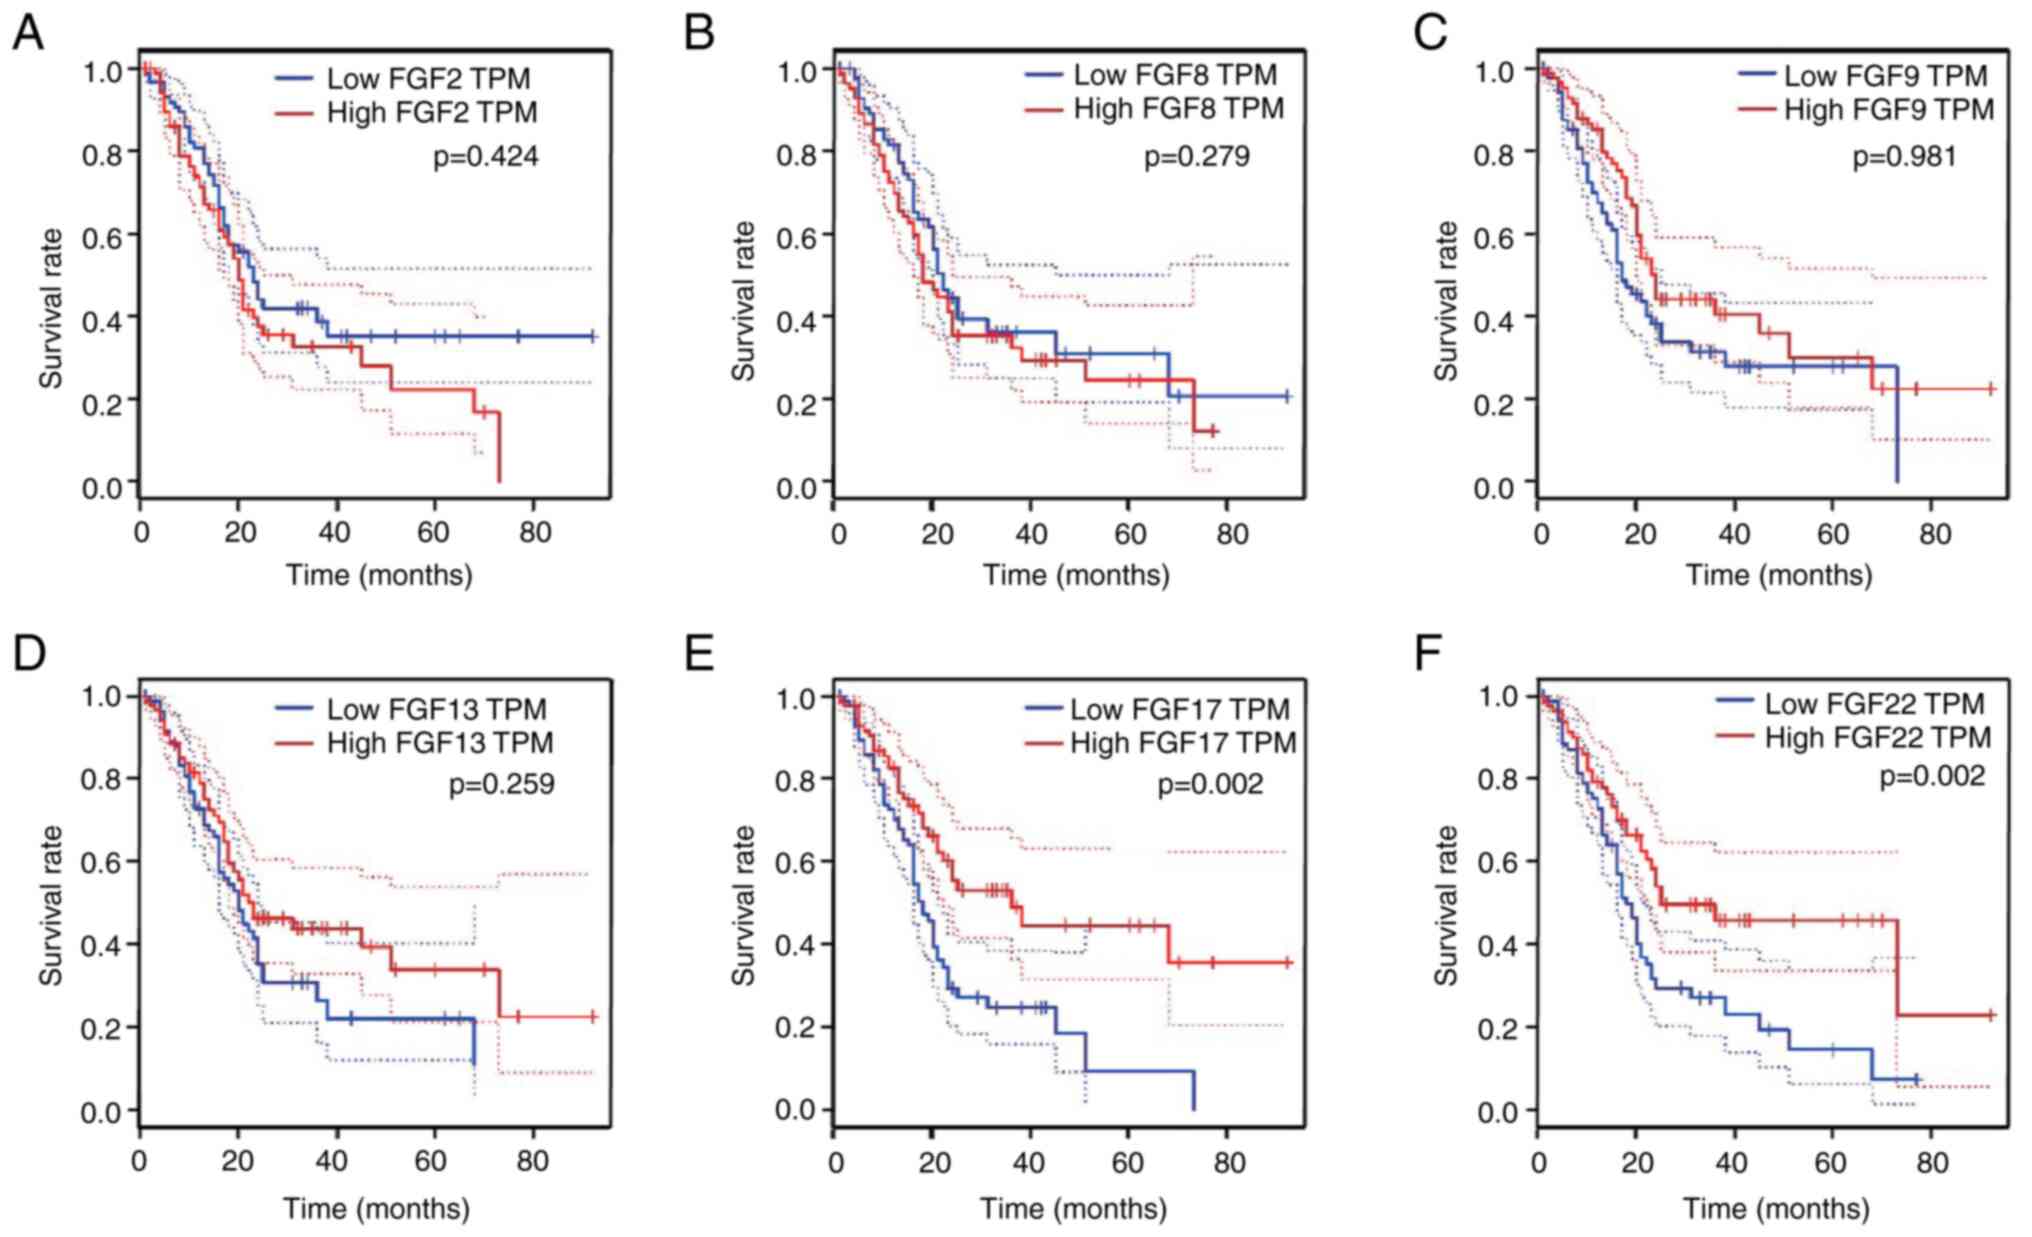
Expression and prognostic value of the
six FGF genes in PAAD
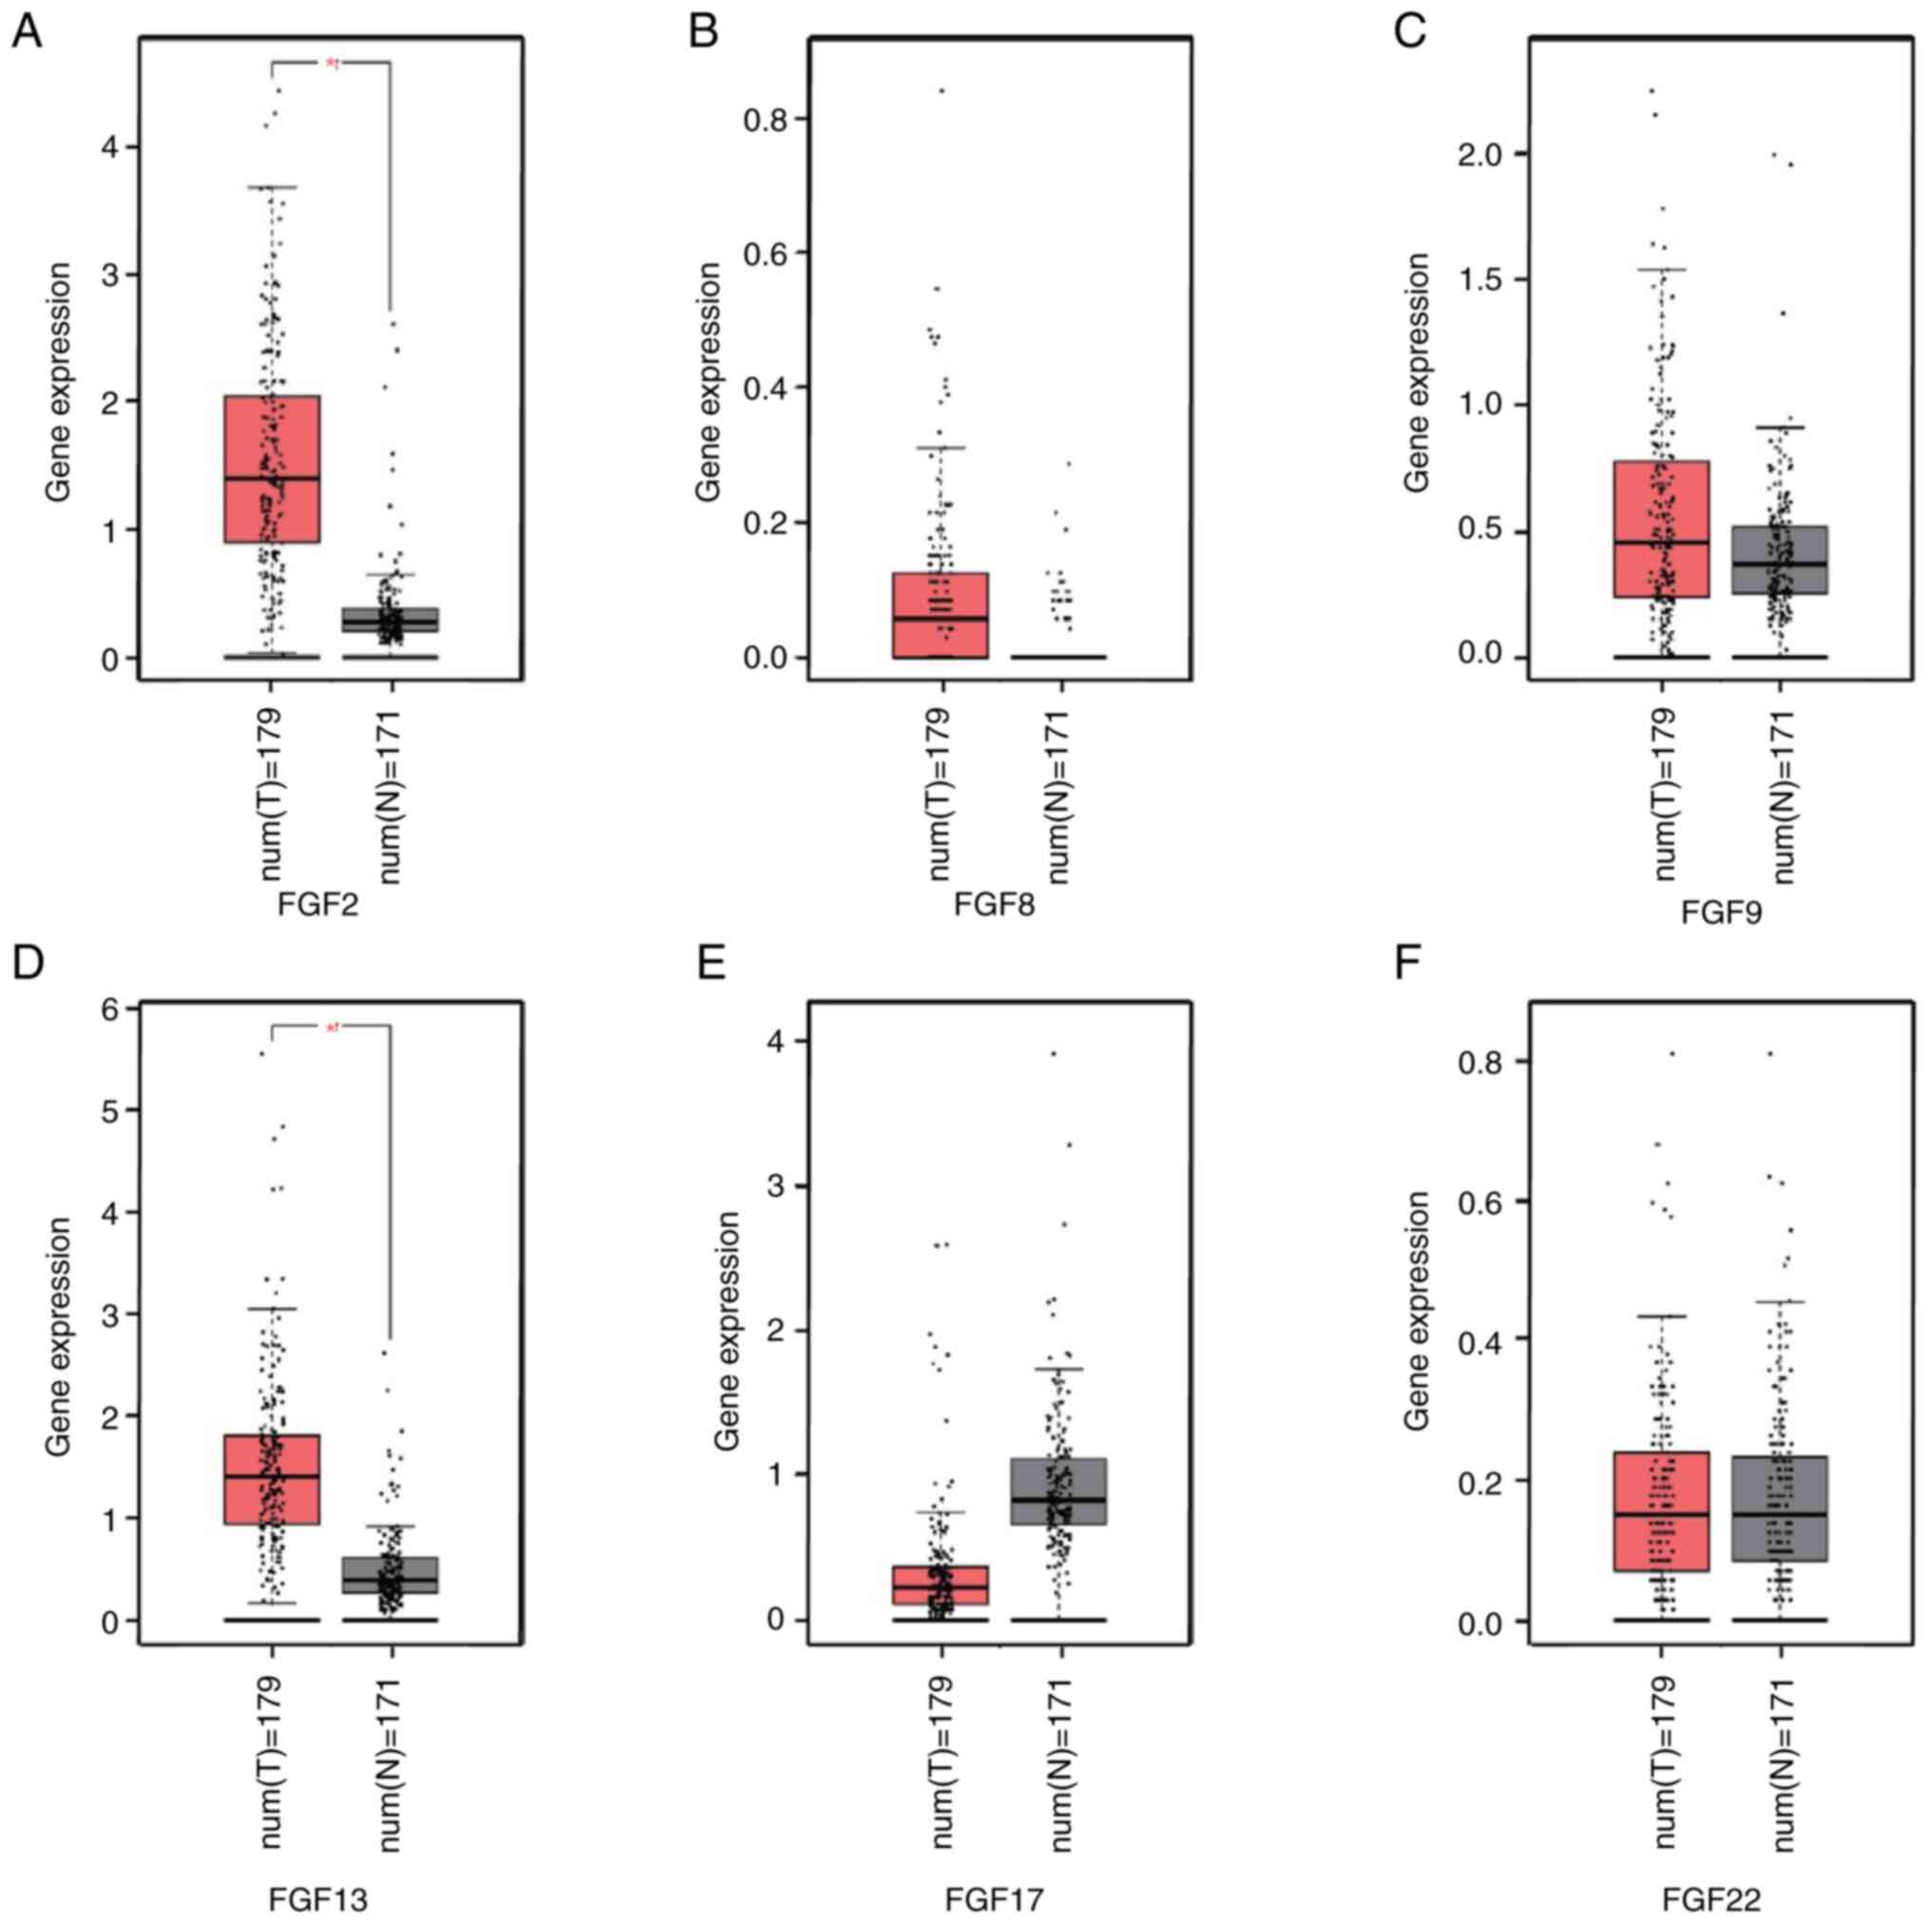
The mRNA expression levels of the six FGF genes were
compared between pancreatic cancer tissues and normal pancreatic
tissues using TCGA and GTEx data, and analyzed using GEPIA. The
results demonstrated that the expression levels of FGF2 and FGF13
were higher in pancreatic cancer than in normal tissues (Fig. 4A-F). To further investigate the
prognostic value of the six FGF genes in the survival of patients
with PAAD, associations between the mRNA levels of the six FGF
genes and clinical outcomes were analyzed using GEPIA. The
Kaplan-Meier curve and two-stage hazard rate comparison analyses
revealed that high transcriptional levels of FGF17 (P=0.002) and
FGF22 (P=0.002) were significantly associated with long OS
(Fig. 5A-F). These findings
suggest that FGF22 and FGF17 may function as tumor suppressors in
PAAD.
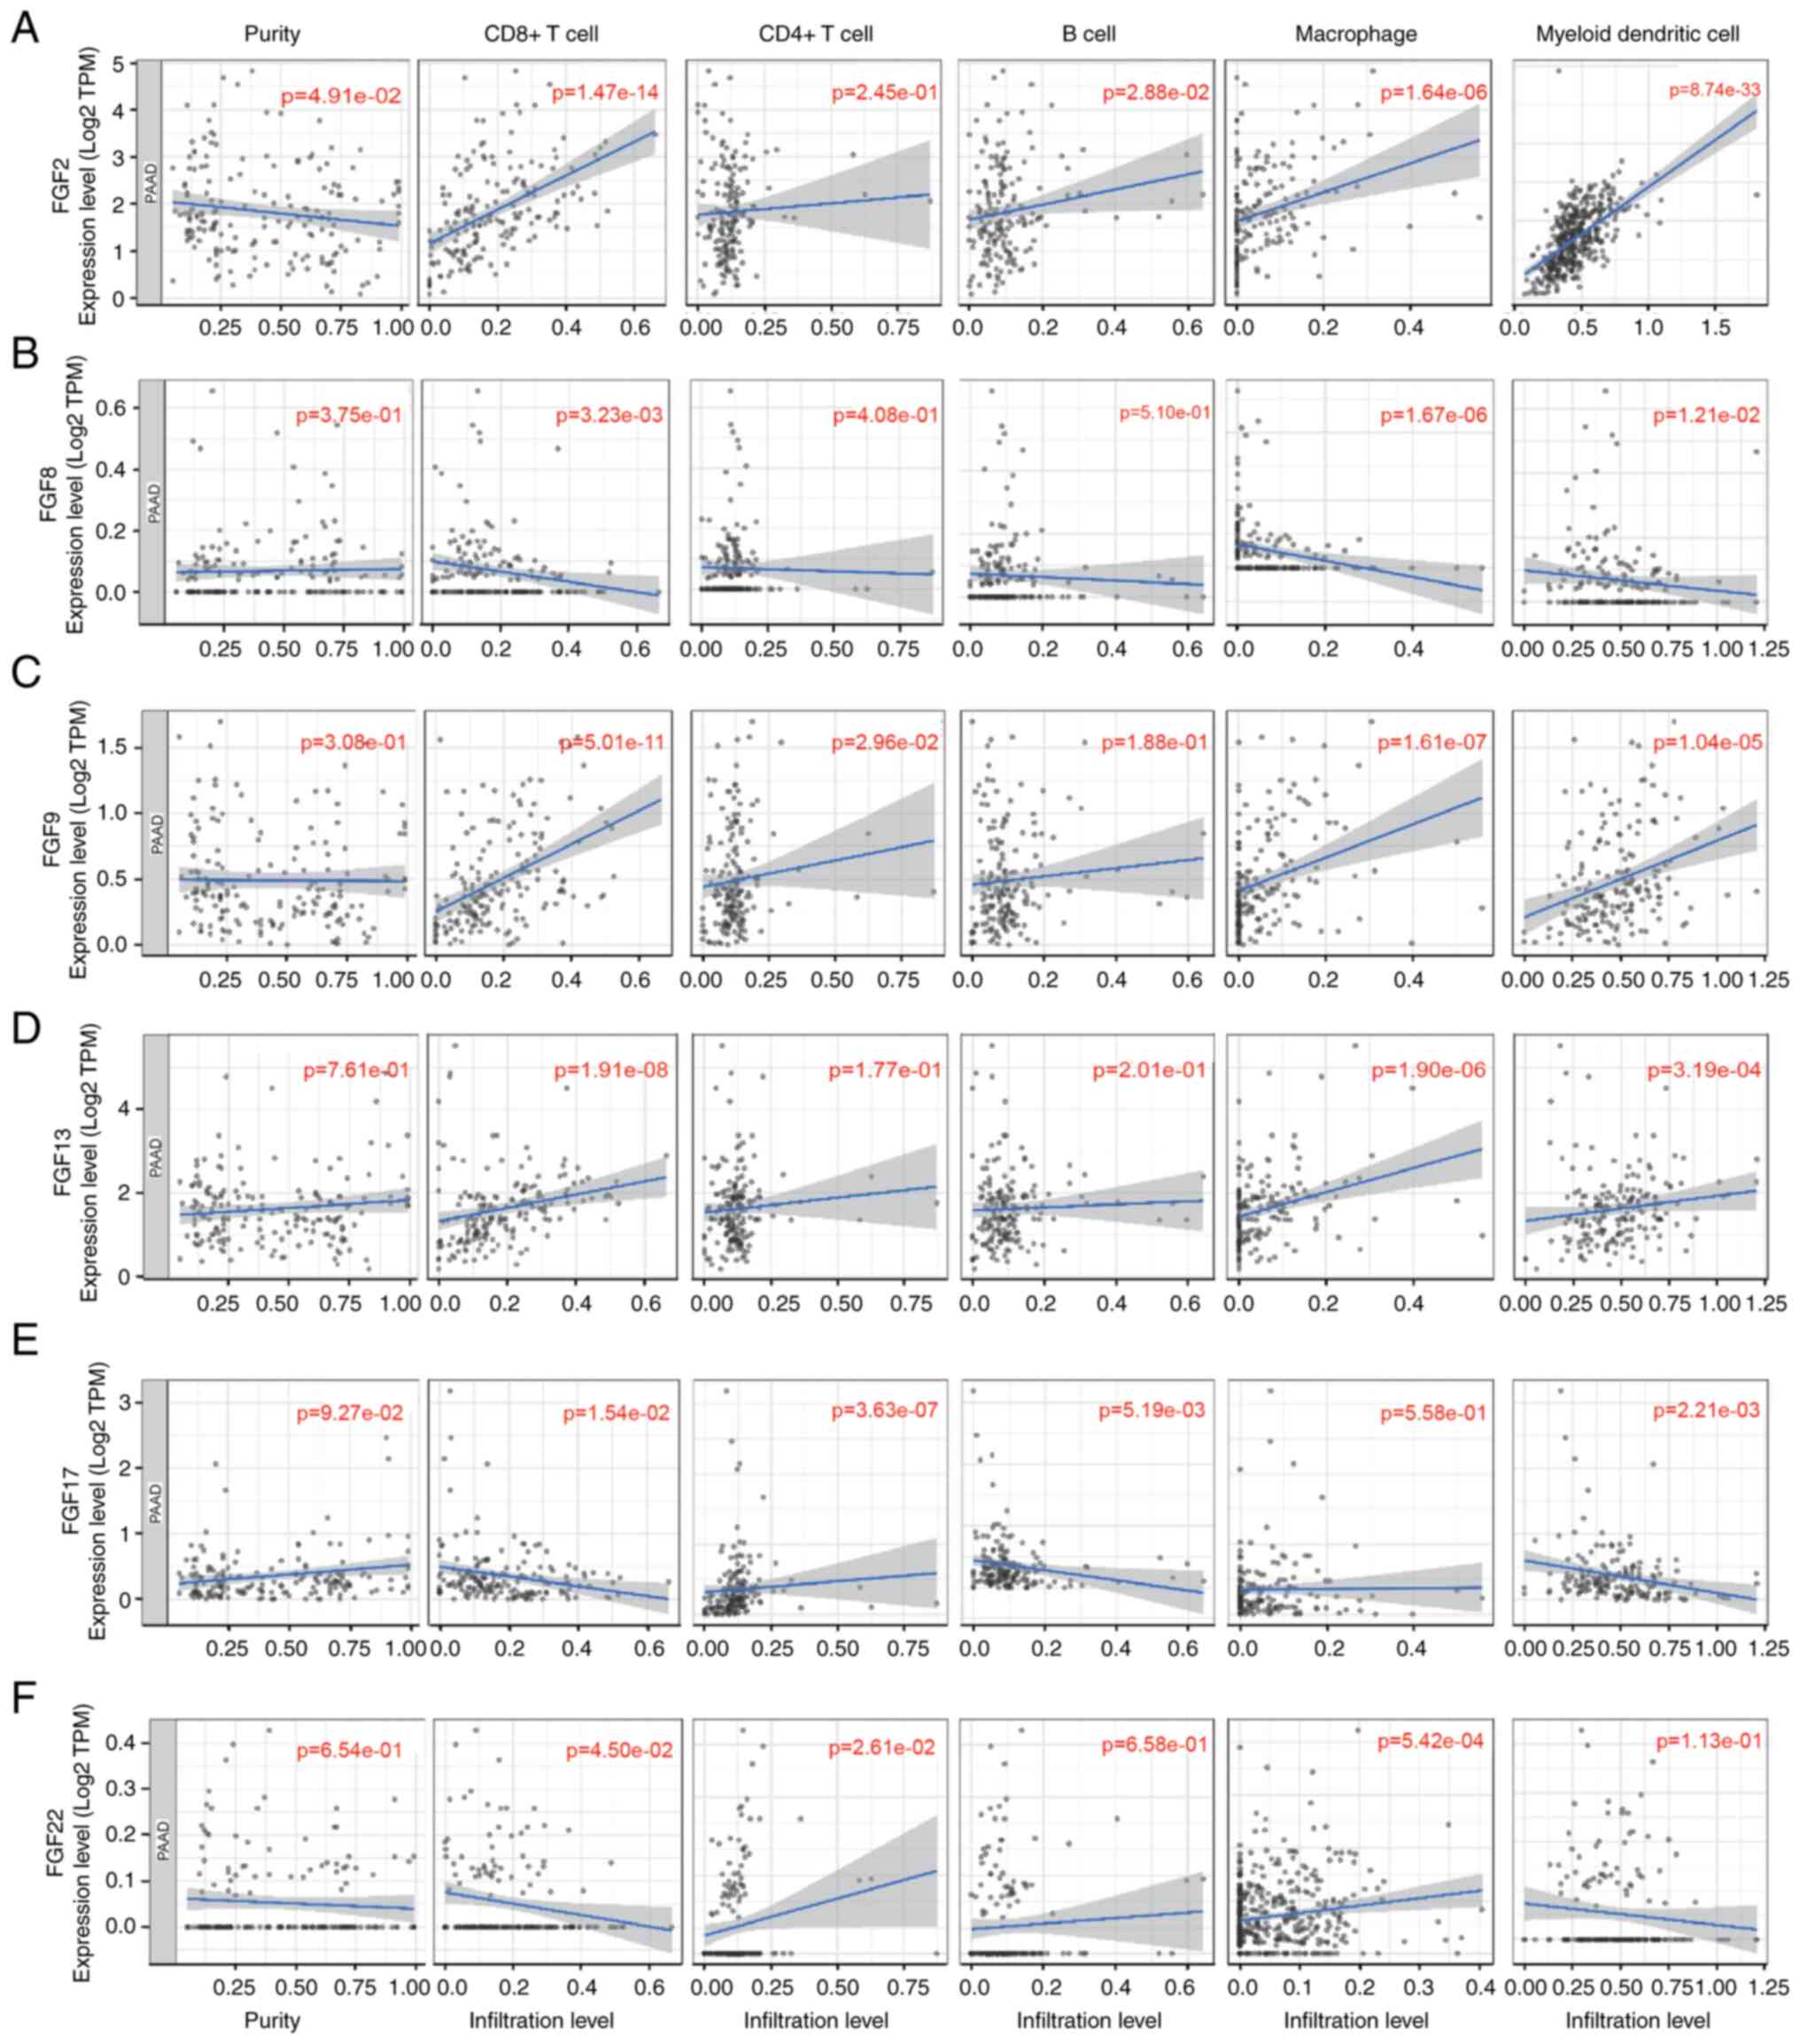
Associations of FGFs with
tumor-infiltrating immune cells in patients with PAAD
Considering the significant roles of immune cell
infiltration in the tumor microenvironment (TME), the present study
investigated the relationships between the 6 FGFs and immune cell
infiltration based on the TIMER database. FGF2 expression was
positively associated with infiltration of CD8+ T cells,
B cells, macrophages and myeloid dendritic cells in patients with
PAAD (Fig. 6A). FGF8 expression
was negatively correlated with the infiltration of CD8+
T cells, macrophages and myeloid dendritic cells (Fig. 6B). Additionally, there was a
positive correlation between FGF9 expression and infiltration of
CD8+ T cells, CD4+ T cells, macrophages and
myeloid dendritic cells (Fig. 6C).
FGF13 expression was positively associated with infiltration of
CD8+ T cells, macrophages and myeloid dendritic cells
(Fig. 6D). Regarding FGF17, there
was a negative correlation between infiltration of CD8+
T cells and myeloid dendritic cells and FGF17 expression, while
CD4+ T cells were positively associated with FGF17
(Fig. 6E). FGF22 expression was
shown to have a positive correlation with the infiltration of
CD4+ T cells and macrophages, but a negative correlation
with the infiltration of CD8+ T cells (Fig. 6F).
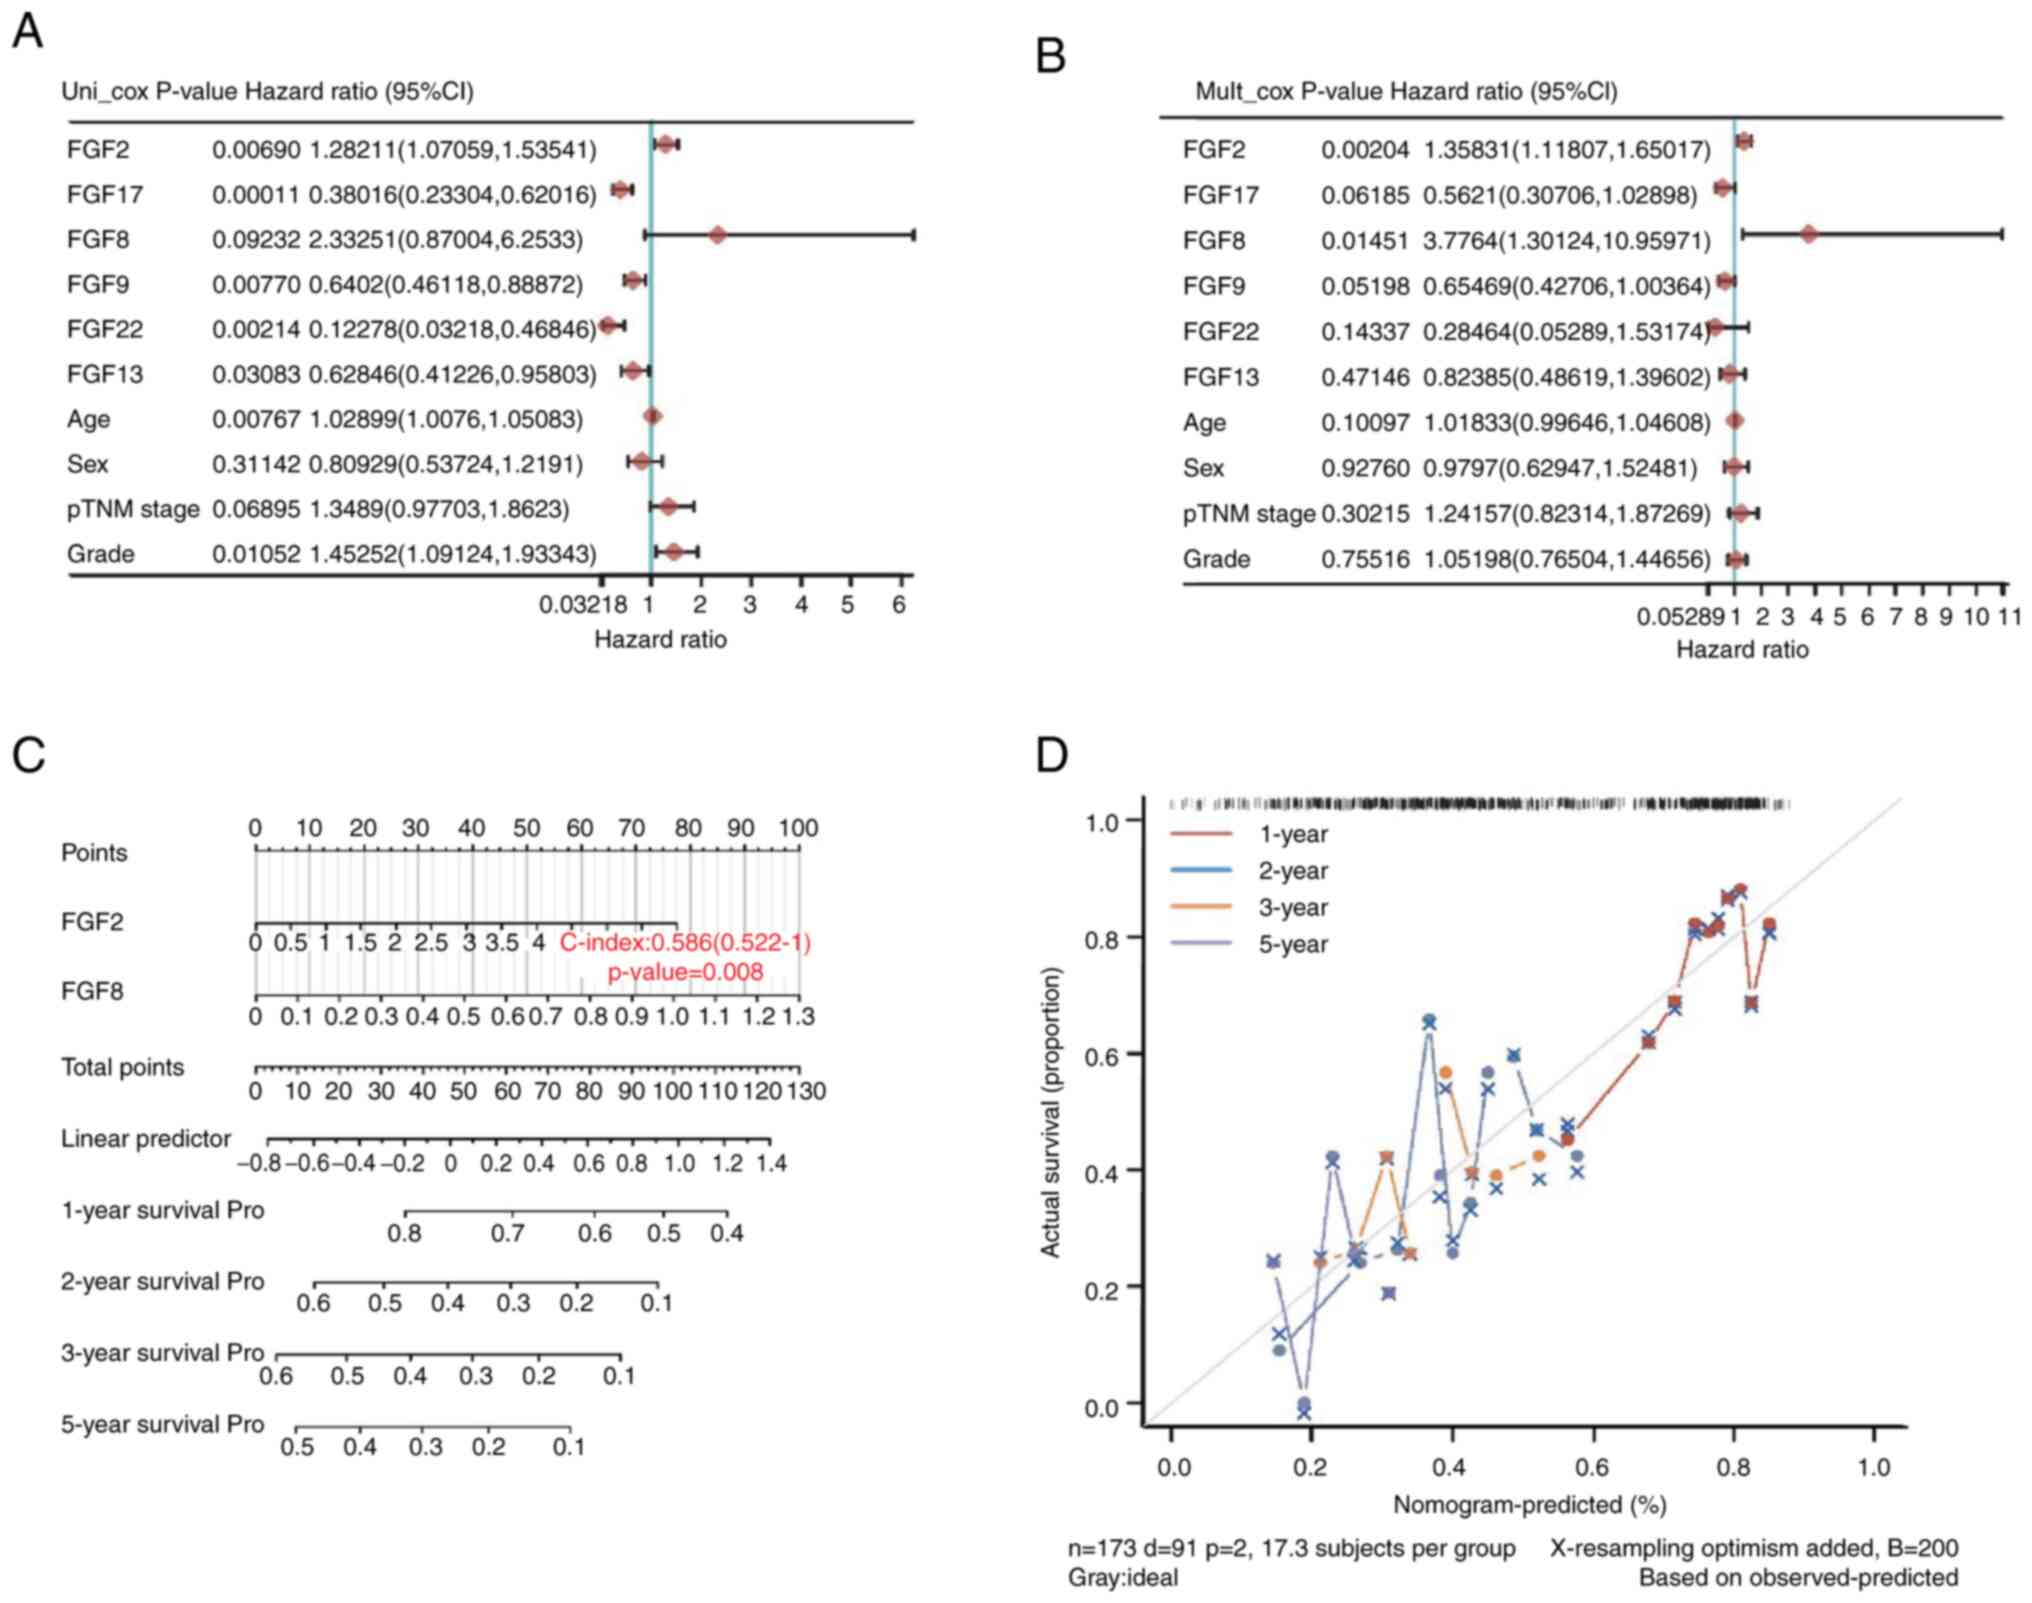
Construction and validation of a
two-gene signature in patients with PAAD
Subsequently, the present study explored the
prognostic role of FGF family genes in PAAD. Six genes, FGF2, FGF8,
FGF9, FGF13, FGF17 and FGF22, were identified by univariate Cox
regression analysis in TCGA-PAAD datasets. The results demonstrated
that FGF2, FGF17, FGF9, FGF22 and FGF13 were significantly
associated with the prognosis of PAAD. As shown in forest maps, of
all the factors, FGF2 (HR=1.28211; P=0.00690), FGF17 (HR=0.38016;
P=0.00011), FGF9 (HR=0.6402; P=0.00770), FGF22 (HR=0.12278;
P=0.00214) and FGF13 (HR=0.62846; P=0.03083) were significantly
associated with the survival of patients with PAAD (Fig. 7A). To reveal the independent
prognostic factors in patients with PAAD, the six genes and other
clinical variables were further analyzed using multivariate Cox
regression analyses. FGF2 (HR=1.35831; P=0.00204) and FGF8
(HR=3.7764; P=0.01451) were independent risk factors for the
prognosis of patients with PAAD (Fig.
7B).
A nomogram was constructed with FGF2 and FGF8. The
C-index of this model was 0.586 (P=0.008), suggesting that the risk
model based on FGF2 and FGF8 had good performance in predicting the
prognosis of PAAD (Fig. 7C).
According to the 1-, 2-, 3- and 5-year nomograms, the predicted
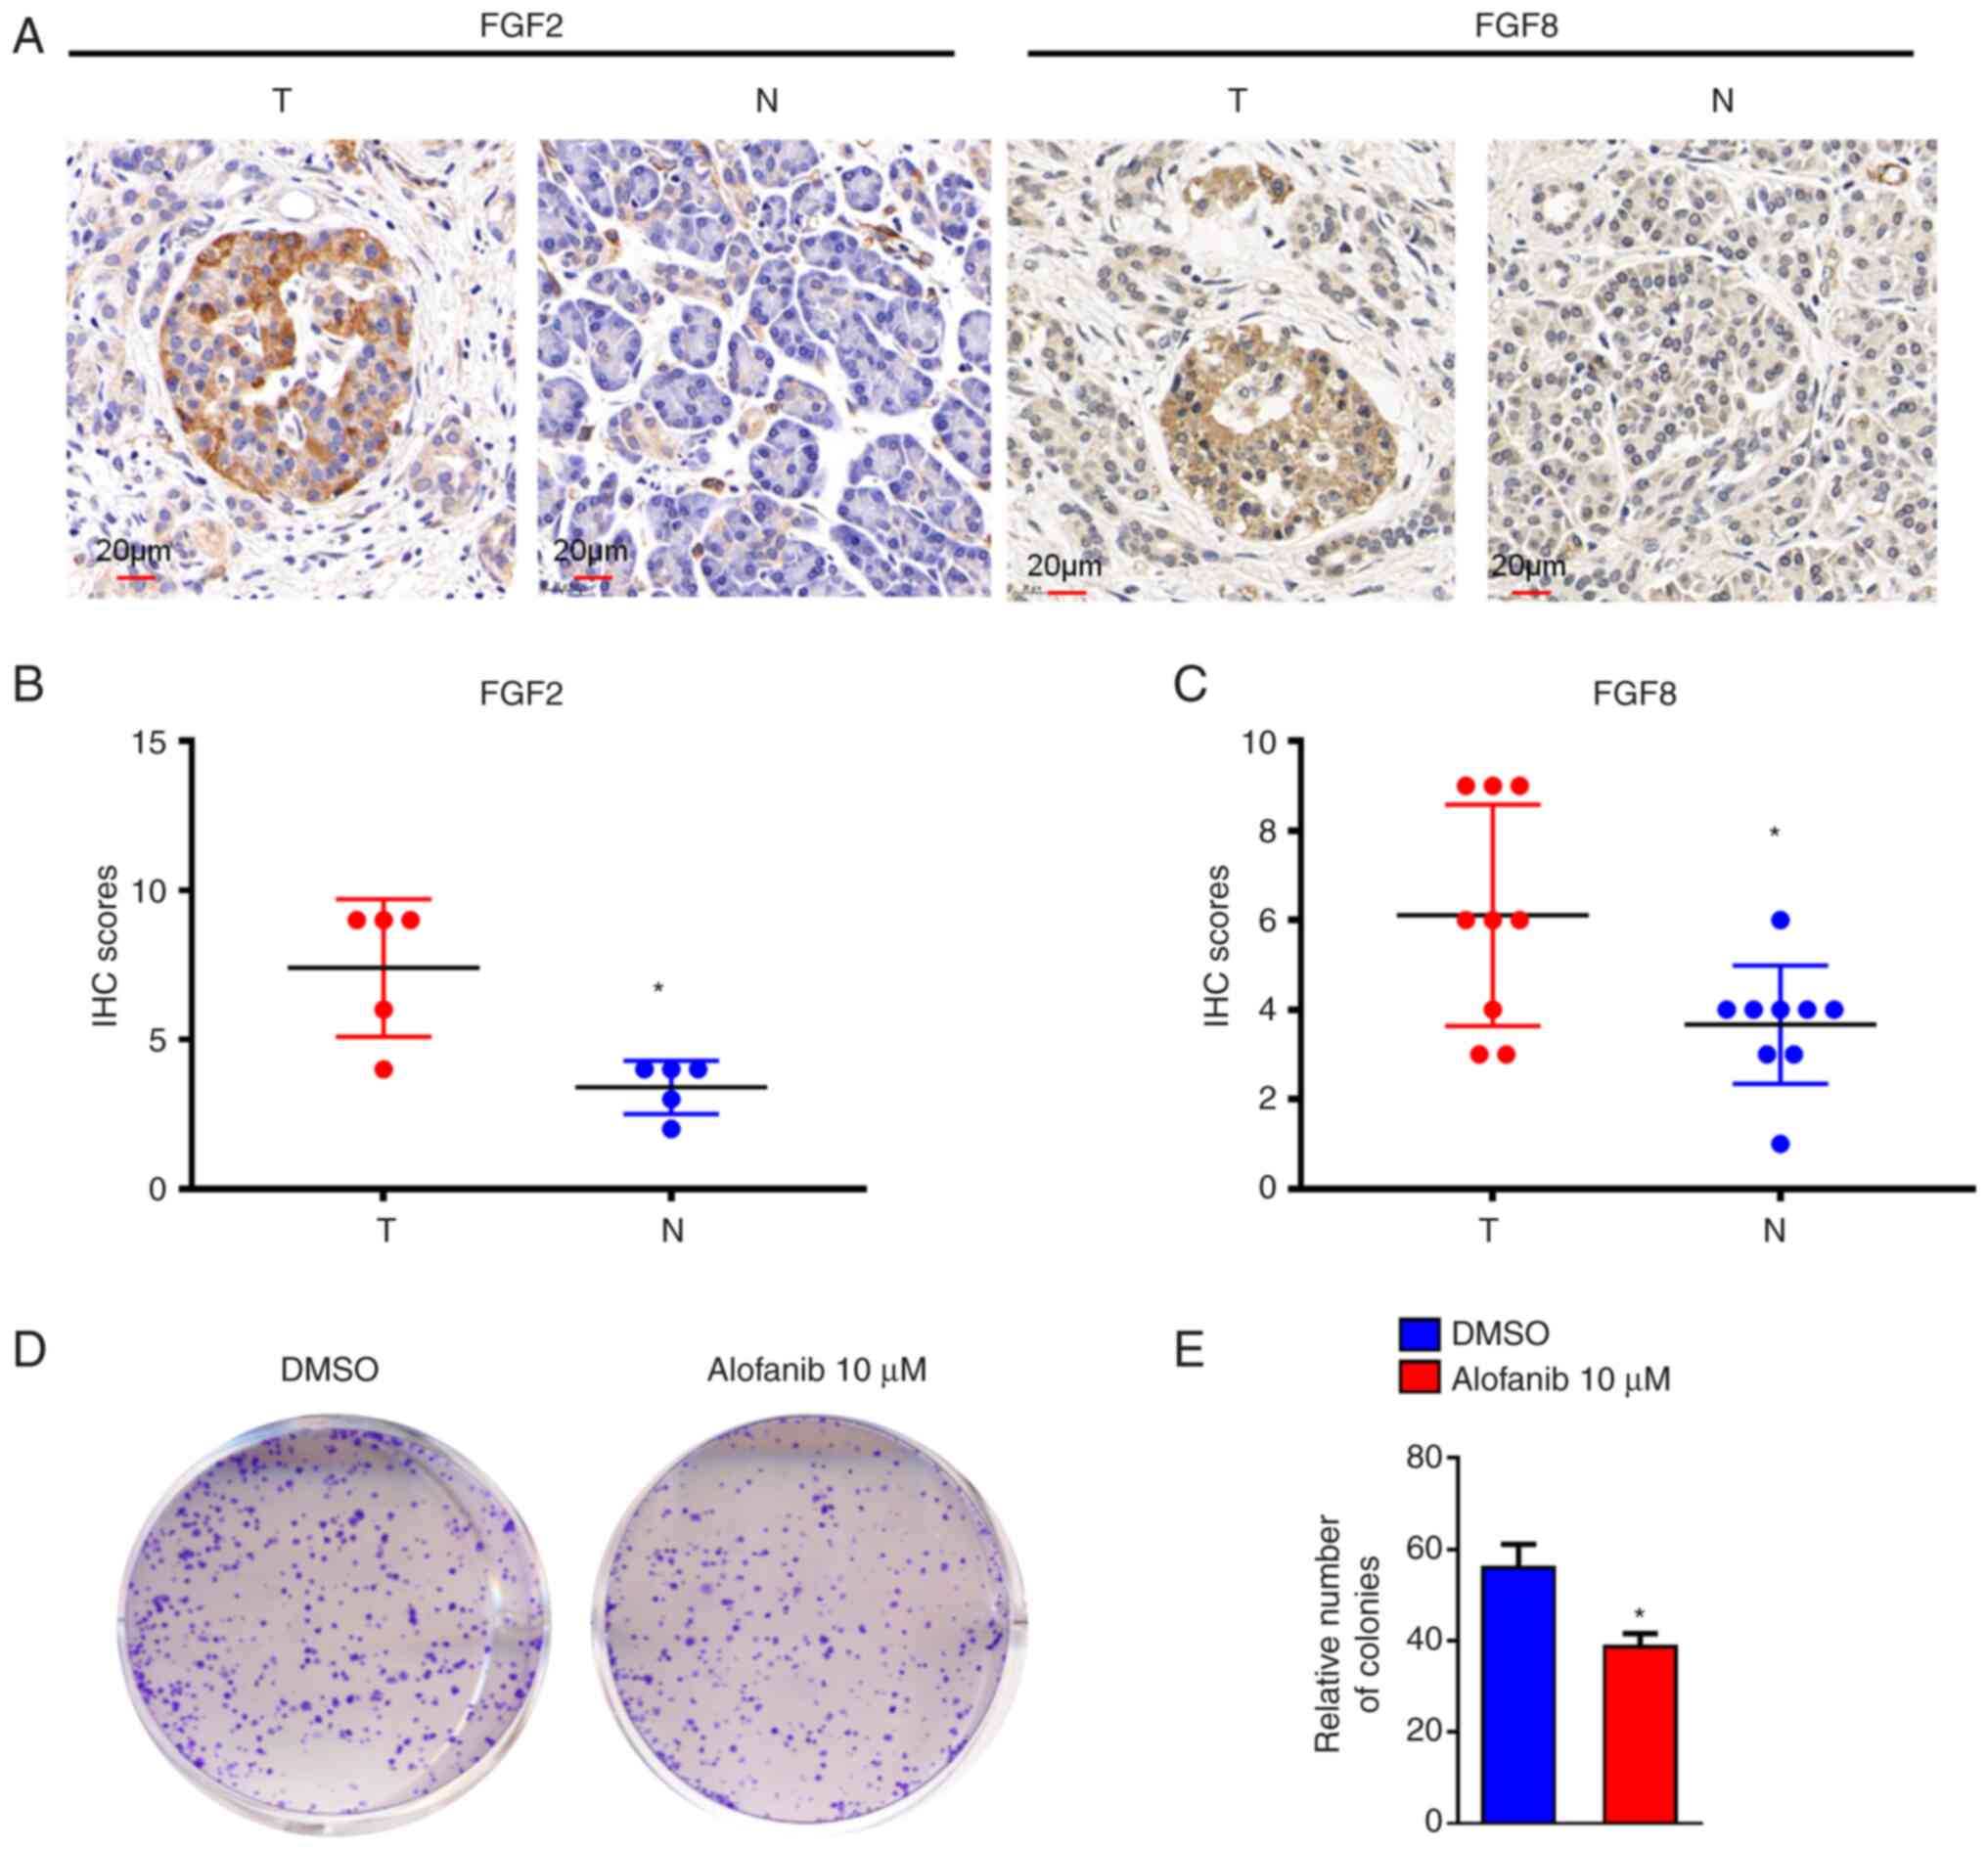
survival rate was close to the actual survival outcome (Fig. 7D). Furthermore, IHC was performed
to test FGF2 and FGF8 protein expression in PAAD cancer tissues and
paired adjacent tissues. FGF2 and FGF8 were more highly expressed
in PAAD cancer tissues than in paired adjacent tissues (Fig. 8A-C). These results indicated that
the two-gene signature constructed by FGF2 and FGF8 is helpful to
predict the development of PAAD.
FGFs are heparin-binding polypeptides, the majority
of which are secreted ligands that communicate via four
transmembrane FGF receptors (FGFRs) with great affinity. Alofanib
is an allosteric inhibitor of FGFR2 (26). To evaluate the impact of FGFRs on
PAAD, MIA Paca-2 cells were treated with 10 µM alofanib. The colony
formation of MIA Paca-2 cells was decreased following alofanib
treatment (P<0.05; Fig. 8D and
E).
Discussion
PAAD is a highly malignant tumor with a poor
prognosis and a 5-year survival rate of <5%, and its morbidity
has steadily increased worldwide over the past 3 decades (27). It has previously been reported that
pancreatic cancer is divided into several molecular subgroups, each
with its own set of biological characteristics, which contributes
to the lack of efficacy and drug resistance observed for current
treatments (28). Systematic
genomic analysis has revealed four key driver genes in pancreatic
cancer: KRAS, cyclin dependent kinase inhibitor 2A, TP53 and SMAD4
(29,30). At present, there is no effective
clinical treatment for PAAD that targets these genes. Significant
clinical improvements in diagnostic investigations, surgical
procedures and systemic medicines should enhance pancreatic cancer
outcomes. An improved understanding of pancreatic cancer biology
and genetics, including novel information on driver gene
alterations, tumor metabolism and the TME, might contribute to
attractive and creative effective treatments (31). Immunotherapy has become
increasingly utilized in the treatment of PAAD (32). Despite the overwhelming success of
immune checkpoint inhibitors in leukemia and melanoma, PAAD is an
outlier due to its immunosuppressive TME and poor tumor
immunogenicity (33).
The TME is becoming an increasingly important
research area and may affect tumor progression and recurrence
(34,35). Immune cells in the TME are
reportedly involved in inhibiting or promoting tumor activity and
are critical factors in determining clinical outcomes and
immunotherapy efficacy (36). PAAD
is characterized by extensive desmoplasia in the TME (37). The interaction between PAAD cells
and the TME is the most important driving force of desmoplasia.
Increasing evidence indicates that the TME actively contributes to
tumor growth and metastasis (38).
Therefore, FGFs, which serve as parts of the TME, may be involved
in the occurrence and development of PAAD. Although FGFs serve key
roles in head and neck squamous cell carcinomas (39) and hepatocellular carcinoma
(40,41), the distinct roles of FGFs in PAAD
remain to be elucidated. We hypothesized that FGFs also serve a
critical role in predicting the prognosis of patients with PAAD. A
composed model constructed with various relevant genes is a better
choice to predict prognosis compared with a single gene (42). Therefore, in the present study, the
FGF gene family in PAAD was analyzed systematically regarding
expression, prognostic value and immune cell infiltration.
According to the bioinformatics analysis, a
prognostic signature based on 6 FGFs (FGF2, FGF8, FGF9, FGF13,
FGF17 and FGF22) was constructed, which performed appropriately in
prognostic predictions in patients with PAAD. Patients in the
high-risk group had shorter survival times than those in the
low-risk group. Furthermore, the TCGA-PAAD cohort was used to
analyze the six genes by univariate and multivariate Cox regression
analyses. The results demonstrated that FGF2 and FGF8 were
significantly associated with survival and were independent risk
factors for the prognosis of patients with PAAD. The IHC results
demonstrated that the expression of the two genes was elevated in
PAAD cancer tissues compared with in normal tissues. These results
indicated that FGF2 and FGF8 function as oncogenes and might serve
an important role in the tumorigenesis and progression of PAAD.
FGF2 is reportedly involved in the occurrence and development of
various cancer types, such as NSCLC (43) and osteosarcoma (44). Furthermore, FGF2 has been reported
to serve an important role in the treatment of oncolytic viruses in
PAAD (45). FGF8 also deserves
attention in numerous types of malignancies (46,47).
FGF8 is upregulated in patients with oral squamous cell carcinoma,
and high FGF8 expression is related to a set of clinicopathologic
parameters, including age, drinking and survival time (48). The aforementioned conclusions
demonstrated that FGF2 and FGF8 have potential as cell markers for
tumors. In the present study, high FGF2 and FGF8 mRNA expression
was significantly associated with short OS time in patients with
PAAD. These results illustrate that FGF2 and FGF8 serve oncogenic
roles in PAAD. Furthermore, a nomogram was constructed based on
FGF2 and FGF8. The calibration map showed that the present model
had a good ability to predict the prognosis of patients with
PAAD.
Supplementary Material
Supporting Data
Acknowledgements
Not applicable.
Funding
The present study was supported by the West China Second
University Hospital Clinical Research Fund (grant no. KL105), the
Sichuan Provincial Key Research and Development Projects (grant no.
2022YFS0242), the West China Second University Hospital Clinical
Discipline Development Fund (grant no. KL066) and Cadres Healthcare
Research Projects in Sichuan Province (grant no. 2021-1703).
Availability of data and materials
The datasets analyzed during the current study are
available in the Cancer Genome Atlas (TCGA, http://can-cerge nome.nih.gov/), Assistant for
Clinical Bioinformatics (https://www.aclbi.com/static/index.html#/) and TIMER
(http://timer.cistrome.org/) databases.
All other datasets used and/or analyzed during the current study
are available from the corresponding author on reasonable
request.
Authors' contributions
YXC wrote the manuscript. JM, XJL and YMJ designed
and supervised the implementation of the entire study. LY and JJH
analyzed the data and completed the immunohistochemistry
experiment. YXC analyzed the data and completed the cell colony
formation assay. XJL and YMJ provided professional opinions on the
research and revised the manuscript. YXC and JM confirm the
authenticity of all the raw data. All authors read and approved the
final manuscript.
Ethics approval and consent to
participate
All experiments involving human samples were
approved by the West China Second University Hospital Institutional
Review Board (Chengdu, China).
Patient consent for publication
Not applicable.
Competing interests
The authors declare that they have no competing
interests.
References
|
1
|
Sung H, Ferlay J, Siegel RL, Laversanne M,
Soerjomataram I, Jemal A and Bray F: Global cancer statistics 2020:
GLOBOCAN estimates of incidence and mortality worldwide for 36
cancers in 185 countries. CA Cancer J Clin. 71:209–249. 2021.
View Article : Google Scholar : PubMed/NCBI
|
|
2
|
Siegel RL, Miller KD and Jemal A: Cancer
statistics, 2019. CA Cancer J Clin. 69:7–34. 2019. View Article : Google Scholar : PubMed/NCBI
|
|
3
|
Fukushima G, Abe K, Kitago M, Iwasaki E,
Hirata A, Takemura R, Ishii R, Yagi H, Abe Y, Hasegawa Y, et al:
Association between clinical backgrounds and malignant progression
of suspected intraductal papillary mucinous neoplasm. Pancreas.
51:617–623. 2022. View Article : Google Scholar : PubMed/NCBI
|
|
4
|
Brugel M, Carlier C, Reyes-Castellanos G,
Callon S, Carrier A and Bouche O: Pesticides and pancreatic
adenocarcinoma: A transversal epidemiological, environmental and
mechanistic narrative review. Dig Liver Dis. 8:S1590–S8658.
2022.
|
|
5
|
Okita Y, Sobue T, Zha L, Kitamura T,
Iwasaki M, Inoue M, Yamaji T, Tsugane S and Sawada N: Association
between alcohol consumption and risk of pancreatic cancer: The
japan public health center-based prospective study. Cancer
Epidemiol Biomark Prev. 3:EPI22–0216. 2022.
|
|
6
|
Irisawa A, Takeno M, Watanabe K, Takahashi
H, Mitsunaga S and Ikeda M: Incidence of and risk factors for
severe neutropenia during treatment with the modified FOLFIRINOX
therapy in patients with advanced pancreatic cancer. Sci Rep.
12:155742022. View Article : Google Scholar : PubMed/NCBI
|
|
7
|
Molinelli S, Vai A, Russo S, Loap P,
Meschini G, Paganelli C, Barcellini A, Vitolo V, Orlandi E and
Ciocca M: The role of multiple anatomical scenarios in plan
optimization for carbon ion radiotherapy of pancreatic cancer.
Radiother Oncol. 176:1–8. 2022. View Article : Google Scholar : PubMed/NCBI
|
|
8
|
Alshememry AK, Alsaleh NB, Alkhudair N,
Alzhrani R and Alshamsan A: Recent nanotechnology advancements to
treat multidrug-resistance pancreatic cancer: Pre-clinical and
clinical overview. Front Pharmacol. 13:9334572022. View Article : Google Scholar : PubMed/NCBI
|
|
9
|
Gautam SK, Basu S, Aithal A, Dwivedi NV,
Gulati M and Jain M: Regulation of pancreatic cancer therapy
resistance by chemokines. Semin Cancer Biol. 86:69–80. 2022.
View Article : Google Scholar : PubMed/NCBI
|
|
10
|
Kang X, Lin Z, Xu M, Pan J and Wang ZW:
Deciphering role of FGFR signalling pathway in pancreatic cancer.
Cell Prolif. 52:e126052019. View Article : Google Scholar : PubMed/NCBI
|
|
11
|
Thomas D and Radhakrishnan P:
Tumor-stromal crosstalk in pancreatic cancer and tissue fibrosis.
Mol Cancer. 18:142019. View Article : Google Scholar : PubMed/NCBI
|
|
12
|
Zhang Z, Qin Y, Ji S, Xu W, Liu M, Hu Q,
Ye Z, Fan G, Yu X, Liu W and Xu X: FGFBP1-mediated crosstalk
between fibroblasts and pancreatic cancer cells via FGF22/FGFR2
promotes invasion and metastasis of pancreatic cancer. Acta Biochim
Biophys Sin(Shanghai). 53:997–1008. 2021.PubMed/NCBI
|
|
13
|
El-Hariry I, Pignatelli M and Lemoine NR:
FGF-1 and FGF-2 regulate the expression of E-cadherin and catenins
in pancreatic adenocarcinoma. Int J Cancer. 94:652–661. 2001.
View Article : Google Scholar : PubMed/NCBI
|
|
14
|
Pecqueux C, Arslan A, Heller M,
Falkenstein M, Kaczorowski A, Tolstov Y, Sültmann H, Grüllich C,
Herpel E, Duensing A, et al: FGF-2 is a driving force for
chromosomal instability and a stromal factor associated with
adverse clinico-pathological features in prostate cancer. Urol
Oncol. 36:365–e315. 365–e326. 2018. View Article : Google Scholar : PubMed/NCBI
|
|
15
|
Sun C, Tian X, Jia Y, Yang M, Li Y and
Fernig DG: Functions of exogenous FGF signals in regulation of
fibroblast to myofibroblast differentiation and extracellular
matrix protein expression. Open Biol. 12:2103562022. View Article : Google Scholar : PubMed/NCBI
|
|
16
|
Belov AA and Mohammadi M: Molecular
mechanisms of fibroblast growth factor signaling in physiology and
pathology. Cold Spring Harb Perspect Biol. 5:a0159582013.
View Article : Google Scholar : PubMed/NCBI
|
|
17
|
Bock FJ, Sedov E, Koren E, Koessinger AL,
Cloix C, Zerbst D, Athineos D, Anand J, Campbell KJ, Blyth K, et
al: Apoptotic stress-induced FGF signalling promotes non-cell
autonomous resistance to cell death. Nat Commun. 12:65722021.
View Article : Google Scholar : PubMed/NCBI
|
|
18
|
Guo K, Ma Z, Zhang Y, Han L, Shao C, Feng
Y, Gao F, Di S, Zhang Z, Zhang J, et al: HDAC7 promotes NSCLC
proliferation and metastasis via stabilization by deubiquitinase
USP10 and activation of beta-catenin-FGF18 pathway. J Exp Clin
Cancer Res. 41:912022. View Article : Google Scholar : PubMed/NCBI
|
|
19
|
Xu Z, Cai Y, Liu W, Kang F, He Q, Hong Q,
Zhang W, Li J, Yan Y and Peng J: Downregulated exosome-associated
gene FGF9 as a novel diagnostic and prognostic target for ovarian
cancer and its underlying roles in immune regulation. Aging (Albany
NY). 14:1822–1835. 2022. View Article : Google Scholar : PubMed/NCBI
|
|
20
|
Carter EP, Coetzee AS, Bort ET, Wang Q,
Kocher HM and Grose RP: Dissecting FGF signalling to target
cellular crosstalk in pancreatic cancer. Cells. 10:8472021.
View Article : Google Scholar : PubMed/NCBI
|
|
21
|
Peng J, Sridhar S, Siefker-Radtke AO,
Selvarajah S and Jiang DM: Targeting the FGFR pathway in urothelial
carcinoma: The future is now. Curr Treat Options Oncol.
23:1269–1287. 2022. View Article : Google Scholar : PubMed/NCBI
|
|
22
|
Ohtsu A, Arai S, Sawada T, Kato M, Maeno
Y, Miyazawa Y, Fujizuka Y, Sekine Y, Koike H, Matsui H and Suzuki
K: Fibroblast growth factor receptor inhibitor erdafitinib promotes
Mcl-1 degradation and synergistically induces apoptosis with
Bcl-xL/Bcl-2 inhibitor in urothelial cancer cells. Biochem Biophys
Res Commun. 628:76–83. 2022. View Article : Google Scholar : PubMed/NCBI
|
|
23
|
Wu Y, Yi Z, Li J, Wei Y, Feng R, Liu J,
Huang J, Chen Y, Wang X, Sun J, et al: FGFR blockade boosts T cell
infiltration into triple-negative breast cancer by regulating
cancer-associated fibroblasts. Theranostics. 12:4564–4580. 2022.
View Article : Google Scholar : PubMed/NCBI
|
|
24
|
Karajannis MA, Vincent L, Direnzo R,
Shmelkov SV, Zhang F, Feldman EJ, Bohlen P, Zhu Z, Sun H, Kussie P
and Rafii S: Activation of FGFR1beta signaling pathway promotes
survival, migration and resistance to chemotherapy in acute myeloid
leukemia cells. Leukemia. 20:979–986. 2006. View Article : Google Scholar : PubMed/NCBI
|
|
25
|
Xie Y, Su N, Yang J, Tan Q, Huang S, Jin
M, Ni Z, Zhang B, Zhang D, Luo F, et al: FGF/FGFR signaling in
health and disease. Signal Transduct Target Ther. 5:1812020.
View Article : Google Scholar : PubMed/NCBI
|
|
26
|
Tyulyandina A, Harrison D, Yin W,
Stepanova E, Kochenkov D, Solomko E, Peretolchina N, Daeyaert F,
Joos JB, Aken KV, et al: Alofanib, an allosteric FGFR2 inhibitor,
has potent effects on ovarian cancer growth in preclinical studies.
Invest New Drugs. 35:127–133. 2017. View Article : Google Scholar : PubMed/NCBI
|
|
27
|
Gillen S, Schuster T, Büschenfelde CM,
Friess H and Kleeff J: Preoperative/neoadjuvant therapy in
pancreatic cancer: A systematic review and meta-analysis of
response and resection percentages. PLoS Med. 7:e10002672010.
View Article : Google Scholar : PubMed/NCBI
|
|
28
|
Zhu H, Wei M, Xu J, Hua J, Liang C, Meng
Q, Zhang Y, Liu J, Zhang B, Yu X and Shi S: PARP inhibitors in
pancreatic cancer: Molecular mechanisms and clinical applications.
Mol Cancer. 19:492020. View Article : Google Scholar : PubMed/NCBI
|
|
29
|
Biankin AV, Waddell N, Kassahn KS, Gingras
MC, Muthuswamy LB, Johns AL, Miller DK, Wilson PJ, Patch AM, Wu J,
et al: Pancreatic cancer genomes reveal aberrations in axon
guidance pathway genes. Nature. 491:399–405. 2012. View Article : Google Scholar : PubMed/NCBI
|
|
30
|
Singhi AD, George B, Greenbowe JR, Chung
J, Suh J, Maitra A, Klempner SJ, Hendifar A, Milind JM, Golan T, et
al: Real-time targeted genome profile analysis of pancreatic ductal
adenocarcinomas identifies genetic alterations that might be
targeted with existing drugs or used as biomarkers.
Gastroenterology. 156:2242–2253.e2244. 2019. View Article : Google Scholar : PubMed/NCBI
|
|
31
|
Wang S, Zheng Y, Yang F, Zhu L, Zhu XQ,
Wang ZF, Wu XL, Zhou CH, Yan JY, Hu BY, et al: The molecular
biology of pancreatic adenocarcinoma: Translational challenges and
clinical perspectives. Signal Transduct Target Ther. 6:2492021.
View Article : Google Scholar : PubMed/NCBI
|
|
32
|
Luong T, Golivi Y, Nagaraju GP and
El-Rayes BF: Fibroblast heterogeneity in pancreatic ductal
adenocarcinoma: Perspectives in immunotherapy. Cytokine Growth
Factor Rev. 8:S1359–S6101. 2022.PubMed/NCBI
|
|
33
|
Zhou W, Zhou Y, Chen X, Ning T, Chen H,
Guo Q, Zhang Y, Liu P, Zhang Y, Li C, et al: Pancreatic
cancer-targeting exosomes for enhancing immunotherapy and
reprogramming tumor microenvironment. Biomaterials. 268:1205462021.
View Article : Google Scholar : PubMed/NCBI
|
|
34
|
Quail DF and Joyce JA: Microenvironmental
regulation of tumor progression and metastasis. Nat Med.
19:1423–1437. 2013. View Article : Google Scholar : PubMed/NCBI
|
|
35
|
Deepak KGK, Vempati R, Nagaraju GP, Dasari
VR, Nagini S, Rao DN and Malla RR: Tumor microenvironment:
Challenges and opportunities in targeting metastasis of triple
negative breast cancer. Pharmacol Res. 153:1046832020. View Article : Google Scholar : PubMed/NCBI
|
|
36
|
Devlin MJ, Miller R, Laforets F, Kotantaki
P, Garsed DW, Kristeleit R, Bowtell DD, McDermott J, Maniati E and
Balkwill FR: The tumour microenvironment of clear cell ovarian
cancer. Cancer Immunol Res. 12:CIR22–0407. 2022.PubMed/NCBI
|
|
37
|
Ren B, Cui M, Yang G, Wang H, Feng M, You
L and Zhao Y: Tumor microenvironment participates in metastasis of
pancreatic cancer. Mol Cancer. 17:1082018. View Article : Google Scholar : PubMed/NCBI
|
|
38
|
Rubin SJS, Sojwal RS, Gubatan J and
Rogalla S: The tumor immune microenvironment in pancreatic ductal
adenocarcinoma: Neither hot nor cold. Cancers (Basel). 14:42362022.
View Article : Google Scholar : PubMed/NCBI
|
|
39
|
Bao Y, Gabrielpillai J, Dietrich J, Zarbl
R, Strieth S, Schröck F and Dietrich D: Fibroblast growth factor
(FGF), FGF receptor (FGFR), and cyclin D1 (CCND1) DNA methylation
in head and neck squamous cell carcinomas is associated with
transcriptional activity, gene amplification, human papillomavirus
(HPV) status, and sensitivity to tyrosine kinase inhibitors. Clin
Epigenetics. 13:2282021. View Article : Google Scholar : PubMed/NCBI
|
|
40
|
Raja A, Park I, Haq F and Ahn SM:
FGF19-FGFR4 signaling in hepatocellular carcinoma. Cells.
8:5362019. View Article : Google Scholar : PubMed/NCBI
|
|
41
|
Tovar V, Cornella H, Moeini A, Vidal S,
Hoshida Y, Sia D, Peix J, Cabellos L, Alsinet C, Torrecilla S, et
al: Tumour initiating cells and IGF/FGF signalling contribute to
sorafenib resistance in hepatocellular carcinoma. Gut. 66:530–540.
2017. View Article : Google Scholar : PubMed/NCBI
|
|
42
|
Zhu Z, Tang C, Xu T and Zhao Z: Molecular
analysis of prognosis and immune pathways of pancreatic cancer
based on TNF family members. J Oncol. 2021:26769962021. View Article : Google Scholar : PubMed/NCBI
|
|
43
|
Wang J, Shu H and Guo S: MiR-646
suppresses proliferation and metastasis of non-small cell lung
cancer by repressing FGF2 and CCND2. Cancer Med. 9:4360–4370. 2020.
View Article : Google Scholar : PubMed/NCBI
|
|
44
|
Yang B, Li L, Tong G, Zeng Z, Tan J, Su Z,
Liu Z, Lin J, Gao W, Chen J, et al: Circular RNA circ_001422
promotes the progression and metastasis of osteosarcoma via the
miR-195-5p/FGF2/PI3K/Akt axis. J Exp Clin Cancer Res. 40:2352021.
View Article : Google Scholar : PubMed/NCBI
|
|
45
|
Ilkow CS, Marguerie M, Batenchuk C, Mayer
J, Neriah DB, Cousineau S, Falls T, Jennings VA, Boileau M, Bellamy
D, et al: Reciprocal cellular cross-talk within the tumor
microenvironment promotes oncolytic virus activity. Nat Med.
21:530–536. 2015. View Article : Google Scholar : PubMed/NCBI
|
|
46
|
Wilmerding A, Bouteille L, Caruso N,
Bidaut G, Etchevers HC, Graba Y and Delfini MC: Sustained
experimental activation of FGF8/ERK in the developing chicken
spinal cord models early events in ERK-mediated tumorigenesis.
Neoplasia. 24:120–132. 2022. View Article : Google Scholar : PubMed/NCBI
|
|
47
|
Jomrich G, Hudec X, Harpain F, Winkler D,
Timelthaler G, Mohr T, Marian B and Schoppmann SF: Expression of
FGF8, FGF18, and FGFR4 in gastroesophageal adenocarcinomas. Cells.
8:10922019. View Article : Google Scholar : PubMed/NCBI
|
|
48
|
Hao Y, Xiao Y, Liao X, Tang S, Xie X, Liu
R and Chen Q: FGF8 induces epithelial-mesenchymal transition and
promotes metastasis in oral squamous cell carcinoma. Int J Oral
Sci. 13:62021. View Article : Google Scholar : PubMed/NCBI
|