Introduction
Breast cancer is a great threat to the life and
health of women. According to the global cancer statistics in 2020,
breast cancer (BRCA) has surpassed lung cancer as the most
prevalent tumor type worldwide and its mortality ranks fourth among
all cancers (1). According to the
expression level of estrogen receptor (ER), progesterone receptor
(PR) and human epidermal growth factor receptor (HER-2), BRCA can
be divided into four main types including Luminal A
(ER+/PR+/HER2-), Luminal B (ER+/PR+/HER2+), HER2 enriched
(ER-/PR-/HER2+) and triple-negative BRCA (TNBC) (ER-/PR-/HER2-).
Among these, TNBC, the most malignant subtype, accounts for ~10–20%
of all breast cancers (2,3). In addition to the rapid proliferation
rate, high aggressiveness and metastatic propensity, the absence of
effective molecular markers also remains a challenge to improve the
therapeutic effect of TNBC (4).
Chemotherapy has remained the only systematic therapy for TNBC thus
far. However, due to the high heterogeneity, patients with TNBC are
susceptible to developing drug resistance which may lead to disease
progression and even mortality (4,5).
Therefore, identifying effective prognosis-related molecules and
promising drug targets for TNBC is necessary.
Epigenetics refers to reversible, heritable
alterations in gene function that do not involve changes in the DNA
sequence, including modifications to DNA (e.g., methylation
modifications) and various modifications to histones (e.g., histone
acetylation and methylation modifications) (6). In recent years, researchers have
discovered that epigenetic dysregulation may lead to abnormal gene
expression and eventually promote tumor onset and progression
(7,8). Acetylation is one of the major
post-transcriptional protein modifications in cells. Histone
acetylation is controlled by two classes of antagonizing
histone-modifying enzymes including histone deacetylases (HDACs)
and histone acetyltransferases (HATs) which play a central role in
modulating chromatin remodeling and gene expression (9,10). A
total of 18 HDACs identified in humans are divided into four
classes according to their structures and functions: Class I
(HDAC1/2/3/8), class IIa (HDAC4/5/7/9), class IIb (HDAC6/10), class
III (SIRT1-7) and class IV (HDAC11). Among these, class I/II/IV are
well identified as promising therapeutic targets in cancers
(11). Anti-tumor therapy based on
drugs targeting HDACs has also become effective in hematological
malignancies, such as lymphoma and multiple myeloma (12–14).
It has been reported that multiple HDACs including HDAC1/2/3/6 are
dysregulated in BRCA and participate in BRCA progression,
metastasis and invasion (12,15,16).
In TNBC, HDAC6 has been determined as a possible target and the
knockdown or inhibition of HDAC6 can regulate glycolytic metabolism
(17). At the same time,
inhibition of HDAC6 can enhance tubulin acetylation and has a
interaction with eribulin in TNBC (18). HDAC8 is also considered as a
promising target in TNBC through Yin Yang 1 and Forkhead Box A1
(19,20). Moreover, several pre-clinical
studies have revealed that pan-HDAC inhibitors or some selective
HDAC inhibitors exhibit anti-tumor effects through inhibition of
EMT pathway in TNBC (20–23). In addition, the class I HDACs
(HDAC1/2/3/10) have been shown to be upregulated in TNBC and
associated with proliferation, malignant transformation and poor
prognosis (24,25). Pre-clinical studies have also
revealed the potential synergetic role of HDAC inhibitors with
other drugs in TNBC. Sulaiman et al (26) showed that the combination of HDAC
inhibitors, tamoxifen and mTORC1 inhibitors can suppress the
persistence of cancer stem cells and inhibit tumor growth in TNBC.
Ma et al (27) found that
HDAC inhibitors may re-sensitize TNBC cells to tamoxifen treatment.
Torres-Adorno et al (28)
found that HDAC inhibitors can enhance the therapeutic efficiency
of MEK inhibitors in TNBC through MCL1 degradation. Multiple
studies have revealed the possible synergetic effect of HDAC
inhibitors with other drugs in the chemotherapy, radiation therapy
and targeted therapy for TNBC (29–33).
Chidamide, an oral selective suppressor of class I HDACs, has been
proved to be safe and efficacious for the treatment of HR+ advanced
BRCA when combined with the aromatase inhibitor exemestane
(34), indicating the importance
and potential of epigenetic therapy in BRCA. Nonetheless, treatment
of TNBC with single HDAC inhibitors have met with disappointing
results. Meanwhile, combinations of targeted therapies with HDAC
inhibitors are promising treatment options in BRCA, especially in
TNBC (27,28,35).
Therefore, substantiating that the role of HDACs in TNBC is
conductive to prevent TNBC progression.
Biomarkers of cancers not only can play a prognostic
role but also can act as drug targets. Due to the development of
large-scale sequencing technology, numerous novel biomarkers have
been identified in TNBC (36).
However, whether HDACs can be used as prognostic predictors in TNBC
and whether HDACs-related pathways can be used to assess the
potential efficacy of targeted therapies in cancers based on
bioinformatics analysis and large-scale sequencing data have not
been investigated. Thus, in view of the vital role of HDACs in
BRCA, the prognostic value of class I/II/IV HDACs in TNBC and the
possible drug targets for patients with TNBC were explored in the
present study, principally the expression of HDACs in patients with
TNBC and their possible downstream genes based on The Cancer Genome
Atlas (TCGA) and METABRIC databases.
Materials and methods
Data source and processing
The RNA-Seq data of 1,247 samples from the BRCA
database (139 normal samples and 123 TNBC tumor samples) and
corresponding clinical characteristics were downloaded from TCGA
website (https://portal.gdc.cancer.gov/projects/TCGABRCA).
Ensemble IDs were converted to official gene symbols and log2
processing of the data was performed. mRNAs and protein-coding
genes were screened by the Ensemble human genome browser GRCh38
(GRCh38.p9;
ftp.ncbi.nlm.nih.gov/genomes/refseq/vertebrate_mammalian/Homo_sapiens/reference/GCF_000001405.39_GRCh38.p13).
Survival analysis
The overall survival of patients with BRCA in the
TCGA database was analyzed and plotted on the Kaplan Meir Plotter
(https://kmplot.com/analysis/) and the
survival in METABRIC database was analyzed and plotted by using
Breast Cancer Gene-Expression Miner v4.8 (http://bcgenex.ico.unicancer.fr/BC-GEM/GEM-Accueil.php?js=1).
The best cutoff value was taken for all survival analyses.
Comparing HDACs expression
The expression level of genes in TCGA and METABRIC
databases was compared and plotted using Breast Cancer
Gene-Expression Miner v4.8
(bcgenex.ico.unicancer.fr/BC-GEM/GEM-Requete.php?mode=8) by
searching the ‘Target Gene Expression’ module of the website. The
expression of HDAC7 in pan-cancer was analyzed by TIMER
(timer.cistrome.org/).
Differential expression analysis
The limma package (37) in R (38) was used to screen the mRNA
expression matrix between Low-HDAC7 expression and High-HDAC7
expression groups, TNBC samples and normal tissue samples. The
criteria for differential mRNAs were |log 2(fold change)|>1 and
a false discovery rate (FDR) <0.05. The volcano map was executed
using the OmicStudio tools at https://www.omicstudio.cn/tool.
Functional enrichment analysis
Gene clustering analysis and KEGG analysis were
performed on DAVID Bioinformatics Resources (david.ncifcrf.gov/), which allows enrichment of gene
symbols by entering gene name files. Then the enrichment results
were plotted as bubble map using the ggplot package version 3.3.6
(ggplot2.tidyverse.org) in R studio.
Correlation analysis
To explore the correlation genes with HDAC7, the
Sanger box-Spearman correlation coefficients calculator was used to
calculated the correlation confidence of HDAC7-related genes, the
criteria of correlation genes were |R|>=0.4 and a P<0.05
(39). Then the result was plotted
as heat map using the OmicStudio tools V3.3.6
(omicstudio.cn/tool).
Immune correlation
The correlation of the target genes HDAC7, NUDCD1
and GGH was analyzed and the graph was plotted on the TIMER website
(http://timer.cistrome.org/) (40). This website used the partial
Spearman's correlation to analyze the correlation of target genes
expression with immune infiltration level in diverse cancer types.
The ‘purity adjustment’ was used to reduce the confusing effects of
tumor purity.
Cell culture
All cell lines were obtained from ATCC, including
the normal breast epithelial cell MCF-10A, the luminal BRCA cell
lines MCF-7 and T47D and the TNBC cell lines MDA-MB-231,
MDA-MB-468, SUM-149, SUM-159 and BT-549. MCF-7, T47D, MDA-MB-231,
MDA-MB-468, SUM-149, SUM-159 and BT-549 cells were cultured in DMEM
(Gibco; Thermo Fisher Scientific, Inc.) with 10% fetal bovine serum
(FBS, Newzerum Ltd.). MCF-10A cells were cultured in the special
medium (HY Bio, Guangzhou, China) supplemented with 5% horse serum,
20 ng/ml EGF, 100 ng/ml cholera toxin, 0.01 mg/ml insulin, 500
ng/ml hydrocortisone (Procell). The detail information of each cell
line is in Table I.
 | Table I.Cell lines used in the present
study. |
Table I.
Cell lines used in the present
study.
| Name | ATCC catalog
no. | ER status | PR status | HER2 status |
|---|
| MCF-10A | CRL-10317 | - | - | - |
| MCF-7 | HTB-22 | Positive | Positive | Negative |
| T47D | HTB-133 | Positive | Positive | Negative |
| MDA-MB-231 | HTB-26 | Negative | Negative | Negative |
| MDA-MB-468 | HTB-132 | Negative | Negative | Negative |
| SUM-149 | TCP-1001 | Negative | Negative | Negative |
| SUM-159 | TCP-1002 | Negative | Negative | Negative |
| BT-549 | HTB-122 | Negative | Negative | Negative |
Cells were cultured using the medium described above
and the medium was changed every 2 days. When the cell density
reached ~70–80%, cell passaging was performed. The medium was
removed and 1 ml trypsin was added to digest cells for ~30 sec-1
min, then 1 ml medium containing serum was added to terminate
digestion. Cells were gently blown off the bottom of the culture
bottles, then transferred to a 15 ml centrifuge tube and
centrifuged at room temperature, 100 g for 3 min. The liquid was
removed and cells were resuspended with 1 ml complete medium. Cells
were passage into a new culture bottle at 1:3-1:4. The number of
cell passages in a single experiment did not exceed 15 times.
Small interfering (si)RNA
transfection
For transfection of siRNA, cells were plated at a
density of 1×10⁵ cells per well in 6-well plates, cell
density was ~60–80% per well. Then cells were transfected with
negative control (NC), or specific siRNAs for HDAC7, NudCD1 and GGH
(100 nM; Shanghai GenePharma Co., Ltd.), respectively, using
Lipofectamine® RNAiMAX transfection reagent (Invitrogen;
Thermo Fisher Scientific, Inc.). For transfection, 125 µl opi-MEM
(Thermo Fisher Scientific) was mixed with 25 pmol siRNA and another
125 µl opi-MEM was mixed with 7.5 µl RNAiMAX and the mixture was
incubated at room temperature for 15 min respectively. Then the
iMAX solution was added to the siRNA solution, mixed well and
incubated at room temperature for another 15 min. Finally, the 250
µl mixture was added into indicated wells. After transfection of 24
h, the culture medium was aspirated and replaced with new complete
medium for another 24 h.
The siRNA sequences were: HDAC7:
5′-ACUUCUUGGGCUUAUAGCGCA-3′, 5′-CGCUAUAAGCCCAAGAAGUCC-3′; NUDCD1:
5′-AGUGUAUAUUGAUCAUCUCGA-3′, 5′-GAGAUGAUCAAUAUACACUGG-3′; GGH:
5′-UUUUUGCAUUAAUAUUCCGAU-3′, 5′-CGGAAUAUUAAUGCAAAAAUG-3′; NC:
5′-UUCUCCGAACGUGUGACGUTT-3′, 5′-ACGUGACACGUUCGGAGAATT-3′.
Construction of plasmid and
transfection
pCMV-MCS (catalogue number: JD2022092202R) cloning
vector was used to construct pCMV-HDAC7 over-expression plasmid.
Plasmid was transfected into cells with Lipofectamine®
3000 (cat. no. L3000150; Invitrogen; Thermo Fisher Scientific,
Inc.). Cells were seeded in 6-well plates at 1×10⁵ cells
per well and transfection experiments were performed when the cell
density reached 60–70%. The transfection system was 1.5 µg of
plasmid, 3 µl p3000 and 3 µl Lipofectamine® 3000 per 250
µl of opi-MEM. The transfection mixture was incubated at room
temperature for 15 min and added into the six-well plates. After 24
h of transfection, the supernatant was discarded and the medium was
changed to complete medium and incubated for another 24 h for
subsequent experimental verification.
RNA extraction
Total RNA was extracted from BRCA cells using
TRIzol® (Thermo Fisher Scientific, Inc.) and RNA
concentration and quality were determined by the absorbance of RNA
at 260 and 280 nm. RNA extraction, cDNA synthesis, and qPCR
performed according to the manufacturer's protocol. Each six-well
plate (1–2×10⁵ cells per well) was lysed with 1 ml of
TRIzol® and then the lysis was transferred to 1.5 ml EP
tubes. To let the RNA and protein in cell phase separation, the
lysis was mixed with 200 µl of chloroform. The mixture was
centrifuged at 4°C, 12,000 × g for 15 min. The upper layer of clear
liquid was carefully transferred to another 1.5 ml EP tube for the
next reaction. The clear liquid was gently mixed with 500 µl of
isopropyl alcohol and left to stand for 10 min at room temperature.
Then the mixture was centrifuged at 4°C, 12,000 × g for 10 min and
the supernatant was discarded, leaving an RNA precipitate. The
precipitate was gently washed with 1 ml of 75% ethanol. Then the
liquid was centrifuged at 4°C, 7,500 × g for 5 min and the
supernatant was discarded. The precipitate was dried for 10 min and
dissolved with 30–50 µl RNA free-DEPC H2O. Total RNA
concentration and purity were analyzed in duplicate using a
NanoDrop One (cat. no. AZY1705838; Thermo Fisher Scientific, Inc.).
PrimerScript RT Master Mix (cat. no. RR036A; Takara Bio, Inc.) was
used to generate cDNA. Then, 2 µl of 5X PrimerScript RT master mix,
1,000 µg of RNA and DEPC water were used per 10 µl of reverse
transcription reaction system.
Reverse transcription-quantitative
(RT-q) PCR
The reverse transcription procedure was: 15 min at
37°C, 5 sec at 85°C and then 4°C for 30 min. RT-qPCR was performed
using TB Green Premix Ex Tap II (cat. no. RR820A; Takara Bio,
Inc.). The RT-qPCR system contained 5 µl SYBR Premix Ex Taq II, 0.4
µl forward primer, 0.4 µl reverse primer, 3.2 µl DEPC water and 1
µl cDNA product. The reactions were carried out in a LightCycler480
(Roche, America) system. The reaction protocol was: 95°C for 10
min; followed by 40 cycles at 95°C for 10 sec and 60°C for 30 sec.
The quantification method is as follows: 2−ΔCq (41). The experiment was repeated
independently three times. The gene-specific primer sequences were:
GAPDH: 5′-ggAgCgAgATCCCTCCAAAAT-3′, 5′-ggCTgTTgTCATACTTCTCATgg-3′;
HDAC7: 5′-TgCCCAgTCCTTAATgACCAC-3′, 5′-CACCTggACgTgAgTTTTgAg-3′;
NudCD1: 5′-AAAACCACgAgAggTgTTTCg-3′, 5′-CTgACAAggTAACCCAggTAgA-3′;
GGH: 5′-ggAgAgTgCTTATTAACTgCCAC-3′,
5′-AggCTCCACTTATggAAATTgg-3′.
Cell viability assays
Following transfection with specific siRNAs, cells
were plated at 3,000 cells per well in 96-well plates and cultured
for the indicated time periods. Cell viability was performed using
the MTT assay (cat. no. 3580MG250, BioFrox). Briefly, MTT was
configured into a 5 mg/ml solution in sterile phosphate-buffered
saline (PBS) and added into cell culture media with a ratio of 1:10
at 0 (6 h after plating was identified as 0 h; when the cells were
attached), 24, 48 and 72 h, respectively. Following incubation at
37°C for 4 h, the culture medium was aspirated and the precipitate
was dissolved in DMSO, then absorbance at a wavelength of 490 nm
was detected by a microplate spectrophotometer. The 24, 48 and 72 h
absorbance was compared with the day 0 absorbance in each group and
the fold change of relative cell viability plotted using GraphPad
Prism 8.0 software (GraphPad Software, Inc.).
Colony formation assay
For colony assay, following transfection with siRNA
for 48 h, cells were plated at 1,000 cells per well in 6-well
plates and cultured with the complete culture medium for 14–21
days. Then the culture medium was removed and cells were fixed with
4% paraformaldehyde at room temperature for 15 min and stained with
0.1% crystal violet for 20 min. The colony formation was imaged and
automatic counting using a fluorescent enzyme-linked immune-spot
analyzer (AID vSpot Spectrum; Advanced Imaging Devices GmbH).
Groups were compared using cell colony counts.
Statistical analysis
All statistical analyses were performed using
GraphPad Prism 8.0 (GraphPad Software, Inc.), unless otherwise
described in the figure legends or methods. One-way ANOVA with
Dunnett's multiple comparisons was used to compare the mRNA
expression of HDACs in different subtypes of BRCA in TCGA and
METABRIC databases. Two-tailed unpaired Student's t-test was
employed to test the significance between two groups. Kaplan-Meier
survival curve and Log-rank test were used to analyze the survival
outcomes. The univariate Cox regression analysis was used to
explore the prognostic value of HDAC7 in TNBC. Pearson's
correlation was used to investigate the relationship between HDAC7
and downstream genes and immune cells infiltration. All experiments
for cell cultures were performed independently at least three times
and standard deviation (SD) was used to measure the variation.
P<0.05 was considered to indicate a statistically significant
difference.
Results
Expression of the histone deacetylases
in TNBC
Patients with TNBC were identified as ER negative,
PR negative and HER2 negative based on IHC information from the
database. The mRNA expression level of HDACs was analyzed in a
total of 126 and 289 cases of patients with TNBC from TCGA-BRCA
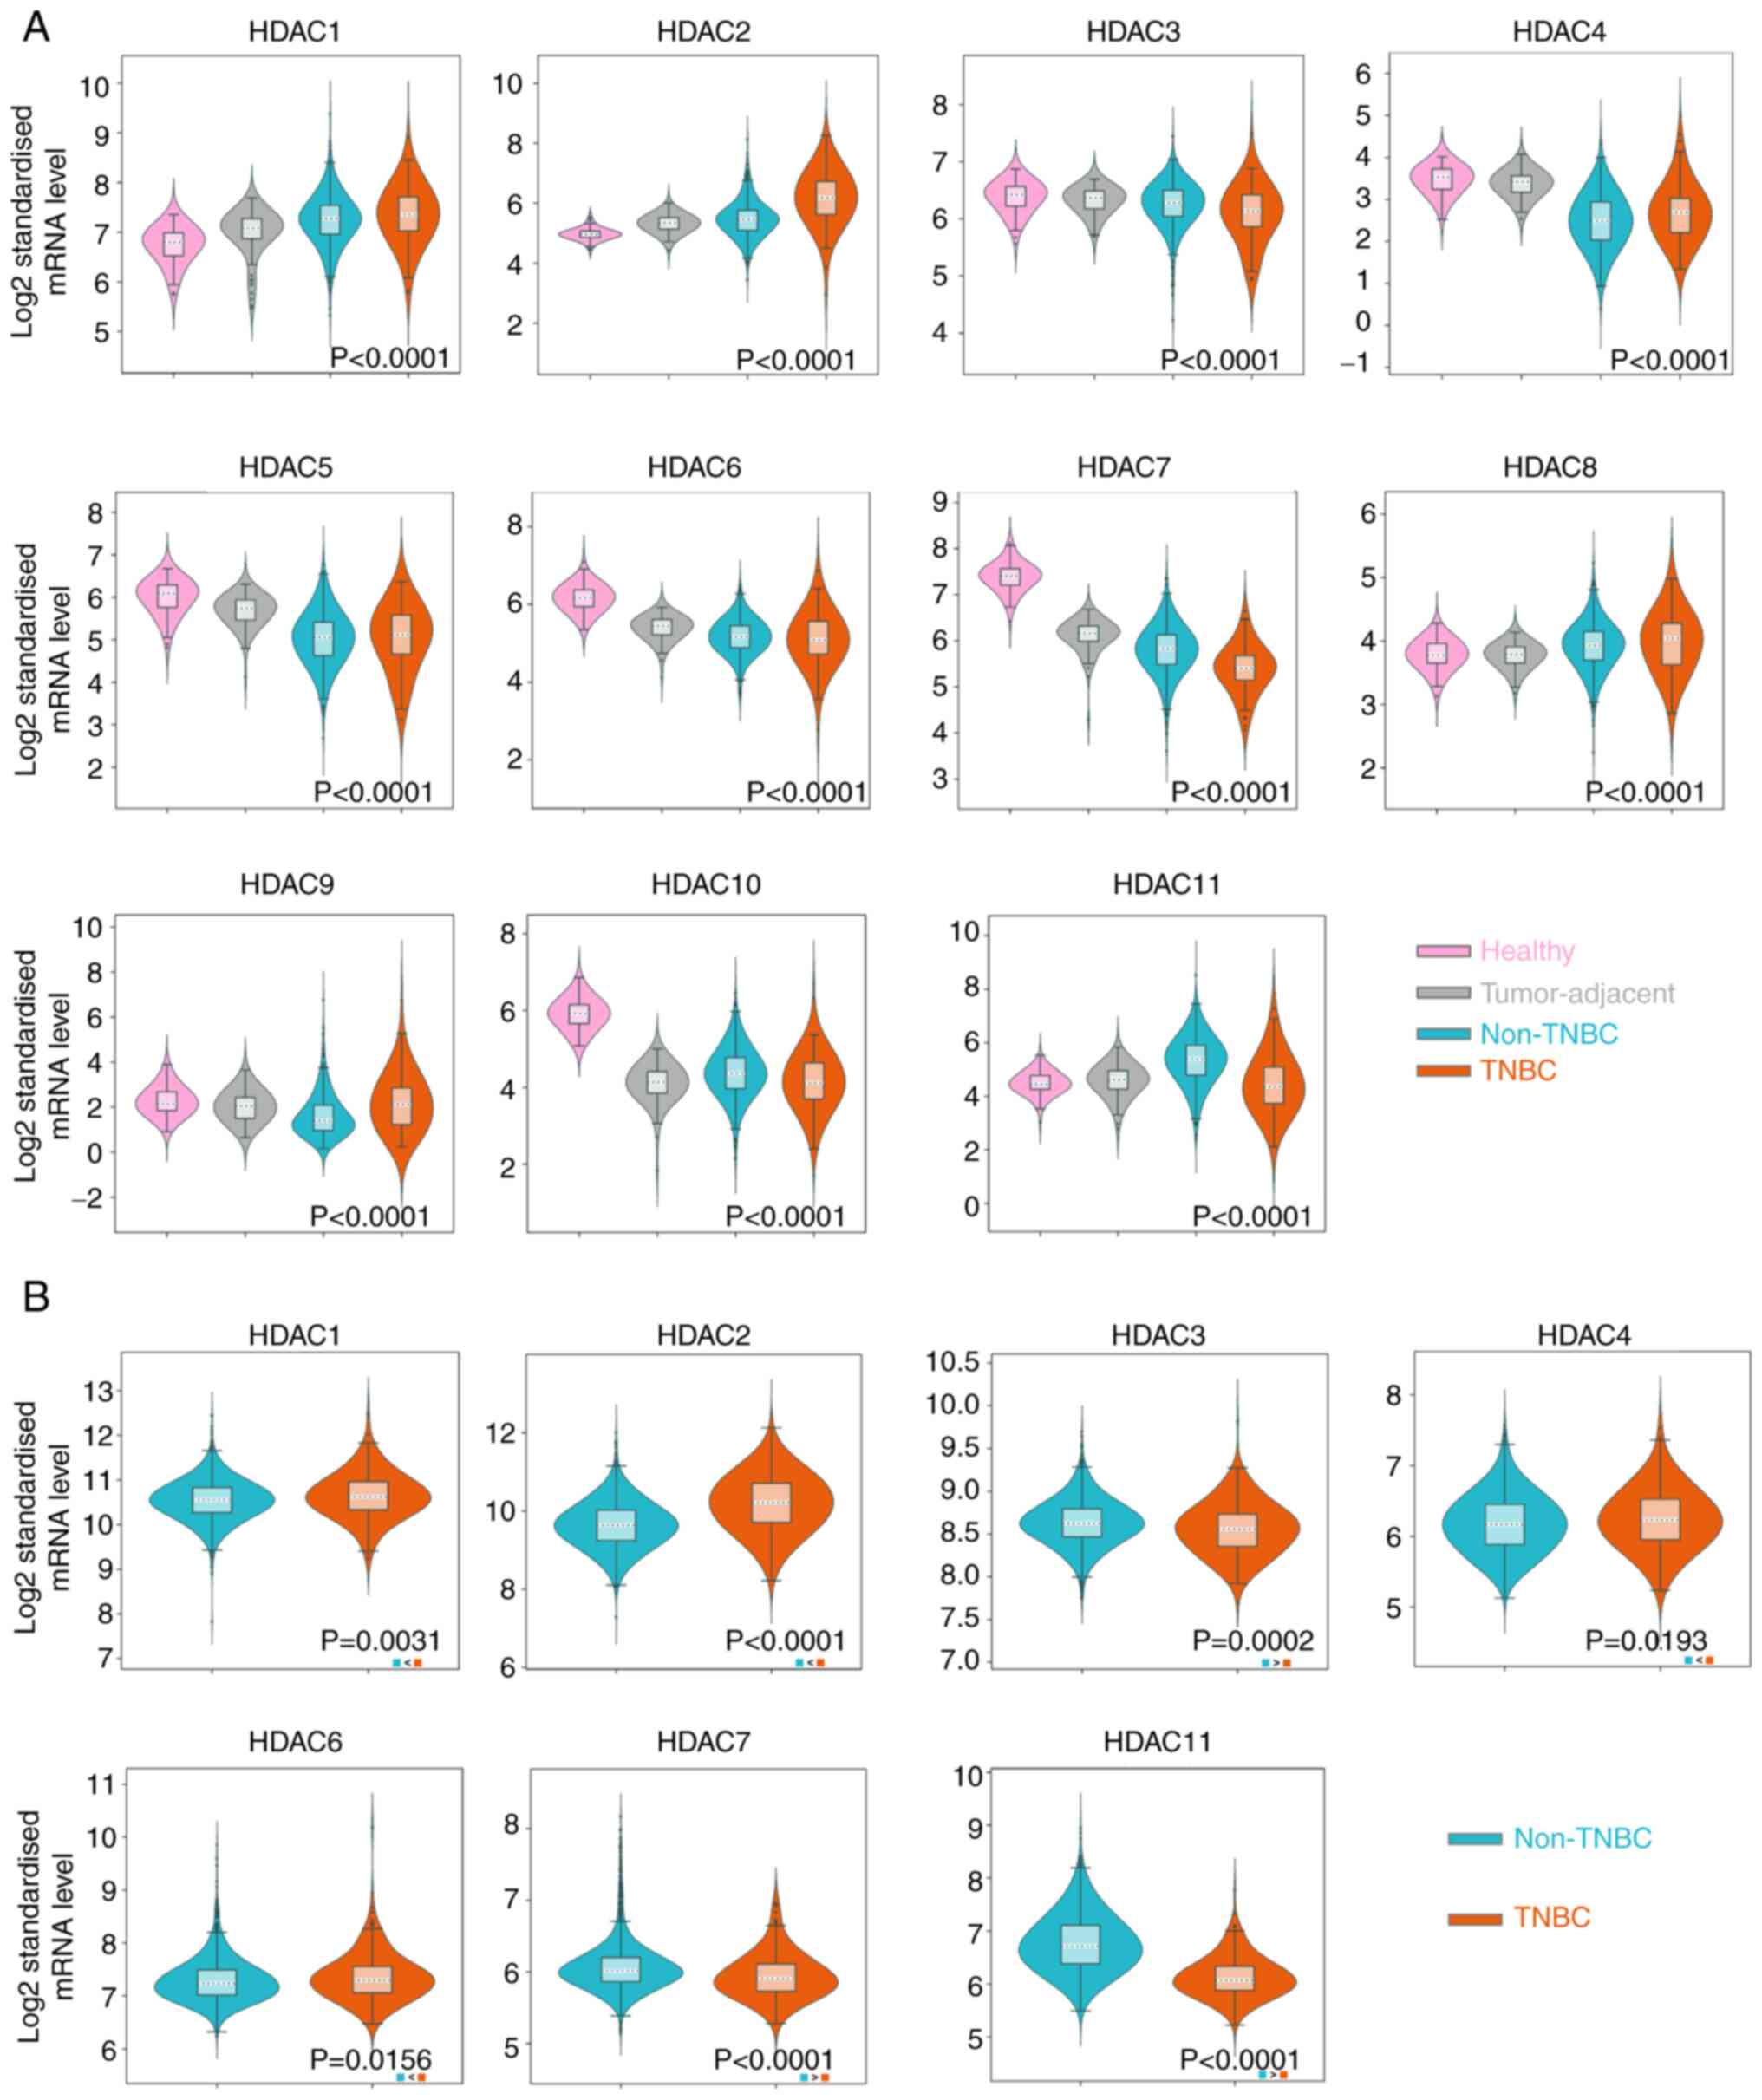
database and METABRIC dataset, respectively. It was observed that
HDAC1/2/8/9 were upregulated in the tissue samples of BRCA,
especially in TNBC (P<0.01), while HDAC3/4/5/6/7/10 were
downregulated in BRCA and TNBC tissues (P<0.01) in the TCGA
database. HDAC11 expression was reduced in TNBC samples but
significantly upregulated in non-TNBC samples (Fig. 1A). The P-values in HDAC1-8 and
HDAC10-11 indicated the significance between the ER-group and the
normal tissue group. The P-value of HDAC9 represented a significant
difference between TNBC and non-TNBC groups and no significant
difference was noticed in HDAC9 expression between TNBC group and
normal group. Since normal tissue samples are unavailable in
METABRIC database, the expression of target HDACs in TNBC samples
were compared with non-TNBC samples. The results showed that the
expression of HDAC1/2/4/6 was higher in TNBC than in patients
without TNBC (P<0.05). HDAC3/7/11 was significantly lower in
TNBC samples (P<0.01; Fig. 1B).
However, no statistical difference was noticed in HDAC5/8/9
expression levels between TNBC and non-TNBC groups (Fig. S1A). HDAC10 was not detected in the
METABRIC database. The expression of HDAC1/2/3/7/11 in TNBC and
non-TNBC groups were consistent with the results from the two
databases.
Prognostic value of the histone
deacetylases for TNBC
To further identify the prognostic value of HDACs in
TNBC, the Kaplan-Meier Plotter online website was used to analyze
the prognostic value of HDACs in the TCGA database and the Breast
Cancer Gene-Expression Miner online website (http://bcgenex.ico.unicancer.fr/BC-GEM/GEM-Accueil.php?js=1).
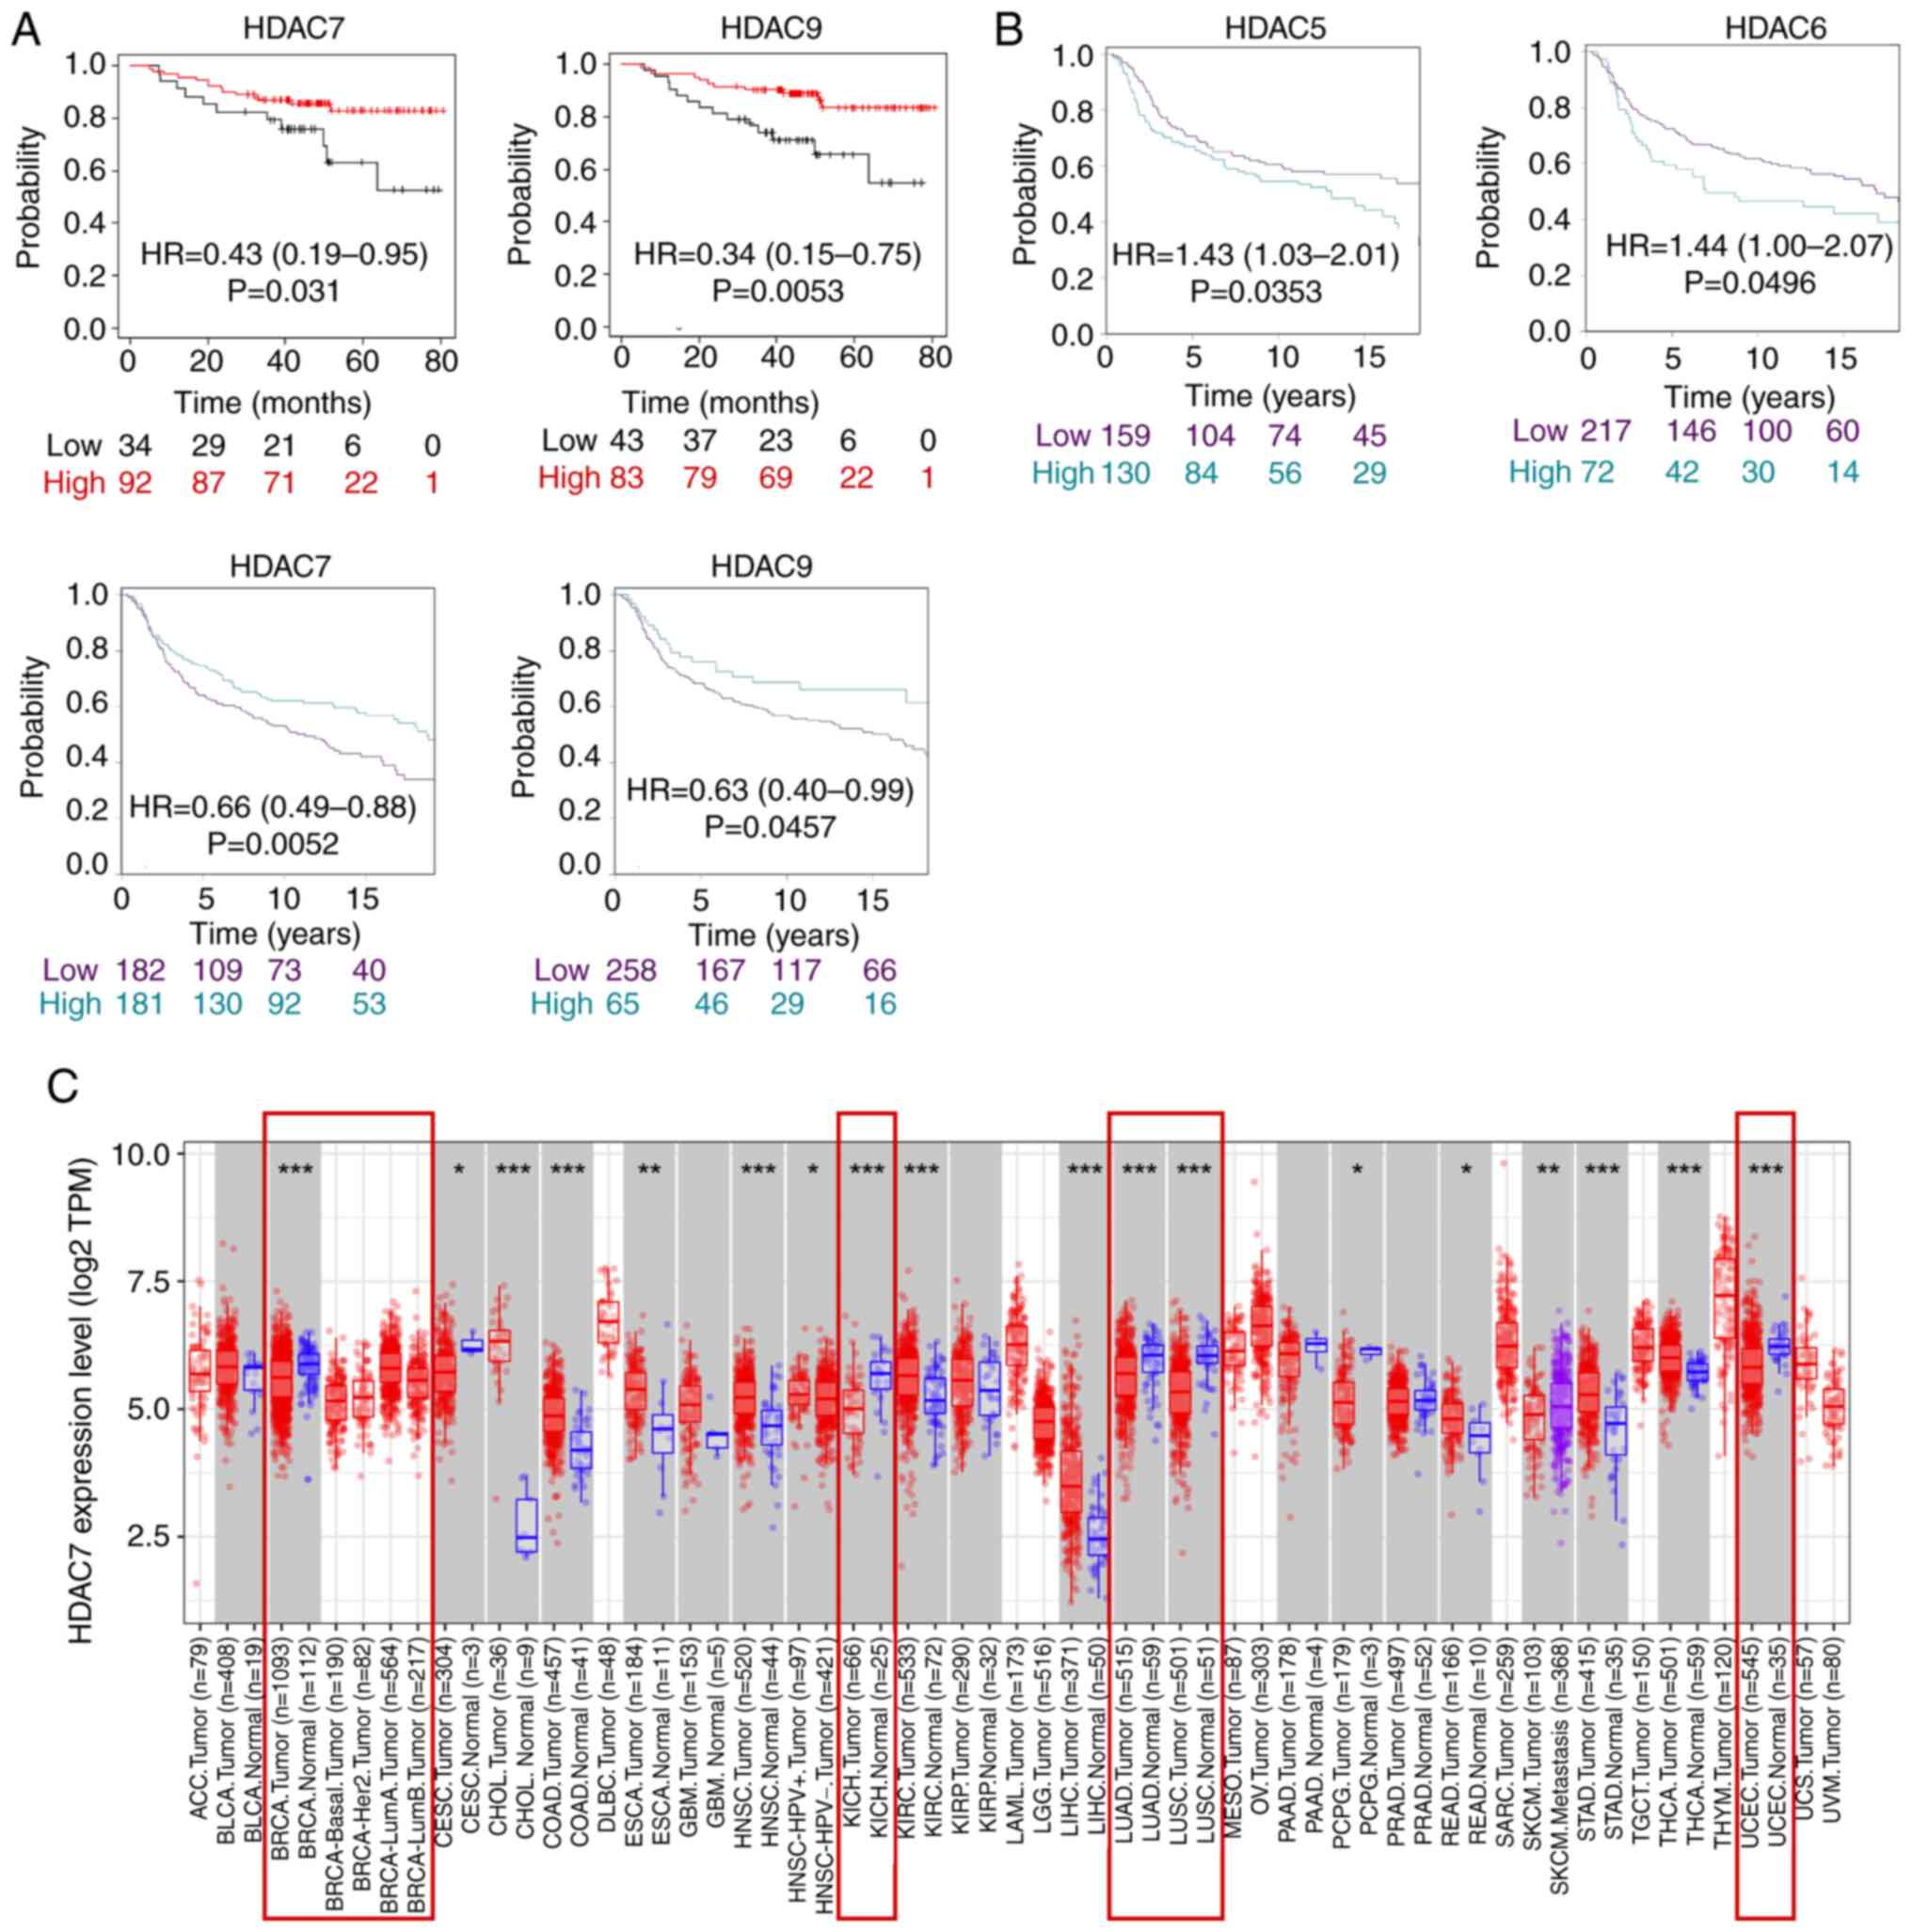
First of all, it was found in TCGA database that only HDAC7 and
HDAC9 expression were significantly associated with overall
survival time (OS) in patients with TNBC and lower expression of
HDAC7 [Hazard ratio (HR)=0.43; 95% confidence interval
(CI)=0.19-0.95, P=0.031] and HDAC9 (HR=0.34; 95%CI=0.15-0.75;
P=0.0053) were associated with poor survival rate (Fig. 2A). Secondly, in METABRIC database,
the results showed that HDAC5/6/7/9 expression was significantly
associated with the survival time of patients, of which high
expression of HDAC5 (Hazard Ratio HR=1.43; 95%CI=1.03-2.01;
P=0.0353) and HDAC6 (HR=1.44; 95%CI=1.00-2.07; P=0.0496) were
associated with shorter OS, while high expression of HDAC7
(HR=0.66; 95%CI=0.49-0.88; P=0.0052) and HDAC9 (HR=0.63;
95%CI=0.40-0.99; P=0.0457) were associated with improved OS time
(Fig. 2B). The expression of
HDAC1-6, HDAC8, HDAC10 and HDAC11 was not statistically correlated
with OS time in the TCGA database (Fig. S1B). Moreover, the expression of
HDAC1-4, HDAC8, and HDAC11 was not statistically correlated with OS
time in the METABIRC database (Fig.
S1C). In summary, the two datasets indicated HDAC7 was
downregulated in BRCA, especially in TNBC tissues and lower
expression of HDAC7 predicted poor OS time.
As the above analysis suggested that HDAC7 might
serve as a tumor suppressor in BRCA, the role of HDAC7 in other
cancer types was further evaluated by the TIMER website. The
results indicated that HDAC7 was downregulated in a number of
cancers including BRCA, kidney chromophobe, lung adenocarcinoma,
lung squamous cell carcinoma and uterine corpus endometrial
carcinoma, which indicated the possible inhibitory role of HDAC7 in
cancers (Fig. 2C). Overall, these
results suggested that HDAC7 might be a promising prognostic
indicator and therapeutic target for cancers, especially for
TNBC.
Functional enrichment analysis of
HDAC7 in TNBC
To further assess the predictive value of HDAC7 in
TNBC, the Univariate Cox regression analysis was used. The hazard
ratio (HR) of HDAC7 in TNBC was 0.389 (95%CI=0.153-0.99), P=0.048
(Fig. 3A), validating that HDAC7
might function as an independent prognostic factor. As shown in
Fig. 2A, patients with TNBC in
TCGA database were divided into HDAC7 high expression group (n=89)
and low expression group (n=34) according to the optimum cutoff
value based on the association with OS. Then the expression of
differential genes between the two groups were analyzed and KEGG
enrichment analysis was performed to explore the biological
function of HDAC7 (Fig. 3B and C).
The orange and yellow dots in Fig.
3B represented differentially expressed genes that have no
statistical significance, or the |log 2 (fold change)|≤1. The blue
and red dots in Fig. 3B
represented the differentially expressed genes that have
statistical significance or whose |log 2 (fold change)|>1. Those
significantly upregulated or downregulated genes were used to
perform the KEGG enrichment analysis. As shown in Fig. 3C, differentially expressed genes
were mostly involved in neuroactive ligand-receptor interaction,
cell adhesion molecules, PI3K-Akt signaling pathway and
cytokine-cytokine receptor interaction pathway (P<0.05, Fig. 3C), which indicated the possible
role of HDAC7 in the regulation of TNBC progression.
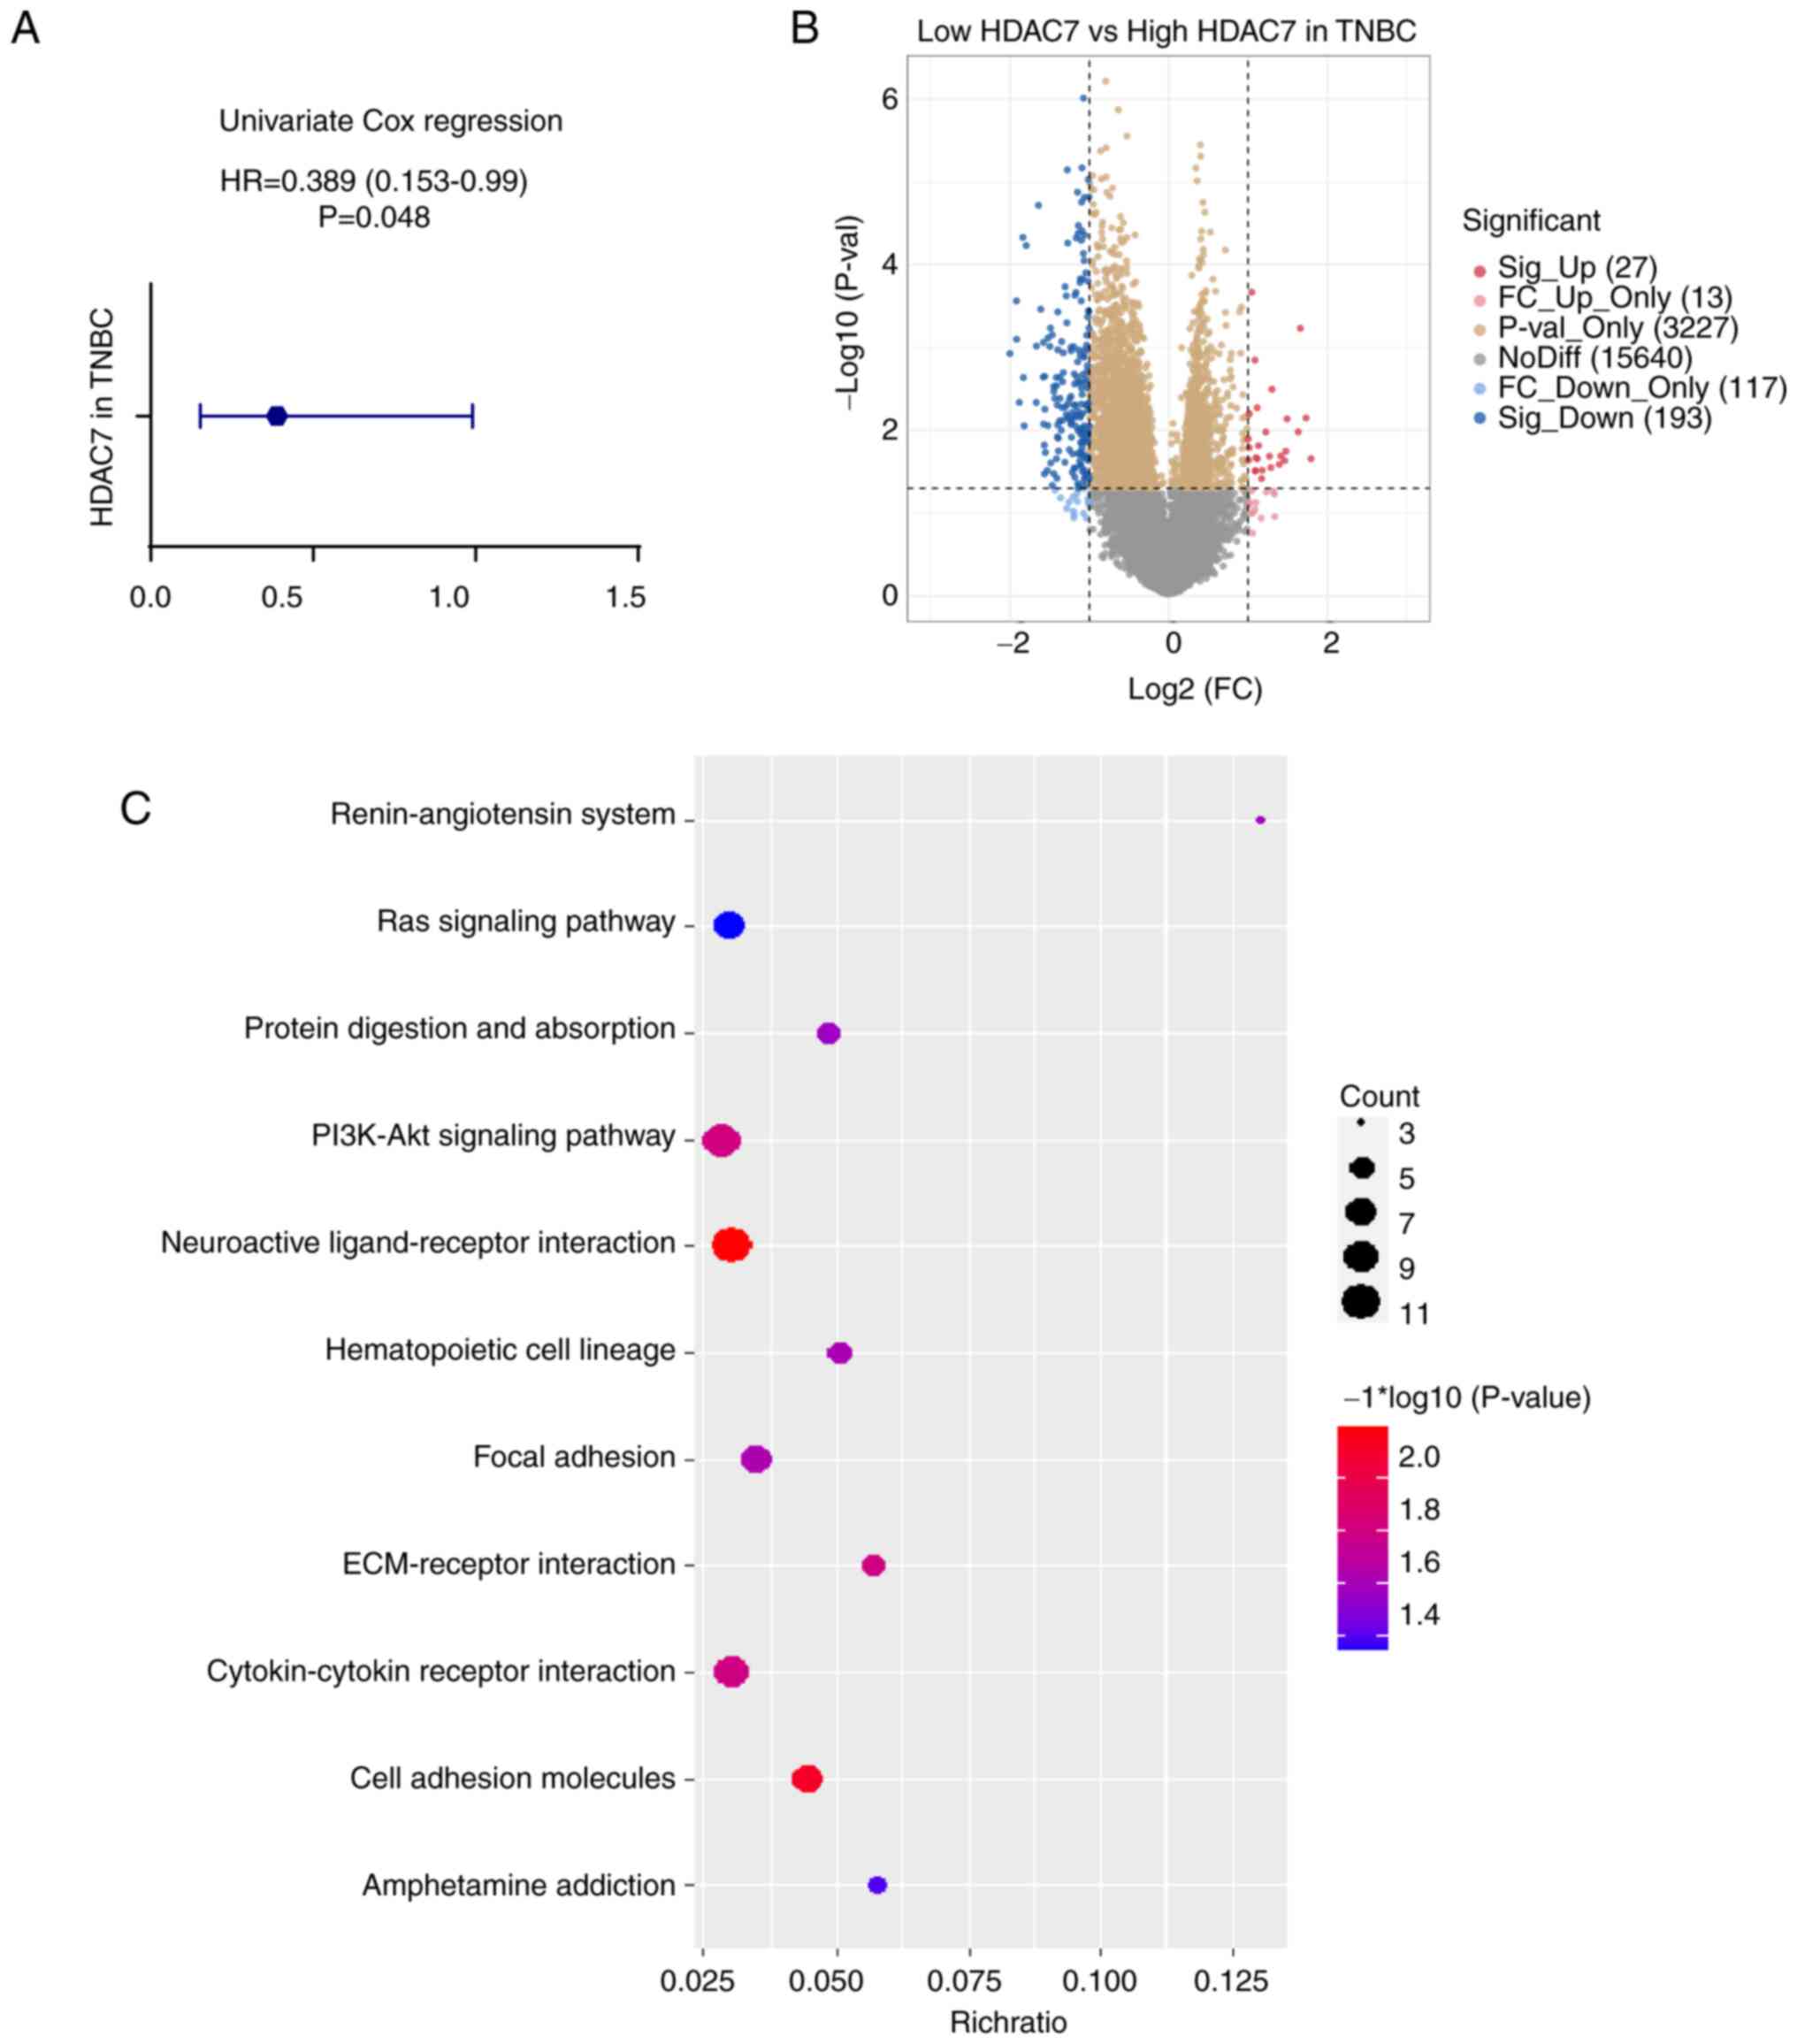 | Figure 3.Functional enrichment analysis of
HDAC7 in TNBC. (A) Univariate cox regression analyzes of HDAC7 in
TNBC. HR=0.389 (0.153-0.99), P=0.048. (B) Volcano plot of
differentially expressed genes between the high and low HDAC7
expressing groups in TNBC. (C) Bubble plot of KEGG clustering of
differentially expressed genes, the bubble size represents the
cluster count, the color represents the P-value and the position of
the horizontal axis represents the enrichment ratio. All the
analysis data was obtained from the TCGA database. *P<0.05,
**P<0.01, ***P<0.005. HDACs, histone deacetylases; TNBC,
triple-negative breast cancer; HR, hazard ration; KEGG, Kyoto
Encyclopedia of Genes and Genomes; TCGA, The Cancer Genome
Atlas. |
NudCD1 and GGH prognostic genes are
HDAC7-related downstream genes
As our previous analyses have identified HDAC7 as a
predictive gene with significant clinical value and biological
functions in TNBC, genes that regulated by HDAC7 and participating
in TNBC progression were next explored. Histone deacetylases remove
acetyl groups from histone and tighten DNA-histone interactions,
resulting in a closed chromatin structure and the inhibition of
gene transcription. Considering that HDAC7 was downregulated in
TNBC, its direct targets were presumed to be upregulated.
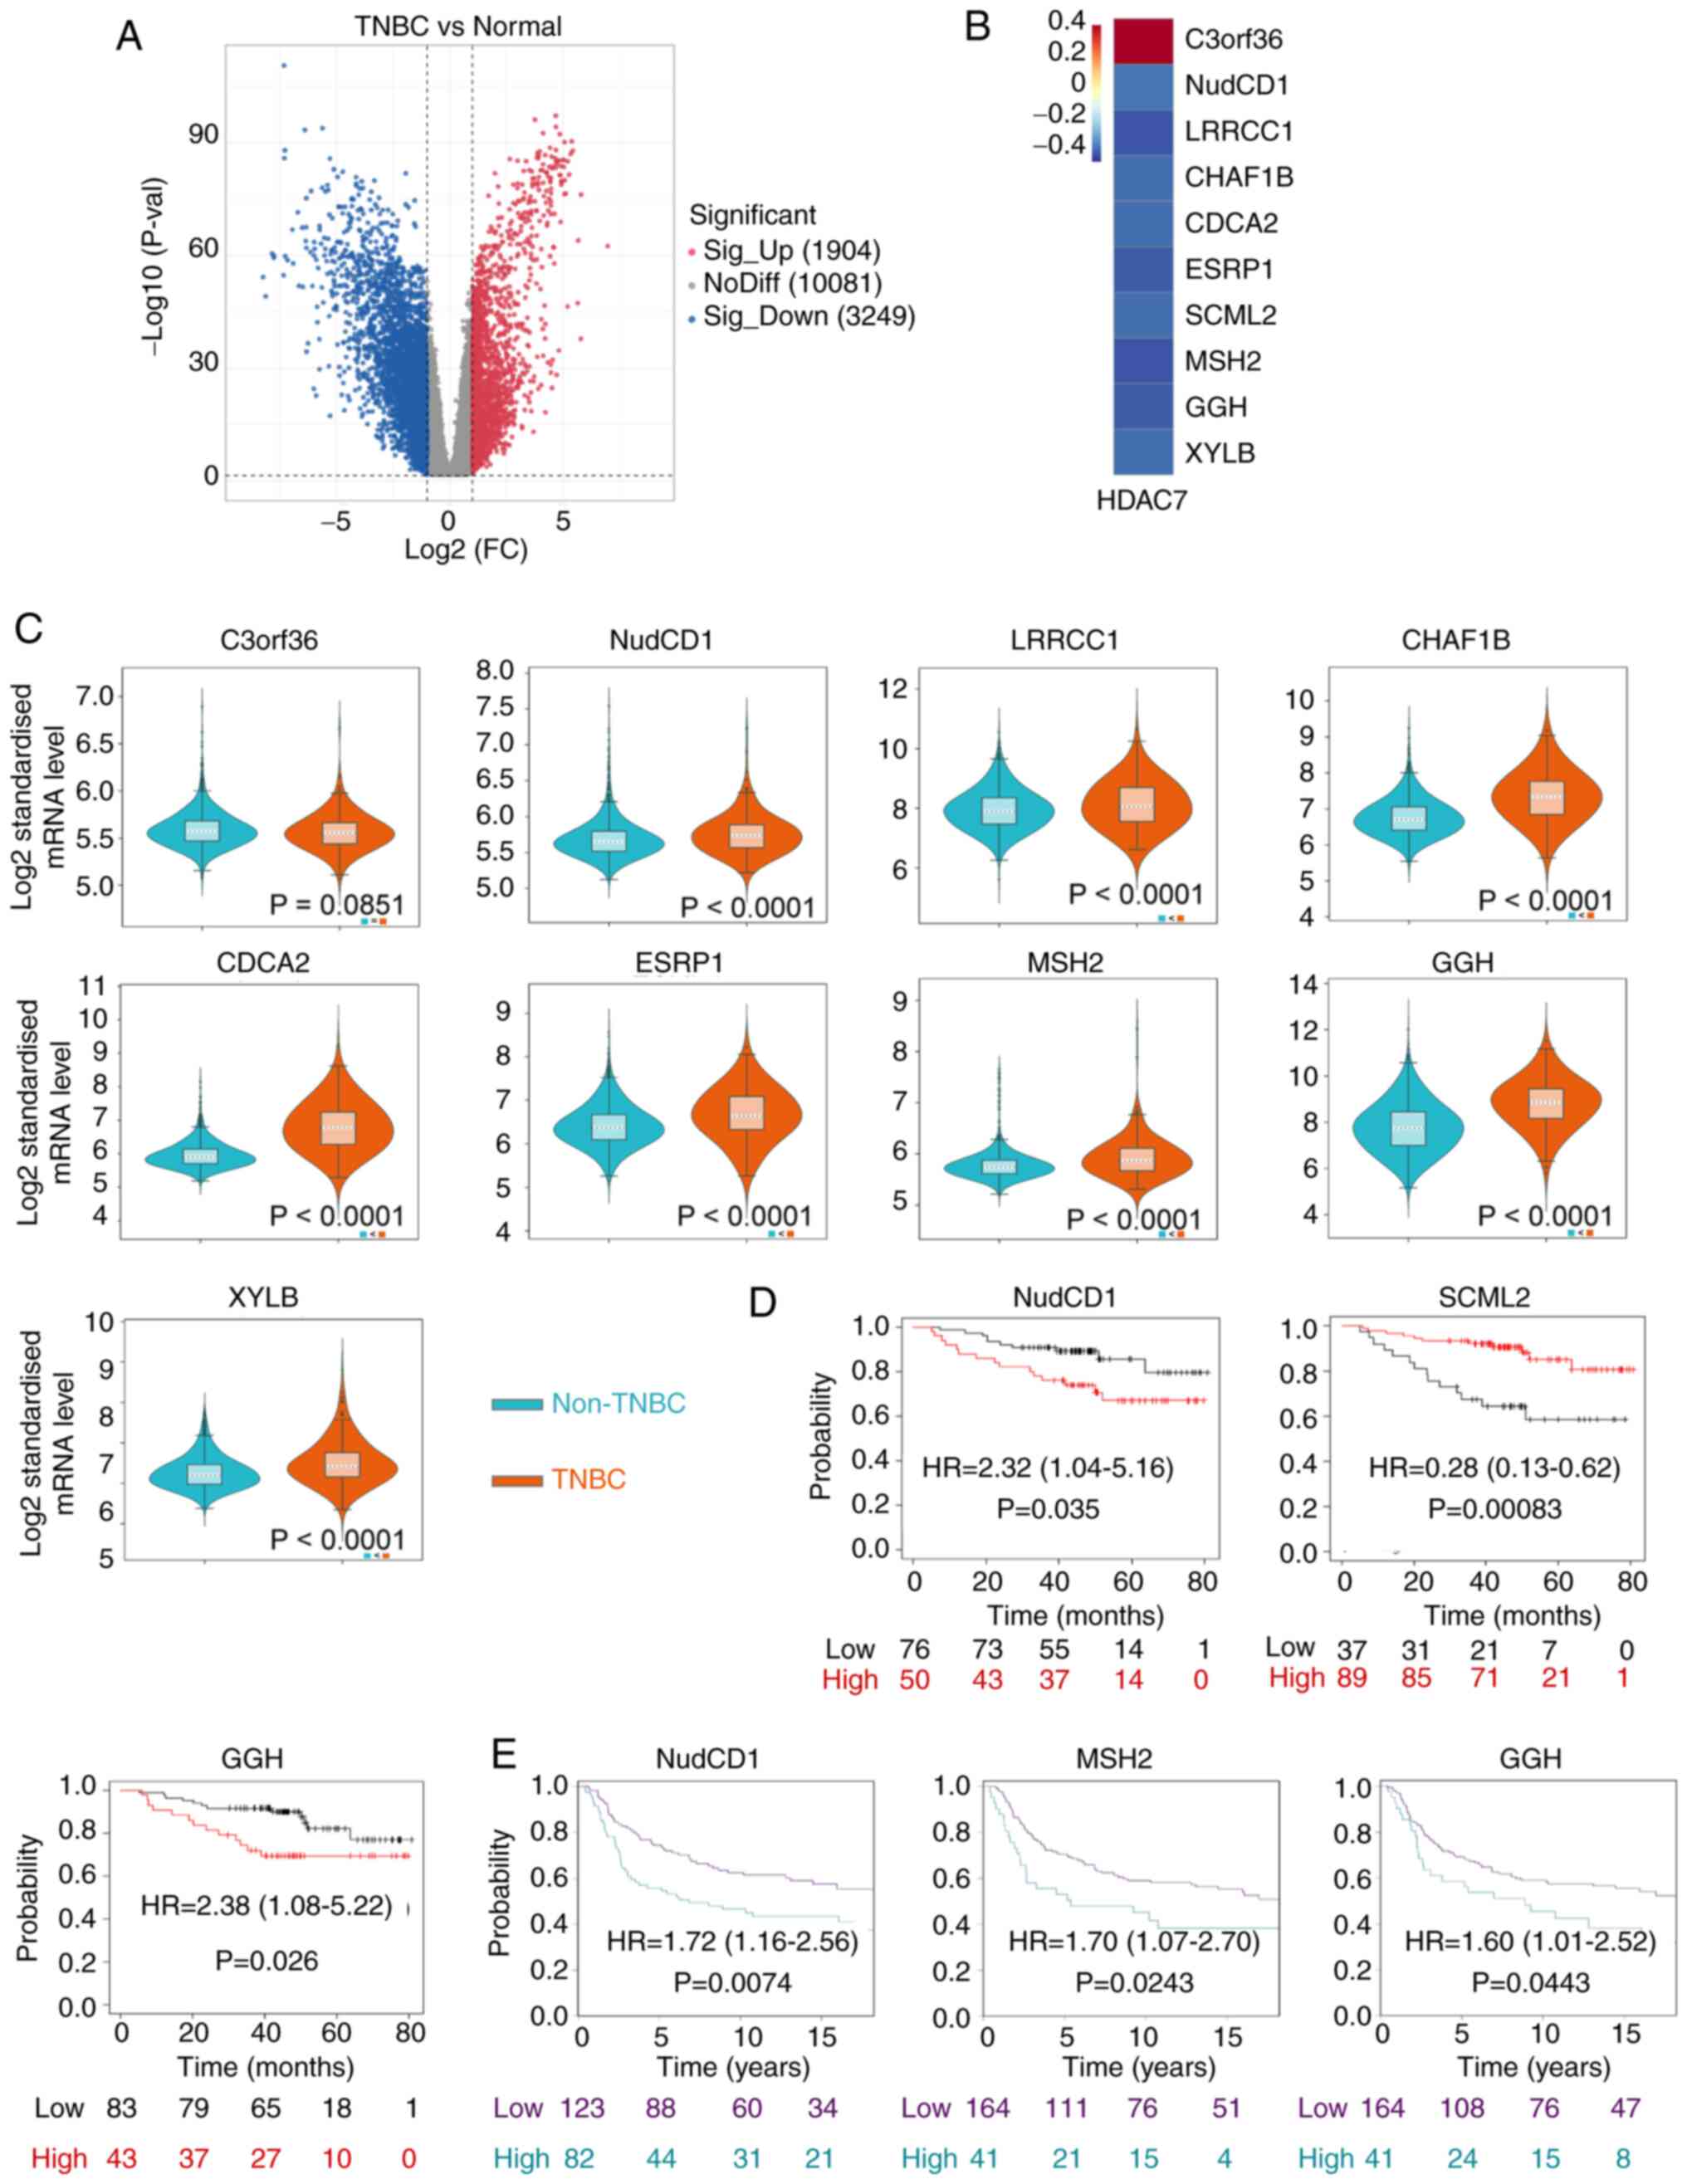
Therefore, the highly expressed genes in TNBC were screened based
on TCGA database (Fig. 4A). Genes
which were upregulated in TNBC, whose |log 2 (fold change)|>1
and P-value <0.05 were selected. Then co-expression analysis was
performed and 10 genes were identified to be significantly
associated to HDAC7, including C3orf36, NudCD1, LRRCC1, CHAF1B,
CDCA2, ESRP1, SCML2, MSH2, GGH and XYLB. Among them, C3orf36 was
positively associated with HDAC7, while the rest of the genes were
negatively associated with HDAC7 (P<0.05; Fig. 4B).
The expression levels of these 10 genes were
detected by METABRIC database. SCML2 was unavailable in the
database. C3orf36 showed a discrete expression pattern consistent
with that in TCGA and the other eight genes were all upregulated in
TNBC vs. non-TNBC tissue (P<0.0001), consistent with the results
from TCGA (Fig. 4C). Kaplan-Meier
survival curves indicated that high expression of NudCD1 (HR=2.32,
95%CI=1.04-5.16, P=0.035), GGH (HR=2.38, 95%CI=1.08-5.22, P=0.026)
in TCGA database (Fig. 4D) and
NudCD1 (HR=1.72, 95%CI=1.16-2.56, P=0.0074), MSH2 (HR=1.70,
95%CI=1.07-2.70, P=0.0243), GGH (HR=1.60, 95%CI=1.01-2.52,
P=0.0443) in METABRIC database (Fig.
4E) were significantly associated with poor OS of patients with
TNBC. On the other hand, high expression of SCML2 (HR=0.28;
95%CI=0.13-0.62; P=0.00083) was associated with improved OS of
patients with TNBC in TCGA database (Fig. 4D). Kaplan-Meier survival analysis
for other differentially expressed genes are in Fig. S2 and exhibited no statistical
significance.
HDAC7-NudCD1/GGH regulates TNBC cell
proliferation in vitro
As NudCD1 and GGH were both prognostic factors in
two datasets, the expression and functions of HDAC7-NudCD1/GGH on
BRCA cell lines were further verified. RT-qPCR was performed in
normal BRCA cell line MCF-10A, luminal BRCA cell lines MCF-7 and
T47D and TNBC cell lines MDA-MB-231, MDA-MB-468, MDA-MB-149,
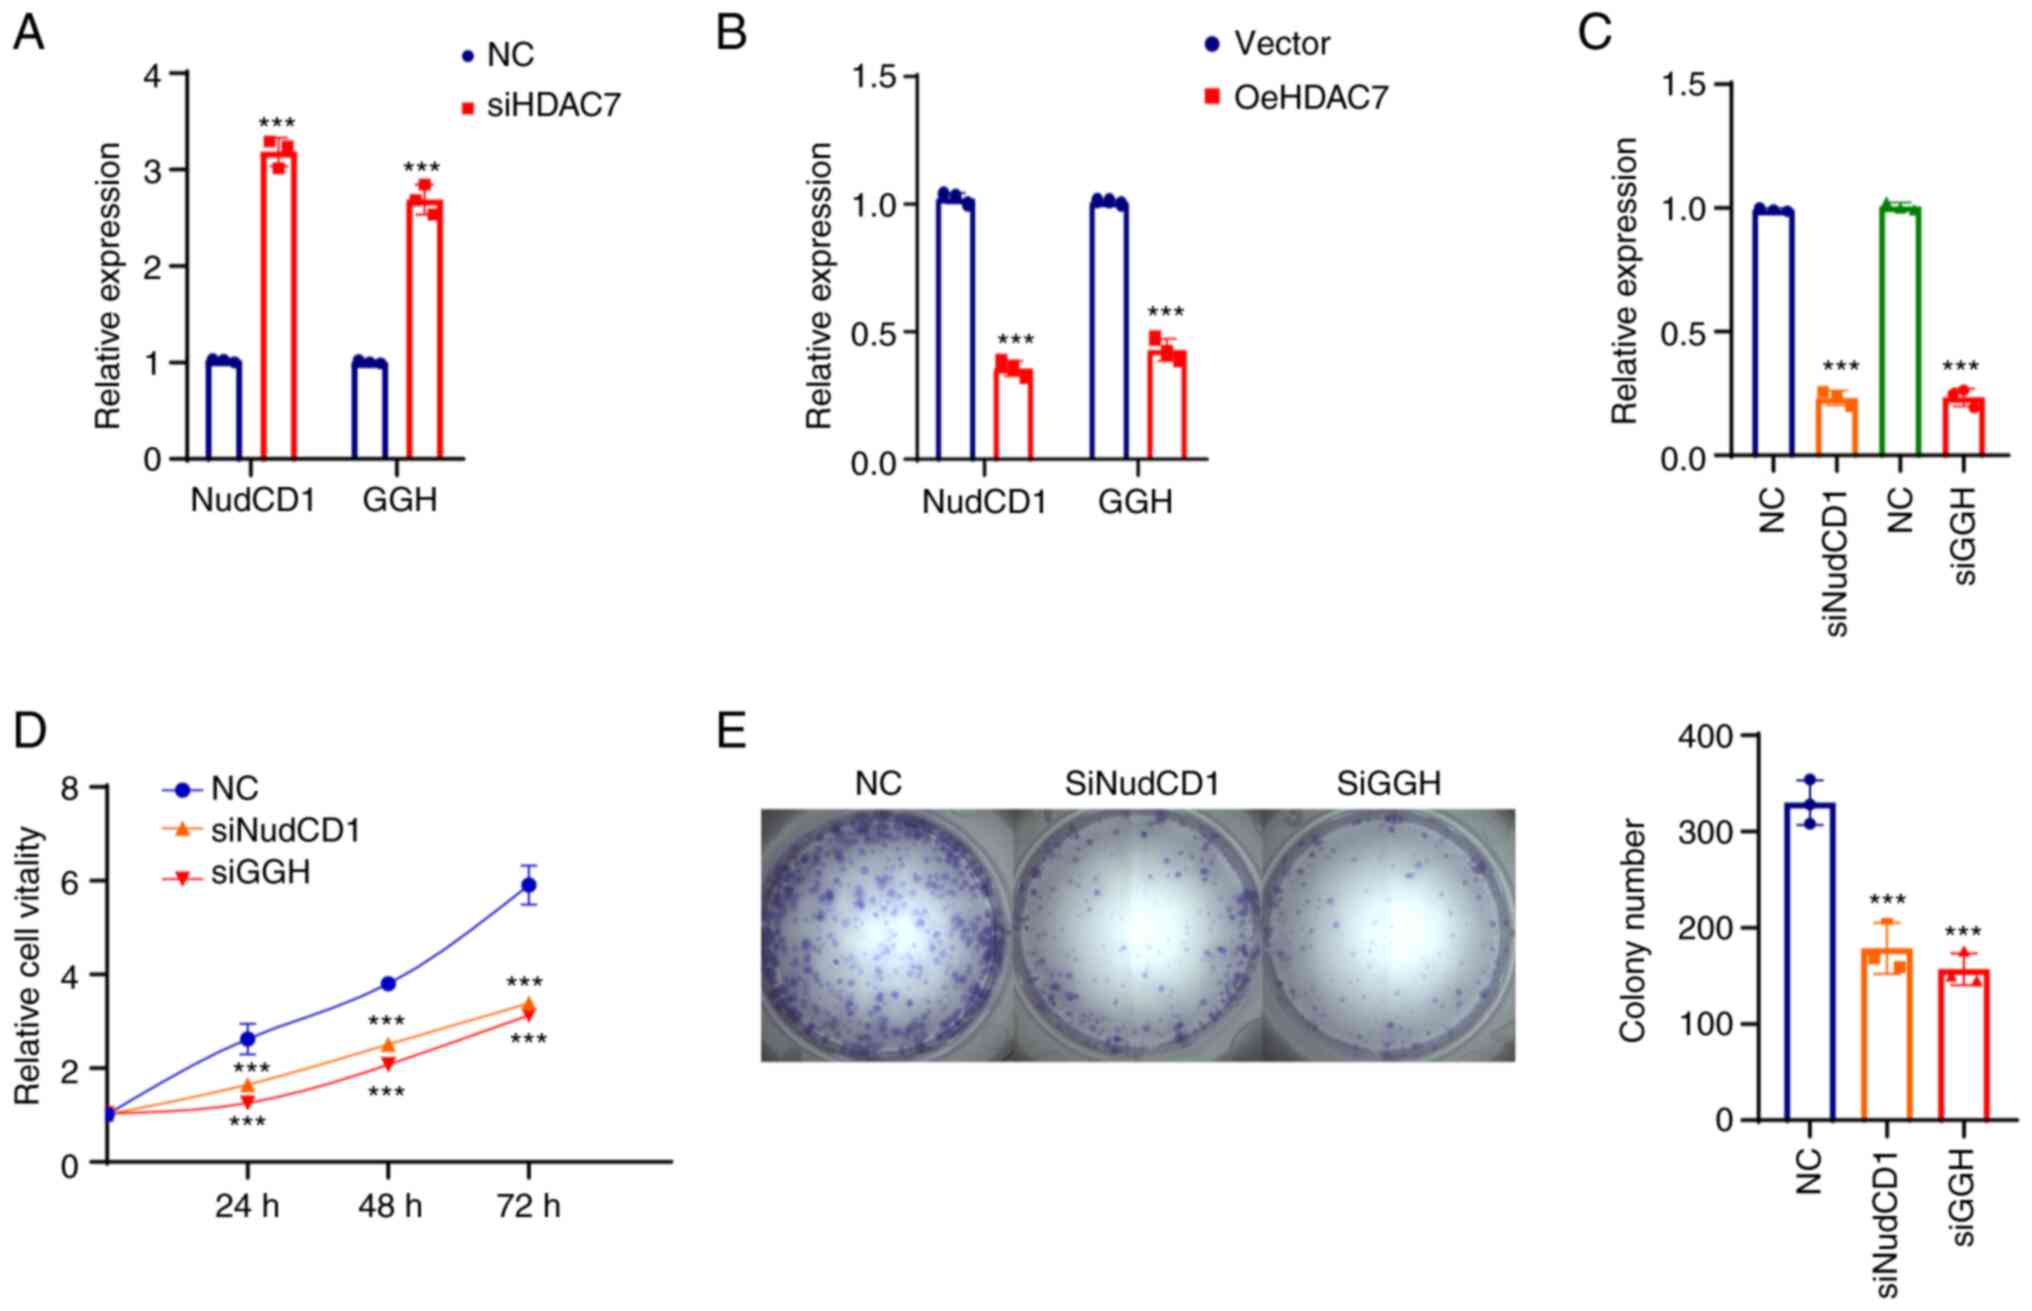
MDA-MB-159 and BT-549. The results showed that HDAC7 mRNA level was
upregulated in luminal cell lines (MCF-7 and T47D) and
significantly downregulated in TNBC cell lines (MDA-MB-231,
MDA-MB-468, SUM-149, SUM-159 and BT-549), while NudCD1 and GGH mRNA
expression were slightly changed in luminal cell lines but
significantly upregulated in TNBC cell lines (Fig. 5A).
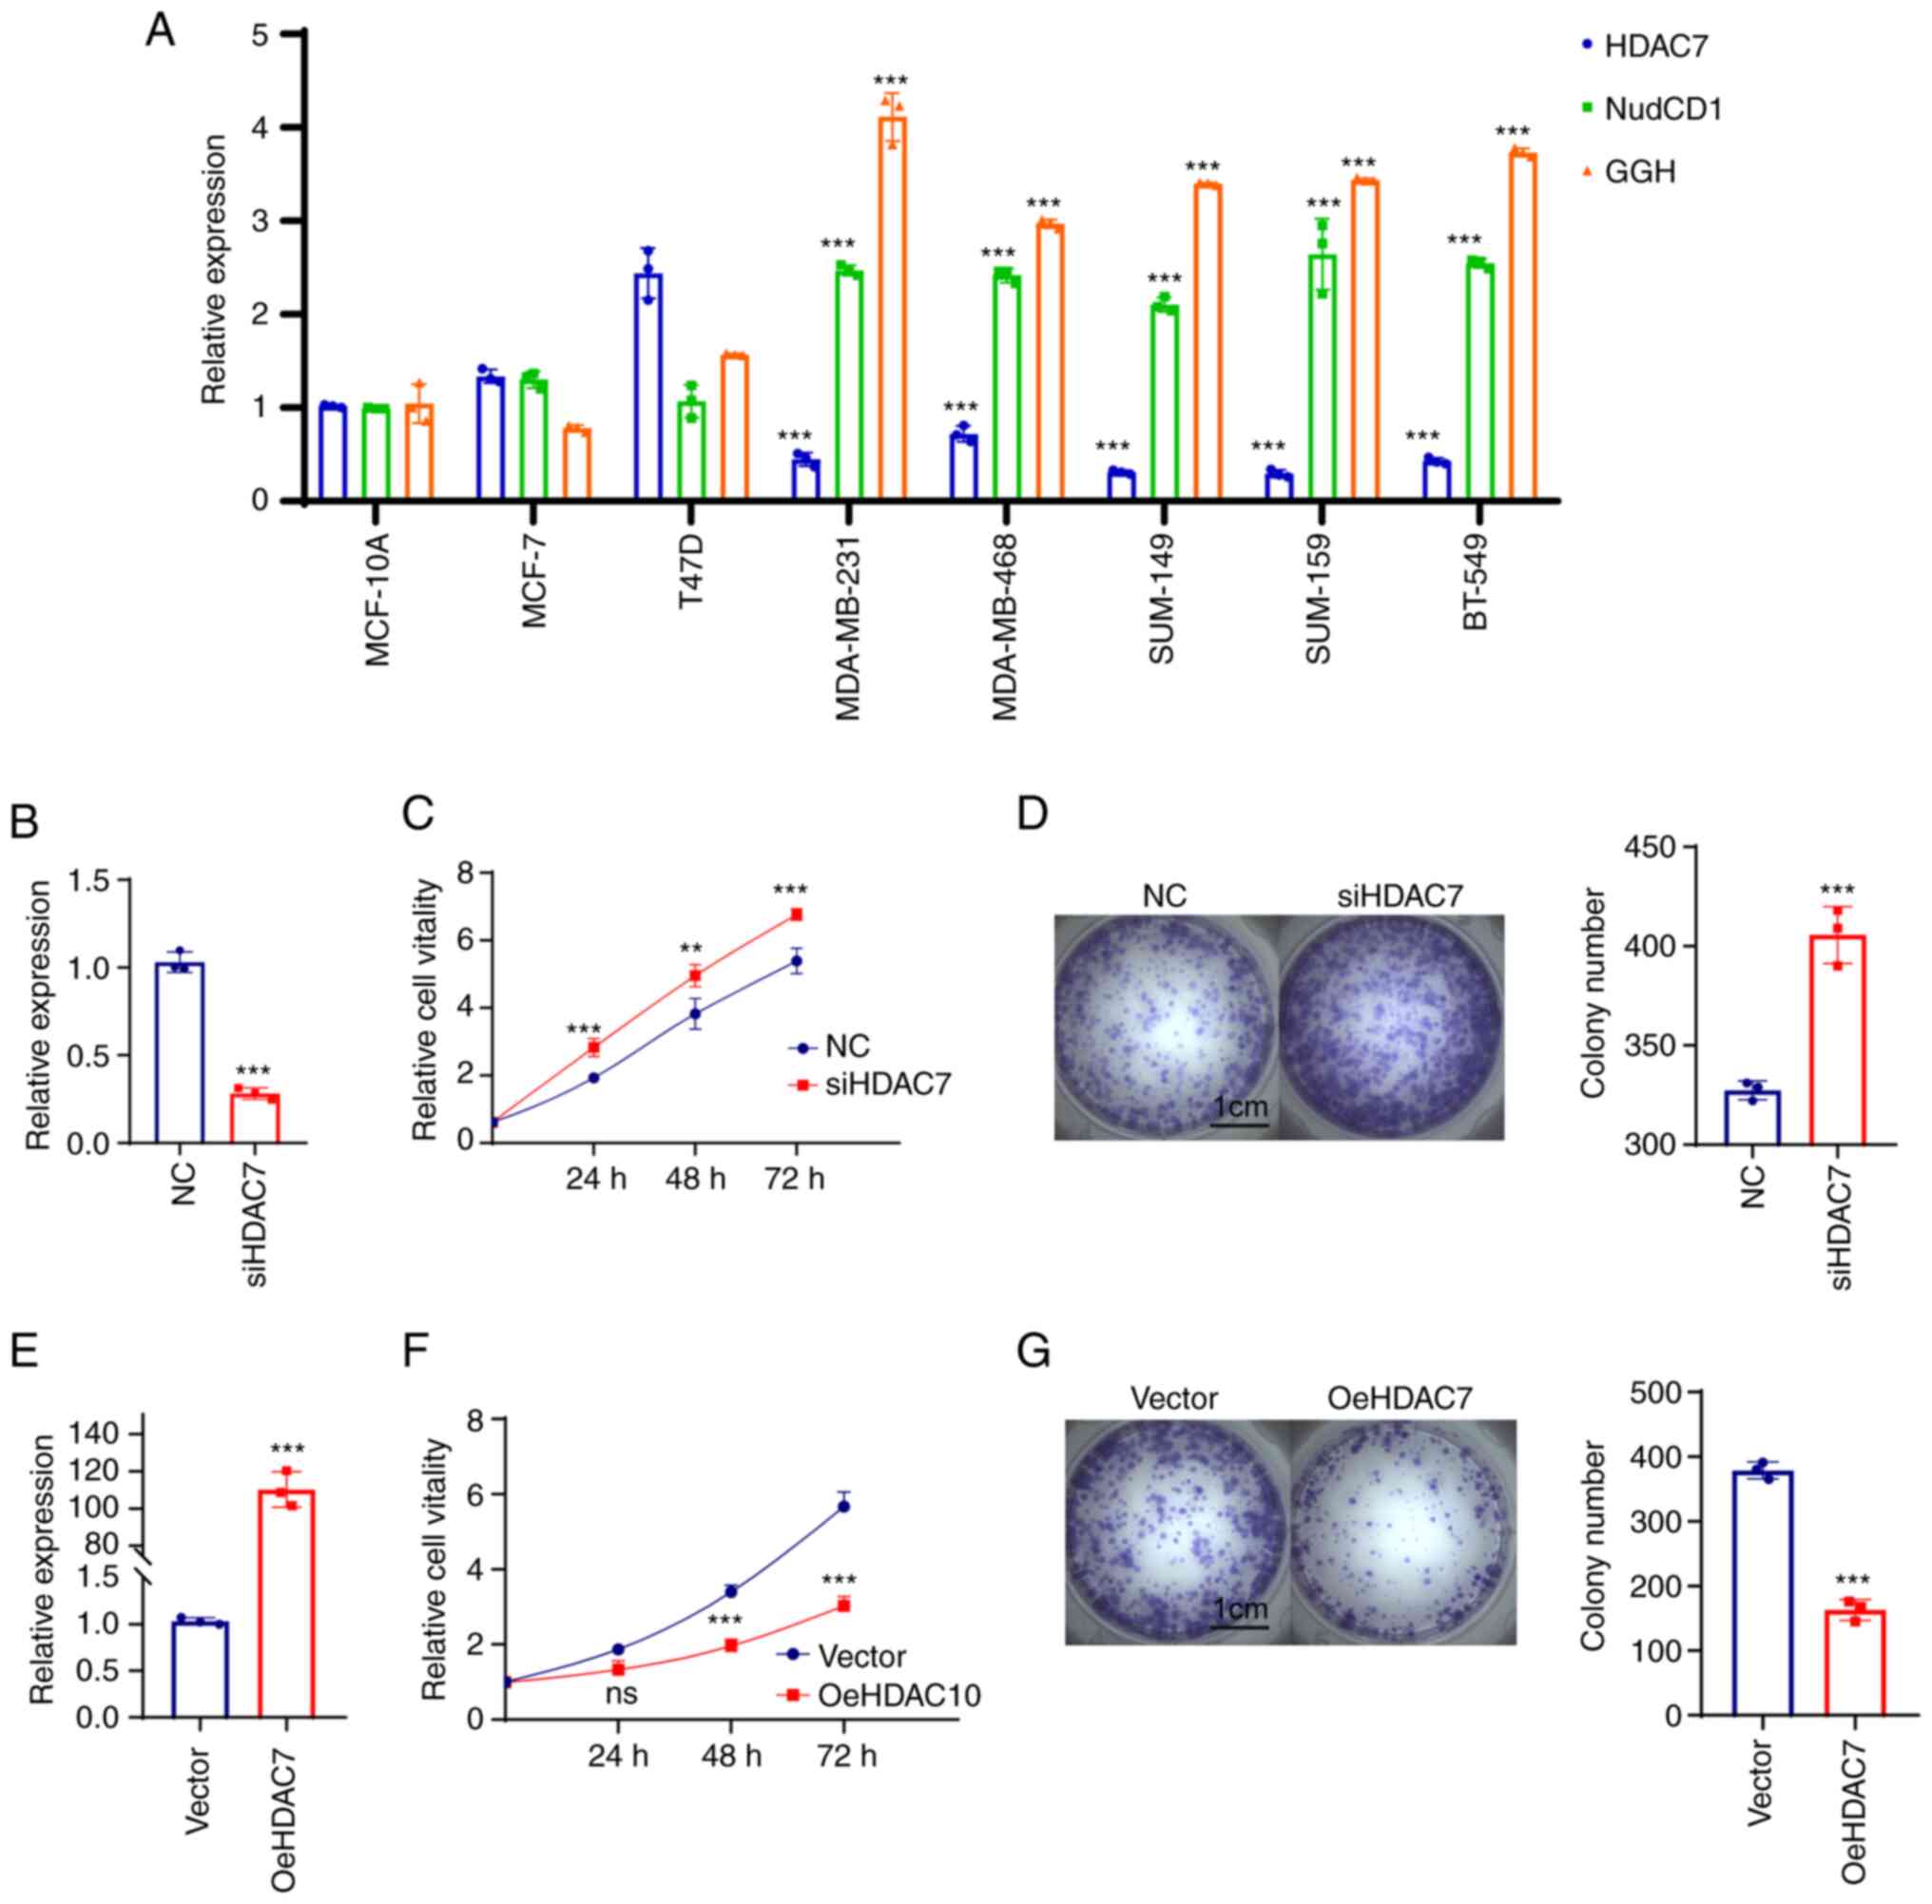 | Figure 5.HDAC7 regulated TNBC proliferation
in vitro. (A) Reverse transcription-quantitative PCR showed
the mRNA expression level of HDAC7, NUDCD1 and GGH in the normal
breast tissue cell line (MCF-10A), the luminal breast cancer cell
lines (MCF-7, T47D) and the TNBC cell lines (MDA-MB-231,
MDA-MB-468, SUM-149, SUM-159 and BT-549). (B) Quantitative PCR
validation of the siRNA efficiency of HDAC7 in MDA-MB-468 cell
line. (C) MTT cell growth curve showed the proliferation capacity
after si-HDAC7 in MDA-MB-468 cells. (D) Colony formation assay
showed the colony formation capacity after siHDAC7 in MDA-MB-468
cells, statistical graph on the right. (E) Quantitative PCR showed
the overexpression efficiency of HDAC7 in SUN-149 cell line. (F)
MTT cell growth curve showed the proliferation capacity after
oe-HDAC7 in SUM-149 cells. (G) The colony formation assay showed
the clone formation ability after oe-HDAC7 in SUM-149 cells,
statistical graph on the right. **P<0.01, ***P<0.005. All
experiments were repeated three times independently and the results
of the statistical graphs were a summary of the three independent
results. HDACs, histone deacetylases; TNBC, triple-negative breast
cancer; si, small interfering; oe, overexpression; NC, negative
control. |
Due to the low expression of HDAC7 in TNBC cell
lines, cell proliferation was observed in MDA-MB-468 cells which
displayed relatively high level of HDAC7 in triple negative breast
cancer cell lines following HDAC7 knockdown (Fig. 5B). The results from MTT (Fig. 5C) and colony formation assays
(Fig. 5D) showed that silencing of
HDAC7 significantly enhanced MDA-MB-468 cell proliferation,
suggesting that HDAC7 might play a inhibitory role in TNBC cell
growth. The SUM-149 cell line with relatively lower expression of
HDAC7 was selected for HDAC7 overexpression experiments. As shown
in Fig. 5E, the mRNA level of
HDAC7 in the overexpression group was ~100 times higher than that
in the negative control group (P<0.05), testifying the
overexpression efficiency of HDAC7. As expected, overexpression of
HDAC7 inhibited the proliferation of SUN-149 cells (Fig. 5F). Colony formation assay showed
that the number of clones in HDAC7 overexpression group was
significantly reduced than that in NC group and the size of the
colonies was also significantly smaller than that in NC group
(Fig. 5G).
Knockdown of HDAC7 increased mRNA expression of
NudCD1 and GGH in MDA-MB-468 cells (Fig. 6A) and SUM-149 cells (Fig. 6B), confirming that NudCD1 and GGH
were downstream targets of HDAC7. The function of NudCD1 and GGH
were further evaluated after NudCD1 and GGH were knocked down in
MDA-MB-468 cells and the interference efficacy is shown in Fig. 6C. The proliferation curve showed
that knockdown of NudCD1 and GGH inhibited the growth rate
(Fig. 6D) and colony formation
ability (Fig. 6E) of MDA-MB-468
cells.
Association between prognostic
HDAC7-NudCD1/GGH and immune infiltration in TNBC
Immune infiltration has been reported to be
associated with TNBC progression and prognosis (42). Since HDAC7, NudCD1 and GGH was
screened out to be the prognostic genes for TNBC, the association
between immune infiltration and the expression of HDAC7, NudCD1 and
GGH was analyzed by the TIMER database (http://timer.cistrome.org/). Then, six immune cell
types including CD4+ T cells, CD8+ T cells, NK T cells, γδ T cells,
NK cells and macrophages that have been recognized to possess
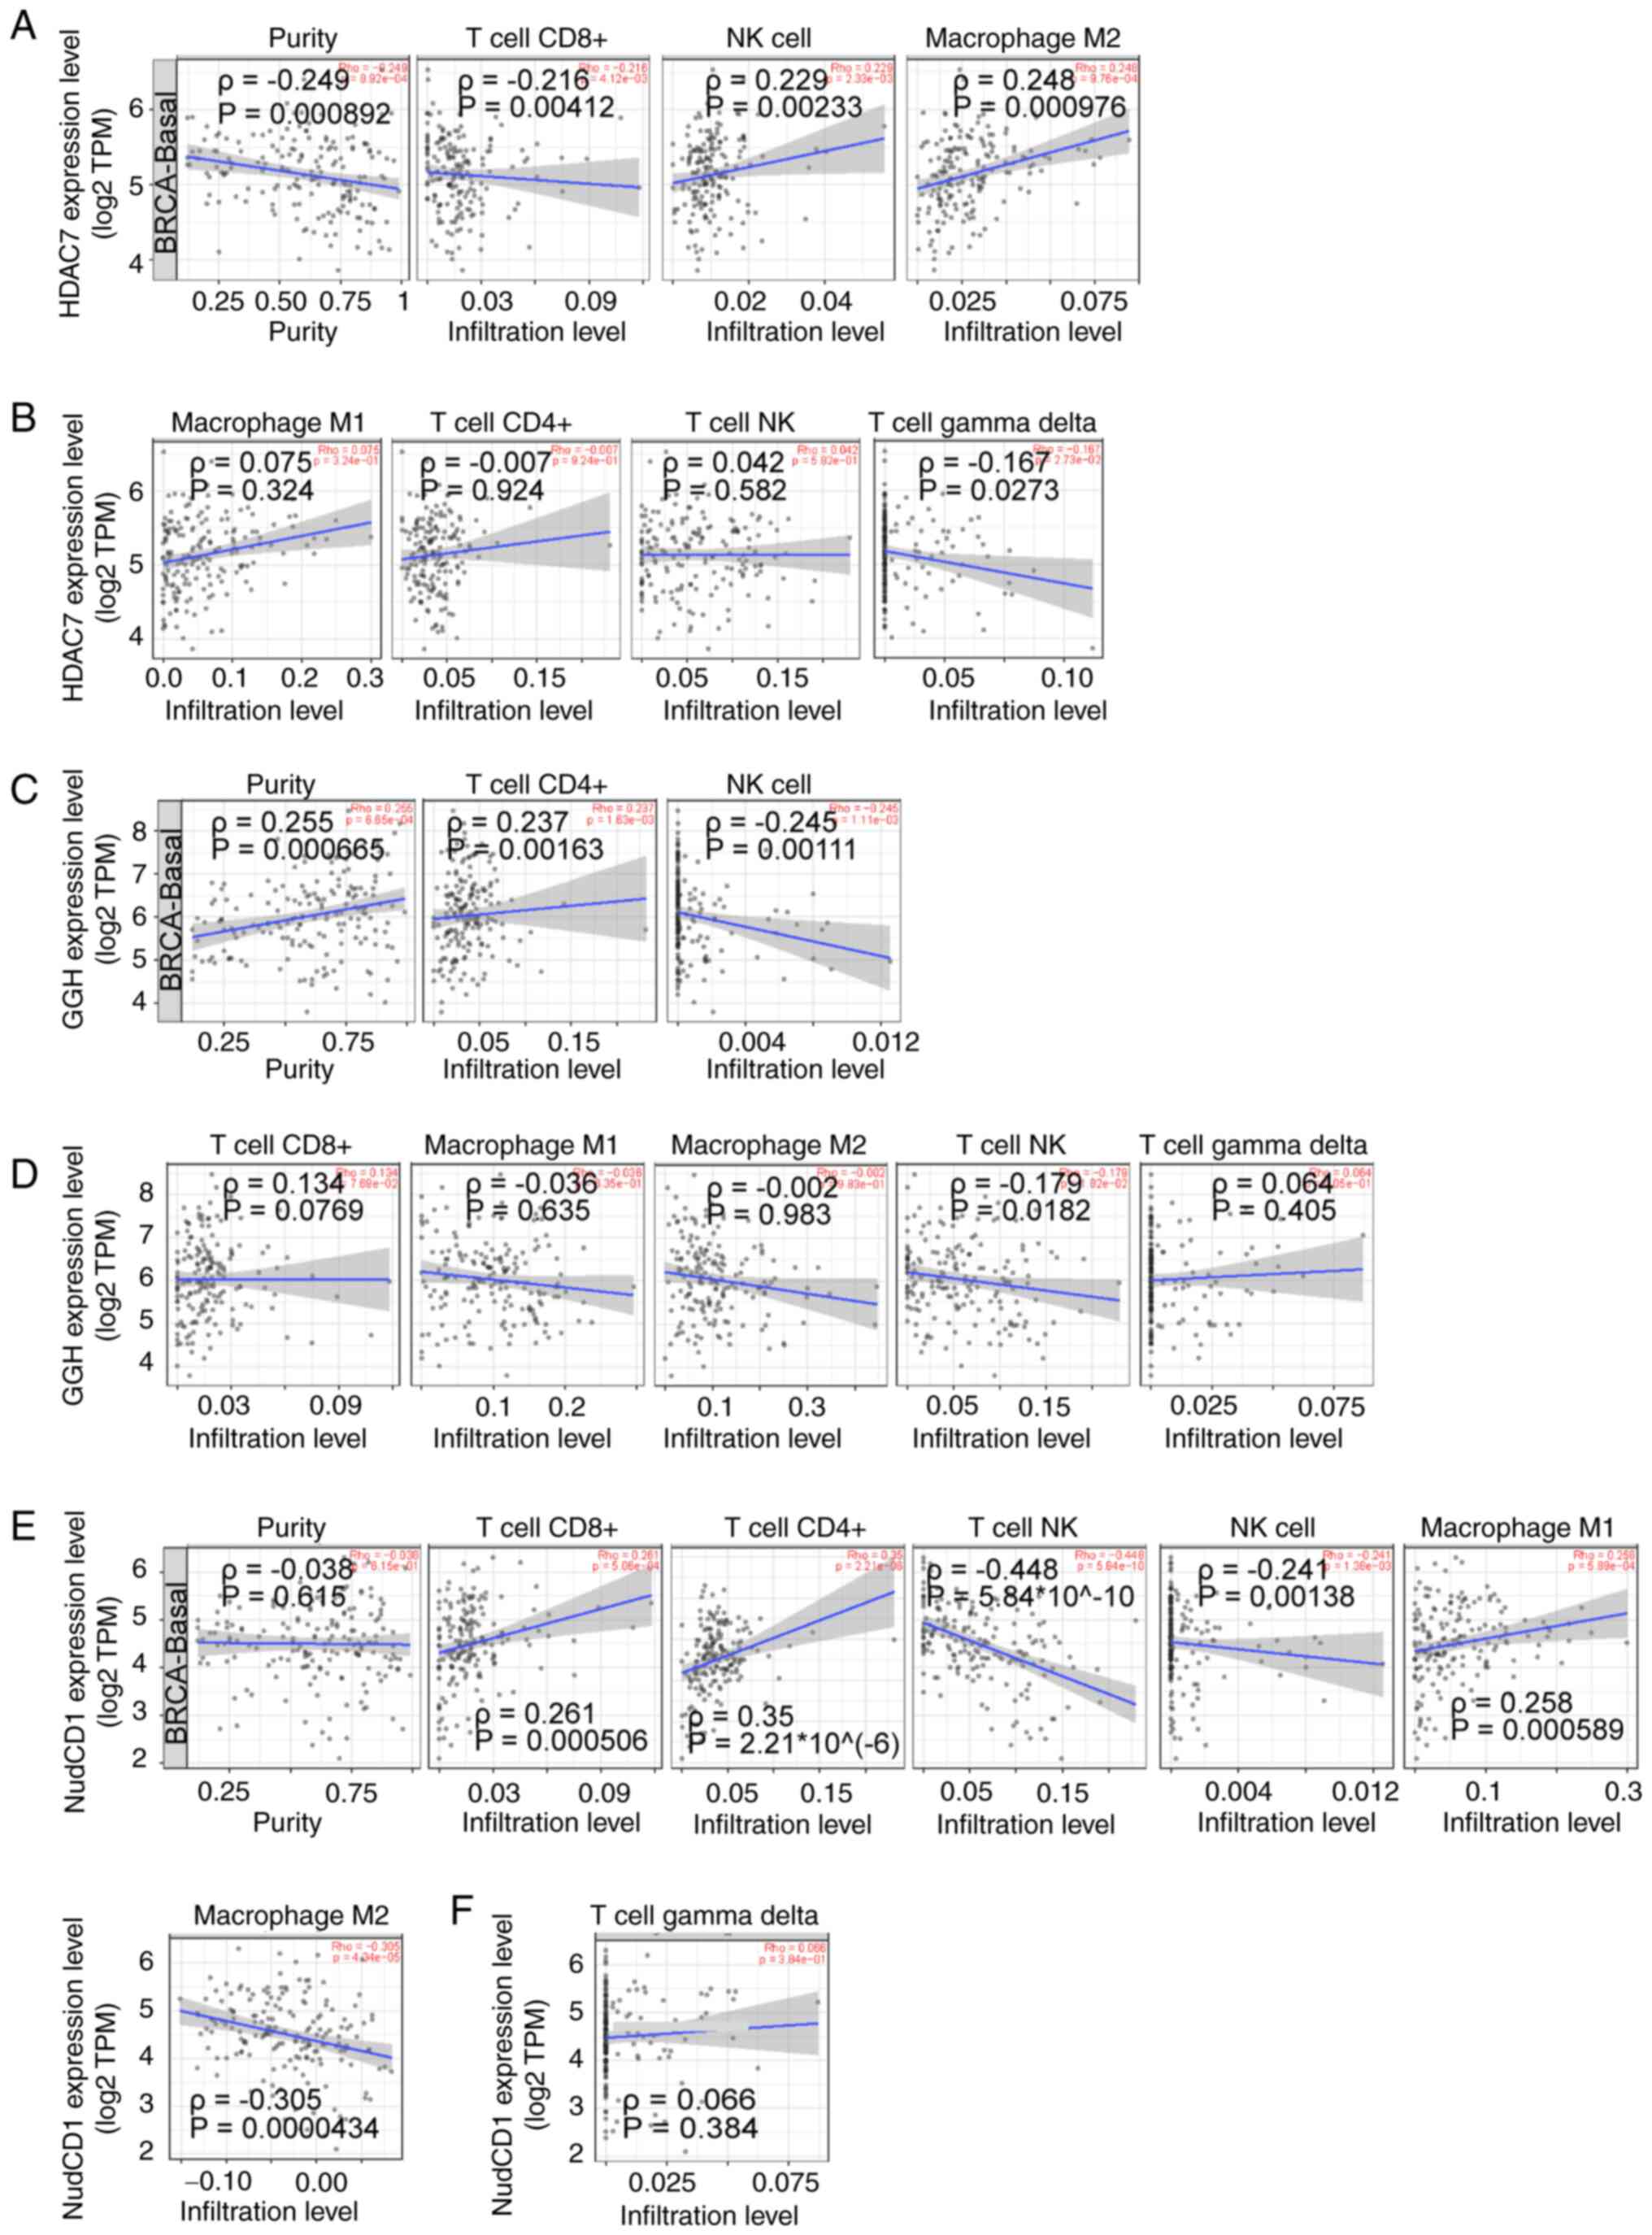
anti-cancer activities were focused on. Immune correlation analysis
showed that CD8+ T cell infiltration was negatively associated with
HDAC7 (ρ=−0.216), while NK cells (ρ=0.229) and M2 macrophages
(ρ=0.248) were positively associated to HDAC7 (P<0.05; Fig. 7A). No significant correlations
between M1 macrophages, CD4+ T cells, NK T cells, γδ T cells and
HDAC7 (|ρ|<0.2) were observed (Fig.
7B).
CD4+ T cell infiltration was positively associated
with GGH (ρ=0.237) and NK cells were negatively associated with GGH
(ρ=−0.245; P<0.05; Fig. 7C). No
significant correlation between M1 macrophages, M2 macrophages,
CD8+ T cells, NKT cells, γδ T cells and GGH expression (|R|<0.2)
were observed (Fig. 6D). At the
same time, CD8+ T cells (ρ=0.261), CD4+ T cells (ρ=0.35) and M1
macrophages (ρ=0.258) were positively associated to NudCD1
(P<0.05). NKT cells (ρ=−0.448), NK cells (ρ=−0.241) and M2
macrophages (ρ=−0.305) were negatively associated to NudCD1
(P<0.05) (Fig. 7E). No
significant correlation between γδ T cells and NudCD1 (|ρ|<0.2)
was observed (Fig. 7F).
Altogether, these results showed that NK cell infiltration was
positively associated with HDAC7 and negatively associated with
NudCD1 and GGH expression, suggesting that the anti-tumor effects
of HDAC7-NUDCD1/GGH axis might be partially associated with the
infiltration of NK cells.
Discussion
The current study was focused on identifying
prognostic HDACs in TNBC and investigating possible therapeutic
molecules in the downstream. By analyzing the correlation between
the expression of HDAC1-11 and overall survival of patients with
TNBC via the TCGA and METABRIC databases, HDAC7, a class II HDAC,
was discovered to be significantly downregulated in TNBC samples
and positively associated with OS of patients with TNBC. These
results indicated that HDAC7 might be a tumor suppressor in TNBC.
However, previous studies have revealed controversial functions of
HDAC7 in cancer progression. HDAC7 has been previously reported to
promote tumor progression in lung cancer via inhibiting STAT3
activation and upregulating FGF18 (43,44).
HDAC7 has been reported to be regulated by ZNF326, activates Wnt
pathway and promotes malignant phenotypes of glioblastoma (45). At the same time, HDAC7 has been
revealed to deacetylate AGO2 and inhibit the biogenesis of miR-19b
human alveolar adenocarcinoma basal epithelial cells and cervical
cancer cells, hence inhibiting cancer development (46). A previous study showed that absence
of HDAC7 can induce TET2 expression, promote DNA
5-hydroxymethelation and chromatin de-condensation in B cell
lymphocytes, hence leading to B cell-based hematological
malignancies (47). In pro-B acute
lymphoblastic leukemia and Burkitt lymphoma, HDAC7 has been shown
to be unexpressed and the re-expression of HDAC7 in animal models
has a potent anti-tumor effect (48). HDAC7 has been reported to
epigenetically inhibit the angiogenesis suppressor gene AKAP12 and
reduce the formation of tube-like structures (49). It has been also documented that
HDAC7 can maintain cancer stem cells and contribute to tumor
progression in BRCA and ovarian tumors (50–52).
All these findings indicate the comprehensive and complex effects
of HDAC7 in cancers. In TNBC, Uzelac et al (53) found that HDAC7 expression is lower
in TNBC samples compared with samples of ER+/PR+/HER2-tumors and
the high expression of HDAC7 represented poor survival in patients
with TNBC (HR=9.287; P=0.033). This finding is different from the
results of the present study, possibly due to the difference in the
number of patients and the heterogeneity between patients. In the
present study, a total of 123 patients with TNBC and 363 patients
with TNBC were respectively covered in TCGA and METABIRC database,
while the number of patients with TNBC in Uzelac et al
(53) is only 61. For further
validation, a larger number of cases are required. Therefore, the
role of HDAC7 in TNBC has yet to be fully elucidated. In further
analysis of the TCGA database, it was found that HDAC7 was
associated with proliferation-related pathways including the
PI3K-AKT pathway and the Ras signaling pathway. Meanwhile, the
cytokine-cytokine linkage pathway was also associated with HDAC7,
indicating that HDAC7 might regulate the progression of TNBC by
mediating these growth and immune-related pathways, which needed
further experimental validation.
A novel finding of the present study was that NudCD1
and GGH were identified as the target genes of HDAC7. NudCD1 and
GGH were negatively regulated by HDAC7 and associated with poor
prognosis in TNBC. NudCD1 has been shown to drive the
proliferation, migration and invasion of lung cancer and colorectal
cancer cells (54,55). GGH has also been reported to be
associated with poor prognosis and unfavorable clinical outcomes in
invasive patients with BRCA (56).
Elevated GGH expression is associated with poor prognosis in
uterine corpus endometrial carcinoma and advanced gastric cancer
(57,58). Nonetheless, the roles of NudCD1 and
GGH in TNBC remain elusive. The present study found that silencing
of HDAC7 upregulated NudCD1 and GGH expression in TNBC cell lines,
indicating that NudCD1 and GGH might be negatively regulated by
HDAC7. Furthermore, knockdown of HDAC7 potentiated the
proliferation while knockdown of NudCD1 or GGH inhibited the
proliferation of TNBC cells in vitro. The present study
showed that decrease of HDAC7 might promote the proliferation of
TNBC cells by activating NudCD1/GGH axis and indicated that
inhibition of NudCD1/GGH might axis be a possible therapeutic
therapy for TNBC.
The immune microenvironment is widely considered to
have a vital role in the tumor progression. TNBC is reported to be
an immune ‘hot’ subtype of BRCA with high immune cell infiltration,
for which immunotherapy may be a viable treatment strategy
(59). Hence, the immune
regulatory roles of HDAC7-NudCD1/GGH axis was explored via
analyzing the correlation between prognostic factors and immune
infiltration. NK cells are one of the main effector immune cells
that play an anti-cancer role. Studies have supported that low
infiltration of NK cells in tumor tissues is associated with poor
outcome (60,61). However, therapy based on infused NK
cells has been mainly applied to hematologic malignancies, so far
with limited therapeutic effect in patients with solid tumor
patients (62,63). The present study showed that
HDAC7-NudCD1/GGH axis was associated with the density of NK cells,
which indicated that HDAC7 might exert its anti-tumor roles
partially by regulating NK cell infiltration through blocking the
NudCD1/GGH axis. Nevertheless, this finding still needs further
validation. In brief, the present study revealed a novel role of
the HDAC7-NudCD1/GGH axis in TNBC.
Supplementary Material
Supporting Data
Acknowledgements
Not applicable.
Funding
The present study was funded by Natural Science Foundation of
Guangdong Province (grant no. 2022A1515012166) and Natural Science
Foundation of China (grant no. 82003176).
Availability of data and materials
The datasets used and/or analyzed during the current
study are available from the corresponding author on reasonable
request.
Authors' contributions
YL, HL and MZ conceived the idea and designed the
present study. NL collected the data from databases and performed
analyses. MZ, JL and JW conducted the in vitro experiments.
MZ organized and arranged all the figures. MZ. and YL wrote the
manuscript. All authors read and approved the final manuscript. MZ
and NL confirm the authenticity of all the raw data.
Ethics approval and consent to
participate
Not applicable.
Patient consent for publication
Not applicable.
Competing interests
The authors declare that they have no competing
interests.
References
|
1
|
Sung H, Ferlay J, Siegel RL, Laversanne M,
Soerjomataram I, Jemal A and Bray F: Global cancer statistics 2020:
GLOBOCAN estimates of incidence and mortality worldwide for 36
cancers in 185 countries. CA Cancer J Clin. 71:209–249. 2021.
View Article : Google Scholar : PubMed/NCBI
|
|
2
|
Loibl S, Poortmans P, Morrow M, Denkert C
and Curigliano G: Breast cancer. Lancet. 397:1750–1769. 2021.
View Article : Google Scholar : PubMed/NCBI
|
|
3
|
Barzaman K, Karami J, Zarei Z,
Hosseinzadeh A, Kazemi MH, Moradi-Kalbolandi S, Safari E and
Farahmand L: Breast cancer: Biology, biomarkers, and treatments.
Int Immunopharmacol. 84:1065352020. View Article : Google Scholar : PubMed/NCBI
|
|
4
|
Won KA and Spruck C: Triple-negative
breast cancer therapy: Current and future perspectives (Review).
Int J Oncol. 57:1245–1261. 2020. View Article : Google Scholar : PubMed/NCBI
|
|
5
|
Waks AG and Winer EP: Breast cancer
treatment: A review. JAMA. 321:288–300. 2019. View Article : Google Scholar : PubMed/NCBI
|
|
6
|
Portela A and Esteller M: Epigenetic
modifications and human disease. Nat Biotechnol. 28:1057–1068.
2010. View
Article : Google Scholar : PubMed/NCBI
|
|
7
|
Lu Y, Chan YT, Tan HY, Li S, Wang N and
Feng Y: Epigenetic regulation in human cancer: The potential role
of epi-drug in cancer therapy. Mol Cancer. 19:792020. View Article : Google Scholar : PubMed/NCBI
|
|
8
|
Garcia-Martinez L, Zhang Y, Nakata Y, Chan
HL and Morey L: Epigenetic mechanisms in breast cancer therapy and
resistance. Nat Commun. 12:17862021. View Article : Google Scholar : PubMed/NCBI
|
|
9
|
Shvedunova M and Akhtar A: Modulation of
cellular processes by histone and non-histone protein acetylation.
Nat Rev Mol Cell Biol. 23:329–349. 2022. View Article : Google Scholar : PubMed/NCBI
|
|
10
|
Sun L, Zhang H and Gao P: Metabolic
reprogramming and epigenetic modifications on the path to cancer.
Protein Cell. 13:877–919. 2022. View Article : Google Scholar : PubMed/NCBI
|
|
11
|
Witt O, Deubzer HE, Milde T and Oehme I:
HDAC family: What are the cancer relevant targets? Cancer Lett.
277:8–21. 2009. View Article : Google Scholar : PubMed/NCBI
|
|
12
|
Falkenberg KJ and Johnstone RW: Histone
deacetylases and their inhibitors in cancer, neurological diseases
and immune disorders. Nat Rev Drug Discov. 13:673–691. 2014.
View Article : Google Scholar : PubMed/NCBI
|
|
13
|
Ho TCS, Chan AHY and Ganesan A: Thirty
years of HDAC inhibitors: 2020 Insight and hindsight. J Med Chem.
63:12460–12484. 2020. View Article : Google Scholar : PubMed/NCBI
|
|
14
|
Hesham HM, Lasheen DS and Abouzid KAM:
Chimeric HDAC inhibitors: Comprehensive review on the HDAC-based
strategies developed to combat cancer. Med Res Rev. 38:2058–2109.
2018. View Article : Google Scholar : PubMed/NCBI
|
|
15
|
Brancolini C, Gagliano T and Minisini M:
HDACs and the epigenetic plasticity of cancer cells: Target the
complexity. Pharmacol Ther. 238:1081902022. View Article : Google Scholar : PubMed/NCBI
|
|
16
|
Ediriweera MK, Tennekoon KH and Samarakoon
SR: Emerging role of histone deacetylase inhibitors as
anti-breast-cancer agents. Drug Discov Today. 24:685–702. 2019.
View Article : Google Scholar : PubMed/NCBI
|
|
17
|
Dowling CM, Hollinshead KER, Di Grande A,
Pritchard J, Zhang H, Dillon ET, Haley K, Papadopoulos E, Mehta AK,
Bleach R, et al: Multiple screening approaches reveal HDAC6 as a
novel regulator of glycolytic metabolism in triple-negative breast
cancer. Sci Adv. 7:eabc48972021. View Article : Google Scholar : PubMed/NCBI
|
|
18
|
Oba T, Ono M, Matoba H, Uehara T, Hasegawa
Y and Ito KI: HDAC6 inhibition enhances the anti-tumor effect of
eribulin through tubulin acetylation in triple-negative breast
cancer cells. Breast Cancer Res Treat. 186:37–51. 2021. View Article : Google Scholar : PubMed/NCBI
|
|
19
|
Wang ZT, Chen ZJ, Jiang GM, Wu YM, Liu T,
Yi YM, Zeng J, Du J and Wang HS: Histone deacetylase inhibitors
suppress mutant p53 transcription via HDAC8/YY1 signals in triple
negative breast cancer cells. Cell Signal. 28:506–515. 2016.
View Article : Google Scholar : PubMed/NCBI
|
|
20
|
Wu S, Luo Z, Yu PJ, Xie H and He YW:
Suberoylanilide hydroxamic acid (SAHA) promotes the epithelial
mesenchymal transition of triple negative breast cancer cells via
HDAC8/FOXA1 signals. Biol Chem. 397:75–83. 2016. View Article : Google Scholar : PubMed/NCBI
|
|
21
|
Palmieri D, Lockman PR, Thomas FC, Hua E,
Herring J, Hargrave E, Johnson M, Flores N, Qian Y, Vega-Valle E,
et al: Vorinostat inhibits brain metastatic colonization in a model
of triple-negative breast cancer and induces DNA double-strand
breaks. Clin Cancer Res. 15:6148–6157. 2009. View Article : Google Scholar : PubMed/NCBI
|
|
22
|
Tate CR, Rhodes LV, Segar HC, Driver JL,
Pounder FN, Burow ME and Collins-Burow BM: Targeting
triple-negative breast cancer cells with the histone deacetylase
inhibitor panobinostat. Breast Cancer Res. 14:R792012. View Article : Google Scholar : PubMed/NCBI
|
|
23
|
Rhodes LV, Tate CR, Segar HC, Burks HE,
Phamduy TB, Hoang V, Elliott S, Gilliam D, Pounder FN, Anbalagan M,
et al: Suppression of triple-negative breast cancer metastasis by
pan-DAC inhibitor panobinostat via inhibition of ZEB family of EMT
master regulators. Breast Cancer Res Treat. 145:593–604. 2014.
View Article : Google Scholar : PubMed/NCBI
|
|
24
|
Zhang K, Liu Z, Yao Y, Qiu Y, Li F, Chen
D, Hamilton DJ, Li Z and Jiang S: Structure-based design of a
selective class I histone deacetylase (HDAC) near-infrared (NIR)
probe for epigenetic regulation detection in triple-negative breast
cancer (TNBC). J Med Chem. 64:4020–4033. 2021. View Article : Google Scholar : PubMed/NCBI
|
|
25
|
Pinkerneil M, Hoffmann MJ, Deenen R,
Köhrer K, Arent T, Schulz WA and Niegisch G: Inhibition of class I
histone deacetylases 1 and 2 promotes urothelial carcinoma cell
death by various mechanisms. Mol Cancer Ther. 15:299–312. 2016.
View Article : Google Scholar : PubMed/NCBI
|
|
26
|
Sulaiman A, McGarry S, Lam KM, El-Sahli S,
Chambers J, Kaczmarek S, Li L, Addison C, Dimitroulakos J, Arnaout
A, et al: Co-inhibition of mTORC1, HDAC and ESR1α retards the
growth of triple-negative breast cancer and suppresses cancer stem
cells. Cell Death Dis. 9:8152018. View Article : Google Scholar : PubMed/NCBI
|
|
27
|
Ma W, Sun J, Xu J, Luo Z, Diao D, Zhang Z,
Oberly PJ, Minnigh MB, Xie W, Poloyac SM, et al: Sensitizing triple
negative breast cancer to tamoxifen chemotherapy via a
redox-responsive vorinostat-containing polymeric prodrug
nanocarrier. Theranostics. 10:2463–2478. 2020. View Article : Google Scholar : PubMed/NCBI
|
|
28
|
Torres-Adorno AM, Lee J, Kogawa T,
Ordentlich P, Tripathy D, Lim B and Ueno NT: Histone deacetylase
inhibitor enhances the efficacy of MEK inhibitor through
NOXA-mediated MCL1 degradation in triple-negative and inflammatory
breast cancer. Clin Cancer Res. 23:4780–4792. 2017. View Article : Google Scholar : PubMed/NCBI
|
|
29
|
Min A, Im SA, Kim DK, Song SH, Kim HJ, Lee
KH, Kim TY, Han SW, Oh DY, Kim TY, et al: Histone deacetylase
inhibitor, suberoylanilide hydroxamic acid (SAHA), enhances
anti-tumor effects of the poly (ADP-ribose) polymerase (PARP)
inhibitor olaparib in triple-negative breast cancer cells. Breast
Cancer Res. 17:332015. View Article : Google Scholar : PubMed/NCBI
|
|
30
|
Huang JP and Ling K: EZH2 and histone
deacetylase inhibitors induce apoptosis in triple negative breast
cancer cells by differentially increasing H3 Lys27
acetylation in the BIM gene promoter and enhancers. Oncol Lett.
14:5735–5742. 2017.PubMed/NCBI
|
|
31
|
Wiegmans AP, Yap PY, Ward A, Lim YC and
Khanna KK: Differences in expression of key DNA damage repair genes
after epigenetic-induced brcaness dictate synthetic lethality with
PARP1 inhibition. Mol Cancer Ther. 14:2321–2331. 2015. View Article : Google Scholar : PubMed/NCBI
|
|
32
|
Rao R, Balusu R, Fiskus W, Mudunuru U,
Venkannagari S, Chauhan L, Smith JE, Hembruff SL, Ha K, Atadja P
and Bhalla KN: Combination of pan-histone deacetylase inhibitor and
autophagy inhibitor exerts superior efficacy against
triple-negative human breast cancer cells. Mol Cancer Ther.
11:973–983. 2012. View Article : Google Scholar : PubMed/NCBI
|
|
33
|
Garmpis N, Damaskos C, Garmpi A,
Kalampokas E, Kalampokas T, Spartalis E, Daskalopoulou A, Valsami
S, Kontos M, Nonni A, et al: Histone deacetylases as new
therapeutic targets in triple-negative breast cancer: Progress and
promises. Cancer Genomics Proteomics. 14:299–313. 2017.PubMed/NCBI
|
|
34
|
Jiang Z, Li W, Hu X, Zhang Q, Sun T, Cui
S, Wang S, Ouyang Q, Yin Y, Geng C, et al: Tucidinostat plus
exemestane for postmenopausal patients with advanced, hormone
receptor-positive breast cancer (ACE): A randomised, double-blind,
placebo-controlled, phase 3 trial. Lancet Oncol. 20:806–815. 2019.
View Article : Google Scholar : PubMed/NCBI
|
|
35
|
Chiu HW, Yeh YL, Wang YC, Huang WJ, Ho SY,
Lin P and Wang YJ: Combination of the novel histone deacetylase
inhibitor YCW1 and radiation induces autophagic cell death through
the downregulation of BNIP3 in triple-negative breast cancer cells
in vitro and in an orthotopic mouse model. Mol Cancer. 15:462016.
View Article : Google Scholar : PubMed/NCBI
|
|
36
|
da Silva JL, Cardoso Nunes NC, Izetti P,
de Mesquita GG and de Melo AC: Triple negative breast cancer: A
thorough review of biomarkers. Crit Rev Oncol Hematol.
145:1028552020. View Article : Google Scholar : PubMed/NCBI
|
|
37
|
Ritchie ME, Phipson B, Wu D, Hu Y, Law CW,
Shi W and Smyth GK: limma powers differential expression analyses
for RNA-sequencing and microarray studies. Nucleic Acids Res.
43:e472015. View Article : Google Scholar : PubMed/NCBI
|
|
38
|
R Core Team. R, . A language and
environment for statistical computing. R Foundation for Statistical
Computing; Vienna, Austria: 2022, URL. http://www.R-project.org/
|
|
39
|
Kuemmerlen D, Echtermann T, Muentener C
and Sidler X: Agreement of benchmarking high antimicrobial usage
farms based on either animal treatment index or number of national
defined daily doses. Front Vet Sci. 7:6382020. View Article : Google Scholar : PubMed/NCBI
|
|
40
|
Li T, Fu J, Zeng Z, Cohen D, Li J, Chen Q,
Li B and Liu XS: TIMER2.0 for analysis of tumor-infiltrating immune
cells. Nucleic Acids Res. 48((W1)): W509–W514. 2020. View Article : Google Scholar : PubMed/NCBI
|
|
41
|
Nolan T, Hands RE and Bustin SA:
Quantification of mRNA using real-time RT-PCR. Nat Protoc.
1:1559–1582. 2006. View Article : Google Scholar : PubMed/NCBI
|
|
42
|
Keenan TE and Tolaney SM: Role of
immunotherapy in triple-negative breast cancer. J Natl Compr Canc
Netw. 18:479–489. 2020. View Article : Google Scholar : PubMed/NCBI
|
|
43
|
Guo K, Ma Z, Zhang Y, Han L, Shao C, Feng
Y, Gao F, Di S, Zhang Z, Zhang J, et al: HDAC7 promotes NSCLC
proliferation and metastasis via stabilization by deubiquitinase
USP10 and activation of β-catenin-FGF18 pathway. J Exp Clin Cancer
Res. 41:912022. View Article : Google Scholar : PubMed/NCBI
|
|
44
|
Lei Y, Liu L, Zhang S, Guo S, Li X, Wang
J, Su B, Fang Y, Chen X, Ke H and Tao W: Hdac7 promotes lung
tumorigenesis by inhibiting Stat3 activation. Mol Cancer.
16:1702017. View Article : Google Scholar : PubMed/NCBI
|
|
45
|
Yu X, Wang M, Wu J, Han Q and Zhang X:
ZNF326 promotes malignant phenotype of glioma by up-regulating
HDAC7 expression and activating Wnt pathway. J Exp Clin Cancer Res.
38:402019. View Article : Google Scholar : PubMed/NCBI
|
|
46
|
Zhang H, Wang Y, Dou J, Guo Y, He J, Li L,
Liu X, Chen R, Deng R, Huang J, et al: Acetylation of AGO2 promotes
cancer progression by increasing oncogenic miR-19b biogenesis.
Oncogene. 38:1410–1431. 2019. View Article : Google Scholar : PubMed/NCBI
|
|
47
|
Azagra A, Meler A, de Barrios O,
Tomás-Daza L, Collazo O, Monterde B, Obiols M, Rovirosa L,
Vila-Casadesús M, Cabrera-Pasadas M, et al: The HDAC7-TET2
epigenetic axis is essential during early B lymphocyte development.
Nucleic Acids Res. 50:8471–8490. 2022. View Article : Google Scholar : PubMed/NCBI
|
|
48
|
Barneda-Zahonero B, Collazo O, Azagra A,
Fernández-Duran I, Serra-Musach J, Islam AB, Vega-Garcia N,
Malatesta R, Camós M, Gómez A, et al: The transcriptional repressor
HDAC7 promotes apoptosis and c-Myc downregulation in particular
types of leukemia and lymphoma. Cell Death Dis. 6:e16352015.
View Article : Google Scholar : PubMed/NCBI
|
|
49
|
Turtoi A, Mottet D, Matheus N, Dumont B,
Peixoto P, Hennequiere V, Deroanne C, Colige A, De Pauw E,
Bellahcène A and Castronovo V: The angiogenesis suppressor gene
AKAP12 is under the epigenetic control of HDAC7 in endothelial
cells. Angiogenesis. 15:543–554. 2012. View Article : Google Scholar : PubMed/NCBI
|
|
50
|
Caslini C, Hong S, Ban YJ, Chen XS and
Ince TA: HDAC7 regulates histone 3 lysine 27 acetylation and
transcriptional activity at super-enhancer-associated genes in
breast cancer stem cells. Oncogene. 38:6599–6614. 2019. View Article : Google Scholar : PubMed/NCBI
|
|
51
|
Cutano V, Di Giorgio E, Minisini M, Picco
R, Dalla E and Brancolini C: HDAC7-mediated control of tumour
microenvironment maintains proliferative and stemness competence of
human mammary epithelial cells. Mol Oncol. 13:1651–1668. 2019.
View Article : Google Scholar : PubMed/NCBI
|
|
52
|
Witt AE, Lee CW, Lee TI, Azzam DJ, Wang B,
Caslini C, Petrocca F, Grosso J, Jones M, Cohick EB, et al:
Identification of a cancer stem cell-specific function for the
histone deacetylases, HDAC1 and HDAC7, in breast and ovarian
cancer. Oncogene. 36:1707–1720. 2017. View Article : Google Scholar : PubMed/NCBI
|
|
53
|
Uzelac B, Krivokuca A, Susnjar S,
Milovanovic Z and Supic G: Histone deacetylase 7 gene
overexpression is associated with poor prognosis of triple-negative
breast cancer patients. Genet Test Mol Biomarkers. 25:227–235.
2021. View Article : Google Scholar : PubMed/NCBI
|
|
54
|
Han B, Zhang YY, Xu K, Bai Y, Wan LH, Miao
SK, Zhang KX, Zhang HW, Liu Y and Zhou LM: NUDCD1 promotes
metastasis through inducing EMT and inhibiting apoptosis in
colorectal cancer. Am J Cancer Res. 8:810–823. 2018.PubMed/NCBI
|
|
55
|
He B, Xia S and Zhang Z: NudCD1 promotes
the proliferation and metastasis of non-small cell lung cancer
cells through the activation of IGF1R-ERK1/2. Pathobiology.
87:244–253. 2020. View Article : Google Scholar : PubMed/NCBI
|
|
56
|
Shubbar E, Helou K, Kovács A, Nemes S,
Hajizadeh S, Enerbäck C and Einbeigi Z: High levels of γ-glutamyl
hydrolase (GGH) are associated with poor prognosis and unfavorable
clinical outcomes in invasive breast cancer. BMC Cancer. 13:472013.
View Article : Google Scholar : PubMed/NCBI
|
|
57
|
Yu C, Qi H, Zhang Y, Zhao W and Wu G:
Elevated expression of gamma-glutamyl hydrolase is associated with
poor prognosis and altered immune signature in uterine corpus
endometrial carcinoma. Front Genet. 12:7641942022. View Article : Google Scholar : PubMed/NCBI
|
|
58
|
Maezawa Y, Sakamaki K, Oue N, Kimura Y,
Hashimoto I, Hara K, Kano K, Aoyama T, Hiroshima Y, Yamada T, et
al: High gamma-glutamyl hydrolase and low folylpolyglutamate
synthetase expression as prognostic biomarkers in patients with
locally advanced gastric cancer who were administrated
postoperative adjuvant chemotherapy with S-1. J Cancer Res Clin
Oncol. 146:75–86. 2020. View Article : Google Scholar : PubMed/NCBI
|
|
59
|
Avella Patino DM, Radhakrishnan V,
Suvilesh KN, Manjunath Y, Li G, Kimchi ET, Staveley-O'Carroll KF,
Warren WC, Kaifi JT and Mitchem JB: Epigenetic regulation of cancer
immune cells. Semin Cancer Biol. 83:377–383. 2022. View Article : Google Scholar : PubMed/NCBI
|
|
60
|
Albertsson PA, Basse PH, Hokland M,
Goldfarb RH, Nagelkerke JF, Nannmark U and Kuppen PJ: NK cells and
the tumour microenvironment: Implications for NK-cell function and
anti-tumour activity. Trends Immunol. 24:603–609. 2003. View Article : Google Scholar : PubMed/NCBI
|
|
61
|
Wu SY, Fu T, Jiang YZ and Shao ZM: Natural
killer cells in cancer biology and therapy. Mol Cancer. 19:1202020.
View Article : Google Scholar : PubMed/NCBI
|
|
62
|
Lorenzo-Herrero S, López-Soto A,
Sordo-Bahamonde C, Gonzalez-Rodriguez AP, Vitale M and Gonzalez S:
NK cell-based immunotherapy in cancer metastasis. Cancers (Basel).
11:292018. View Article : Google Scholar : PubMed/NCBI
|
|
63
|
Bald T, Krummel MF, Smyth MJ and Barry KC:
The NK cell-cancer cycle: Advances and new challenges in NK
cell-based immunotherapies. Nat Immunol. 21:835–847. 2020.
View Article : Google Scholar : PubMed/NCBI
|