Introduction
Ovarian cancer (OC) has the highest mortality rate
of gynecological cancer (1). Since
cisplatin (DDP) was approved by Food and Drug Administration (USA)
in 1978, platinum anticancer drugs have become the most widely used
type of chemotherapy drug (2).
Platinum/taxane-based chemotherapy is currently the first-line
treatment for OC. Patients often initially respond well to
platinum-based chemotherapy combined with paclitaxel
administration. However, a marked proportion of patients experience
disease recurrence. Furthermore, resistance to platinum-based
chemotherapy is correlated with poor prognosis (3). Once patients with OC present with
recurrence and/or chemotherapeutic resistance, the median overall
survival (OS) is only 12–14 months (3). Tumor resistance to platinum drugs is
reportedly one of the primary factors that limits the efficacy of
OC treatment (4). Accordingly,
research on platinum resistance is essential to improve the
survival of this patient population.
In a previous study, an in vivo model of
platinum-resistant OC was established by simulating the clinical
drug resistance process (5).
Through study of the mouse model, it was demonstrated that
inter-α-trypsin inhibitor heavy chain 3 (ITIH3) was downregulated
in the platinum-resistant OC group. It was hypothesized that ITIH3
may be a DDP resistance-associated gene. The ITIH3 gene encodes the
heavy chain subunit of the α trypsin inhibitor complex precursor
that stabilizes the extracellular matrix by preventing hyaluronic
acid depolymerization (6,7). ITIH3 may also serve an important role
in tumor progression. There is ample evidence to suggest that the
ITIH family genes are markedly downregulated in various human solid
tumors, such as colon, breast and lung cancer, which indicates that
the ITIH family may be tumor suppressor genes (8,9).
Abnormally elevated blood ITIH3 expression levels have been
reported in patients with pancreatic (10,11),
early gastric (12), breast
(13) and colorectal cancer
(9). Furthermore, ITIH3 has been
reported to be abnormally elevated in the serum of mouse models of
gastric and colorectal cancer (12,14).
Taken together, these findings suggest that ITIH3 has potential as
a tumor marker. To the best of our knowledge, however, few studies
have reported the role of ITIH3 expression in OC (13,15).
One study reported that ITIH3 mRNA expression levels are
significantly downregulated in 71% of OC cases, which indicated
that ITIH3 may be a tumor suppressor gene (8). To the best of our knowledge, there
are no published reports about the connection between ITIH3 and DDP
resistance. Therefore, in the present study the effect of ITIH3
expression on platinum resistance in OC was assessed and the
association between ITIH3 expression levels and survival were
evaluated. In vivo and in vitro experiments were used
to investigate the underlying mechanism of action.
Materials and methods
Patient information
OC tumor tissue microarrays (TMAs) were gifted from
Professor Beihua Kong (Qilu Hospital of Shandong University, Jinan,
China). The present study was approved by the Scientific Ethics
Committee of Qilu Hospital of Shandong University (approval no.
KYLL-2013-130). All participants provided written informed consent
for the present study.
TMAs were obtained for late-stage OC tissue
specimens (n=109) collected from January 2005-December 2013 at Qilu
Hospital of Shangdong University (Table I). TMA analysis was performed as
described previously (16).
Patients were followed-up every month for the first year after
surgery, every 3 months for the second year, every 6 months for the
third year and once/3 years thereafter. OS was defined as the time
from the day of diagnosis to death. The follow-up period ranged
from 0.6–129.0 months (mean, 41.5±25.9 months). Progression-free
survival (PFS) was defined as the period from the day of surgery to
the time of disease recurrence. Data of patients who did not
experience disease recurrence and survived beyond April 1, 2016,
are recorded as censored data.
 | Table I.Pathological features of 109 patients
with epithelial ovarian cancer. |
Table I.
Pathological features of 109 patients
with epithelial ovarian cancer.
| Pathological
feature | Cases | ITIH3 IRS | P-value |
|---|
| Vital status |
|
| 0.04 |
|
Living | 37 | 6.22±2.66 |
|
|
Deceased | 72 | 5.11±2.50 |
|
| FIGO |
|
| 0.33 |
| Stage
III | 100 | 5.56±2.65 |
|
| Stage
IV | 9 | 4.67±1.94 |
|
| Pathological
grade |
|
|
|
|
G2-3 | 109 | 5.49±2.60 |
|
| Histological
classification |
|
| 0.88 |
|
Serous | 103 | 5.50±2.63 |
|
|
Non-serous | 6 | 5.33±2.06 |
|
|
Mucinous | 1 | 8.00±0.00 |
|
|
Endometrioid | 2 | 4.00±0.00 |
|
|
Mixed | 3 | 5.33±2.31 |
|
Cell culture
The OC SKOV3 cell line was gifted from Professor
Hani Gabra (Imperial College London, London, UK) and a
DDP-resistant cell line SKOV3/DDPII was developed in the laboratory
as previously described (5). The
OC A2780 and CAOV3 cell lines were purchased from the National
Infrastructure of Cell Line Resource. The OC NIH:OVCAR3 cell line
was purchased from the American Type Culture Collection. SKOV3,
SKOV3/DDPII and CAOV3 cells were cultured at 37°C under 5%
CO2 in Dulbecco's modified Eagle medium/high glucose
medium (DMEM; Corning, Inc.) supplemented with 10% fetal bovine
serum (Corning, Inc.), 100 IU/ml penicillin and 100 IU/ml
streptomycin. A2780 cells were cultured at 37°C under 5%
CO2 in RPMI-1640 (Corning, Inc.) supplemented with 10%
fetal bovine serum (Corning), 100 IU/ml penicillin and 100 IU/ml
streptomycin. OVCAR3 cells were cultured at 37°C under 5%
CO2 in RPMI-1640 complete medium (Shanghai Yingwan
Biological Co., Ltd.).
Immunohistochemistry
Immunohistochemistry of TMAs was performed on 4 µm
sections sliced from each TMA receiver block fixed with 4%
paraformaldehyde at room temperature for 48 h and embedded in
paraffin. The production of TMAs was performed as described
previously (17,18). ITIH3 protein expression levels were
assessed using an Immunohistochemistry Envision Horseradish
Peroxidase kit (cat. no. KIT-5004; Fuzhou Maixin Biotech. Co.,
Ltd.) and goat-antiITI-H3 (L-15) antibody (1:200; cat. no.
sc-33949; Santa Cruz Biotechnology, Inc.). At room temperature,
sections were incubated with primary antibody for 1 h. The sections
were next incubated with secondary anti-goat (1:500; cat. no.
P0449; Dako, Agilent Technologies, Inc.) antibodies for 20 min at
RT. Two senior pathologists who were blinded to the research
independently evaluated and scored the proportion of positively
stained cells in each specimen and staining intensity under
microscope (Olympus, Inc.). The proportion of positive cells was
scored as follows: 0, no positive cells; 1, 1–25; 2, 26–50; 3,
51–75 and 4, 76–100% positive cells. Staining intensity was scored
as follows: 0, no color; 1, pale yellow; 2, brown and 3, dark
brown. The final immunoreactive score (IRS) was the product of the
positive cell proportion score and the staining intensity score.
For ITIH3, a final IRS of 0 was defined as negative, ≤6 as weak
expression and >6 as strong expression (19).
Construction of ITIH3 RNA interference
(i) cell lines
Lentiviruses expressing ITIH3 short hairpin (sh)RNA
were produced using 0.5 µg Lentiviral shRNA Vectors LV-3
(pGLVH1/GFP + Puro), which targeted the sequence
5′-GCAACGTGCAGATAGTCAATG-3′, combined with 1.5 µg third-generation
lentiviral packaging mix (1:1:1 mix of PG-P1-VSVG, PG-P2-REV and
PG-P3-RRE) in 293T cells. Lentiviruses expressing nonsense sequence
shRNA were used as the negative control (NC)
(5′-GTTCTCCGAACGTGTCACGT-3′). Lentiviruses were purchased from
Suzhou GenePharma Co., Ltd. SKOV3 cells were plated in 6-well
plates at a density of 1×10⁵ cells/well in 1 ml DMEM
(Corning, Inc.). The cells were treated with virus venom (MOI=5-10)
and polybrene solution (5 µg/ml) at a cell saturation of ~30% at
37°C for 24 h. After 24 h, the medium was replaced with fresh
culture medium and cells were cultured at 37°C. After 72 h of
transduction, cells were screened using GFP fluorescence and
selected by 2–5 µg/ml puromycin (cat. no. ant-pr-1; InvivoGen,
Inc.) for 5–7 days.
The ITIIH3 small interfering (si)RNA oligo
(5′-GCAUCAGUAUGCUGAACAATT-3′) and a scrambled non-targeting siRNA
(siNC; 5′-UUCUCCGAACGUGUCACGUTT-3′) were purchased from Suzhou
GenePharma Co., Ltd. OVCAR3 cells at 70% confluency were
transfected with a final concentration of 10 nM siITIH3 or siNC at
37°C for 24 h using HiPerFect® Transfection Reagent
(Qiagen GmbH) according to the manufacturer's protocol. After 72 h,
western blotting using ITIH3 antibody was performed to assess
depletion efficiency.
Cytotoxicity assay
The half-maximal inhibitory concentration
(IC50) of DDP was assessed using Cell Counting Kit-8
(CCK-8; Dojindo Laboratories, Inc.) assay. SKOV3, SKOV3-NC,
SKOV3-ITIH3 RNAi, SKOV3/DDPII, OVCAR3, OVCAR3-NC or OVCAR3-ITIH3
RNAi cells were cultured in a medium containing a DDP gradient
(1.25, 2.50, 5.00, 10.00 and 20.00 µM) at 37°C for 48 h. CCK8
reagent (10 µl) was added to each well, followed by incubation for
2 h at 37°C. The absorbance was assessed at 450 nm. Cell
proliferation inhibition at different drug concentrations was
calculated as follows: Inhibition rate=(control well
absorbance-test well absorbance)/(control well absorbance-blank
well absorbance) (20). Five
replicate wells were used/concentration and the experiment was
repeated at least three times. The IC50 value and DDP
resistance at 48 h were calculated using SPSS 20.0 (IBM Corp.). And
the drug resistance index=IC50 of drug-resistant
cells/IC50 of parental cells.
Cell viability and cytotoxicity
assay
Cell viability and drug toxicity analyses were
performed using a real-time cell analysis (RTCA) xCELLigence D.P.
system (ACEA Bioscience, Inc.), a real-time label-free system used
to monitor cell viability, migration and invasion. SKOV3-NC or
SKOV3-ITIH3 RNAi cells were plated in a 16-well culture plate and
incubated overnight in DMEM supplemented with 10% fetal bovine
serum (Corning, Inc.) for toxicity analysis. Cells in the
exponential growth phase were treated using DDP (10 or 20 µM) at
37°C for 100 h. The cell viability and proliferation were assessed
every 15 min for 100 h. Duplicate wells were used for each
concentration. The results were presented as the normalized cell
index (CI), which was derived from the CI ratio before and after
drug treatment by RTCA 2.0.0.1301 software (ACEA Bioscience,
Inc.).
Colony formation assay
SKOV3, SKOV3-NC, SKOV3-ITIH3 RNAi or SKOV3/DDPII
cells were plated at a density of 1,000 cells/well in 6-well plates
and incubated in DMEM supplemented with 10% fetal bovine serum
(Corning, Inc.) at 37°C overnight. Then, 0.3 or 0.6 µM DDP was
added, followed by incubation at 37°C for 2 days. The culture media
was replaced and cells were cultured at 37°C for another 5 days.
Colonies were fixed using 100% cold methanol for 15 min in 4°C and
stained using 10% Giemsa's Stain (cat. no. G8220; Beijing Solarbio
Science & Technology Co., Inc.) for 30 min in RT. The stained
colonies were visualized using a light microscope (magnification,
×40) (Nikon, Inc.) and the number of colonies that contained >50
cells were counted manually. Experiments were repeated three times
and three parallel wells were used/concentration.
Flow cytometric analysis of
apoptosis
Apoptosis of SKOV3, SKOV3-NC, SKOV3-ITIH3 RNAi or
SKOV3/DDPII cells was assessed using flow cytometry using a PE
Annexin V Apoptosis Detection kit I assay (BD Biosciences),
according to the manufacturer's protocols. Each sample was assessed
using a CytoFLEX flow cytometer (Beckman Coulter, Inc.). The
results were quantified using CytExpert 2.1.0.92 (Beckman Coulter,
Inc.). The apoptotic rate was calculated as the sum of early
apoptosis rate (first quadrant) and the late apoptosis rate (fourth
quadrant). All experiments were repeated at least three times.
Xenograft modelling
In our previously study, we developed a
DDP-resistant cell line with stable DDP resistance index and
platinum resistant epithelial ovarian cancer mice mode1, the
specific methods were performed as described previously (5). Briefly, subcutaneous xenograft tumor
models of SKOV3 and SKOV3/DDPII were established in nude mice. When
all tumor volume reached >400 mm3, 2.5 mg/kg DDP was
administered by intraperitoneal injection every other day for a
maximum of eight doses. Tumors were removed on before injection (0
does) and 2 days following the 2, 5 and 8 times (2, 5 and 8 does)
of DDP injections. The removed tumors were immediately frozen in
liquid nitrogen for follow-up proteomic studies.
Isobaric tag for relative and absolute
quantitation (iTRAQ) proteomics profiling
Subcellular membrane, nuclear and cytoplasmic
protein was extracted from xenograft tumors using the ProteoExtract
Subcellular Proteome Extraction kit (539790; Merck KGaA) and mixed
quantified using the Pierce BCA Protein Assay kit (23227; Thermo
Fisher Scientific, Inc.). Protein samples were quantified,
alkylated, digested and labeled with iTRAQ using the iTraq Reagent
8 plex buffer kit (4381663; Applied Biosystems; Thermo Fisher
Scientific, Inc.) and iTraq Reagent 8 plex Multiplex kit (4381663;
Applied Biosystems; Thermo Fisher Scientific, Inc.) according to
the manufacturer's protocol. Following iTRAQ labeling, samples (100
µg/sample) were fractionated used a ACQUITY Ultra Performance LC
system (Waters). The labeled samples were fractionated by strong
cation exchange liquid chromatograph (SCX) using a 0.5×23.00 mm, 5
µm, 300A Column (Waters, USA). Second, ten fractions that eluted
with 10 different molar concentration of 25, 50, 75, 100, 150, 200,
300, 400, 500 and 1,000 mM of NH4AC were collected from the SCX
column. Then, each of the fractions was then loaded onto a reverse
phase (RP) column, ZORBAX 300SB-C18 column (5 µm, 300A, 4.6×50.00
mm, Agilent, USA), both Buffer A (5% acetonitrile, 95% water, 0.1%
formic acid) and Buffer B (95% acetonitrile, 5% water, 0.1% formic
acid) were used for elution at a flow rate of 0.4 µl/min. The
entire process was monitored at 214 nm absorbance at RT. The liquid
chromatography eluent was assessed using high-resolution liquid
chromatography with tandem mass spectrometry using a QStar Pulsar
Quadrupole Time of Flight mass spectrometer (Applied Biosystems;
Thermo Fisher Scientific, Inc.). ProteinPilot (2.0.1; Applied
Biosystems; Thermo Fisher Scientific, Inc.) was used for protein
identification and quantification after searching against the human
International Protein Index database (IPI version 3.28, European
Bioinformatics Institute, ebi.ac.uk/IPI), as previously described
(21). The difference in protein
expression levels was evaluated as described previously (16).
Western blotting
Total protein extracts of cells or mice xenograft
tumor tissue were obtained using radioimmunoprecipitation assay
lysis buffer (cat. no. R0010; Beijing Solarbio Science &
Technology Co., Ltd.). Protein concentration was quantified using
the Pierce BCA Protein Assay kit (23227; Thermo Fisher Scientific,
Inc.). An equal amount of 40–60 µg protein from each sample was
separated via 10–12% SDS-PAGE and transferred onto polyvinylidene
fluoride membranes (MilliporeSigma) at 200 mA for 2 h on ice. The
membranes were blocked in 5% non-fat milk (cat. no. LP0033; Thermo
Fisher Oxoid, Inc.) at 4°C for 2 h followed by incubation overnight
with primary antibodies against different proteins at 4°C. Western
blotting was performed using the following primary antibodies:
Bcl-2 (D55G8) Rabbit mAb (1:1,000; cat. no. 4223), Bcl-xL (54H6)
Rabbit mAb (1:1,000; cat. no. 2764), Mcl-1 (D35A5) Rabbit mAb
(1:1,000; cat. no. 5453), Phospho-Bcl-2 (Thr56) Antibody (1:1,000;
cat. no. 2875), Phospho-Bcl-2 (Ser70; 5H2) Rabbit mAb (1:1,000;
cat. no. 2827), Bak (D4E4) Rabbit mAb (1:1,000; cat. no. 12105),
Bim (C34C5) Rabbit mAb (1:1,000; cat. no. 2933), Bax (D2E11) Rabbit
mAb (1:1,000; cat. no. 5023), Caspase-3 (8G10) Rabbit mAb (1:1,000;
cat. no. 9665), poly ADP-ribose polymerase PARP antibody (1:1,000;
cat. no. 9542), Cleaved PARP (Asp214; D64E10) XP® Rabbit
mAb (1:1,000; cat. no. 5625), α-tubulin antibody (1:3,000; cat. no.
3873S) and rabbit anti-actin antibody (1:3,000; cat. no. 4970S),
all purchased from Cell Signaling Technology, Inc. Bcl-2 Rabbit mAb
(1:1,000; cat. no. R22494) was purchased from Chengdu Zhengneng
Biotechnology Co., Ltd. and ITIH3 (1:1,000; cat. no. sc-33949)
antibodies was purchased from Santa Cruz Biotechnology Co., Ltd.
Cleaved caspase-3 (1:1,000; cat. no. ab32042) and rabbit anti-GAPDH
(1:3,000; cat. no. ab181602) was purchased from Abcam. After
washing with tris-buffered saline with 0.1% Tween-20, the membranes
were probed with secondary antibodies at 4°C for 2 h. The secondary
anti-mouse (1:3,000; cat. no. 7076P2) and anti-rabbit (1:3,000;
cat. no. 7074P2) antibodies were purchased from Cell Signaling
Technology, Inc. and anti-goat (1:1,000; cat. no. P0449) antibodies
were purchased from Dako (Agilent Technologies, Inc.). The
immunoreactive bands were visualized using Pierce® ECL
Western Blotting Substrate (cat. no. 32106; Thermo Fisher
Scientific, Inc.), SuperSignal West Pico PLUS Chemiluminescent
Substrate (cat. no. 34580; Thermo Fisher Scientific, Inc.) and the
Fluor Chem M System (ProteinSimple). All experiments were repeated
at least three times. The results were semi-quantified using
AlphaView® 3.4.0 software (AlphaView SA) and band
density was normalized to the corresponding loading control. The
expression levels of phosphorylated proteins were presented as the
ratio of phosphorylated to total protein.
Animal experiments
BALB/c nude female mice (n=40; age, 4 weeks; weight,
18–20 g) were purchased from and maintained under
specific-pathogen-free (SPF) conditions at the Guangxi Medical
University Laboratory Animal Center. A total of five mice were
housed/cage under a 12/12-h light/dark cycle at 23±2°C with 40–70%
humidity. All mice had free access to SPF grade water and food. The
mice were adapted to these conditions for at least 7 days prior to
the experiments. All animal experiments were approved by the Animal
Ethics Committee of Guangxi Medical University Affiliated Tumor
Hospital (approval no. 2021057). The animal study was performed in
compliance with the Animal Research: Reporting of In Vivo
Experiments guidelines (22).
A total of 1×10⁶ SKOV3-NC or SKOV3-ITIH3
RNAi cells were subcutaneously injected into the groin of nude mice
(n=20 per cell line). The longest and shortest diameters of tumors
were assessed using a Vernier caliper every three days before DDP
injection and every other day following DDP injection; tumor volume
was calculated as follows: Tumor volume=(length ×
width2)/2. When all tumor volume reached >400
mm3, the mice were randomly divided into four DDP
injection groups (0, 2, 5 and 8 doses), with each group containing
5 mice. For the 0 DDP group, tumor tissue was removed before DDP
injection. A total of 2.5 mg/kg DDP was administered by
intraperitoneal injection every other day for a maximum of eight
doses, according to the group, as previously described (5). Tumors were removed on 2 days
following the last intraperitoneal injection of DDP in each group.
At the end of the study, mice were euthanized by cervical
dislocation under 2% isoflurane inhalation anesthesia and tumors
were removed and immediately frozen in liquid nitrogen. Death was
confirmed when the mice stopped breathing and had no heartbeat.
Humane endpoints were as follows: Total volume of a single tumor
>1,500 mm3 or 20% body weight loss. No animals
reached these humane endpoints.
Statistical analysis
SPSS for Windows (version 20.0; IBM Corp) was used
for all statistical analysis. Data of three repeated experiments
are presented as the mean ± standard deviation. Comparisons between
groups were assessed using one-way analysis of variance and
Dunnett's post hoc test. Kaplan-Meier analysis with the log-rank
(Mantel-Cox) comparison test was used to estimate the survival
curves of different groups. P<0.05 was considered to indicate a
statistically significant difference.
Results
Lower expression of ITIH3 is
associated with DDP resistance in OC
In a preliminary study, an in vivo model of
platinum-resistant OC was established and a drug-resistant cell
line (SKOV3/DDPII) with a stable DDP resistance index was developed
(5). A subcutaneous murine
xenograft model using SKOV3 cells and SKOV3/DDPII cells treated
with DDP was established (Fig.
1A). Tumor tissue collected after 0, 2, 5 or 8 injections of
DDP were assessed using iTRAQ proteomics profiling and western
blotting. iTRAQ proteomics profiling results demonstrated that
protein expression levels of ITIH3 in subcutaneous xenograft tumors
of the DDP-resistant group (SKOV3/DDPII group) after 0, 2, 5 or 8
DDP injections were markedly lower compared with those in the
control SKOV3 group (Fig. 1B). Two
iTRAQ replicates were performed to ensure the consistency and
reliability of the results. Western blotting in the subcutaneous
xenograft tumor demonstrated that ITIH3 protein expression levels
in the SKOV3/DDPII group without DDP injection were significantly
lower compared with those in the SKOV3 group (Fig. 1C). ITIH3 protein expression levels
in the SKOV3/DDPII group were significantly lower than those in the
SKOV3 group for all numbers of DDP doses.
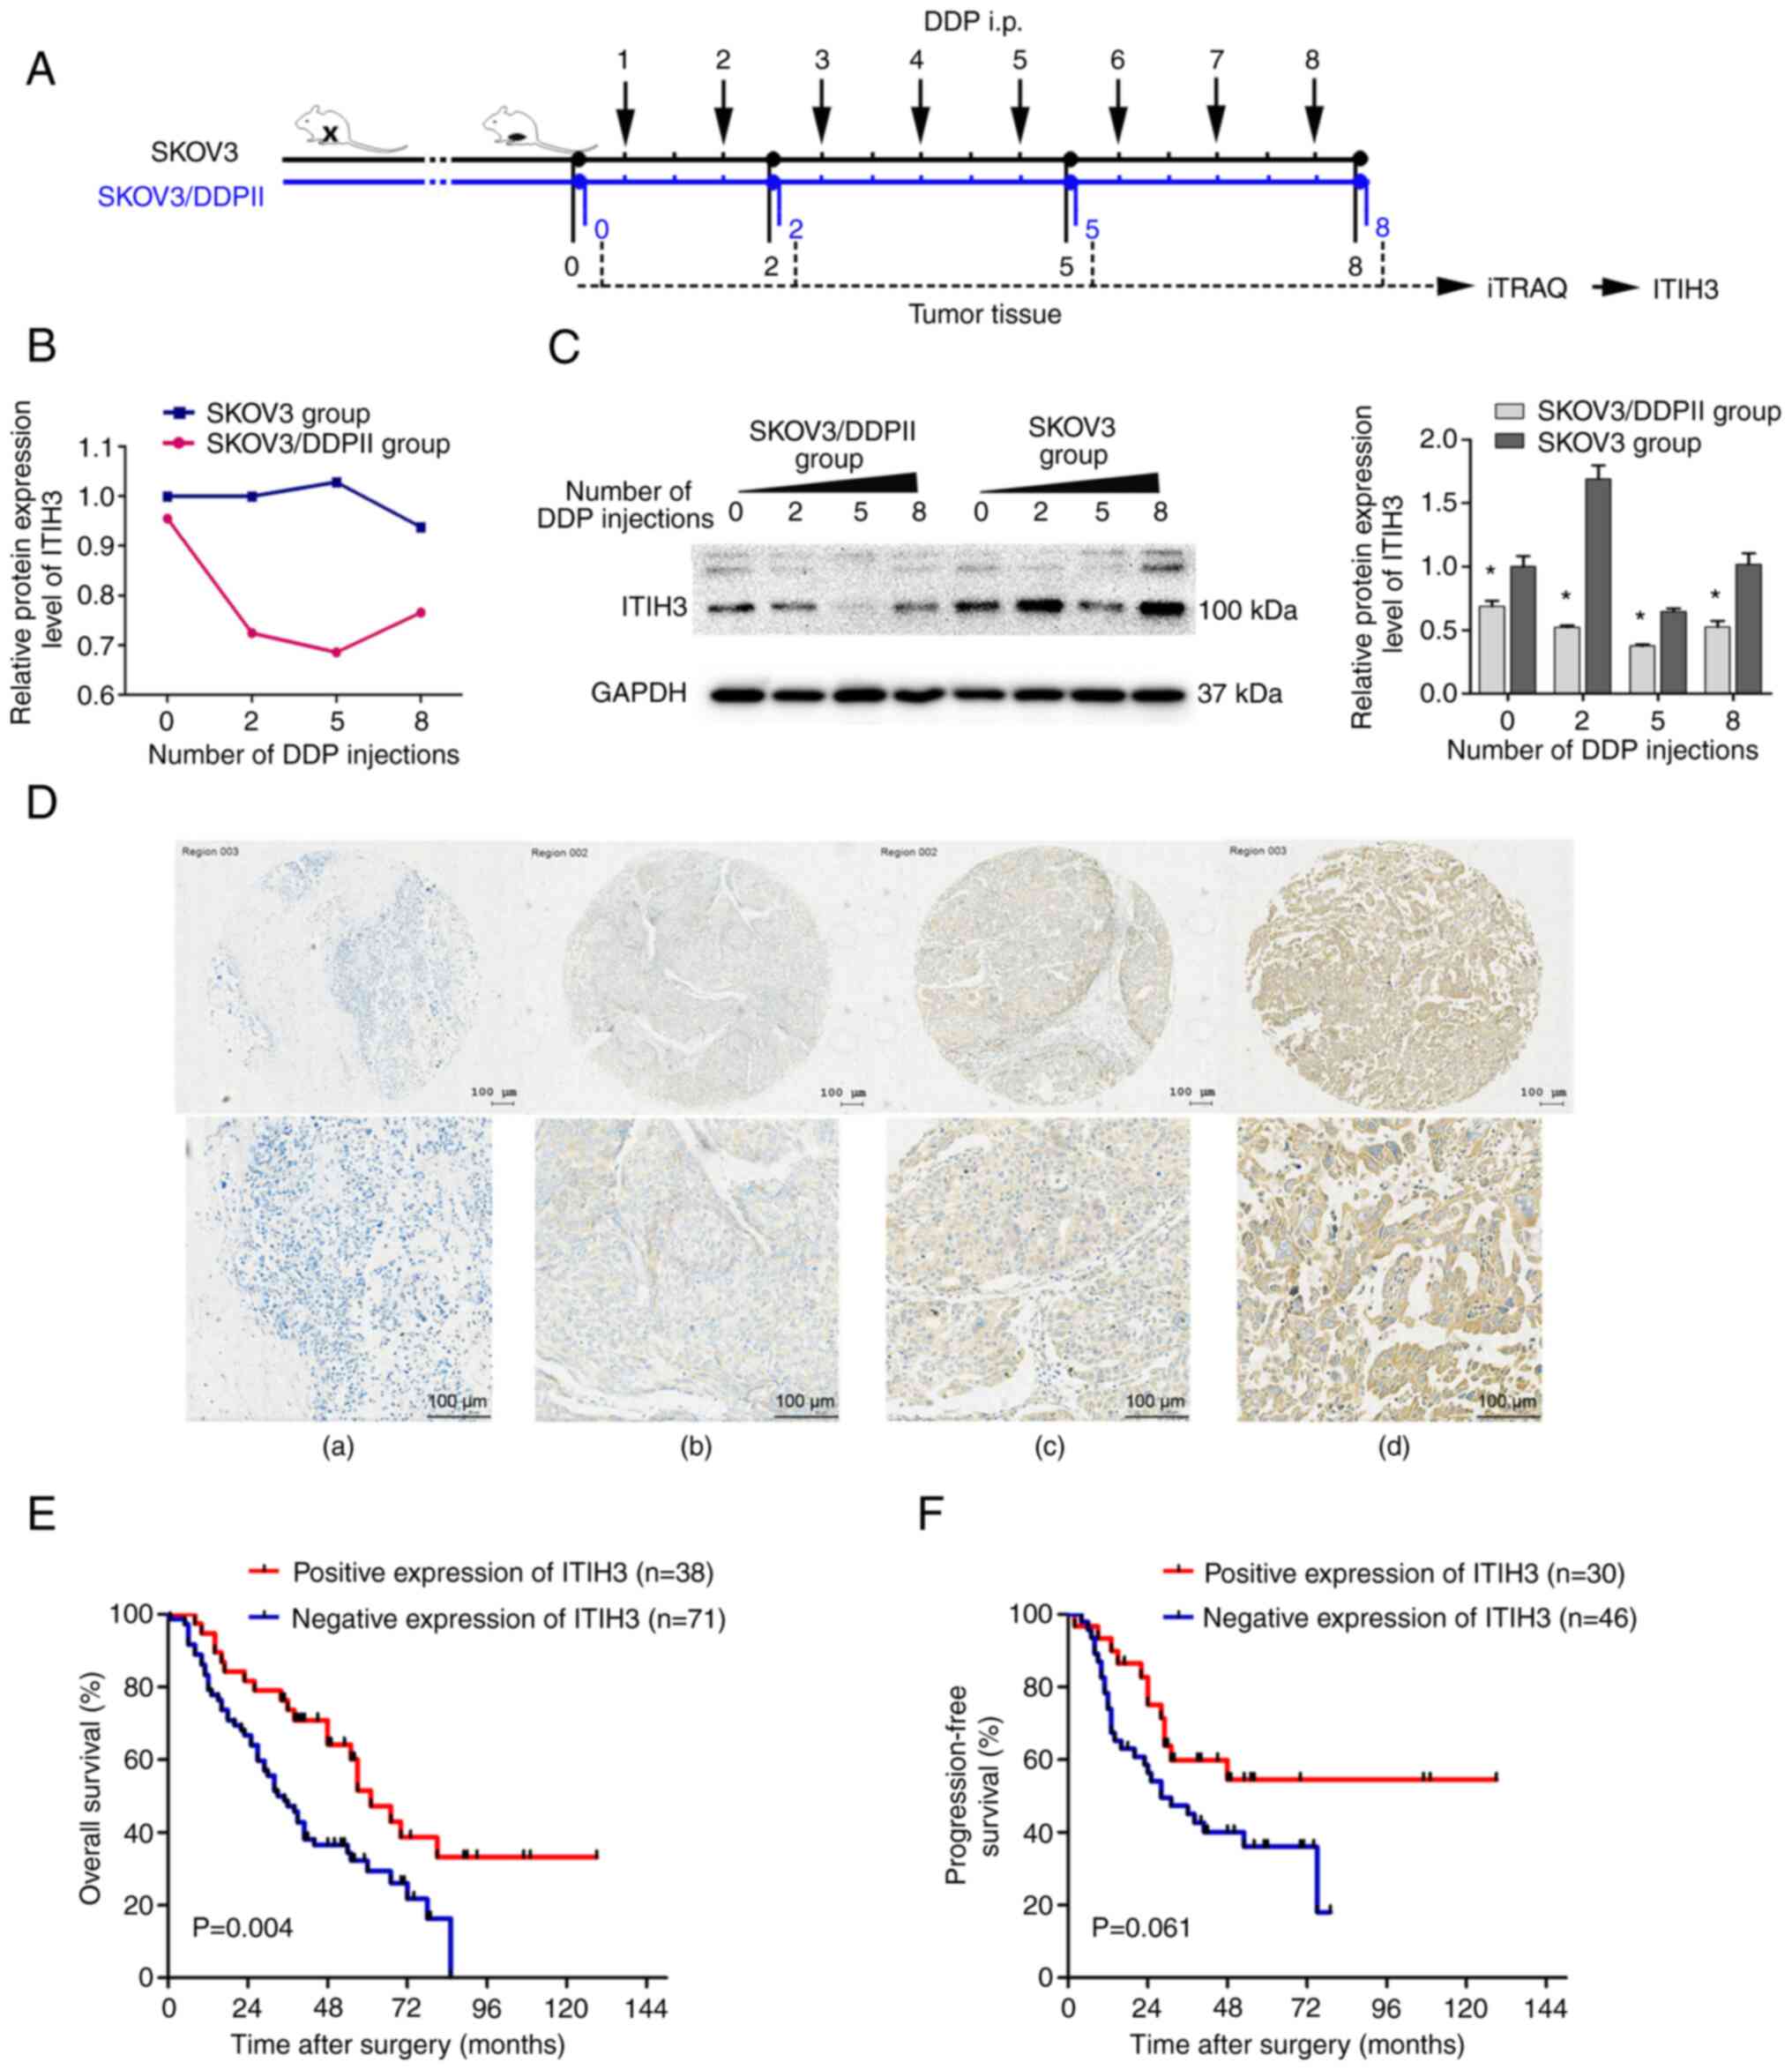 | Figure 1.Lower protein expression levels of
ITIH3 are associated with DDP resistance in OC. (A) Experimental
design of the mouse study. (B) iTRAQ proteomics profiling of ITIH3
protein expression levels in SKOV3/DDPII- and SKOV3-derived
subcutaneous tumor xenografts in nude mice after 0, 2, 5 and 8 DDP
injections (2.5 mg/kg). A total of two iTRAQ replicates were
performed. (C) Western blotting of the ITIH3 protein expression
levels in SKOV3/DDPII- and SKOV3-derived subcutaneous tumor
xenografts in nude mice following 0, 2, 5 and 8 DDP injections (2.5
mg/kg). GAPDH was used as a loading control. (D) Typical tissue
microarray samples with (a) no color, (b) pale yellow, (c) brown
and (d) dark brown color, evaluated using immunohistochemistry.
Kaplan-Meier (E) overall and (F) progression-free survival analysis
of high and low (cut-off=6) ITIH3 protein expression groups in
patients with OC. *P<0.05 vs. SKOV3 group. ITIH3,
inter-α-trypsin inhibitor heavy chain 3; iTRAQ, isobaric tag for
relative and absolute quantitation; DDP, cisplatin; OC, ovarian
cancer; i.p., intraperitoneal. |
Loss of ITIH3 protein expression is
associated with poor prognosis in patients with OC
Of 109 patients with late-stage OC, 72 died during
the follow-up period. The mean time of death was 31.08 months after
surgery and the mean OS time was 41.46 months. An
immunohistochemistry assay was used to assess ITIH3 protein
expression levels in patient tumor tissue. The product of the
proportion of positive cells and staining intensity scores was used
to divide cells into high and low expression groups based on the
final IRS, the cut-off value was set to 6 (IRS ≤6, low expression;
IRS >6, high expression) (Fig.
1D). The ITIH3 IRS of patients who survived to the end of the
study period was significantly higher than that of patients who
died (Table I). The high ITIH3
protein expression level group demonstrated significantly higher OS
compared with the low expression group (Fig. 1E). However, the difference was not
significant with respect to the progression-free survival (Fig. 1F).
Establishment and validation of the
ITIH3 RNAi cell lines
ITIH3 protein expression levels of four human OC
cell lines (SKOV3, A2780, OVCAR3 and CAOV3) were assessed using
western blotting. SKOV3 and OVCAR3 demonstrated markedly higher
ITIH3 protein expression levels (Fig.
2A), therefore these lines were used in the RNAi
experiments.
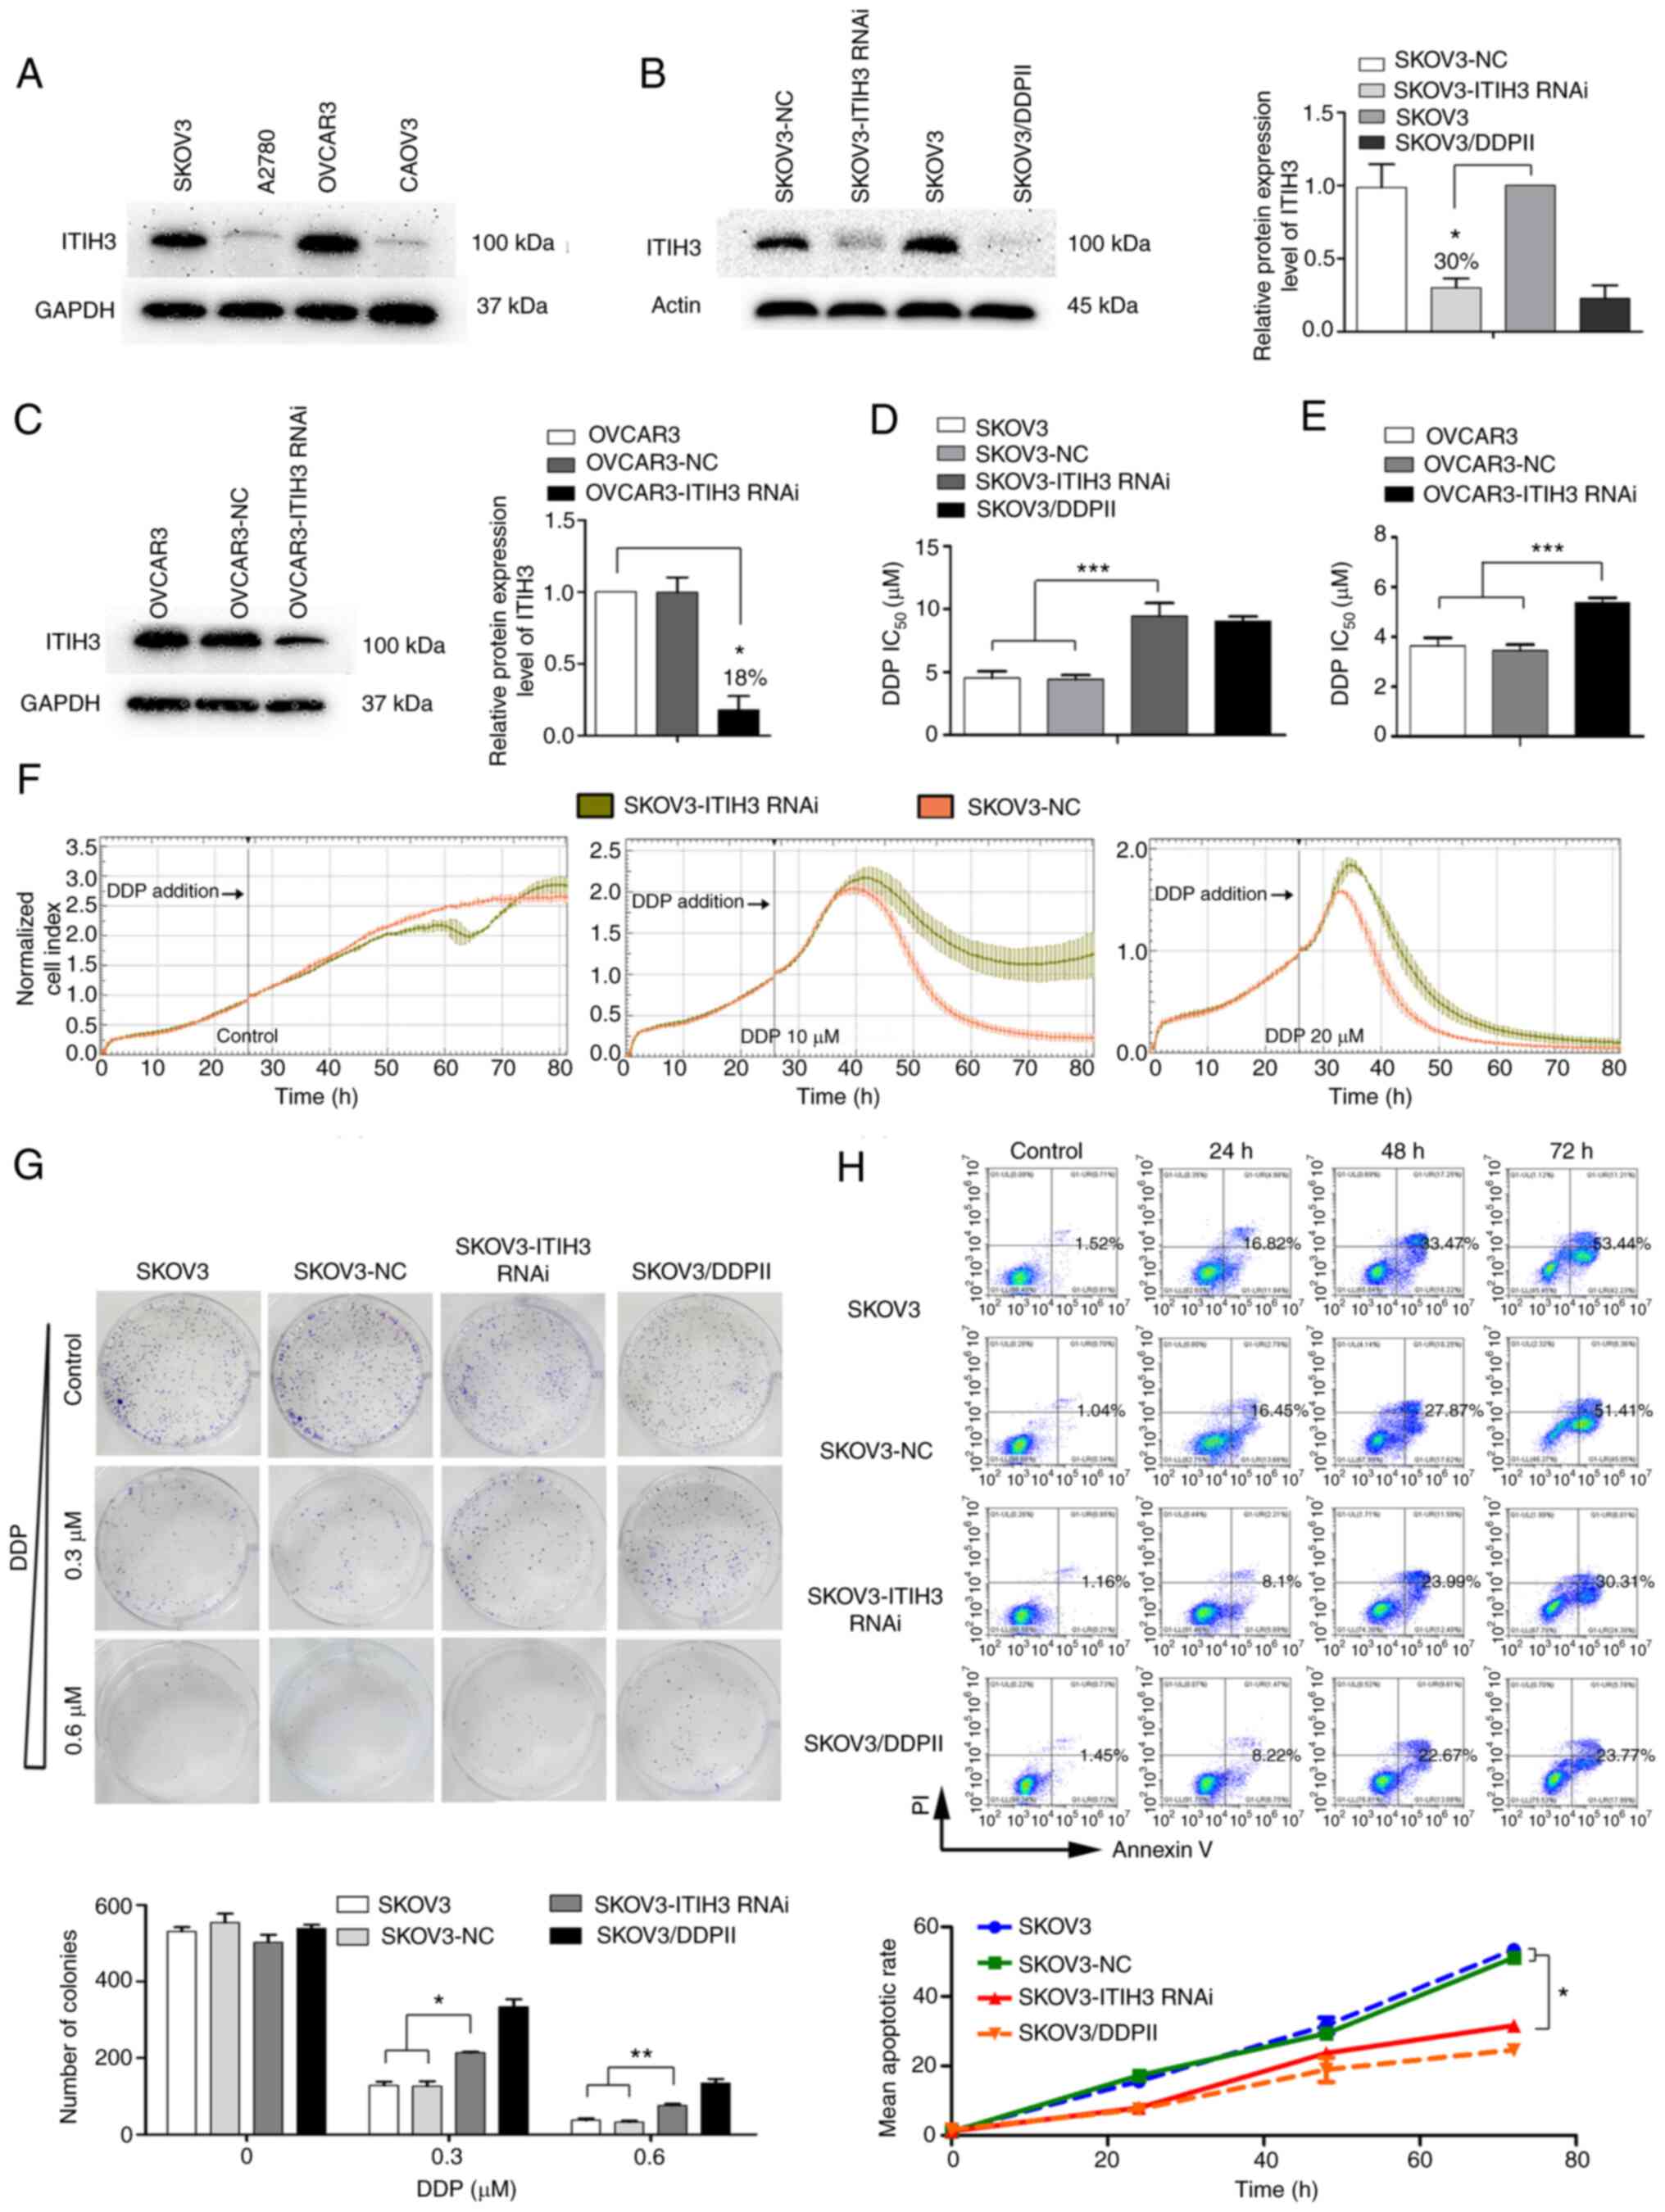 | Figure 2.ITIH3 silencing in SKOV3 cells
enhances DDP resistance. (A) Western blotting was used to assess
ITIH3 protein expression levels in SKOV3, A2780, OVCAR3 and CAOV3
cells. GAPDH was used as a loading control. (B) Western blotting
was used to assess ITIH3 protein expression levels (relative to
SKOV3) in SKOV3-NC, SKOV3-ITIH3 RNAi, SKOV3 and SKOV3/DDPII cells.
Actin was used as a loading control. (C) Western blotting was used
to assess ITIH3 protein expression levels (relative to OVCAR3) in
OVCAR3, OVCAR3-NC and OVCAR3-ITIH3 RNAi cells. GAPDH was used as a
loading control. (D) IC50 of SKOV3, SKOV3-NC,
SKOV3-ITIH3 RNAi and SKOV3/DDPII cells following 48 h DDP
treatment. (E) IC50 of OVCAR3, OVCAR3-NC and OVCAR3-ITIH3 RNAi
cells following 48 h DDP treatment. (F) Real-time analysis of the
cytotoxic effect of DDP in SKOV3-ITIH3 RNAi and SKOV3-NC cells. (G)
Colony formation experiments were performed using SKOV3, SKOV3-NC,
SKOV3-ITIH3 RNAi and SKOV3/DDPII cell lines to assess the effects
of ITIH3 on cell proliferation. Histograms display the mean number
of colonies. (H) SKOV3-ITIH3 RNAi, control SKOV3, SKOV3-NC and
positive control SKOV3/DDPII cells were treated with 20 µM DDP for
24, 48 and 72 h. Apoptotic cell death was assessed using Annexin
V/PE staining and flow cytometry assay. The line graph presents
mean apoptotic rate. Data are presented as the mean ± SD of three
independent experiments. *P<0.05, **P<0.01 and ***P<0.001.
ITIH3, inter-α-trypsin inhibitor heavy chain 3; DDP, cisplatin;
IC50, half-maximal inhibitory concentration; RNAi, RNA
interference; NC, negative control. |
The SKOV3-ITIH3 RNAi cell line was constructed and
cell fluorescence rate was >80% (data not shown). ITIH3 protein
expression levels in SKOV3-ITIH3 RNAi cells were ~30% of those in
the parent SKOV3 and SKOV3-NC cells (Fig. 2B), which was similar to ITIH3
protein expression levels in drug-resistant SKOV3/DDPII cells in
vitro. An OVCAR3-ITIH3 RNAi cell line was constructed and the
protein expression levels of ITIH3 were ~18% of those in the parent
OVCAR3 cell line (Fig. 2C).
ITIH3 silencing increases DDP
resistance in OC cells
CCK-8 assay demonstrated that the DDP
IC50 in SKOV3-ITIH3 RNAi cells was significantly higher
compared with that in the parent SKOV3 and SKOV3-NC cells
(P<0.001). The drug resistance index was ~2.08 times higher in
SKOV3-ITIH3 RNAi cells than in SKOV3 cells (Fig. 2D) and close to the drug resistance
index of SKOV3/DDPII cells. Furthermore, the DDP IC50 in
OVCAR3-ITIH3 RNAi cells after 48 h DDP treatment was significantly
higher than that in the control OVCAR3 and OVCAR3-NC cells
(Fig. 2E).
The dynamic changes in SKOV3-ITIH3 RNAi and SKOV3-NC
cells treated with 10 or 20 µM DDP were assessed using the
xCELLigence RTCA system. The normalized CI curve of SKOV3-ITIH3
RNAi cells at each DDP concentration was markedly higher than that
of SKOV3-NC cells, which indicated higher proliferation in
SKOV3-ITIH3 RNAi than in SKOV3-NC cells treated with DDP (Fig. 2F). Following treatment with 10 µM
DDP, the normalized CI value of SKOV3-NC cells decreased to 0 at 80
h; however, the normalized CI value of SKOV3-ITIH3 RNAi cells
decreased by ~50% and exhibited a tendency to increase again. The
normalized CI value of SKOV3-ITIH3 RNAi cells was markedly higher
than that of SKOV3-NC cells after DDP treated.
Silencing of ITIH3 attenuates colony
formation of SKOV3 cells under DDP pressure
During the colony formation experiment, no
significant difference between the number of SKOV3, SKOV3-NC,
SKOV3-ITIH3 RNAi or SKOV3-DDPII cells was observed at any time
point without drug treatment (Fig.
2G). Following DDP treatment (0.3 or 0.6 µM), the number of
SKOV3-ITIH3 RNAi cells was significantly higher compared with the
number of SKOV3 and SKOV3-NC cells, which was consistent with the
number of colonies formed by SKOV3/DDPII cells in vitro.
ITIH3 silencing decreases DDP-induced
apoptosis of SKOV3 cells
Flow cytometry demonstrated no significant
difference in the proportion of apoptotic SKOV3, SkOV3-NC,
SkOV3-ITIH3 RNAi and SKOV3-DDPII cells without drug treatment
(Fig. 2H). However, following DDP
(20 µM) treatment, the proportion of apoptotic SKOV3-ITIH3 RNAi
cells was significantly lower than the proportion of apoptotic
SKOV3 and SKOV3-NC cells at 72 h and slightly higher than the
proportion of apoptotic DDP-resistant SKOV3/DDPII cells.
ITIH3 may be an upstream regulator of
Bcl-2 signaling that promotes apoptosis induced by DDP in
vitro
Bcl-2 family proteins, including pro-survival and
pro-apoptotic proteins, serve key roles in apoptosis (Fig. 3A). Before DDP treatment, expression
levels of Bcl-2 family proteins demonstrated no significant
differences in SKOV3, SKOV3-NC, SKOV3-ITIH3 RNAi and SKOV3-DDPII
cells (Fig. 3B). Following
treatment with 10 µM DDP for 12, 24, 36 and 48 h, expression levels
of the pro-survival proteins Bcl-2, Bcl-xL and Mcl-1 in SKOV3-ITIH3
RNAi cells were markedly higher than in SKOV3 and SKOV3-NC cells
(Fig. 3B). However, no marked
difference in expression levels of pro-apoptotic proteins Bak, Bim
and Bax was observed. The expression levels of the apoptotic
proteins cleaved caspase 3 and caspase 3 and the cleaved DNA repair
enzyme, C-PARP, were markedly decreased in SKOV3-ITIH3 RNAi cells
compared with in SKOV3 and SKOV3-NC cells. Following DDP treatment
for 12 h, Bcl-2 protein expression levels in SKOV3-ITIH3 RNAi cells
were significantly higher than those in SKOV3 and SKOV3-NC cells
and similar to protein expression levels demonstrated in
SKOV3/DDPII cells (Fig. 3C).
Furthermore, 24 h after DDP treatment, Mcl-1 protein expression
levels in SKOV3-ITIH3 RNAi cells were significantly higher and the
protein expression of cleaved caspase 3 and caspase 3 were
significantly decreased compared with those in SKOV3 and SKOV3-NC
cells. C-PARP protein expression levels were significantly higher
in SKOV3 and SKOV3-NC cells than those in SKOV3-ITIH3 RNAi.
Following 10 µM DDP treatment for 36 h, Bcl-2 and Bcl-xL protein
expression levels in SKOV3-ITIH3 RNAi cells were significantly
higher than in SKOV3 and SKOV3-NC cells; however, protein
expression levels of cleaved caspase 3 and caspase 3 and C-PARP
were significantly decreased. Following DDP treatment for 48 h, the
protein expression levels of Bcl-2, Bcl-xL and Mcl-1 in SKOV3-ITIH3
RNAi cells were significantly higher than those in SKOV3 and
SKOV3-NC cells, whereas cleaved caspase 3 and caspase 3 protein
expression levels were significantly lower. C-PARP protein
expression levels were almost undetectable in SKOV3-ITIH3 RNAi
cells. These results indicated that following ITIH3 silencing, the
inhibitory Bcl-2 signaling pathway in SKOV3 cells was significantly
activated following DDP treatment and similar findings were
demonstrated in SKOV3/DDPII cells in vitro.
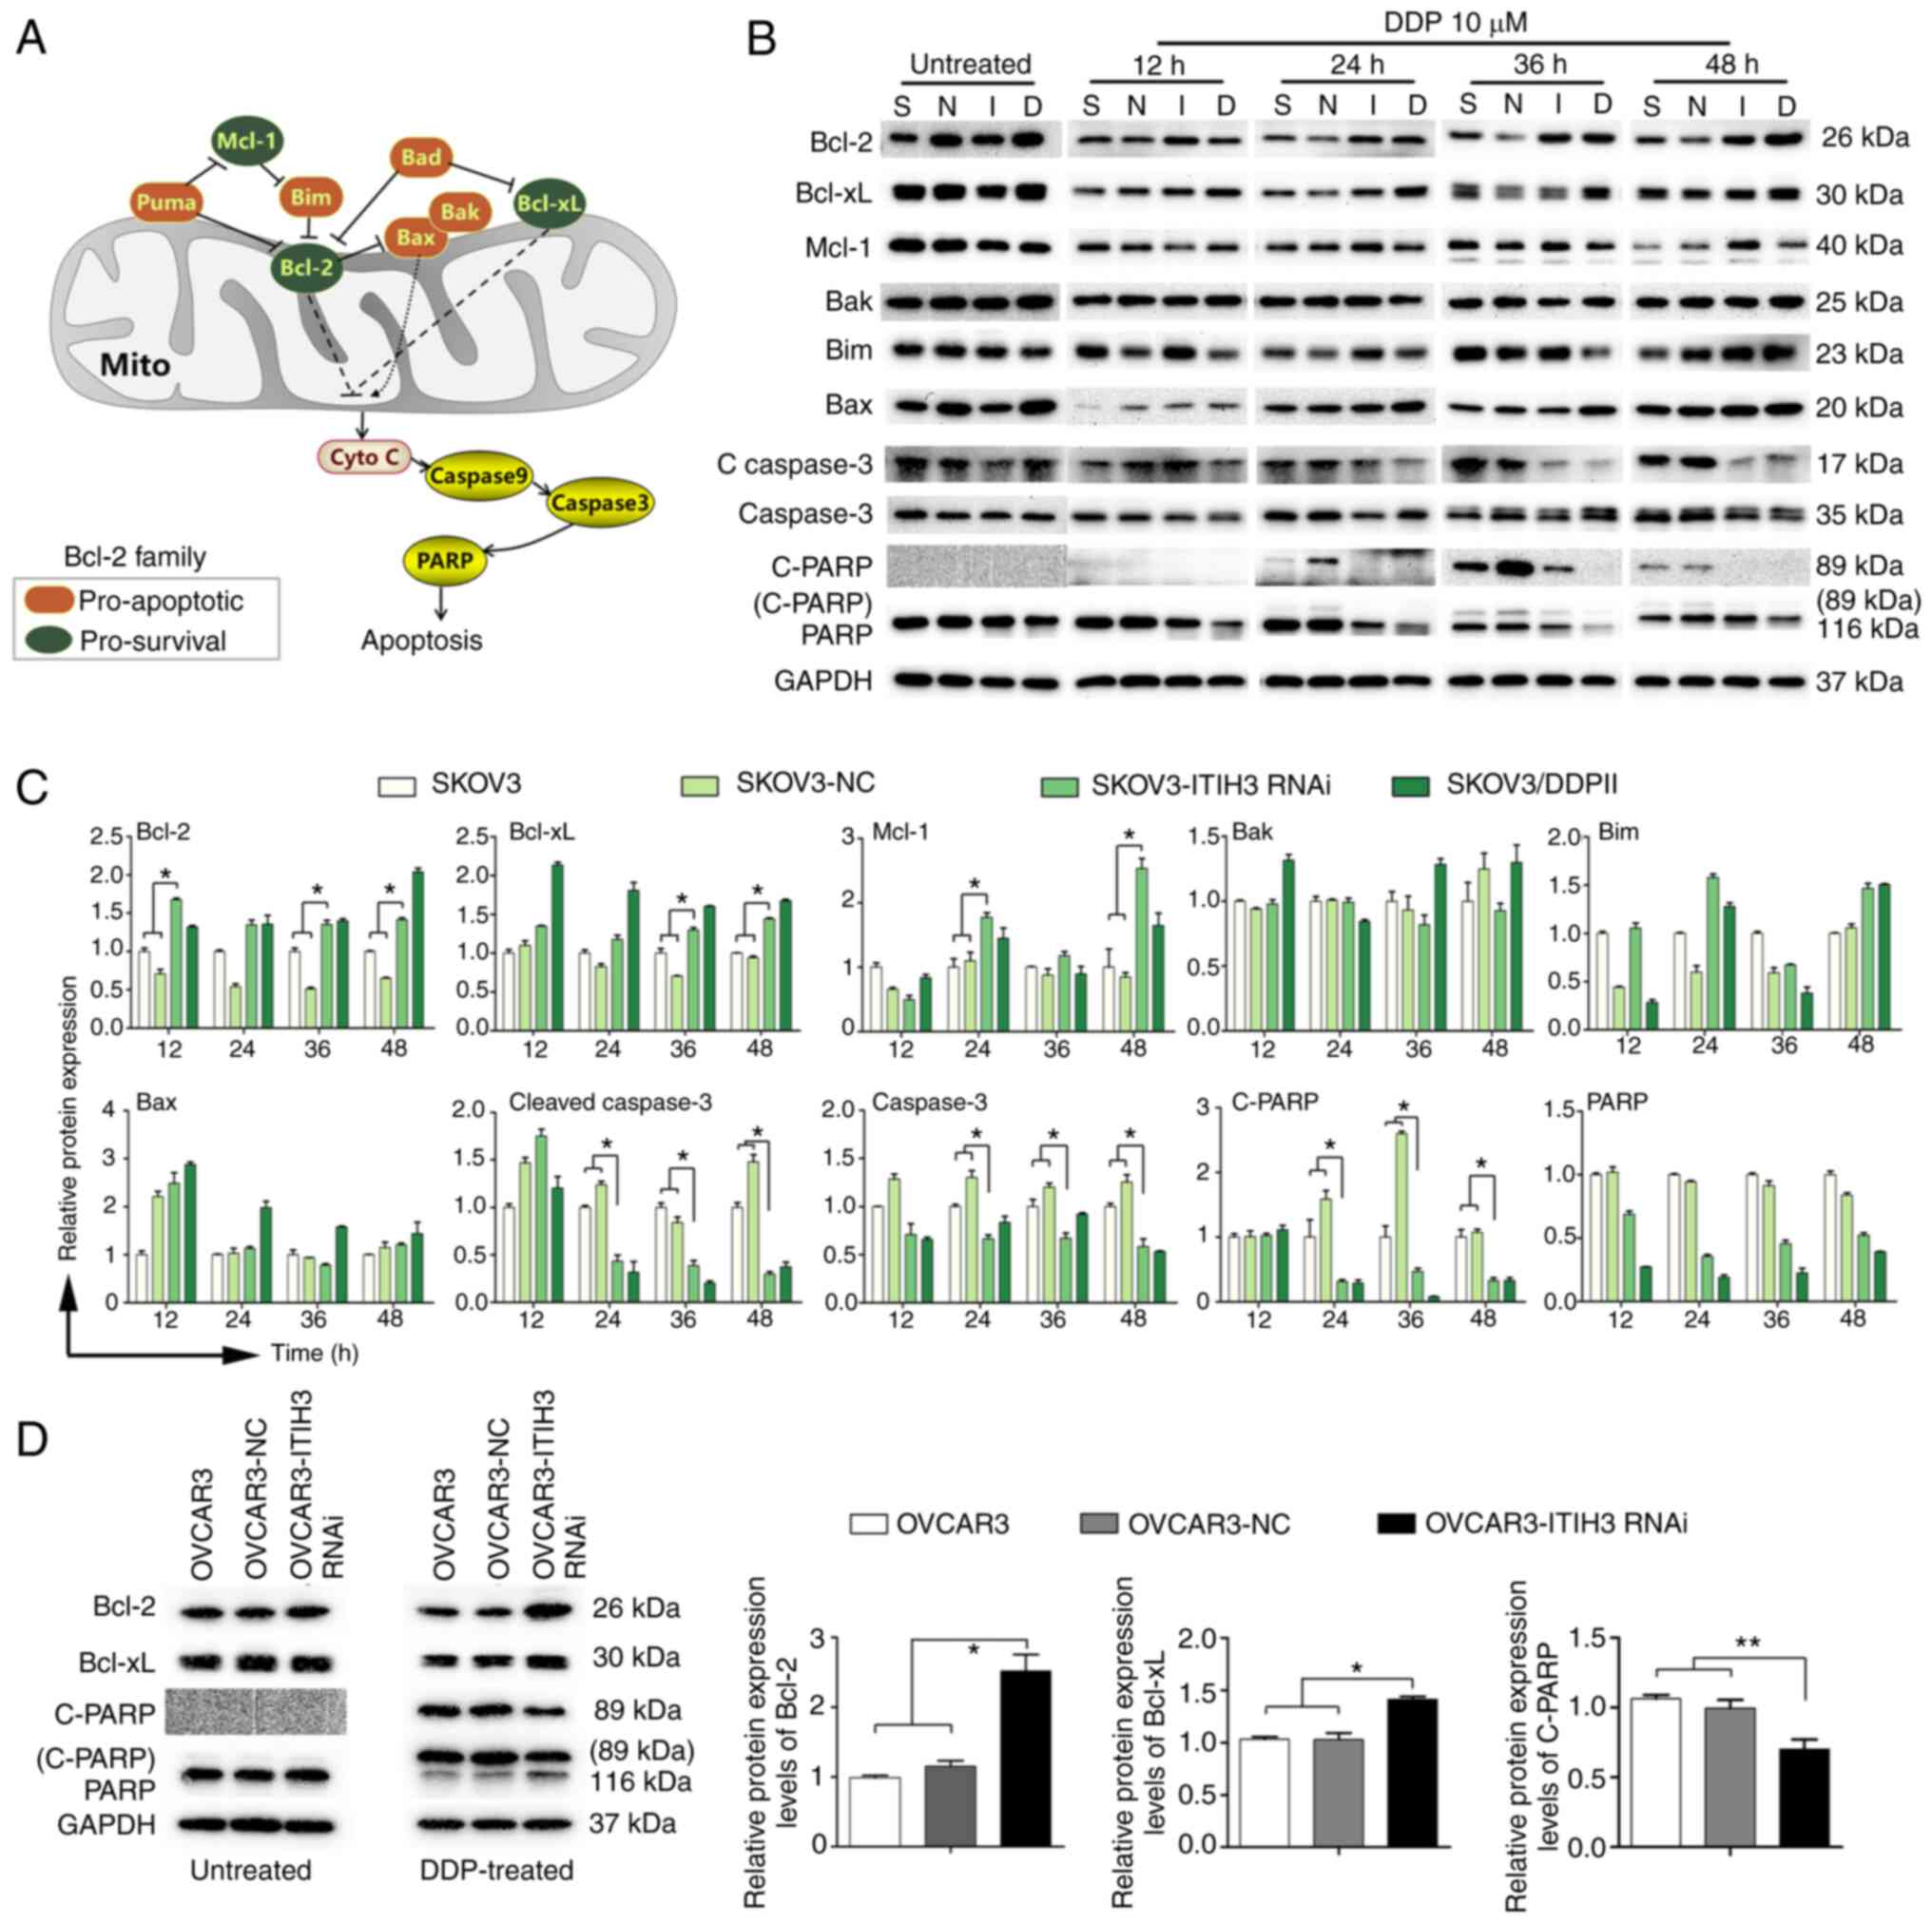 | Figure 3.ITIH3 promotes Bcl-2 signaling in
vitro. (A) Overview of the Bcl-2 signaling pathway. (B) Western
blotting of Bcl-2, Bcl-xL, Mcl-1, Bak, Bim, Bax, C-Caspase 3,
Caspase 3, C-PARP and PARP protein expression levels in SKOV3-NC,
SKOV3-ITIH3 RNAi, SKOV3 and SKOV3/DDPII cells following treatment
with 10 µM DDP for 12, 24, 36 and 48 h. (C) Bcl-2, Bcl-xL, Mcl-1,
Bak, Bim, Bax, C-Caspase 3, Caspase 3 and C-PARP protein expression
levels in SKOV3-NC, SKOV3-ITIH3 RNAi, Skov3 and SKOV3/DDPII cells
following treatment with 10 µM DDP for 12, 24, 36 and 48 h. (D)
Western blotting of Bcl-2, Bcl-xL, C-PARP and PARP protein
expression levels in OVCAR3, OVCAR3-NC and OVCAR3-ITIH3 RNAi cells
following treatment with 10 µM DDP for 36 h. GAPDH was used as a
loading control. Data are presented as the mean ± SD of three
independent experiments. *P<0.05 and **P<0.01. C, cleaved;
Casp, caspase; RNAi, RNA interference; S, SKOV3; N, SKOV3-NC; I,
SKOV3-ITIH3 RNAi; D, SKOV3/DDPII; ITIH3, inter-α-trypsin inhibitor
heavy chain 3; DDP, cisplatin; NC, negative control; Mito,
mitochondria. |
To assess whether ITIH3 silencing regulates Bcl-2
signaling in other OC cells, Bcl-2, Bcl-xL, C-PARP and PARP protein
expression levels were evaluated before and after DDP treatment
using western blotting. The results demonstrated that before DDP
treatment, the proteins demonstrated no marked difference in
OVCAR3, OVCAR3-NC and OVCAR3-ITIH3 RNAi cells (Fig. 3D). Following 10 µM DDP treatment
for 36 h, Bcl-2 and Bcl-xL protein expression levels in
OVCAR3-ITIH3 RNAi cells were significantly higher than those in
OVCAR3 and OVCAR3-NC cells (Fig.
3D), whereas C-PARP protein expression levels were
significantly lower (Fig. 3D).
These results indicated that following ITIH3 silencing, the
inhibitory Bcl-2 pathway in OVCAR3 cells was significantly
activated by DDP treatment.
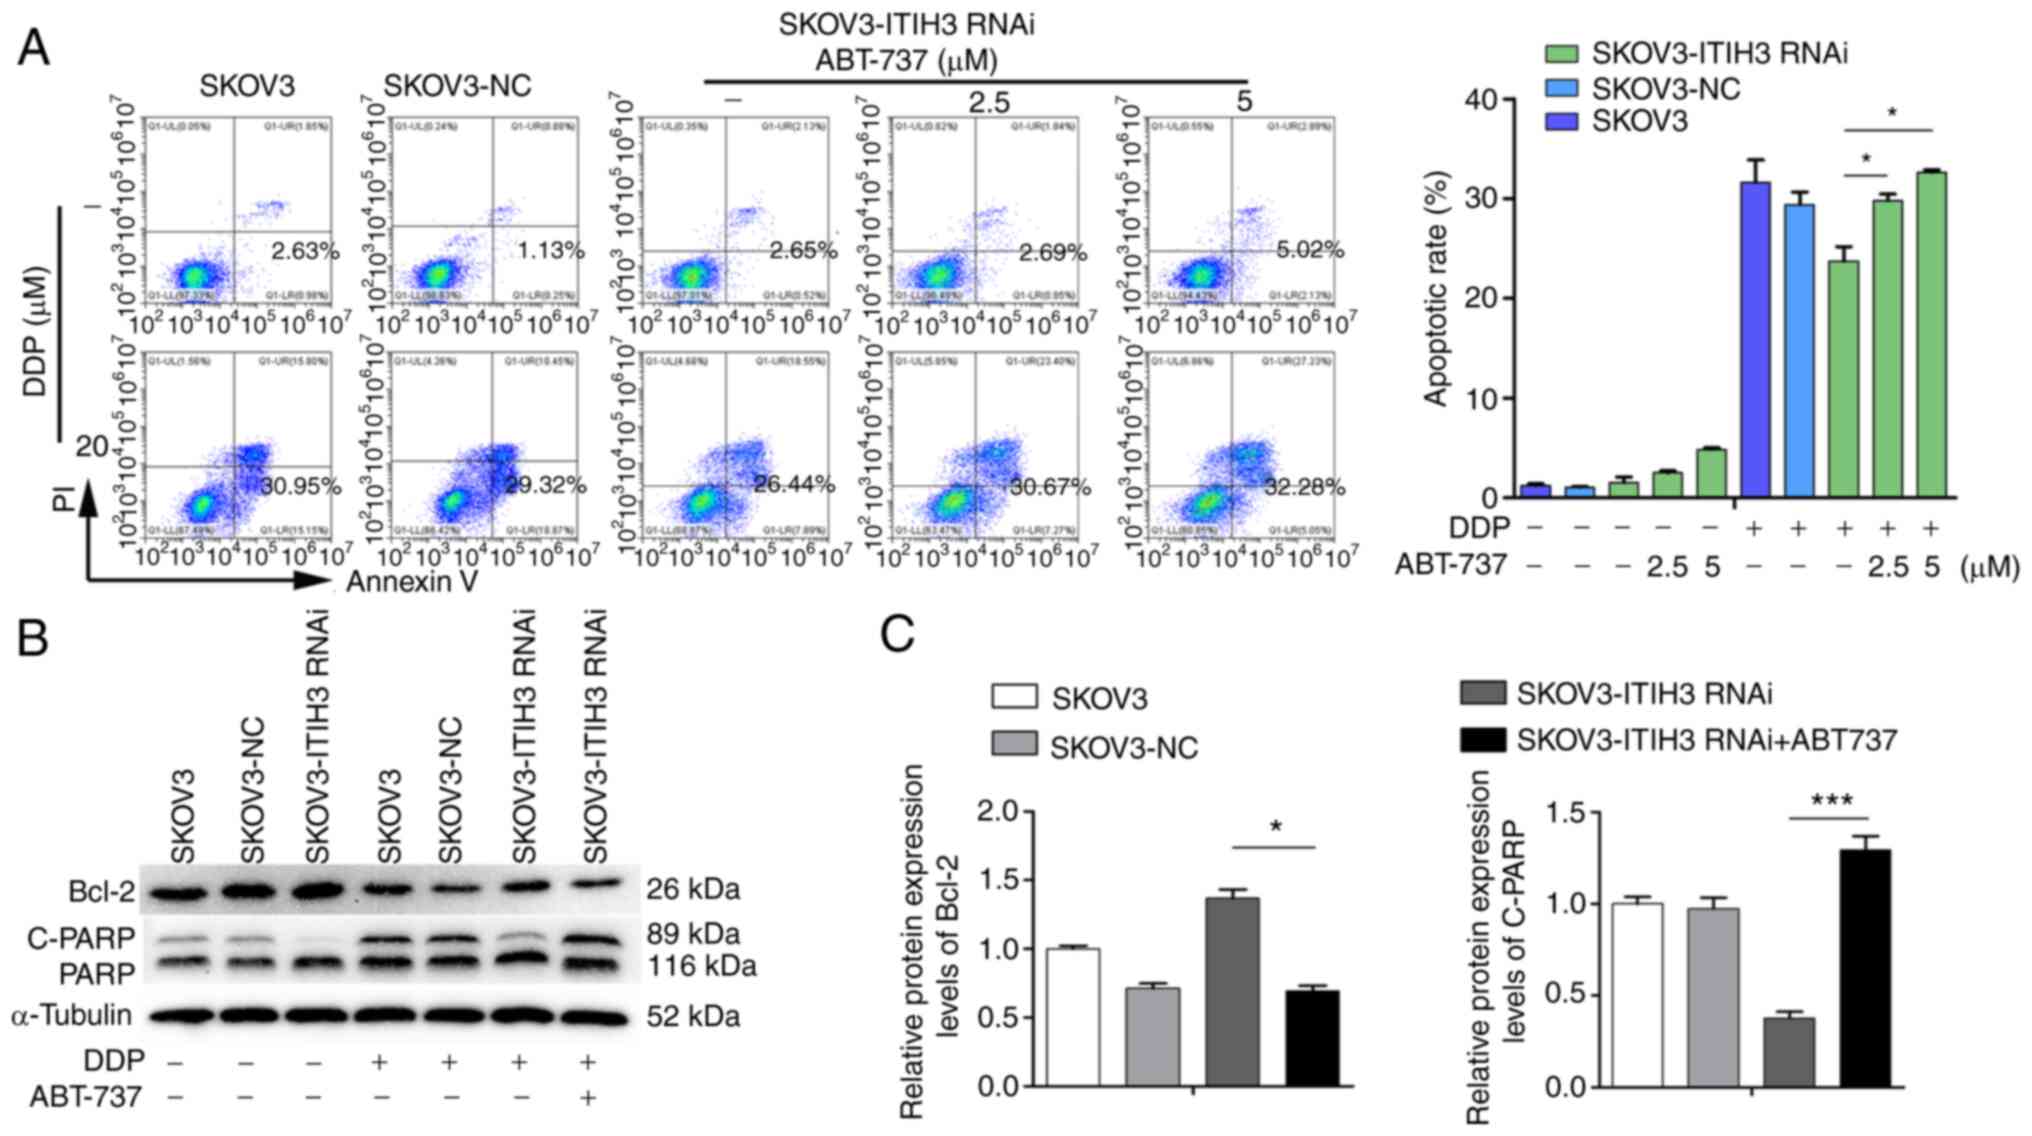
Bcl-2 inhibitor ABT-737 reverses DDP
resistance induced by ITIH3
The proportion of apoptotic cells in the SKOV3-ITIH3
RNAi cell line was not significantly increased following treatment
with 2.5 µM ABT-737 for 48 h but was markedly increased after
treatment with 5 µM ABT-737 compared with the untreated SKOV3-ITIH3
RNAi cells (Fig. 4A). However, the
proportion of apoptotic SKOV3-ITIH3 RNAi cells following DDP (20
µM) and ABT-737 (2.5 and 5 µM) co-treatment for 48 h was
significantly higher than with DDP alone for 48 h, which was
similar to that of control SKOV3 and SKOV3-NC cells (Fig. 4A). Compared with treated DDP (10
µM) alone for 48 h, the protein expression levels of Bcl-2 in the
SKOV3-ITIH3 RNAi cell line cotreated with DDP (10 µM) and ABT-737
(2.5 µM) were significantly decreased (Fig. 4B and C) and C-PARP protein
expression levels were significantly increased, with similar
protein expression levels to SKOV3 and SKOV3-NC cells.
ITIH3 may be an upstream regulator of
the Bcl-2 family that promotes apoptosis induced by DDP in
vivo
To evaluate the Bcl-2 induced apoptosis mechanisms,
a subcutaneous murine xenograft model of SKOV3-ITIH3 RNAi cells and
SKOV3-NC cells treated with DDP was established (Fig. 5A). In vivo experiments
demonstrated that ITIH3 silencing enhanced DDP resistance in the
xenograft nude mouse models; tumor volumes of the SKOV3-ITIH3 RNAi
group were significantly higher than in the SKOV3-NC group
following 5 and 8 DDP injections (Fig.
5B and C). Western blotting of xenograft tumor proteins in nude
mice demonstrated that protein expression levels in the SKOV3-ITIH3
RNAi group were similar to the SKOV3/DDPII group under the
treatment of DDP. The expression levels of the pro-survival Bcl-2
and Bcl-xL proteins in the SKOV3-ITIH3 RNAi group were
significantly increased following 2, 5 and 8 DDP injections
compared with in SKOV3-NC group (Fig.
5D). P-Bcl-2 (Thr56) protein in the SKOV3-ITIH3 RNAi group was
significantly decreased following 0, 5 and 8 DDP injections
compared with in SKOV3-NC group (Fig.
5D). These results were substantiated by the altered expression
levels of downstream proteins. The protein expression levels of
C-caspase 3, caspase 3 and C-PARP in the SKOV3-ITIH3 RNAi group
were significantly lower than those in the SKOV3-NC group (Fig. 5D).
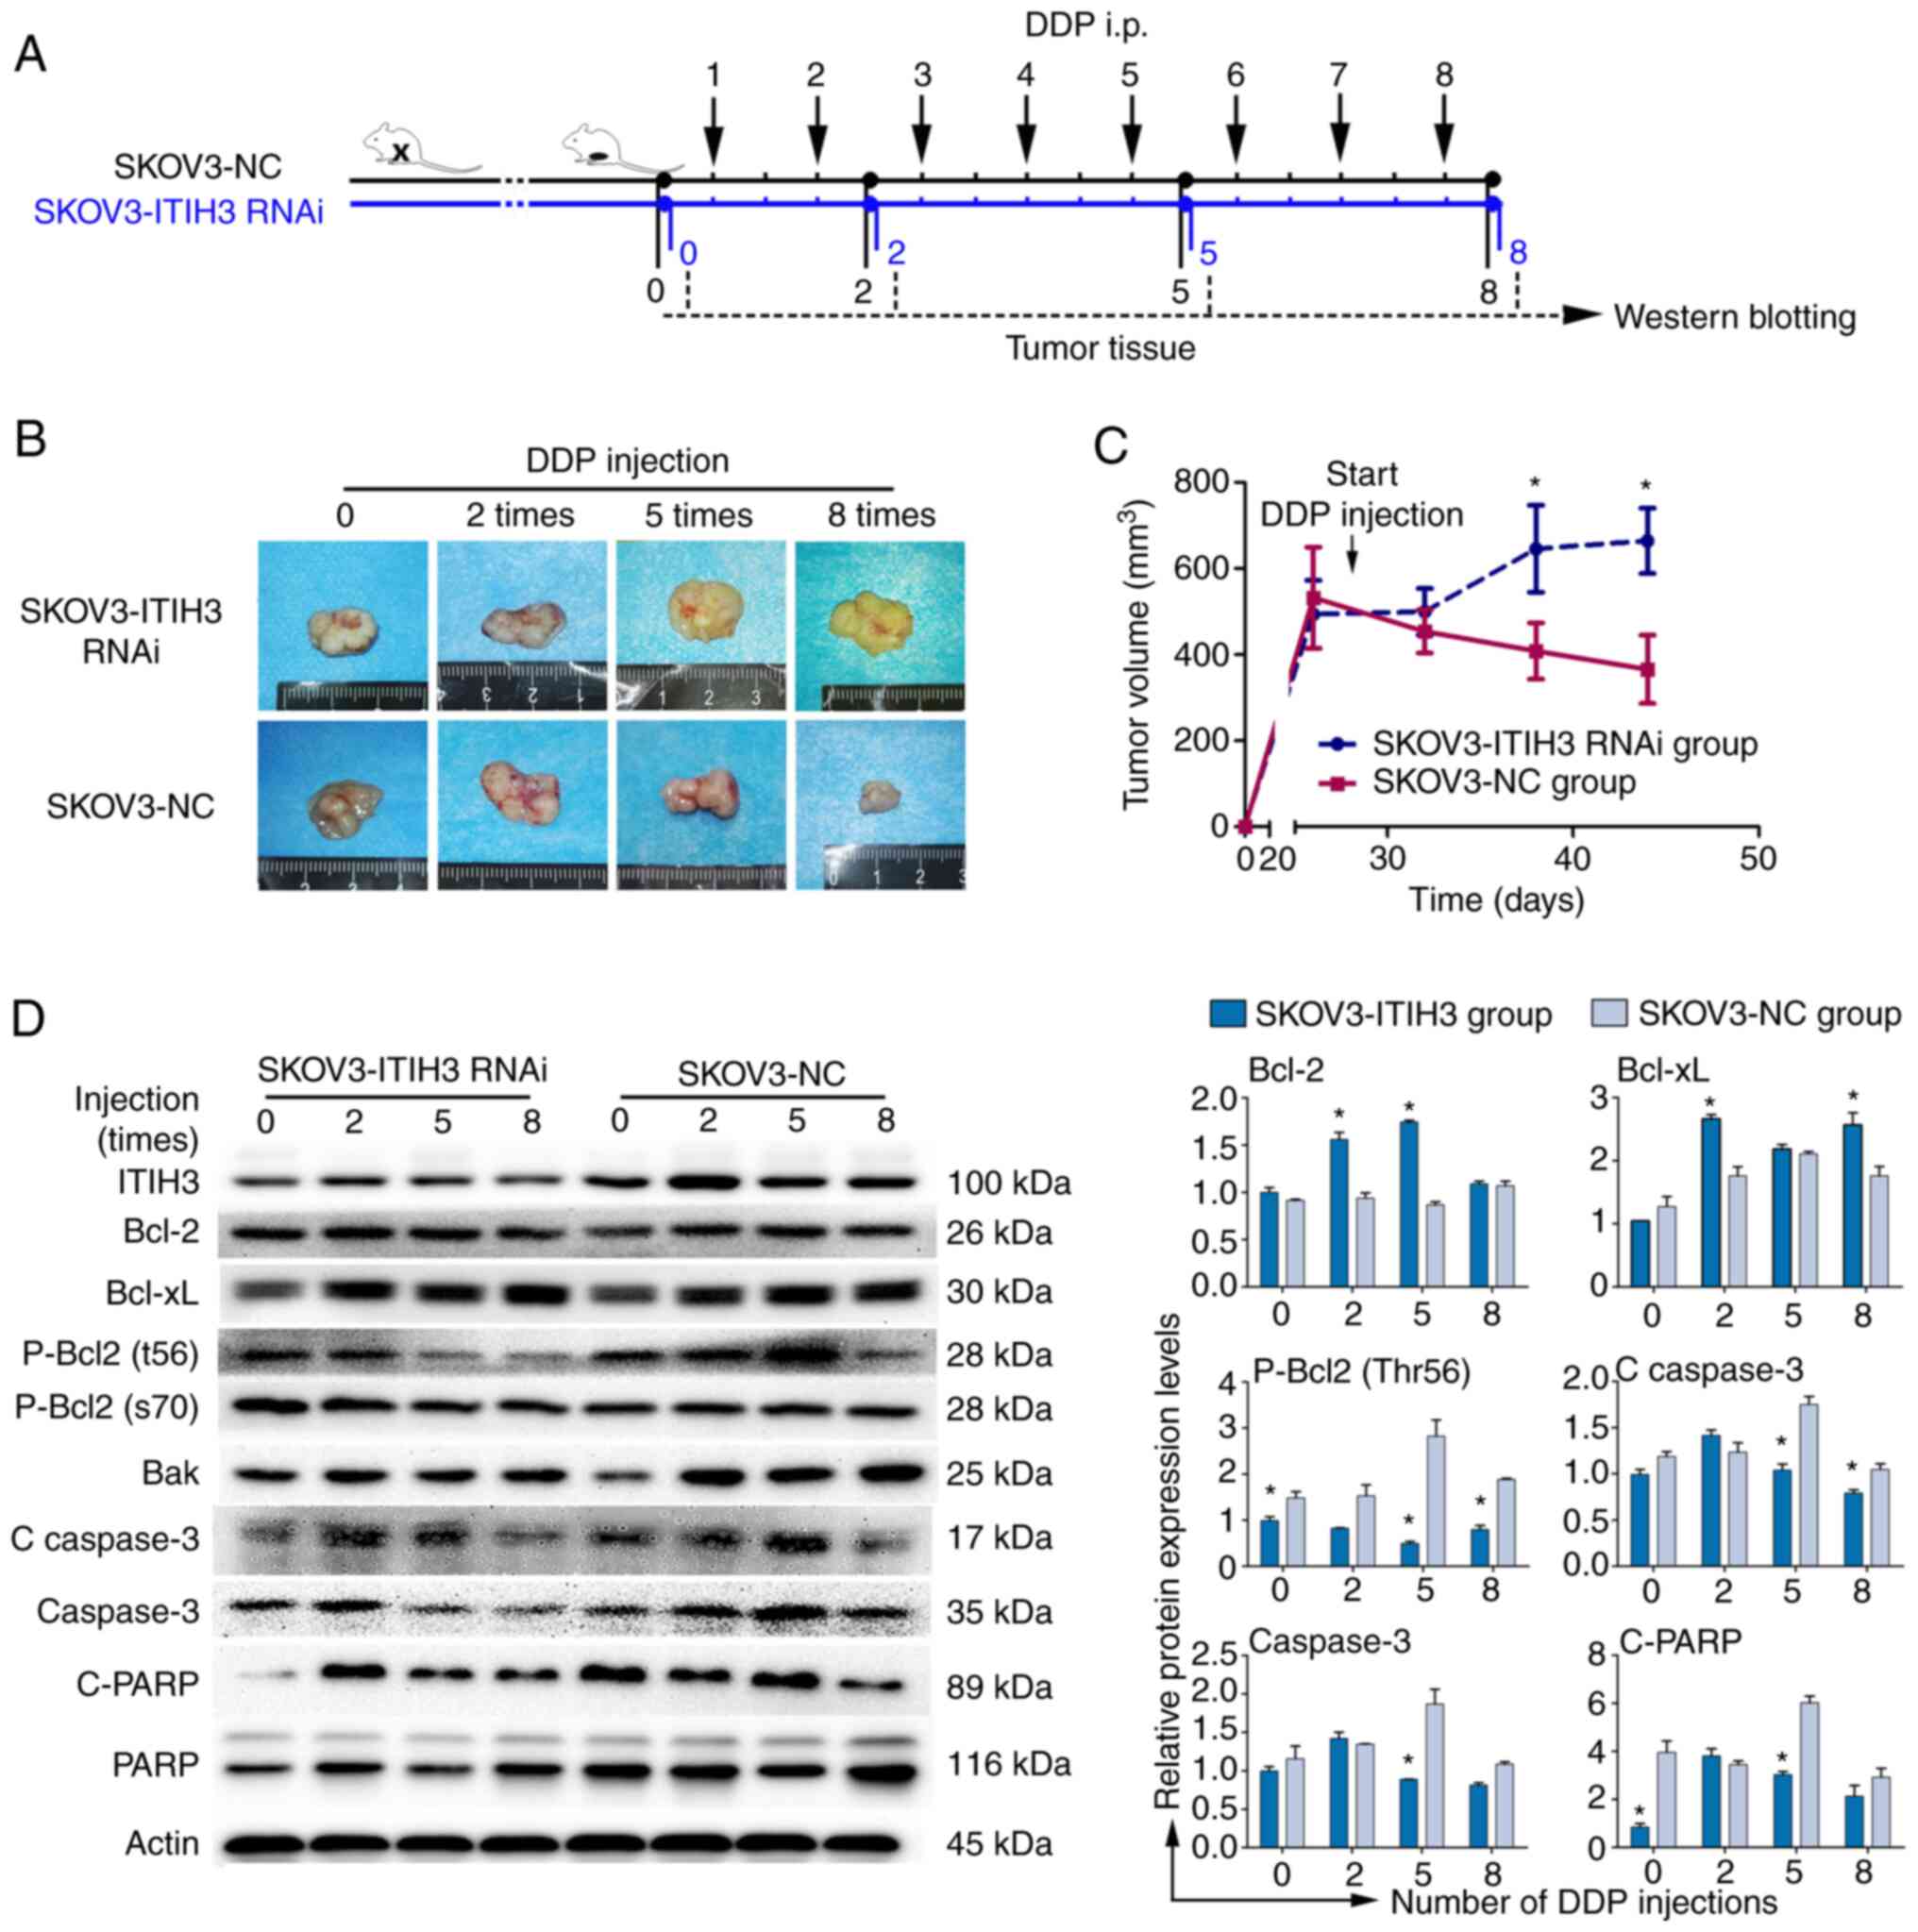 | Figure 5.ITIH3 promotes Bcl-2 signaling in
vivo. (A) Overview of the workflow in the mouse study. (B)
Representative examples of SKOV3-ITIH3 RNAi- and SKOV3-NC-derived
subcutaneous allograft tumors after 0, 2, 5 and 8 intraperitoneal
DDP injections. (C) Tumor volumes were recorded from the date of
injection to the end of the study (n=5/group). (D) Western blotting
of ITIH3, Bcl-2, Bcl-xL, p-Bcl-2 (Thr56), p-Bcl-2 (ser70), Bak,
cleaved caspase 3, caspase 3, C-PARP and PARP protein expression
levels in SKOV3-NC, SKOV3-ITIH3 RNAi, SKOV3 and SKOV3/DDPII
subcutaneous allograft tumor cells following 0, 2, 5 and 8
intraperitoneal DDP injections. GAPDH was used as a loading
control. Data are presented as the mean ± standard deviation of
three independent experiments. *P<0.05, vs. SKOV3-NC group. C,
cleaved; RNAi, RNA interference; ITIH3, inter-α-trypsin inhibitor
heavy chain 3; DDP, cisplatin; NC, negative control. |
Discussion
At present, platinum-based chemotherapy combined
with paclitaxel administration is the first-line chemotherapy
regimen for OC (3). DDP resistance
in OC cells is the primary reason for the failure of chemotherapy
treatment (4). Therefore, it is
necessary to understand the molecules that regulate chemoresistance
and to evaluate novel methods to circumvent multidrug resistance.
iTRAQ proteomic profiling in the SKOV3 and SKOV3/DDPII xenograft
models demonstrated that with an increase in the number of DDP
injections, ITIH3 protein expression levels in mice injected with
drug-resistant SKOV3/DDPII cells was markedly lower than in the
control group, which was consistent with western blotting results.
These results indicated that ITIH3 may be involved in the increased
sensitivity of OC cells to chemotherapy. Subsequently, the
association between ITIH3 protein expression levels and prognosis
was assessed in tumor tissue from patients with OC. The results
demonstrated that the OS of the high ITIH3 protein expression level
group was significantly higher than the low ITIH3 protein
expression group. Furthermore, in a preliminary study (5,23),
the association between ITIH3 protein expression levels and key
Bcl-2 signaling pathway proteins, as well as the OS of patients
with high and low protein expression levels of Bcl-2 in OC were
assessed using The Cancer Genome Atlas database (24). The results demonstrated that the
protein expression levels of Bcl-2 were not significantly
associated with to prognosis in OC tissues without chemotherapy
(data not shown), therefore the Bcl-2 protein expression of TMAs
was not assessed in the present study. The results of the present
study indicated that loss of ITIH3 protein expression was
associated with poor prognosis in patients with late-stage OC.
An increasing number of studies have reported that
ITIH3 protein expression levels are abnormally elevated in the
blood of patients with various tumors, such as pancreatic, early
gastric and colorectal cancer, and may serve as a new tumor marker
(9–13). Moreover, several studies have
reported that the ITIH3 gene is significantly downregulated in
numerous human solid tumors (8,25).
ITIH3 mRNA is reported to be highly expressed in healthy ovaries
but downregulated in 71% of OC cases, which indicates that ITIH3
may be an OC suppressor gene (8).
The function of the ITIH3 gene and its role in the development of
OC is not fully known. In the present study, ITIH3 silencing
significantly increased SKOV3 cell resistance to DDP and increased
DDP-mediated colony formation of SKOV3 cells. Furthermore, ITIH3
silencing significantly decreased DDP-induced apoptosis of SKOV3
cells. These results suggested that ITIH3 may be a key upstream
molecule for the regulation of platinum resistance in OC.
The most common mechanism of tumor cell death in
platinum-based chemotherapy is apoptosis (26), programmed cell death process
regulated by numerous signaling molecules (27). The Bcl-2 family has been reported
to serve an important role in the mitochondrial apoptosis pathway
(28,29). Bcl-2, Bcl-xL and Mcl-1 bind to the
outer mitochondrial membrane and exert anti-apoptotic effects by
inhibiting cytochrome C release and caspase activation (30). Pro-apoptotic proteins such as Bax,
Bak and Bim primarily act on the outer mitochondrial membrane,
where they form microporous channels to increase membrane
permeability and cause cytochrome C release, which leads to
apoptosis (30). In the present
study, expression levels of Bcl-2 family proteins demonstrated no
significant difference between ITIH3 RNAi cells and the control
cells before DDP treatment. However, protein expression levels of
Bcl-2 family anti-apoptotic Bcl-2, Bcl-xL and Mcl-1 were
significantly upregulated in ITIH3 RNAi cells compared with control
cells following treatment with the same concentration of DDP.
Furthermore, after DDP treatment, there was no significant change
in expression levels of Bcl-2 family pro-apoptotic proteins such as
Bak and Bax, whereas expression levels of downstream apoptosis
proteins cleaved caspase3, caspase 3 and C-PARP were significantly
downregulated in ITIH3 RNAi cells. The Bcl-2 inhibitor ABT-737
significantly reversed the decreased apoptotic rate in SKOV3 cells
induced by silencing ITIH3. Moreover, ABT-737 induced
downregulation of Bcl-2 expression and upregulated C-PARP
expression in SKOV3-ITIH3 RNAi cells. Taken together, these results
indicated that ITIH3 was involved in the development of the
resistance of cancer cells to DDP treatment by regulating both pro-
and anti-apoptotic Bcl-2 family member-dependent pathways.
The common phosphorylation sites of Bcl-2 are Ser70,
Ser87, Thr74 and Thr56 (31). A
previous study reported that dephosphorylation, even at a single
site, significantly increases resistance to apoptosis (32). When cells are exposed to drugs,
Bcl-2 is usually phosphorylated to decrease or even lose its
anti-apoptotic ability, which leads to apoptosis (32,33).
The in vivo animal experiments of the present study
demonstrated that with an increased number of DDP doses, Bcl-2 and
Bcl-xL protein expression levels in the SKOV3-ITIH3 RNAi group
markedly increased and phosphorylated Bcl-2 (Thr56) protein
expression levels decreased. This result indicated that the
anti-apoptotic ability of the SKOV3-ITIH3 RNAi group was higher
than the control group, which was substantiated by changes in
downstream caspase and C-PARP protein expression levels. Moreover,
both in vivo and in vitro experiments demonstrated
that following ITIH3 silencing, expression levels of proteins in
the Bcl-2 signaling pathway, especially anti-apoptotic proteins,
markedly increased, which led to enhanced tumor cell resistance to
DDP. Moreover, silencing of ITIH3 could attenuate DDP-induced
apoptosis via the Bcl-2 signaling pathway.
ITIH3 is one of five heavy chain proteins (ITIH1,
ITIH2, ITIH3, ITIH4 and ITIH5) that comprise the intertype trypsin
inhibitor family and can covalently bind hyaluronic acid (34). ITIH3 has been reported to be
associated with various solid tumors and diseases, as well as
mental health conditions (35,36),
rheumatoid arthritis (37) and
sepsis (15), which indicates its
potential research value. It was hypothesized that ITIH3 expression
was associated with activation of platinum sensitivity in OC. The
in vivo and in vitro experiments of the present study
demonstrated that ITIH3 participated in controlling the sensitivity
of OC cells to DDP via regulation of the Bcl-2 signaling pathway
and that Bcl-2 inhibitors reversed this phenomenon. However, the
specific regulatory mechanism remains unclear. The ITI protein
family is widely hypothesized to serve a key role in extracellular
matrix biology (38–40). Our previous study demonstrated that
intracellular DDP accumulation in SKOV3 cells was 6.4-fold higher
than in SKOV3/DDPII cells following addition of DDP (5). Overall, the results of the present
study suggested that ITIH3 may affect the concentration of platinum
drugs in these cells. The study presents some limitations. The
first is only one DDP-resistance cell line was tested in this
study. The second limitation is the lack of ITIH3 overexpression
experiments in DDP-resistance cell line. Nonetheless, further
studies in de novo resistant cell lines or DDP resistance
tumor tissues are required to support the results of the present
study.
To the best of our knowledge, this is the first
study to demonstrated the association between ITIH3 downregulation
in tumor cells and enhanced drug resistance in vivo and
in vitro. Following ITIH3 silencing, expression levels of
proteins in the Bcl-2 signaling pathway, especially anti-apoptotic
proteins, markedly increased, which led to increased drug
resistance in tumor cells. Therefore, the results of the present
study indicated that ITIH3 was a potential biomarker of DDP
resistance in OC.
Acknowledgements
The authors would like to Professor Beihua Kong
(Qilu Hospital of Shandong University, Jinan, China) for providing
the tissue arrays for ovarian cancer. The authors would also thank
Professor Hani Gabra (Imperial College London, London, UK) for
providing SKOV3 cells.
Funding
The present study was funded by grants from The National Natural
Science Foundation of China (grant nos. 81860459 and 82172695), The
Guangxi Science and Technology Program (grant nos. AB1850003 and
AA18242040), The National High-Tech Research and Development
Program (863 Program; grant no. 2014AA020605) and The Key
Laboratory of Early Prevention and Treatment for Regional High
Frequency Tumor (Guangxi Medical University), Ministry of Education
(grant nos. GKEZZ202016 and GKE2019-ZZ14).
Availability of data and materials
The datasets used and/or analyzed during the current
study are available from the corresponding author on reasonable
request.
Authors' contributions
Conceptualization was performed by QW, DY and YF.
Research methods were carried out by QW, DY, CY, YL, LS, ML, HL and
XC. Data analysis was performed by YL, LS, CY, YF and XC. YL wrote
the original draft of the manuscript. Funding was acquired by QW
and CY. All authors have read and approved the final manuscript.
YL, LS and QW confirm the authenticity of all the raw data.
Ethics approval and consent to
participate
The study involving human participants was approved
by The Scientific Ethics Committee of Qilu Hospital of Shandong
University (approval no. KYLL-2013-130). All participants provided
written informed consent for this study. All procedures were
performed in accordance with relevant guidelines and regulations.
All animal experiments were approved by the Animal Ethics Committee
of Guangxi Medical University Affiliated Tumor Hospital (approval
no. 2021057). The animal study was performed in compliance with the
Animal Research: Reporting of In Vivo Experiments guidelines
and all methods were performed in accordance with relevant
guidelines and regulations.
Patient consent for publication
Not applicable.
Competing interests
The authors declare that they have no competing
interests.
References
|
1
|
Siegel RL, Miller KD and Jemal A: Cancer
statistics, 2020. CA Cancer J Clin. 70:7–30. 2020. View Article : Google Scholar : PubMed/NCBI
|
|
2
|
Rottenberg S, Disler C and Perego P: The
rediscovery of platinum-based cancer therapy. Nat Rev Cancer.
21:37–50. 2021. View Article : Google Scholar : PubMed/NCBI
|
|
3
|
Kuroki L and Guntupalli SR: Treatment of
epithelial ovarian cancer. BMJ. 371:m37732020. View Article : Google Scholar : PubMed/NCBI
|
|
4
|
Matulonis UA, Sood AK, Fallowfield L,
Howitt BE, Sehouli J and Karlan BY: Ovarian cancer. Nat Rev Dis
Primers. 2:160612016. View Article : Google Scholar : PubMed/NCBI
|
|
5
|
Shi L, Yu H, Zhang W, Li L and Wang Q:
Establishment and biological characteristics of a
platinum-resistance nude mouse model in epithelial ovarian cancer.
Zhonghua Fu Chan Ke Za Zhi. 49:523–530. 2014.(In Chinese).
PubMed/NCBI
|
|
6
|
Bost F, Diarra-Mehrpour M and Martin JP:
Inter-alpha-trypsin inhibitor proteoglycan family-a group of
proteins binding and stabilizing the extracellular matrix. Eur J
Biochem. 252:339–346. 1998. View Article : Google Scholar : PubMed/NCBI
|
|
7
|
Zhuo L, Hascall VC and Kimata K:
Inter-alpha-trypsin inhibitor, a covalent
protein-glycosaminoglycan-protein complex. J Biol Chem.
279:38079–38082. 2004. View Article : Google Scholar : PubMed/NCBI
|
|
8
|
Hamm A, Veeck J, Bektas N, Wild PJ,
Hartmann A, Heindrichs U, Kristiansen G, Werbowetski-Ogilvie T, Del
Maestro R, Knuechel R and Dahl E: Frequent expression loss of
Inter-alpha-trypsin inhibitor heavy chain (ITIH) genes in multiple
human solid tumors: A systematic expression analysis. BMC Cancer.
8:252008. View Article : Google Scholar : PubMed/NCBI
|
|
9
|
Kopylov AT, Stepanov AA, Malsagova KA,
Soni D, Kushlinsky NE, Enikeev DV, Potoldykova NV, Lisitsa AV and
Kaysheva AL: Revelation of proteomic indicators for colorectal
cancer in initial stages of development. Molecules. 25:6192020.
View Article : Google Scholar : PubMed/NCBI
|
|
10
|
Liu X, Zheng W, Wang W, Shen H, Liu L, Lou
W, Wang X and Yang P: A new panel of pancreatic cancer biomarkers
discovered using a mass spectrometry-based pipeline. Br J Cancer.
118:e152018. View Article : Google Scholar : PubMed/NCBI
|
|
11
|
Peng H, Pan S, Yan Y, Brand RE, Petersen
GM, Chari ST, Lai LA, Eng JK, Brentnall TA and Chen R: Systemic
proteome alterations linked to early stage pancreatic cancer in
diabetic patients. Cancers (Basel). 12:15342020. View Article : Google Scholar : PubMed/NCBI
|
|
12
|
Chong PK, Lee H, Zhou J, Liu SC, Loh MC,
Wang TT, Chan SP, Smoot DT, Ashktorab H, So JB, et al: ITIH3 is a
potential biomarker for early detection of gastric cancer. J
Proteome Res. 9:3671–3679. 2010. View Article : Google Scholar : PubMed/NCBI
|
|
13
|
Dufresne J, Bowden P, Thavarajah T,
Florentinus-Mefailoski A, Chen ZZ, Tucholska M, Norzin T, Ho MT,
Phan M, Mohamed N, et al: The plasma peptides of breast versus
ovarian cancer. Clin Proteomics. 16:432019. View Article : Google Scholar : PubMed/NCBI
|
|
14
|
Ivancic MM, Huttlin EL, Chen X, Pleiman
JK, Irving AA, Hegeman AD, Dove WF and Sussman MR: Candidate serum
biomarkers for early intestinal cancer using 15N metabolic labeling
and quantitative proteomics in the ApcMin/+ mouse. J Proteome Res.
12:4152–4166. 2013. View Article : Google Scholar : PubMed/NCBI
|
|
15
|
Thavarajah T, Dos Santos CC, Slutsky AS,
Marshall JC, Bowden P, Romaschin A and Marshall JG: The plasma
peptides of sepsis. Clin Proteomics. 17:262020. View Article : Google Scholar : PubMed/NCBI
|
|
16
|
Feng Y, Tang Y, Mao Y, Liu Y, Yao D, Yang
L, Garson K, Vanderhyden BC and Wang Q: PAX2 promotes epithelial
ovarian cancer progression involving fatty acid metabolic
reprogramming. Int J Oncol. 56:697–708. 2020.PubMed/NCBI
|
|
17
|
Dongol S, Zhang Q, Qiu C, Sun C, Zhang Z,
Wu H and Kong B: IQGAP3 promotes cancer proliferation and
metastasis in high-grade serous ovarian cancer. Oncol Lett.
20:1179–1192. 2020. View Article : Google Scholar : PubMed/NCBI
|
|
18
|
Wu H, Li R, Zhang Z, Jiang H, Ma H, Yuan
C, Sun C, Li Y and Kong B: Kallistatin inhibits tumour progression
and platinum resistance in high-grade serous ovarian cancer. J
Ovarian Res. 12:1252019. View Article : Google Scholar : PubMed/NCBI
|
|
19
|
Meng Q, Duan P, Li L and Miao Y:
Expression of placenta growth factor is associated with unfavorable
prognosis of advanced-stage serous ovarian cancer. Tohoku J Exp
Med. 244:291–296. 2018. View Article : Google Scholar : PubMed/NCBI
|
|
20
|
Zhang R, Hao J, Wu Q, Guo K, Wang C, Zhang
WK, Liu W, Wang Q and Yang X: Dehydrocostus lactone inhibits cell
proliferation and induces apoptosis by PI3K/Akt/Bad and ERS
signalling pathway in human laryngeal carcinoma. J Cell Mol Med.
24:6028–6042. 2020. View Article : Google Scholar : PubMed/NCBI
|
|
21
|
Wang Q, Tang Y, Yu H, Yin Q, Li M, Shi L,
Zhang W, Li D and Li L: CCL18 from tumor-cells promotes epithelial
ovarian cancer metastasis via mTOR signaling pathway. Mol Carcinog.
55:1688–1699. 2016. View Article : Google Scholar : PubMed/NCBI
|
|
22
|
Kilkenny C, Browne WJ, Cuthill IC, Emerson
M and Altman DG: Improving bioscience research reporting: The
ARRIVE guidelines for reporting animal research. PLoS Biol.
8:e10004122010. View Article : Google Scholar : PubMed/NCBI
|
|
23
|
Chen F, Sun F, Liu X, Shao J and Zhang B:
Glaucocalyxin A inhibits the malignant progression of epithelial
ovarian cancer by affecting the
MicroRNA-374b-5p/HMGB3/Wnt-β-catenin pathway axis. Front Oncol.
12:9558302022. View Article : Google Scholar : PubMed/NCBI
|
|
24
|
Wang Z, Jensen MA and Zenklusen JC: A
Practical guide to the cancer genome atlas (TCGA). Methods Mol
Biol. 1418:111–141. 2016. View Article : Google Scholar : PubMed/NCBI
|
|
25
|
Jiang X, Bai XY, Li B, Li Y, Xia K, Wang
M, Li S and Wu H: Plasma inter-alpha-trypsin inhibitor heavy chains
H3 and H4 serve as novel diagnostic biomarkers in human colorectal
cancer. Dis Markers. 2019:50696142019. View Article : Google Scholar : PubMed/NCBI
|
|
26
|
Wijdeven RH, Pang B, Assaraf YG and
Neefjes J: Old drugs, novel ways out: Drug resistance toward
cytotoxic chemotherapeutics. Drug Resist Updat. 28:65–81. 2016.
View Article : Google Scholar : PubMed/NCBI
|
|
27
|
Wlodkowic D, Telford W, Skommer J and
Darzynkiewicz Z: Apoptosis and beyond: Cytometry in studies of
programmed cell death. Methods Cell Biol. 103:55–98. 2011.
View Article : Google Scholar : PubMed/NCBI
|
|
28
|
Martinou JC and Youle RJ: Mitochondria in
apoptosis: Bcl-2 family members and mitochondrial dynamics. Dev
Cell. 21:92–101. 2011. View Article : Google Scholar : PubMed/NCBI
|
|
29
|
Youle RJ and Strasser A: The BCL-2 protein
family: Opposing activities that mediate cell death. Nat Rev Mol
Cell Biol. 9:47–59. 2008. View Article : Google Scholar : PubMed/NCBI
|
|
30
|
Singh R, Letai A and Sarosiek K:
Regulation of apoptosis in health and disease: The balancing act of
BCL-2 family proteins. Nat Rev Mol Cell Biol. 20:175–193. 2019.
View Article : Google Scholar : PubMed/NCBI
|
|
31
|
Maundrell K, Antonsson B, Magnenat E,
Camps M, Muda M, Chabert C, Gillieron C, Boschert U, Vial-Knecht E,
Martinou JC and Arkinstall S: Bcl-2 undergoes phosphorylation by
c-Jun N-terminal kinase/stress-activated protein kinases in the
presence of the constitutively active GTP-binding protein Rac1. J
Biol Chem. 272:25238–25242. 1997. View Article : Google Scholar : PubMed/NCBI
|
|
32
|
Yamamoto K, Ichijo H and Korsmeyer SJ:
BCL-2 is phosphorylated and inactivated by an ASK1/Jun N-terminal
protein kinase pathway normally activated at G(2)/M. Mol Cell Biol.
19:8469–8478. 1999. View Article : Google Scholar : PubMed/NCBI
|
|
33
|
Huang ST and Cidlowski JA: Phosphorylation
status modulates Bcl-2 function during glucocorticoid-induced
apoptosis in T lymphocytes. FASEB J. 16:825–832. 2002. View Article : Google Scholar : PubMed/NCBI
|
|
34
|
Ebana Y, Ozaki K, Inoue K, Sato H, Iida A,
Lwin H, Saito S, Mizuno H, Takahashi A, Nakamura T, et al: A
functional SNP in ITIH3 is associated with susceptibility to
myocardial infarction. J Hum Genet. 52:220–229. 2007. View Article : Google Scholar : PubMed/NCBI
|
|
35
|
Xie X, Meng H, Wu H, Hou F, Chen Y, Zhou
Y, Xue Q, Zhang J, Gong J, Li L and Song R: Integrative analyses
indicate an association between ITIH3 polymorphisms with autism
spectrum disorder. Sci Rep. 10:52232020. View Article : Google Scholar : PubMed/NCBI
|
|
36
|
Li K, Li Y, Wang J, Huo Y, Huang D, Li S,
Liu J, Li X, Liu R, Chen X, et al: A functional missense variant in
ITIH3 affects protein expression and neurodevelopment and confers
schizophrenia risk in the Han Chinese population. J Genet Genomics.
47:233–248. 2020. View Article : Google Scholar : PubMed/NCBI
|
|
37
|
Liao CC, Chou PL, Cheng CW, Chang YS, Chi
WM, Tsai KL, Chen WJ, Kung TS, Tai CC, Lee KW, et al: Comparative
analysis of novel autoantibody isotypes against
citrullinated-inter-alpha-trypsin inhibitor heavy chain 3
(ITIH3)(542–556) peptide in serum from Taiwanese females with
rheumatoid arthritis, primary Sjögren's syndrome and secondary
Sjögren's syndrome in rheumatoid arthritis. J Proteomics. 141:1–11.
2016. View Article : Google Scholar : PubMed/NCBI
|
|
38
|
Cuvelier A, Muir JF, Martin JP and Sesboüé
R: Proteins of the inter-alpha trypsin inhibitor (ITI) family. A
major role in the biology of the extracellular matrix. Rev Mal
Respir. 17:437–446. 2000.(In French). PubMed/NCBI
|
|
39
|
Zhuo L and Kimata K: Structure and
function of inter-alpha-trypsin inhibitor heavy chains. Connect
Tissue Res. 49:311–320. 2008. View Article : Google Scholar : PubMed/NCBI
|
|
40
|
Hennies HC: All is balanced:
Inter-α-trypsin inhibitors as unseen extracellular matrix proteins
in epidermal morphology and differentiation. Exp Dermatol.
24:661–662. 2015. View Article : Google Scholar : PubMed/NCBI
|