Introduction
Pancreatic cancer (PC), which has a 5-year overall
survival (OS) rate of only ~10% (1), remains one of the most malignant
cancer types worldwide. PC is notorious for its high morbidity and
mortality rates (2). It has been
reported that close to 460,000 individuals were diagnosed with PC
and that there were >430,000 PC-related deaths worldwide in 2018
(2). Unlike other malignancies, the
incidence of PC has been slowly growing for decades, which brings a
tremendous economic burden (3).
The extracellular matrix (ECM) is an important
non-cellular component of the tumor microenvironment. The ECM not
only provides a physical scaffold for cells but also a depot for
cytokines that promote tumor development (4). The crosstalk between the ECM and
tumor-infiltrating immune cells (TIICs) serves a crucial role in
the progression of tumors (5).
Through remodeling of the ECM, cancer-associated fibroblasts can
facilitate the occurrence and development of cancer (6). Mast cells can serve as tumor
contributors to simulate angiogenesis and degradation of the ECM
(7,8). Furthermore, the ECM and
immune-associated mechanisms are involved in the development and
progression of PC (9,10). Due to the low radical resection
rate, chemotherapy and immune-therapy resistance, little progress
has been made in the management of PC during the past decades
(11). Therefore, investigation of
effective and reliable biomarkers for the diagnosis and treatment
of PC is urgently required to improve survival rates.
Type VII collagen, which is encoded by collagen type
VII α1 chain (COL7A1), is distributed to the basal area beneath the
squamous epithelium (12,13). It is composed of three α collagen
chains and acts as an anchoring fiber between the external
epithelium and underlying substrate (12). Mutations of COL7A1 can result in
recessive dystrophic epidermolysis bullosa (RDEB), which is an
incurable autoimmune disease and associated with increased risk of
skin carcinoma (13). In squamous
cell carcinoma, the loss of type VII collagen can enhance tumor
cell invasive behavior and promotes epithelial-mesenchymal
transition (14). Aberrant COL7A1
expression has been reported in esophageal cancer and COL7A1
expression has been reported to be positively associated with depth
of invasion and lymph node metastasis, and negatively associated
with survival (15,16). In gastric carcinoma, COL7A1
expression has been reported to be upregulated in cancer tissues
compared with normal tissues (17).
High intracellular COL7A1 expression has been reported to indicate
a poor 5-year OS and a high immunohistochemistry score is
associated with distant metastasis (17). However, little is known regarding
the prognostic role of COL7A1 and its association with TME in
PC.
To better evaluate the value of COL7A1 in the
assessment of the progression of PC, RNA sequencing (RNA-seq) data
from The Cancer Genome Atlas (TCGA), Gene Expression Omnibus (GEO)
and Genotype-Tissue Expression (GTEx) databases were downloaded.
Cox and logistic regression analyses, Kaplan-Meier survival
analysis and nomograms were used to evaluate the prognostic role of
COL7A1. Gene Ontology (GO) analysis, Kyoto Encyclopedia of Genes
and Genomes (KEGG) analysis and Gene Set Enrichment Analysis (GSEA)
were used to evaluate the underlying mechanisms of COL7A1.
Single-sample GSEA (ssGSEA) was used to assess the relationship
between COL7A1 expression and TIICs. Furthermore, reverse
transcription-quantitative PCR (RT-qPCR) was used to validate
COL7A1 mRNA expression in PC cell lines.
Materials and methods
RNA-seq data acquisition and
analysis
All transcriptome RNA-seq data with clinical
information of patients with PC were accessed from TCGA [https://portal.gdc.cancer.gov; pancreatic
adenocarcinoma (PAAD) dataset] and normal pancreas expression data
were retrieved from the GTEx database (https://gtexportal.org), the aforementioned data was
downloaded using the University of California, Santa Cruz Xena
browser (https://xenabrowser.net/datapages/). RNA expression
data were retrieved from GEO (https://www.ncbi.nlm.nih.gov/geo/) (GSE15471 and
GSE101448 datasets).
COL7A1 mRNA expression in PC samples
and normal tissues
Boxplots and scatter plots were used to compare the
mRNA expression levels of COL7A1 in tumor and normal samples, the
ggplot2 package (v3.3.3) (18) was
used to generate the visualization. The expression levels of COL7A1
in TCGA and GTEx databases were compared using a Wilcoxon rank sum
test, COL7A1 expression was compared between normal and pancreatic
cancer tissues in GSE15471 using a Wilcoxon signed rank test, and
COL7A1 expression was compared between pancreatic cancer and normal
samples in GSE101448 using an unpaired t-test. In the present
study, the samples in GSE15471 dataset were paired tissues, while
in other instances, the normal tissues referred to unpaired
tissues. The diagnostic value of COL7A1 in patients with PC was
estimated using receiver operating characteristic (ROC) curves, the
pROC (v1.17.0.1) (19) and ggplot2
(v3.3.3) (18) packages were used
to analyze and visualize these data. The patients were divided into
two groups, COL7A1-high and COL7A1-low, based on the median
expression level.
Identification of differentially
expressed genes (DEGs)
The DESeq2 package (v1.26.0) (20) was used to identify DEGs between
COL7A1-high and COL7A1-low groups from TCGA. The criteria used were
|log (fold change)|>1 and adjusted P<0.05. The results were
presented as volcano plots and heat maps using the ggplot2 package
(v3.3.3) (18).
Enrichment analysis and immune cell
infiltration
To evaluate the biological effects of DEGs, GO
(geneontology.org) and KEGG (www.kegg.jp)
enrichment analyses were performed. The criteria for both GO and
KEGG analysis were as follows: A minimum count of 5, a maximum
count of 5,000, P<0.05 and false discovery rate (FDR)<0.25
were considered statistically significant. Furthermore, GSEA was
performed to assess potential biological functions and pathways in
the COL7A1-high and COL7A1-low groups. Gene sets with absolute
normalized enrichment score >1, nominal P<0.05 and
FDR<0.25 were considered to be statistically significant. The
c2.cp.kegg.v7.4.symbols.gmt and h.all.v7.4.symbols.gmt were
downloaded from the Molecular Signature Database (MSigDB)
(www.gsea-msigdb.org). All of the
enrichment analyses were performed using the clusterProfiler
package (v3.14.3) (21).
Furthermore, ssGSEA was used to perform immune infiltration
analysis using the GSVA package (v1.34.0) (22) and based on gene expression profiles,
the infiltration levels of 24 immune cell types (23) were quantified. To further evaluate
the association between COL7A1 mRNA expression and immune cell
infiltration levels, the data were assessed using Spearman
correlation and Wilcoxon rank sum tests.
Association of COL7A1 with prognosis
and model construction
OS, disease-specific survival (DSS) and
progression-free interval (PFI) were used to evaluate the
relationship between COL7A1 expression and prognosis in PC. The
Kaplan-Meier Plotter (kmplot.com) was used to evaluate survival
according to mRNA expression levels using the log-rank test and the
parameters selected were as follows: mRNA(RNA-seq) for pan-cancer,
split patient by median (24). To
analyze the prognostic value of COL7A1 mRNA expression in PC,
univariate and multivariate Cox analysis of TCGA-PAAD dataset was
performed. The median COL7A1 mRNA expression level was defined as
the cut-off value. Multivariate Cox analysis was then applied to
validate the independent prognostic value of COL7A1 mRNA expression
levels. Nomograms were constructed to evaluate the prognosis for
1-, 2- and 3-year OS for patients with PC a using the rms (v6.2-0)
(https://cran.r-project.org/web/packages/rms) and
survival (v3.2-10) (https://cran.r-project.org/web/packages/survival)
packages for analysis and visualization respectively.
Cell culture
The MIA PaCa-2 (CRM-CRL-1420), BxPC-3 (CRL-1687),
Capan-1 (HTB-79) and PATU-8988 (ACC 162) PC cell lines, and the
hTERT-HPNE (CRL-4023) human normal pancreatic duct cell line were
purchased from American Type Culture Collection. PANC-1, MIA
PaCa-2, PATU-8988 and HPNE cells were cultured in Dulbecco's
modified Eagle's medium (HyClone; Cytiva) containing 10% FBS
(HyClone; Cytiva), BxPC-3 cells were cultured in RPMI-1640 medium
(HyClone; Cytiva) containing 10% FBS (HyClone; Cytiva) and Capan-1
cells were cultured in Iscove's Modified Dulbecco's Medium
(HyClone; Cytiva) containing 20% FBS (HyClone; Cytiva). All cell
lines were cultured at 37°C in a 5% carbon dioxide cell culture
incubator.
RT-qPCR
Total RNA was extracted from cells using
TRIzol® (Invitrogen; Thermo Fisher Scientific, Inc.).
GoScript™ Reverse Transcription Mix (cat. no. A25742; Promega
Corporation) and PowerUP™ SYBR™ Green Master Mix (Thermo Fisher
Scientific, Inc.) were used for RT-qPCR assays according to the
manufacturers' protocols. The thermocycling conditions for qPCR
were as follows: Initial denaturation and polymerase activation at
95°C for 2 min, followed by 40 cycles of 95°C for 15 sec and 60°C
for 1 min. The 2−∆∆Cq (25) method was used to calculate relative
mRNA expression levels and GAPDH was used as the reference. The
primer sequences used in the present study were as follows: COL7A1
forward, 5′-GTTGGAGAGAAAGGTGACGAGG-3′ and reverse,
3′-TGGTCTCCCTTTTCACCCACAG-5′; and GAPDH forward,
5′-GTCTCCTCTGACTTCAACAGCG-3′ and reverse,
3′-ACCACCCTGTTGCTGTAGCCAA-5′.
Statistical analysis
RStudio software(version 1.4.171; http://www.rstudio.com) and R software (version 3.6.3;
http://www.r-project.org)were used to perform
statistical analyses. Two-tailed, unpaired Student's t-test was
used to compare two groups. The RT-qPCR data were analyzed using
one-way ANOVA and Dunnett's post hoc test. P<0.05 was considered
to indicate a statistically significant difference.
Results
COL7A1 mRNA expression in
pan-cancerous and PC samples
Using data from TCGA and GTEx databases the mRNA
expression levels of COL7A1 in human cancer types and normal
tissues were assessed. Compared with those in normal samples,
COL7A1 mRNA expression levels were significantly higher in bladder
urothelial carcinoma, cervical squamous cell carcinoma and
endocervical adenocarcinoma, cholangiocarcinoma, colon
adenocarcinoma, lymphoid neoplasm diffuse large B-cell lymphoma,
esophageal carcinoma, head and neck squamous cell carcinoma, liver
hepatocellular carcinoma, PAAD, pheochromocytoma and paraganglioma,
stomach adenocarcinoma and thymoma; however, COL7A1 was
significantly downregulated in adrenocortical carcinoma, breast
invasive carcinoma, glioblastoma multiforme, kidney chromophobe,
kidney renal clear cell carcinoma and kidney renal papillary cell
carcinoma (P<0.05; Fig. 1A).
Additionally, in PC, COL7A1 mRNA expression levels were
significantly higher compared with those in normal pancreas tissues
(Fig. 1B). Furthermore, the mRNA
expression levels of COL7A1 in PC and normal tissues were assessed
in the GSE15471 and GSE101448 datasets. In the GSE15471 dataset,
COL7A1 mRNA expression was significantly higher (P<0.001) in PC
tissues (6.84±0.71) than in normal tissues (6.20±0.24). Similarly,
in the GSE101448 dataset, COL7A1 mRNA expression was significantly
higher (P<0.001) in PC tissues (10.08±1.29) than in normal
tissues (8.32±0.93) (Fig. 1C and
D). Furthermore, a ROC curve was used to evaluate the
diagnostic value of COL7A1 in PC. The area under the curve of
COL7A1 was 0.963 (95% CI, 0.942-0.983; Fig. 1E), which suggested that COL7A1 could
serve as an effective marker for the diagnosis of PC. To identify
DEGs in PC, 89 COL7A1-high samples were compared with 89 COL7A1-low
PC samples. A total of 1,288 DEGs were identified, which included
1,007 downregulated genes and 281 upregulated genes (Fig. 1F).
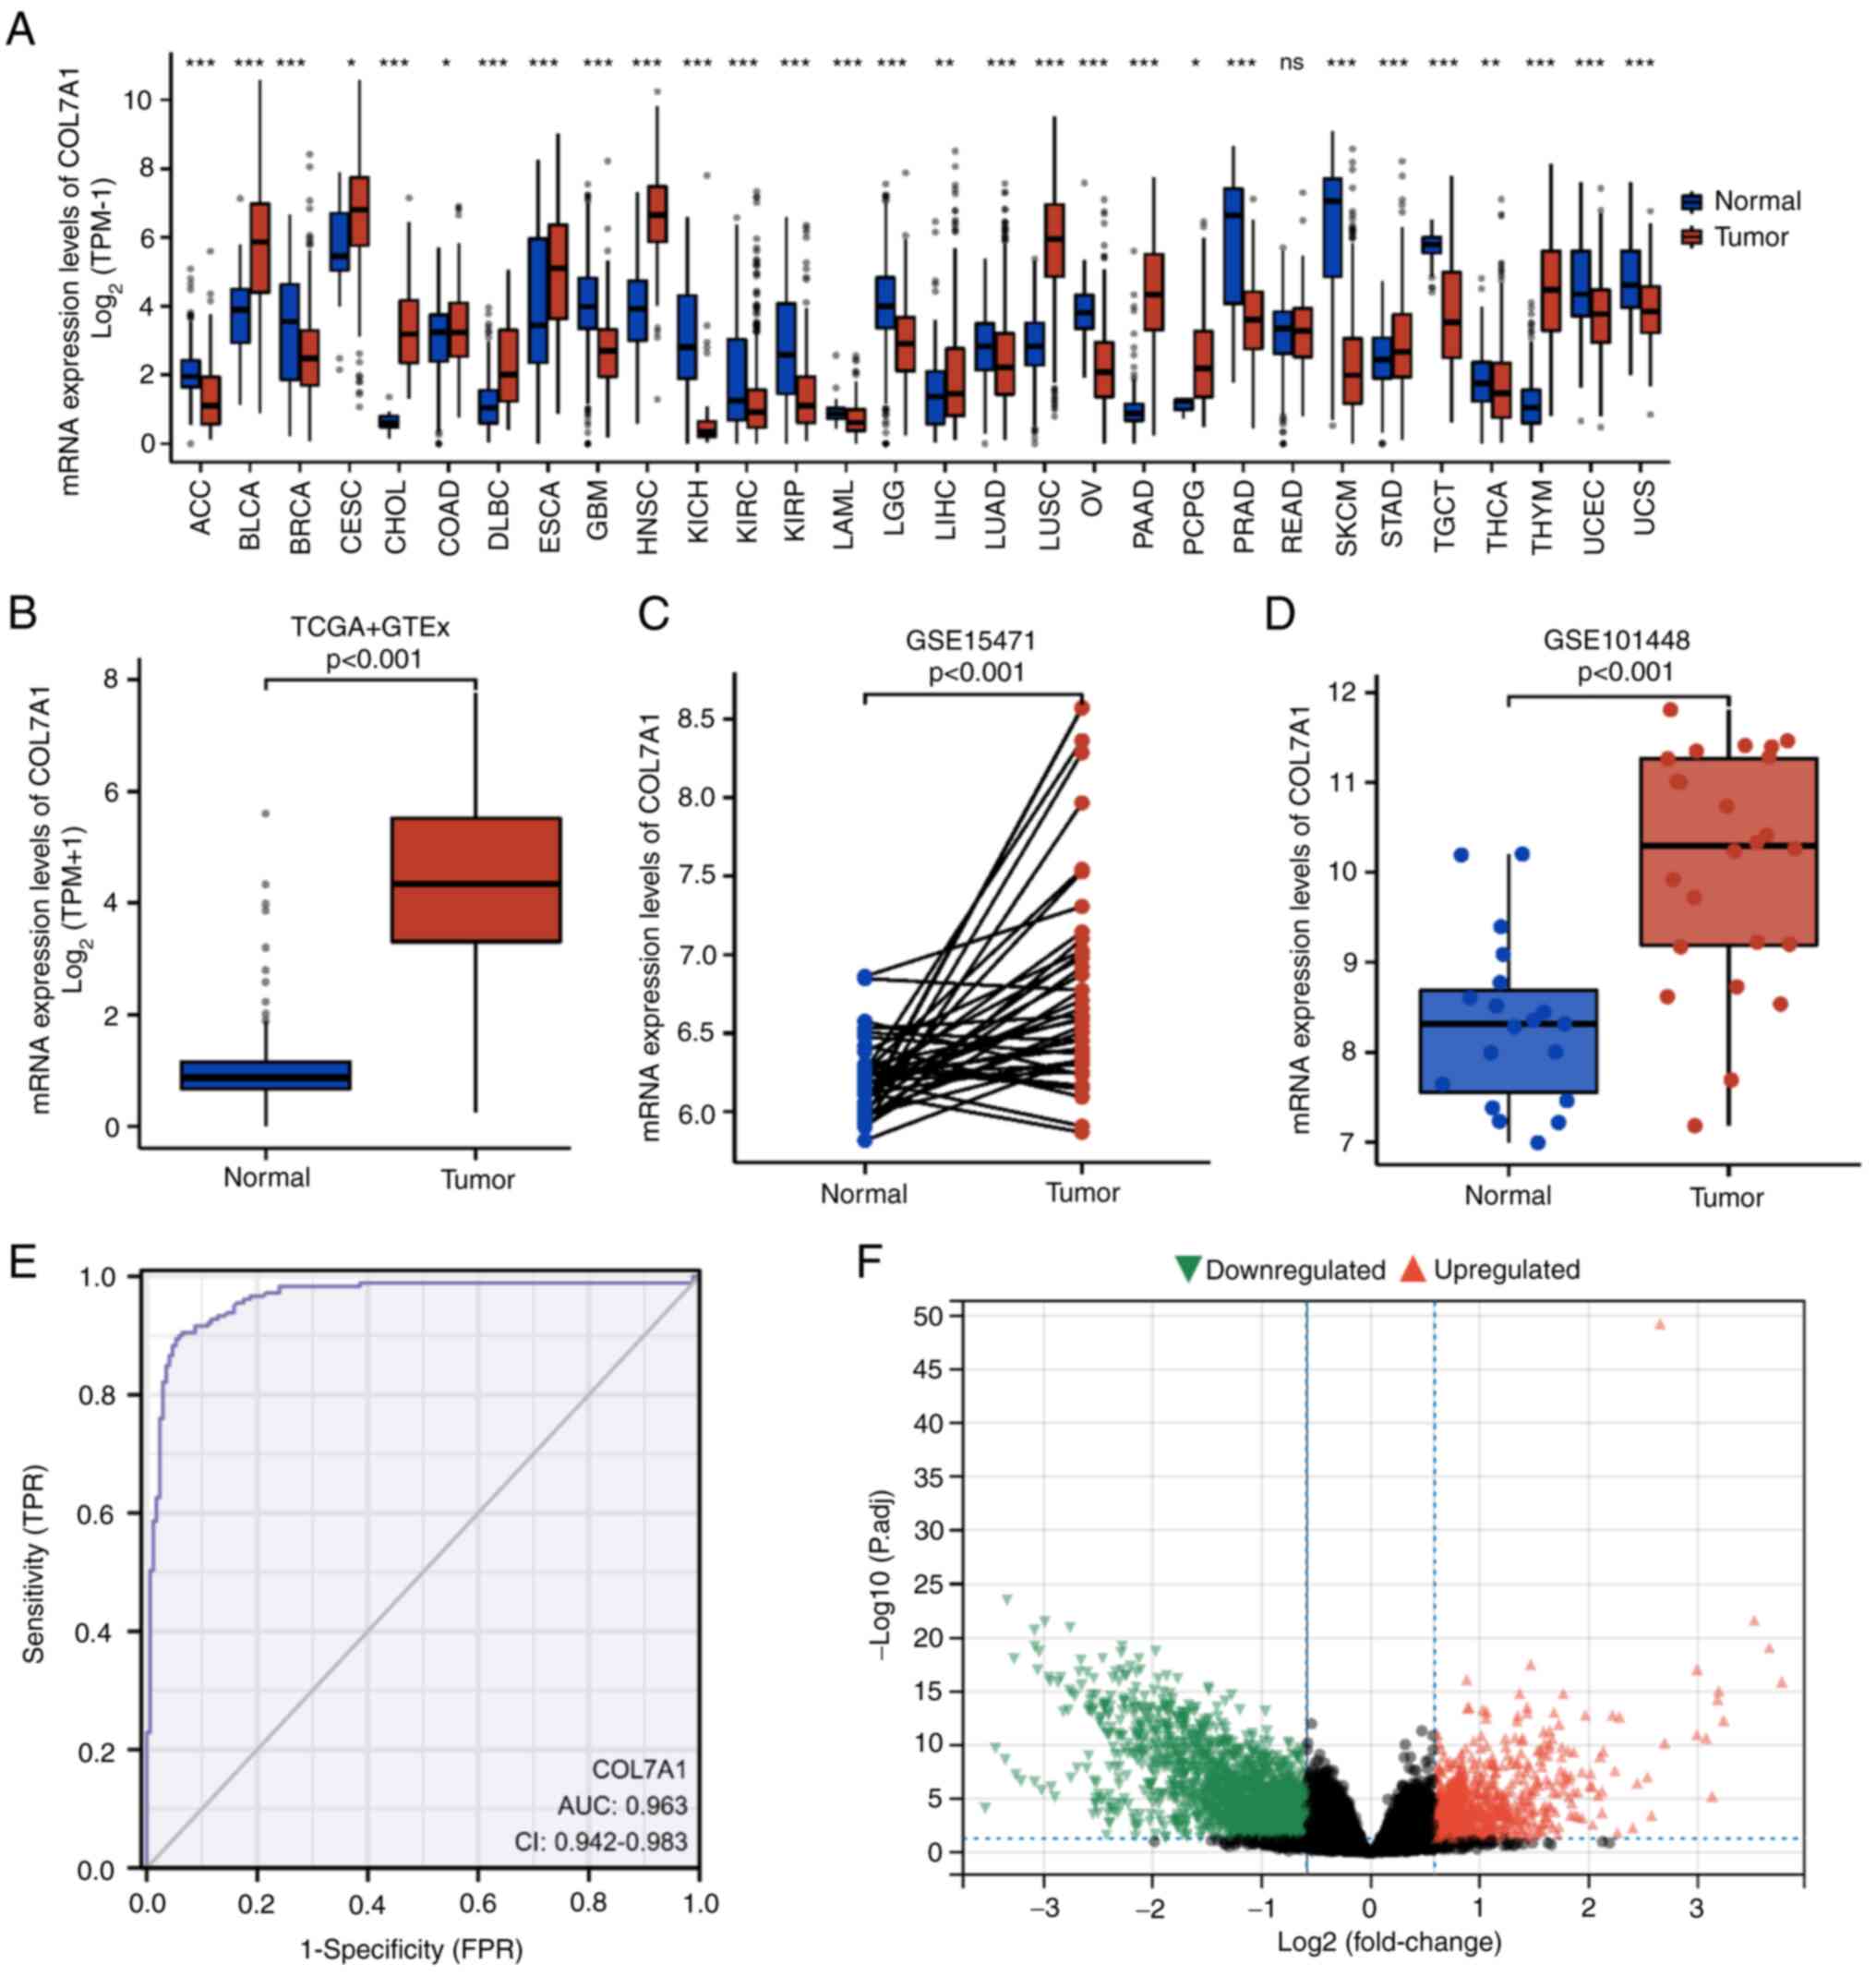 | Figure 1.mRNA expression levels of COL7A1 in
pan-cancerous and PC samples. (A) mRNA expression levels of COL7A1
in tumor and normal (unpaired) samples based on TCGA and GTEx
datasets. (B) mRNA expression levels of COL7A1 in PC and normal
(unpaired) pancreas tissues based on TCGA and GTEx datasets. (C)
COL7A1 mRNA expression between tumor and normal (paired) samples in
the GSE15471 dataset. (D) COL7A1 mRNA expression between tumor and
normal (unpaired) samples in the GSE101448 dataset. (E) Receiver
operating characteristic curve analysis was used to evaluate the
diagnostic value of COL7A1 mRNA expression in PC. (F) Volcano plot
of the differentially expressed genes. *P<0.05, **P<0.01 and
***P<0.001. AUC, area under the curve; COL7A1, collagen type VII
α1 chain; GTEx, Genotype-Tissue Expression; ns, not significant;
P.adj, adjusted P-value; PC, pancreatic cancer; TCGA, The Cancer
Genome Atlas; TPM, transcripts per million; TPR, true positive
rate; FPR, false positive rate. |
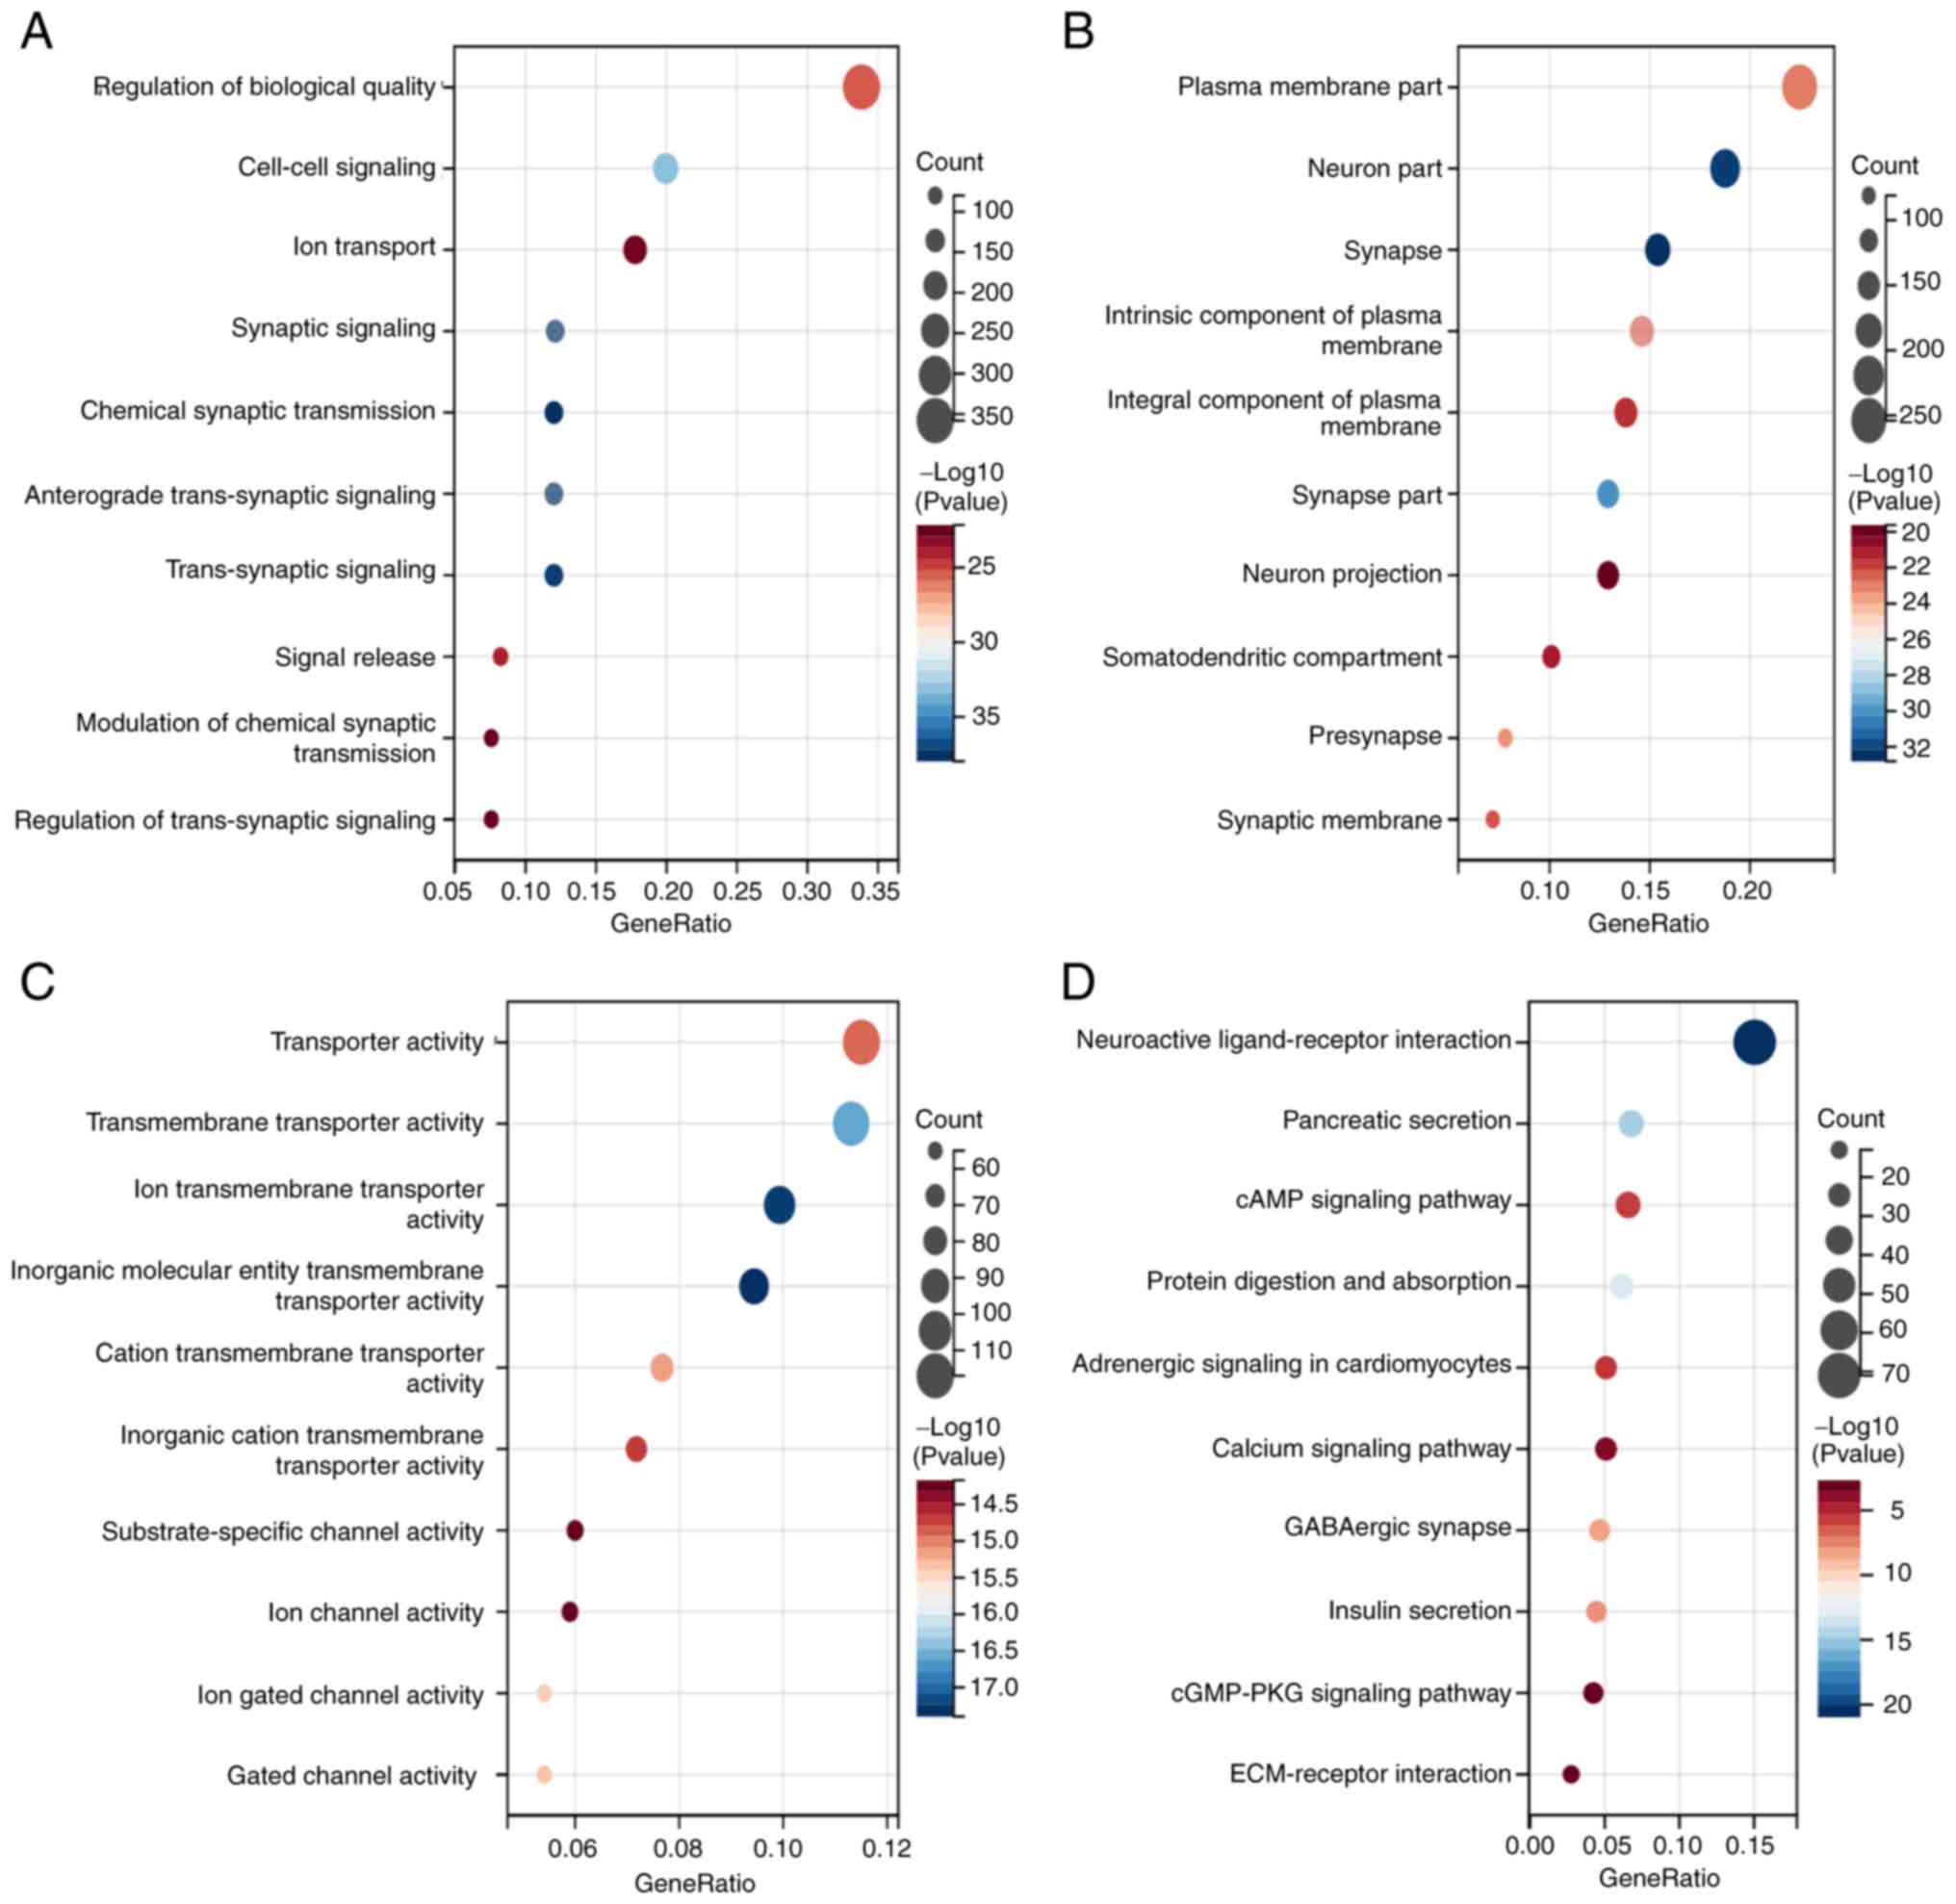
GO and KEGG enrichment analyses and
GSEA
To evaluate the relative biofunctions and pathways
associated with COL7A1 in PC, the clusterProfiler package was used
to perform GO and KEGG analysis. The results demonstrated that
COL7A1-associated genes participated in multiple biological
processes, cellular components and molecular functions, including
‘Regulation of biological quality’, ‘Cell-cell signaling’, ‘Plasma
membrane part’, ‘Neuron part’, ‘Transporter activity’ and
‘Transmembrane transporter activity’ (Fig. 2A-C). Furthermore, KEGG enrichment
analysis demonstrated that COL7A1-associated DEGs were involved in
‘Neuroactive ligand-receptor interaction’, ‘cAMP signaling
pathway’, ‘cGMP-PKG signaling pathway’, ‘ECM-receptor interaction’
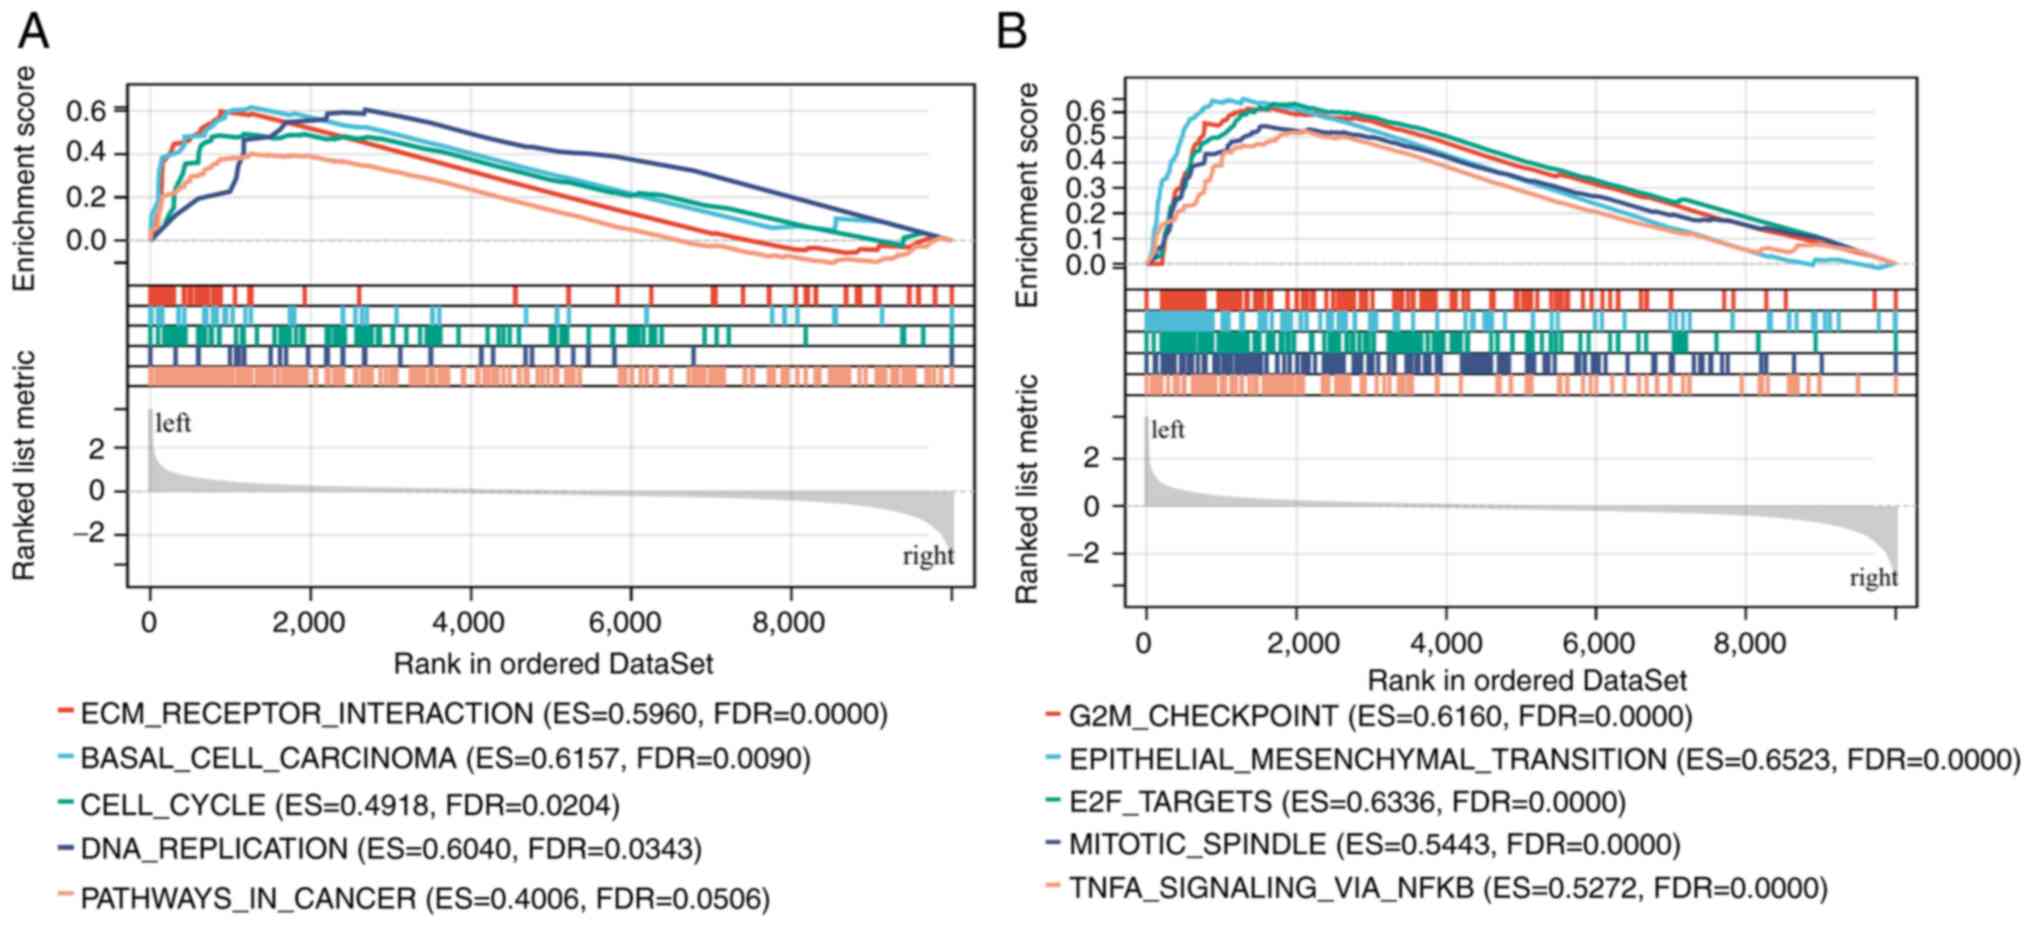
and numerous other signaling pathways (Fig. 2D). To better evaluate COL7A1-related
signaling pathways, GSEA was performed. The GSEA results showed
that COL7A1-associated genes were mainly involved in ‘ECM-receptor
interaction’, ‘cell cycle’, ‘G2M checkpoint’ and
‘epithelial-mesenchymal-transition (EMT)’ pathways (Fig. 3A and B).
Correlation between COL7A1 expression
and immune cell infiltration
ssGSEA and spearman correlation analysis were used
to evaluate the correlation between COL7A1 mRNA expression levels
and immune cell infiltration levels. As shown in Fig. 4, high COL7A1 mRNA expression in PC
was significantly positively associated with the abundance of T
helper (Th)2 cells (R=0.32; P<0.001) (Fig. 4A, B and F), natural killer (NK)
CD56bright cells (R=0.25; P<0.001) (Fig. 4A, C and G), NK cells (R=0.19;
P<0.05), Th1 cells (R=0.18; P<0.05) and regulatory T cells
(R=0.15; P<0.05), and negatively related to infiltration levels
of Th17 cells (R=−0.24; P<0.01)(Fig.
4A, E and I), eosinophils (R=−0.22; P<0.01) (Fig. 4A, D and H), T follicular helper
cells (R=−0.18; P<0.05) and plasmacytoid dendritic cells
(R=−0.15; P<0.05).
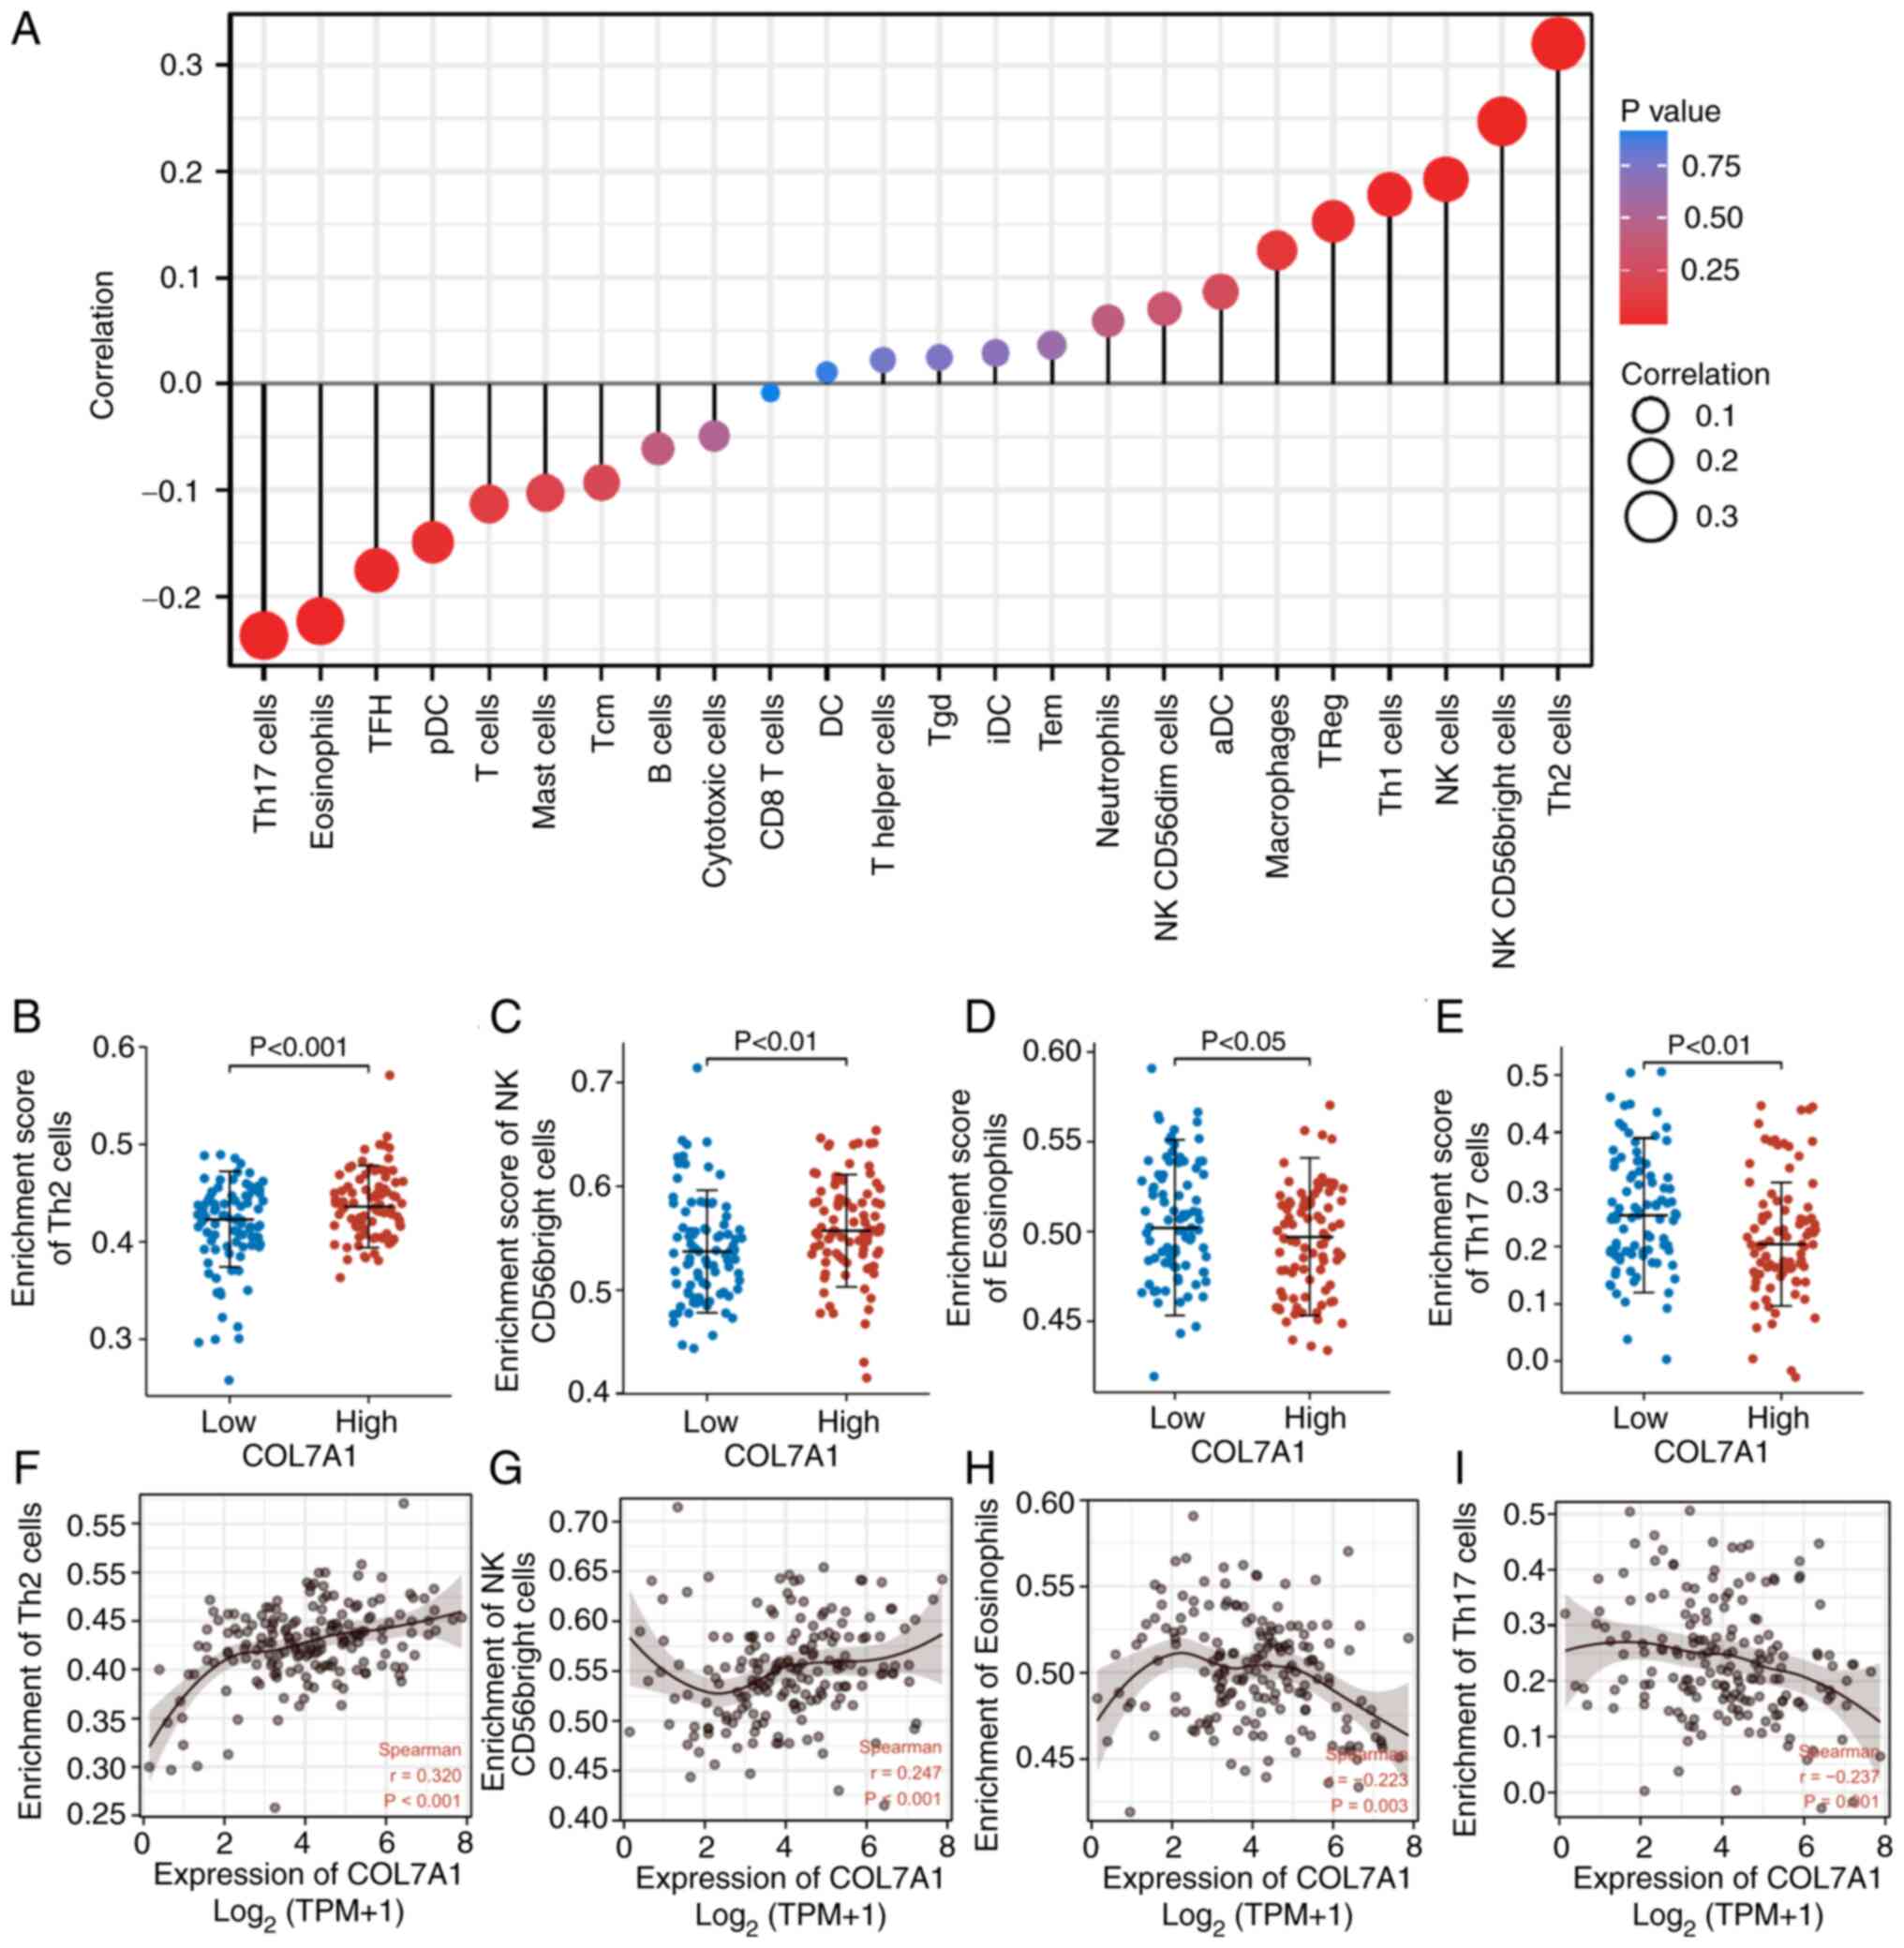 | Figure 4.Association between immune cell
infiltration and COL7A1 expression in the tumor microenvironment.
(A) Correlation between COL7A1 mRNA expression and immune cell
levels. (B-E) Comparison of the abundances of (B) Th2 cells, (C) NK
CD56bright cells, (D) eosinophils and (E) Th17 cells between the
COL7A1-low and COL7A1-high groups. (F-I) Scatter plots demonstrated
the correlation between the abundances of (F) Th2 cells, (G) NK
CD56 bright cells, (H) eosinophils and (I) Th17 cells and COL7A1
mRNA expression in pancreatic cancer. aDC, activated dendritic
cells. COL7A1, collagen type VII α1 chain; DC, dendritic cells;
iDC, immature dendritic cells; NK, natural killer; pDC,
plasmacytoid dendritic cells; Tcm, central memory T cells; TFH, T
follicular helper cells; TGD, γδ T cells; Th, T helper; TPM,
transcripts per million; TReg, regulatory T cells. |
Association of COL7A1 mRNA expression
with clinicopathological variables in PC
Based on the median mRNA expression levels of
COL7A1, the patients were divided into COL7A1-high and COL7A1-low
groups, and the clinical features and the expression levels of
COL7A1 were presented in Table I.
Logistic regression analysis was used to evaluate the correlation
between COL7A1 expression and clinical features, the results
indicated that COL7A1 mRNA expression levels were not significantly
associated with any of the 10 clinical characteristics (gender,
age, T stage, N stage, M stage, pathologic stage, histologic stage,
history of diabetes, history of chronic pancreatitis and primary
therapy outcome) analyzed (P>0.05; Table II).
 | Table I.Association between
clinicopathological variables and COL7A1 expression in patients
with pancreatic cancer. |
Table I.
Association between
clinicopathological variables and COL7A1 expression in patients
with pancreatic cancer.
| Characteristic | Low COL7A1
expression, n (%) (n=89) | High COL7A1
expression, n (%) (n=89) |
|---|
| Sex |
|
|
|
Female | 38 (47.5) | 42 (52.5) |
|
Male | 51 (52.0) | 47 (48.0) |
| Age, years |
|
|
|
≤65 | 48 (51.6) | 45 (48.4) |
|
>65 | 41 (48.2) | 44 (51.8) |
| T stage |
|
|
| T1 | 6 (85.7) | 1 (14.3) |
| T2 | 13 (54.2) | 11 (45.8) |
| T3 | 65 (45.8) | 77 (54.2) |
| T4 | 3 (100.0) | 0 (0.0) |
| N stage |
|
|
| N0 | 28 (56.0) | 22 (44.0) |
| N1 | 58 (47.2) | 65 (52.8) |
| M stage |
|
|
| M0 | 39 (49.4) | 40 (50.6) |
| M1 | 1 (20.0) | 4 (80.0) |
| Pathologic
stage |
|
|
| Stage
I | 14 (66.7) | 7 (33.3) |
| Stage
II | 69 (47.3) | 77 (52.7) |
| Stage
III | 3 (100.0) | 0 (0.0) |
| Stage
IV | 1 (20.0) | 4 (80.0) |
| Histologic
grade |
|
|
| G1 | 23 (74.2) | 8 (25.8) |
| G2 | 43 (45.3) | 52 (54.7) |
| G3 | 21 (43.8) | 27 (56.2) |
| G4 | 1 (50.0) | 1 (50.0) |
| History of chronic
pancreatitis |
|
|
| No | 69 (53.9) | 59 (46.1) |
|
Yes | 5 (38.5) | 8 (61.5) |
| History of
diabetes |
|
|
| No | 52 (48.1) | 56 (51.9) |
|
Yes | 22 (57.9) | 16 (42.1) |
| Primary therapy
outcome |
|
|
| PD | 20 (40.8) | 29 (59.2) |
| SD | 6 (66.7) | 3 (33.3) |
| PR | 5 (50.0) | 5 (50.0) |
| CR | 41 (57.7) | 30 (42.3) |
| Table II.Association between type VII collagen
α1 chain expression and clinicopathological characteristics
(logistic regression). |
Table II.
Association between type VII collagen
α1 chain expression and clinicopathological characteristics
(logistic regression).
| Characteristic | Total, n | Odds ratio (95%
CI) | P-value |
|---|
| Sex (male vs.
female) | 177 | 1.176
(0.650-2.132) | 0.592 |
| Age (>65 vs. ≤65
years) | 177 | 0.852
(0.471-1.538) | 0.596 |
| T stage (T3+T4 vs.
T1+T2) | 175 | 0.550
(0.243-1.202) | 0.139 |
| N stage (N1 vs.
N0) | 172 | 0.727
(0.371-1.411) | 0.348 |
| M stage (M1 vs.
M0) | 83 | 0.342
(0.017-2.800) | 0.362 |
| Pathologic stage
(stage II–IV vs. stage I) | 174 | 0.444
(0.161-1.130) | 0.098 |
| Histologic grade
(G3+G4 vs. G1+G2) | 175 | 0.725
(0.372-1.399) | 0.340 |
| History of diabetes
(yes vs. no) | 146 | 1.330
(0.634-2.822) | 0.451 |
| History of chronic
pancreatitis (yes vs. no) | 141 | 0.551
(0.159-1.743) | 0.319 |
| Primary therapy
outcome (SD+PR+CR vs. PD) | 139 | 1.896
(0.941-3.881) | 0.076 |
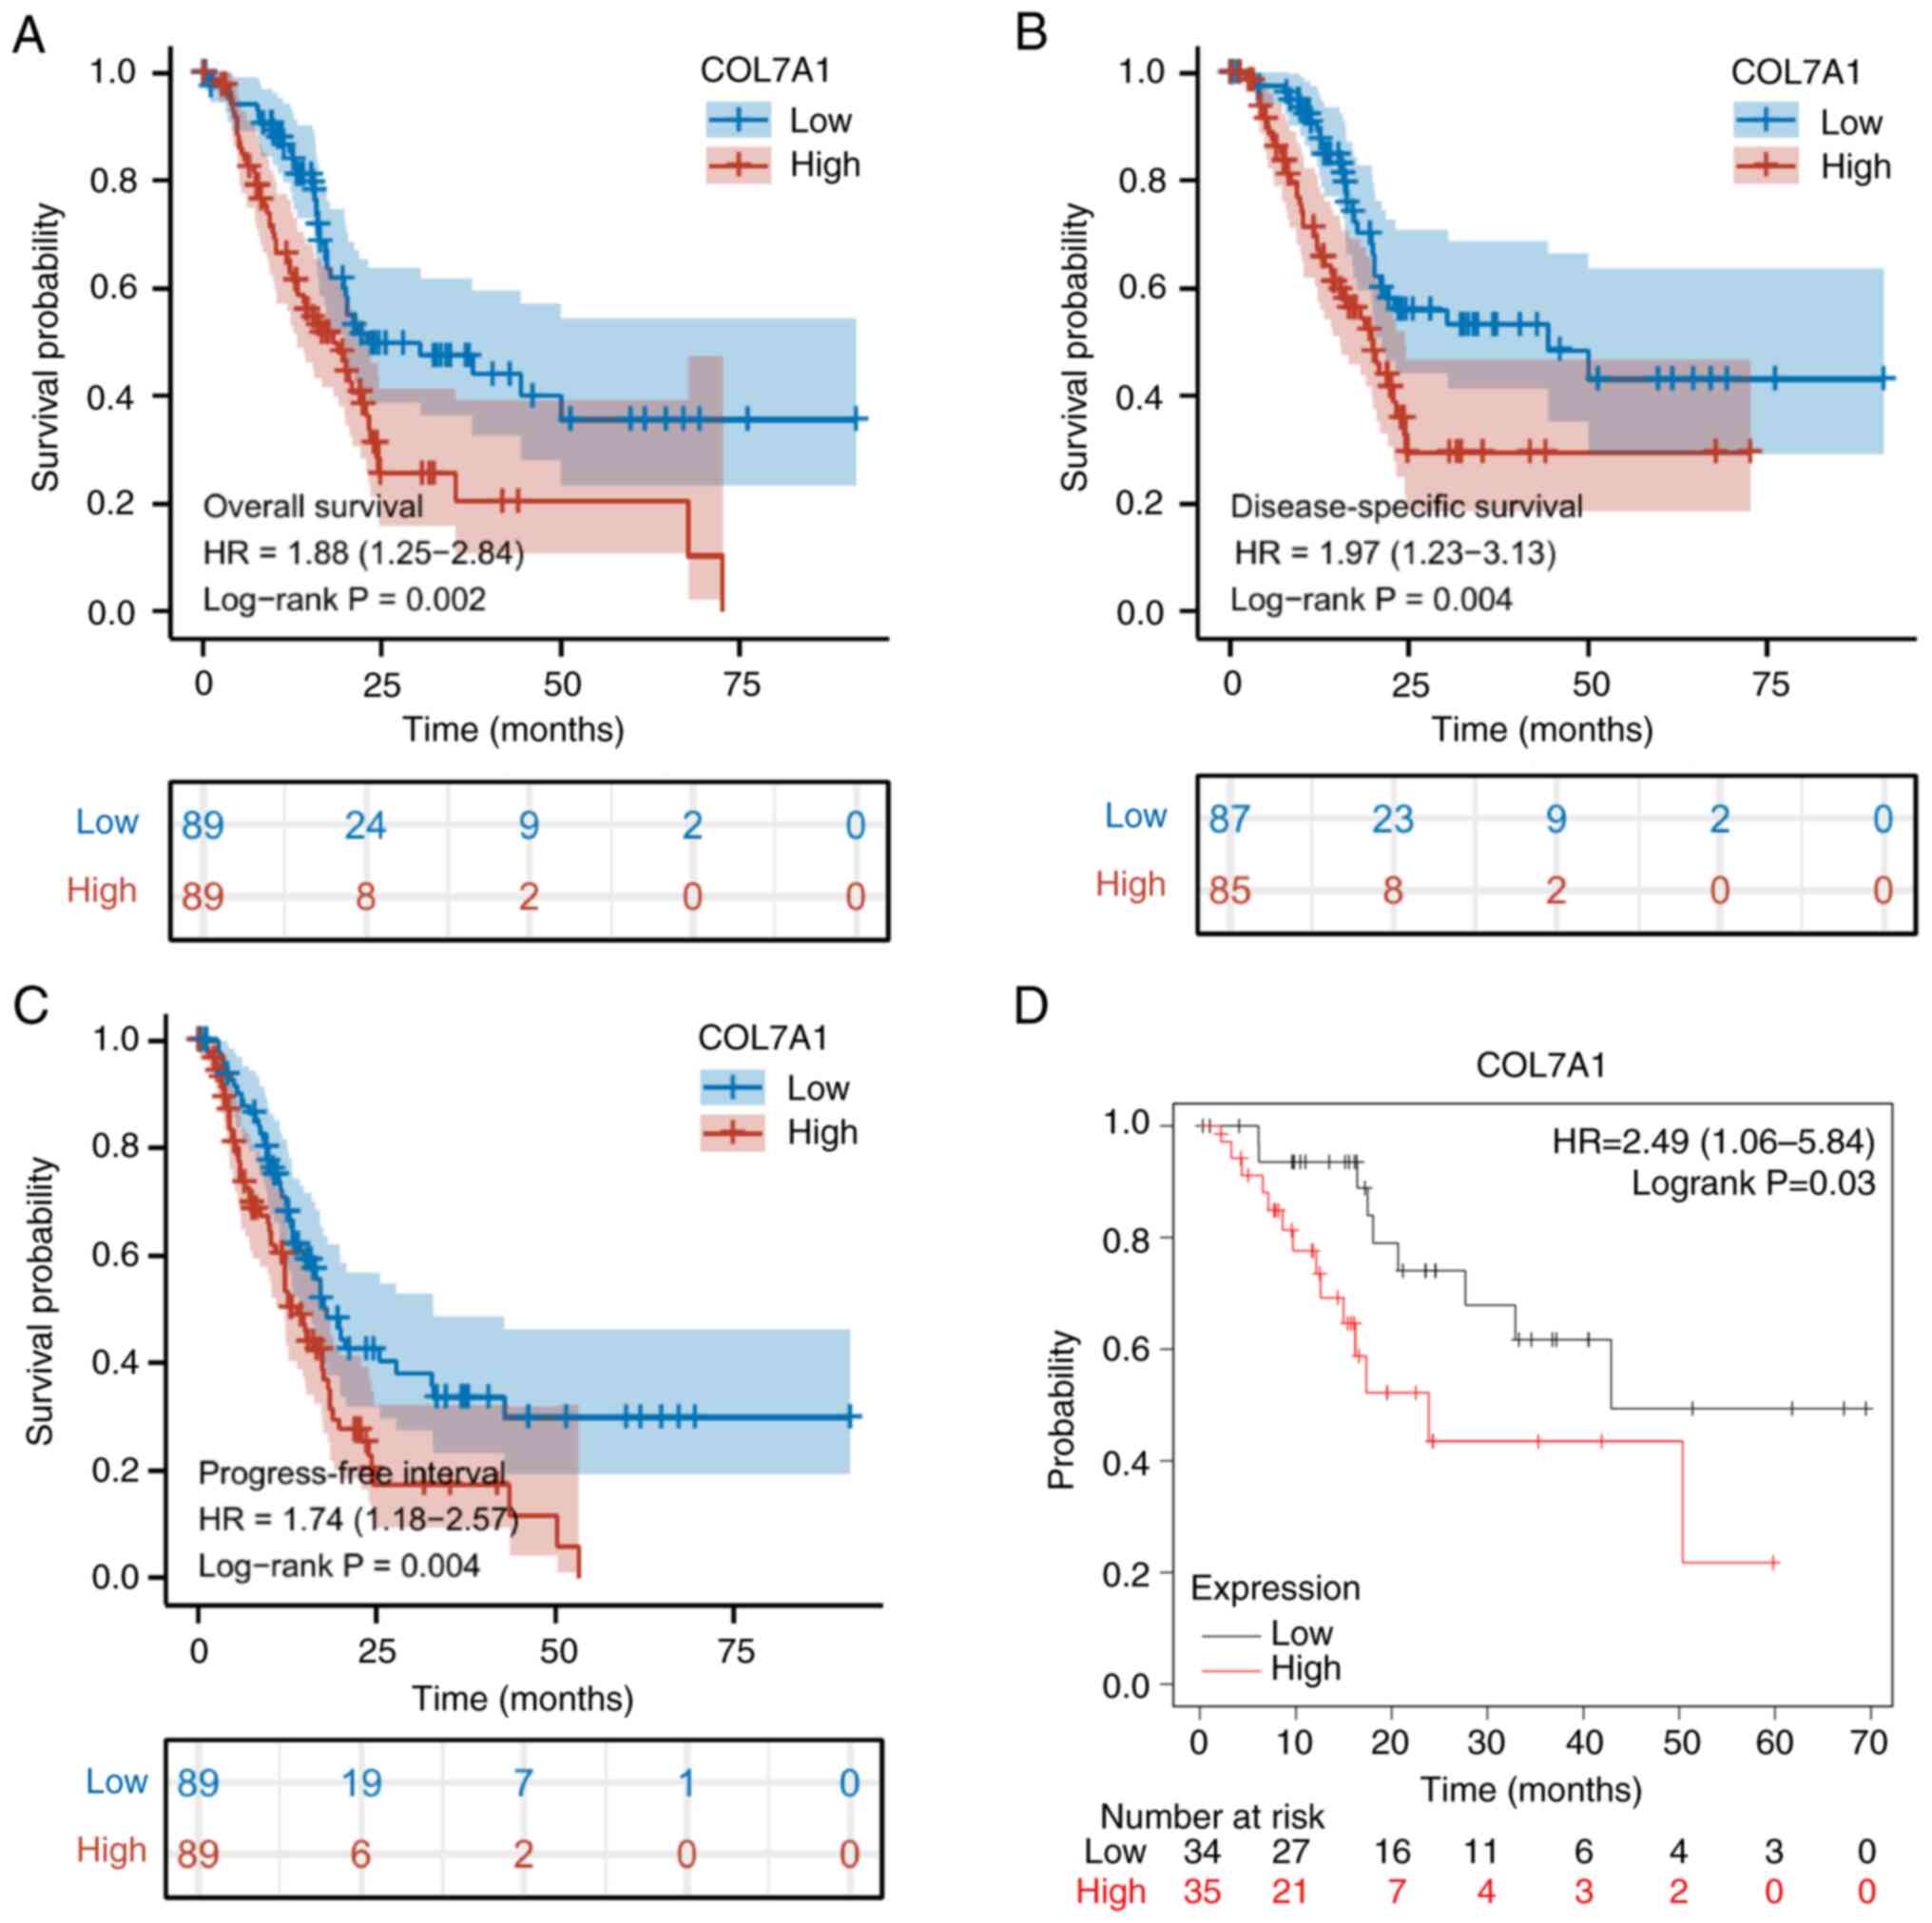
High COL7A1 expression is associated
with poor survival in PC
The Kaplan-Meier survival analysis demonstrated that
high mRNA expression levels of COL7A1 were significantly associated
with poor OS, DSS and PFI (Fig.
5A-C), in line with the results of the Kaplan-Meier Plotter
analysis (Fig. 5D). Univariate
analyses demonstrated that COL7A1 mRNA expression was a prognostic
factor for OS, DSS and PFI. Furthermore, multivariate analysis
demonstrated that COL7A1 mRNA expression was an independent
prognostic indicator for PC (Tables
III, SI and SII). Furthermore, the nomogram utilized T
stage, N stage, age, histologic grade and COL7A1 mRNA expression to
predict the 1-, 2- and 3-year OS, DSS and PFI in PC (Figs. 6A, S1A and S2A). The calibration curve was
constructed to evaluate the efficiency of the nomogram (Fig. 6B, S1B and S2B). The 1, 2 and 3-year OS, DSS and PFI
lines were close to ideal line, which indicated that this nomogram
model demonstrated a high level of accuracy. Furthermore, ROC
analysis was performed to predict 1, 2 and 3-year OS, DSS and PFI
(Figs. 6C, S1C and S2C).
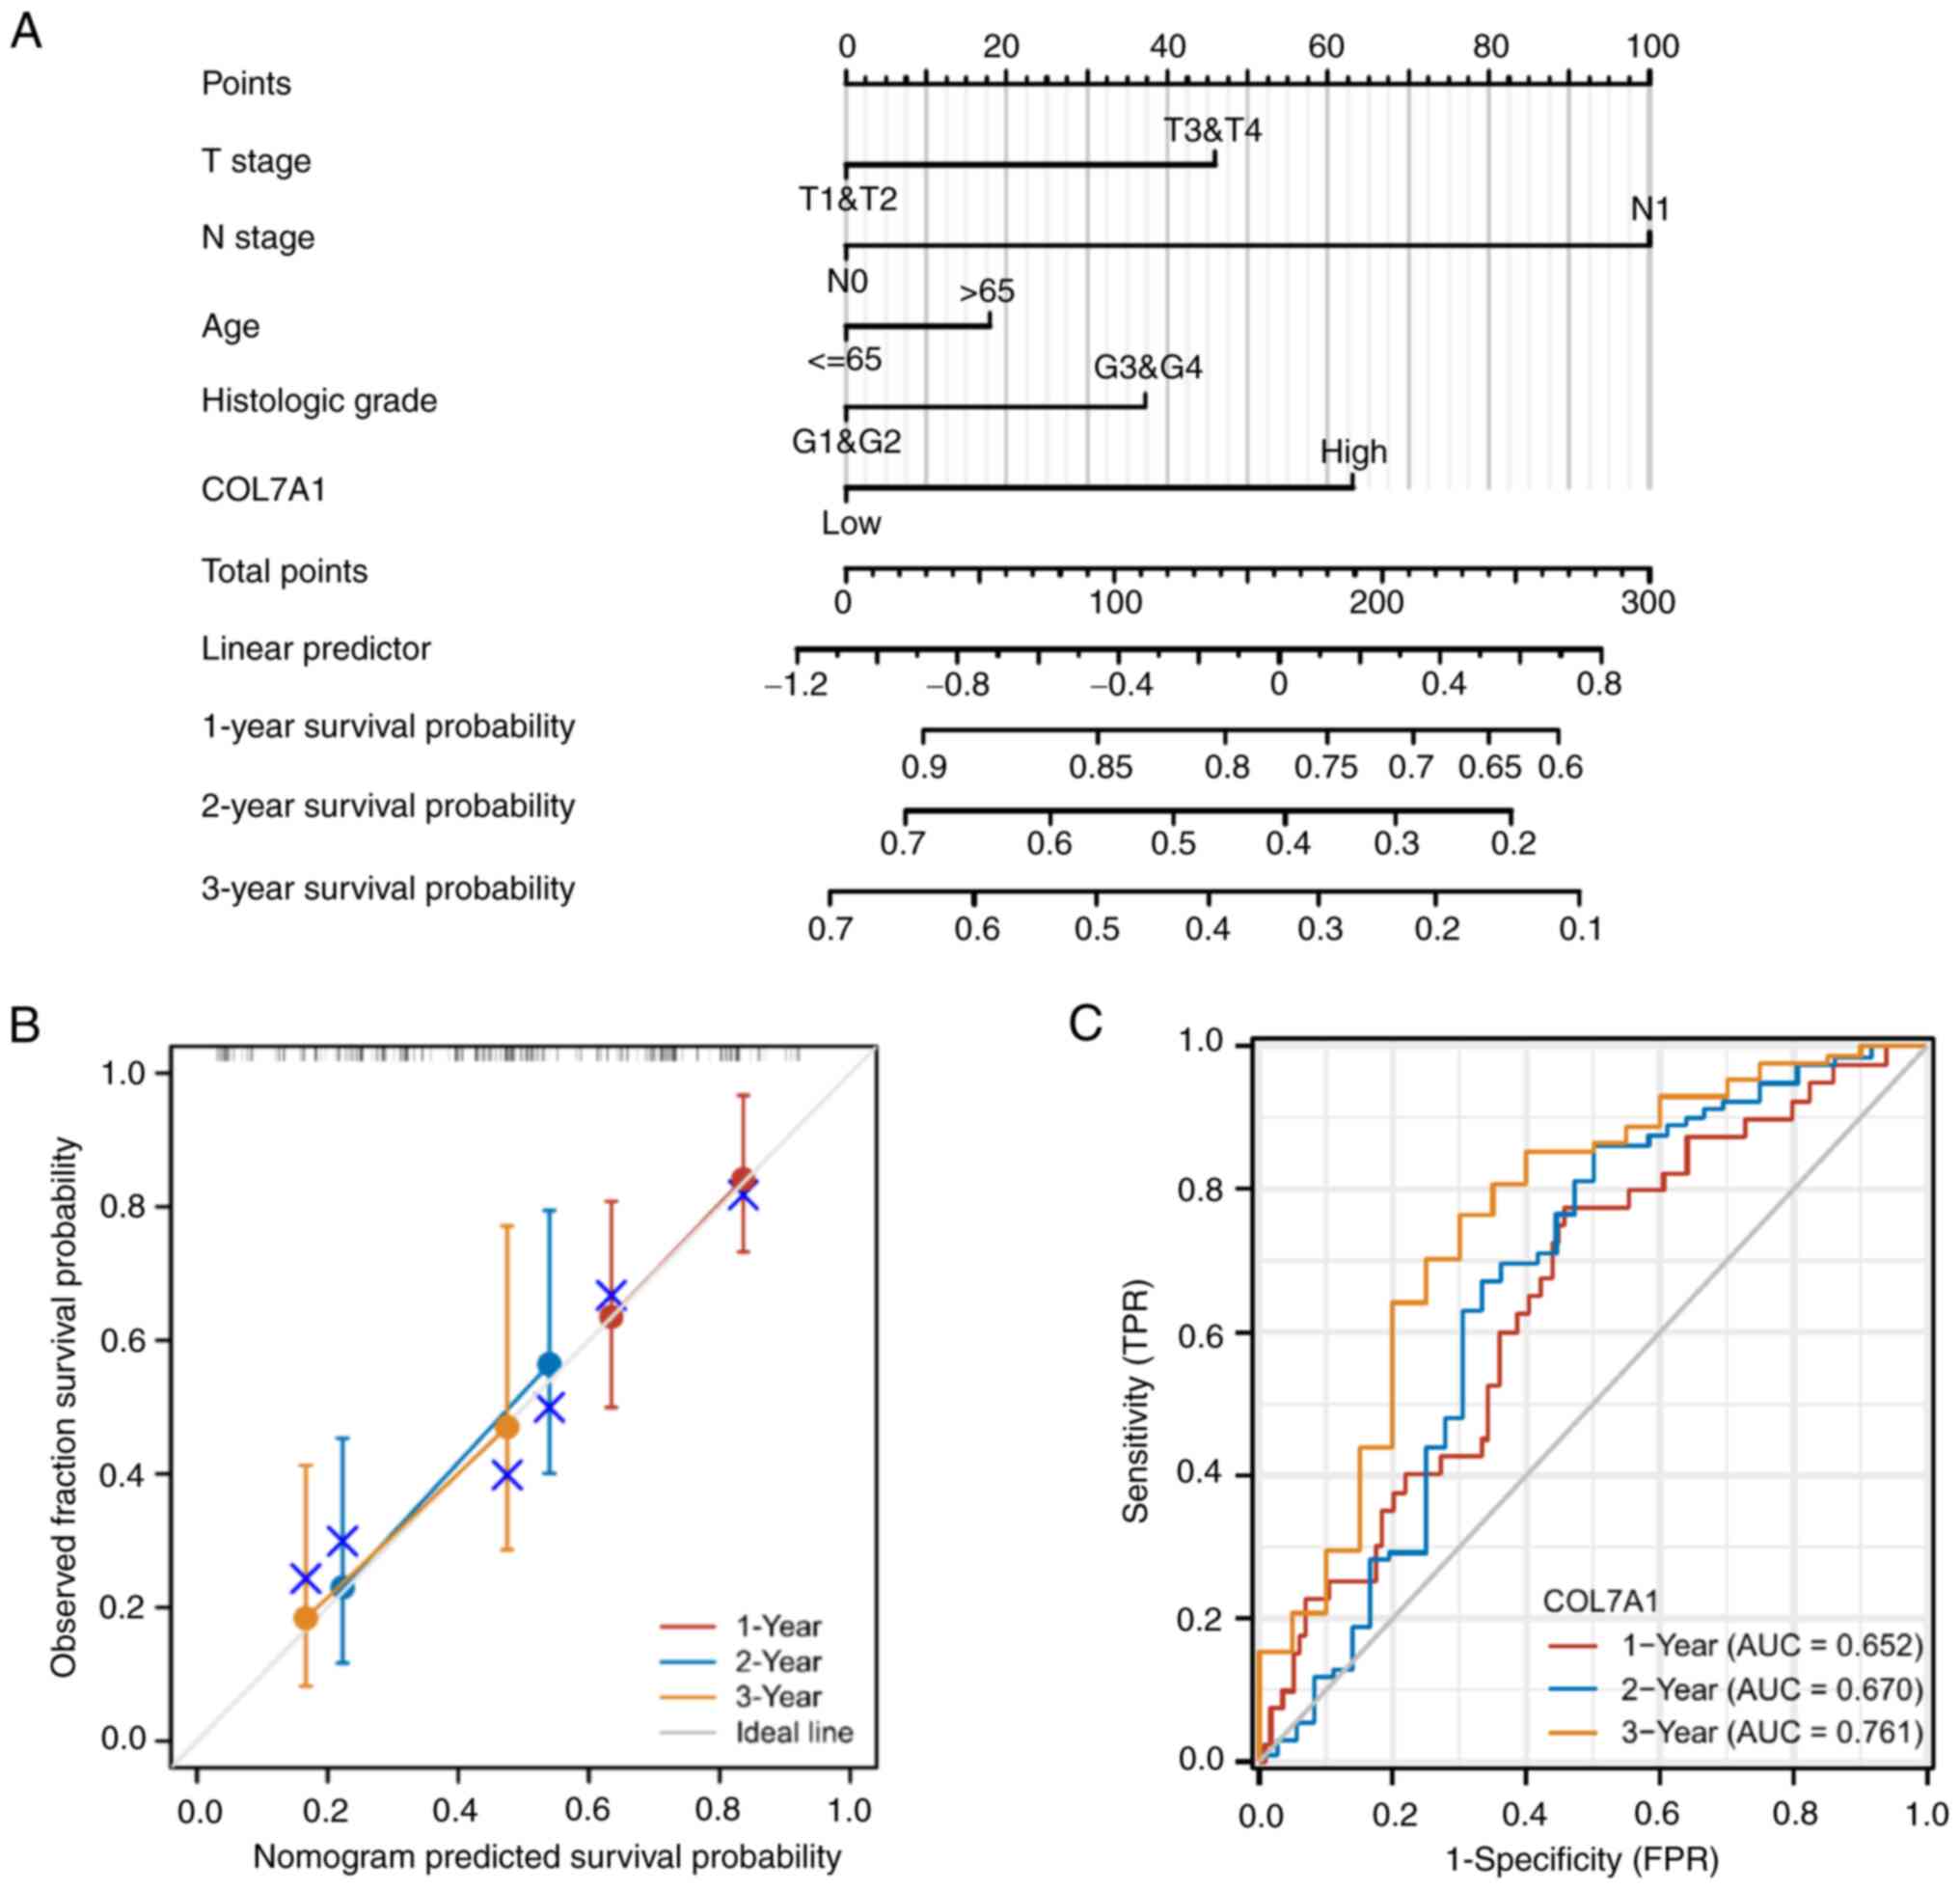 | Figure 6.Prognostic model for the prediction
of 1-, 2- and 3-year OS in PC. (A) A nomogram for the prediction of
the probability of 1-, 2- and 3-year OS for patients with PC. (B)
Calibration plots of the nomogram for the estimation of the
probability of OS at 1, 2 and 3 years. (C) Receiver operating
characteristic curve of COL7A1 mRNA expression for the prediction
of 1-, 2- and 3-year OS for patients with PC. AUC, area under the
curve; COL7A1, collagen type VII α1 chain; OS, overall survival;
PC, pancreatic cancer; TPR, true positive rate; FPR, false positive
rate. |
| Table III.Univariate and multivariate analysis
(overall survival) for prognostic factors in pancreatic cancer. |
Table III.
Univariate and multivariate analysis
(overall survival) for prognostic factors in pancreatic cancer.
|
|
| Univariate
analysis | Multivariate
analysis |
|---|
|
|
|
|
|
|---|
| Characteristic | Total, n | Hazard ratio (95%
CI) | P-value | Hazard ratio (95%
CI) | P-value |
|---|
| Sex | 178 |
|
|
|
|
|
Female | 80 | - |
|
|
|
|
Male | 98 | 0.809
(0.537-1.219) | 0.311 |
|
|
| Age, years | 178 |
|
|
|
|
|
≤65 | 93 | - |
|
|
|
|
>65 | 85 | 1.290
(0.854-1.948) | 0.227 |
|
|
| T stage | 176 |
|
|
|
|
|
T1+T2 | 31 | - |
|
|
|
|
T3+T4 | 145 | 2.023
(1.072-3.816) | 0.030 | 1.367
(0.691-2.707) | 0.369 |
| N stage | 173 |
|
|
|
|
| N0 | 50 | - |
|
|
|
| N1 | 123 | 2.154
(1.282-3.618) | 0.004 | 1.933
(1.115-3.352) | 0.019 |
| M stage | 84 |
|
|
|
|
| M0 | 79 | - |
|
|
|
| M1 | 5 | 0.756
(0.181-3.157) | 0.701 |
|
|
| Pathologic
stage | 175 |
|
|
|
|
| Stage
I+II | 167 | - |
|
|
|
| Stage
III+IV | 8 | 0.673
(0.212-2.135) | 0.501 |
|
|
| Histologic
grade | 176 |
|
|
|
|
|
G1+G2 | 126 | - |
|
|
|
|
G3+G4 | 50 | 1.538
(0.996-2.376) | 0.052 | 1.301
(0.836-2.024) | 0.243 |
| History of chronic
pancreatitis | 141 |
|
|
|
|
| No | 128 | - |
|
|
|
|
Yes | 13 | 1.177
(0.562-2.464) | 0.666 |
|
|
| History of
diabetes | 146 |
|
|
|
|
| No | 108 | - |
|
|
|
|
Yes | 38 | 0.927
(0.532-1.615) | 0.790 |
|
|
| COL7A1 | 178 |
|
|
|
|
|
Low | 89 | - |
|
|
|
|
High | 89 | 1.908
(1.254-2.904) | 0.003 | 1.543
(1.010-2.358) | 0.045 |
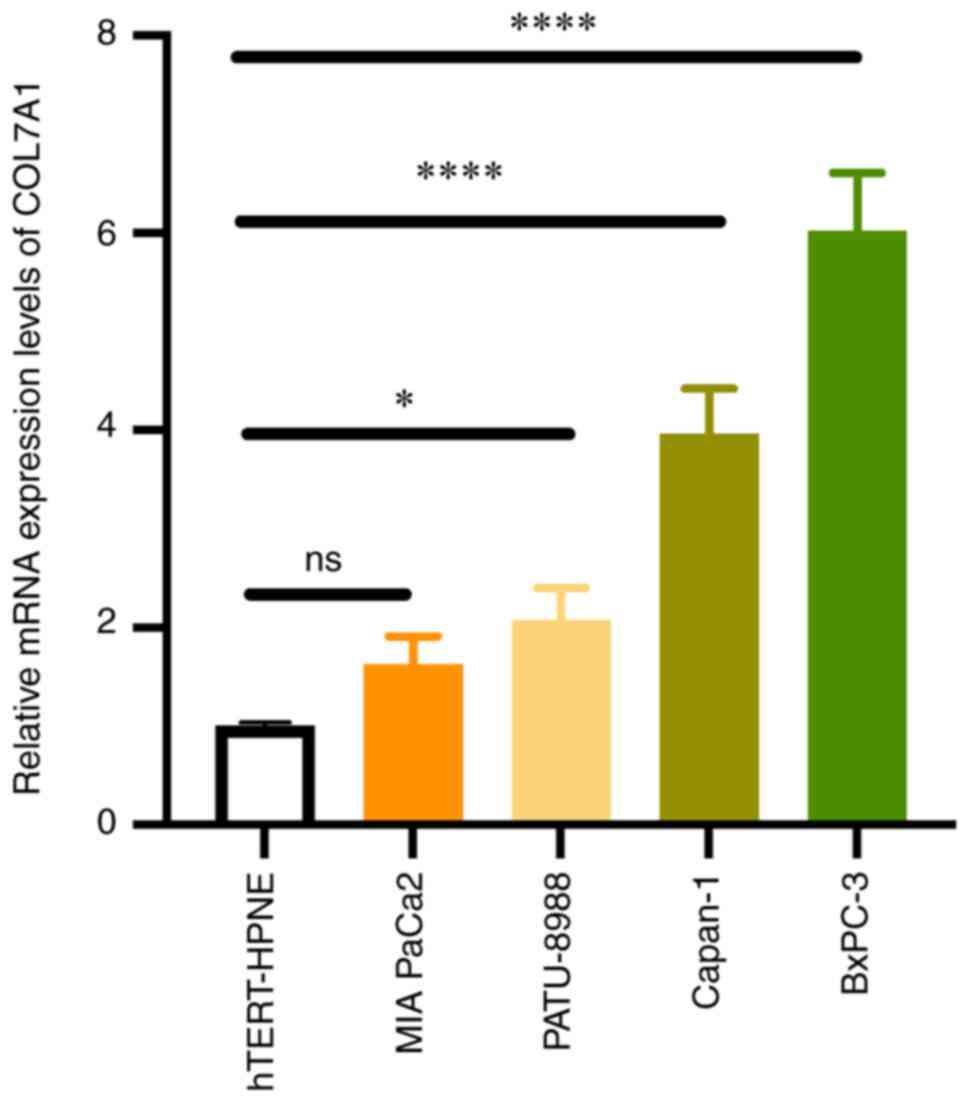
Upregulation of COL7A1 expression in
PC cell lines assessed using RT-qPCR
To evaluate the accuracy of the bioinformatics
analysis results, RT-qPCR was performed in PC cell lines (MIA
PaCa-2, BxPC-3, Capan-1 and PATU-8988) and hTERT-HPNE cells. The
results demonstrated that the mRNA expression levels of COL7A1 in
the BxPC-3, Capan-1 and PATU-8988 cell lines were significantly
higher than that in the hTERT-HPNE cell line. However, there was no
significant difference in the COL7A1 mRNA expression levels between
the MIA PaCa-2 and hTERT-HPNE cell lines. The RT-qPCR results
indicated that COL7A1 was commonly overexpressed in PC cell lines,
which was in accordance with the results bioinformatics analysis of
public datasets (Fig. 7).
Discussion
According to a previous study, the ECM serves
crucial roles in the progression of cancer (26) and the basement membrane is one type
of ECM structure. Type VII collagen, a type of basement membrane
collagen, is an important component for basement membrane functions
as it can form anchoring fibrils which mediate dermal-epidermal
adhesion (27). Therefore, loss of
function of type VII collagen can lead to a RDEB and increases the
risk of skin cancer (7). Martins
et al (28) reported that
type VII collagen suppressed TGF-β signaling and angiogenesis in
cutaneous SCC. However, certain studies have reported that high
COL7A1 expression was associated with poor prognosis in gastric
cancer and esophageal squamous cell carcinoma (15,17).
However, to the best of our knowledge, the mechanism is still
unclear and it may serve different roles in different cancer
types.
Despite vigorous research focusing on PC, the
improvement in its prognosis remains poor due to its aggressive
nature and insensitivity to treatment (11). Therefore, it is imperative to
identify efficient and compelling diagnostic and prognostic
biomarkers for patients with PC. As such, the present study
evaluated COL7A1 expression and the prognostic value of COL7A1 mRNA
expression in PC using RT-qPCR and public databases. The results
demonstrated that COL7A1 mRNA expression was significantly higher
in PC samples and cell lines compared with in normal pancreas
tissues. The results of the present study demonstrated that COL7A1
was expressed differentially in human cancer types. For example, it
was expressed at significantly higher levels in digestive
carcinomas (esophageal cancer, gastric cancer, hepatocellular
carcinoma, colorectal cancer and PC) (Fig. 1A) compared with normal tissues,
which indicated that COL7A1 might serve as an oncogene in digestive
system cancers. Furthermore, the diagnostic value of COL7A1 in PC
was evaluated and the ROC curve indicated that the mRNA expression
levels of COL7A1 could be an effective biomarker for PC
diagnosis.
To further understand the biological functions and
mechanism of COL7A1 in PC, GO and KEGG analyses and GSEA were
performed. The results of GO and KEGG enrichment analyses indicated
that the DEGs were involved in ‘Ion transport’, ‘Ion channel
activity’, ‘cAMP signaling pathway’, ‘Calcium signaling pathway’
and ‘ECM-receptor interaction’. Recently, numerous studies have
reported that ion transport and calcium channels serve an important
role in tumorigenesis and progression (29–31).
These findings supported further investigation of the function of
COL7A1 in PC. GSEA results suggested that COL7A1 was associated
with ‘ECM receptor interaction’, ‘cell cycle’, ‘DNA replication’,
‘G2M checkpoint’, ‘epithelial mesenchymal transition’, ‘E2F
targets’ and ‘mitotic spindle’. These pathways have all been
reported to participate in the proliferation, invasion and
metastasis of PC (32–34).
TIICs exhibit a dual role in the development of PC,
as it can inhibit tumor progression as well as promote cancer
cells' escape of immune surveillance (35–37).
ssGSEA was used to evaluate the association between COL7A1 mRNA
expression and TIICs in PC. The results demonstrated that COL7A1
mRNA expression was significantly correlated with Th2 and NK cell
levels. Yang et al (38)
reported that an elevated Th2/Th1 ratio could result in an
immune-suppressive microenvironment and promote tumor growth.
Marcon et al (39) reported
that, in PC, the cytotoxicity of NK cells was inhibited and favored
tumor escape of immune surveillance. These results partially
indicated why COL7A1 mRNA expression exhibited a negative
association with the survival of patients with PC. However, it must
be acknowledged that the association between TIIC and COL7A1 mRNA
expression was only based on the results of TCGA database analysis
and the correlation coefficient of TIICs was not high. The complex
interactions between TIICs and the PC tumor immune microenvironment
still require further study.
The association between COL7A1 mRNA expression and
the prognosis of patients with PC was also evaluated. In the
present study, Kaplan-Meier survival analysis indicated that low
COL7A1 mRNA expression was significantly associated with longer OS,
DSS and PFI times. Univariate and multivariate Cox regression
analysis demonstrated that COL7A1 mRNA expression was a powerful
and independent prognostic biomarker for patients with PC.
Furthermore, a prognostic nomogram involving clinicopathological
factors and COL7A1 mRNA expression was constructed to predict the
survival (OS, DSS and PFI) of patients with PC. This predictive
model provides a novel option for assessing the prognosis of
patients with PC.
Although a comprehensive analysis of the association
between COL7A1 mRNA expression and PC was performed, the present
study still included certain limitations. Firstly, the association
between COL7A1 mRNA expression and the prognosis of patients with
PC should be validated using more clinical samples. Secondly, the
raw data, excluding the PCR data, were acquired from public
databases and bias due to confounding factors may be unavoidable.
Furthermore, the functional and molecular mechanisms associated
with COL7A1 need to be further elucidated. Additionally, the
clinical role of COL7A1 in PC requires further assessment in the
near future.
To the best our knowledge, the present study was the
first to evaluate the prognostic and immunologic values of COL7A1
in PC. However, it is limited by the aforementioned limitations and
a deeper mechanistic investigation of COL7A1 is required.
Overall, the present study demonstrated that COL7A1
expression was upregulated in PC tissues and high mRNA expression
levels of COL7A1 were an independent risk factor in patients with
PC. Furthermore, its expression may be associated with tumor immune
infiltration cells. Based on these findings, it was proposed that
COL7A1 could be a novel biomarker for the diagnosis and prognosis
of PC.
Supplementary Material
Supporting Data
Supporting Data
Acknowledgments
Not applicable.
Funding
The costs of the present study were supported by Cheng Ding.
Availability of data and materials
The data used to support the bioinformatic results
are available at the TCGA [pancreatic adenocarcinoma (PAAD)
dataset; https://portal.gdc.cancer.gov], GTEx (https://xenabrowser.net/datapages/; TOIL RSEM tpm
dataset) and GEO databases (accession no. GSE15471 and GSE101448;
http://www.ncbi.nlm.nih.gov/geo/). The
other datasets used and/or analyzed during the current study are
available from the corresponding author on reasonable request.
Authors' contributions
MD and QH designed the study. CD and ZY collected
the data, performed the analysis and wrote the manuscript. ZY
performed the RT-qPCR experiments. JZ and XL revised the
statistical findings and edited and revised the manuscript. MD and
QH confirm the authenticity of the raw data. All authors have read
and approved the final manuscript.
Ethics approval and consent to
participate
Not applicable.
Patient consent for publication
Not applicable.
Competing interests
All authors declare that they have no competing
interests.
References
|
1
|
Siegel RL, Miller KD, Fuchs HE and Jemal
A: Cancer statistics, 2021. CA Cancer J Clin. 71:7–33. 2021.
View Article : Google Scholar : PubMed/NCBI
|
|
2
|
Huang J, Lok V, Ngai CH, Zhang L, Yuan J,
Lao XQ, Ng K, Chong C, Zheng ZJ and Wong MCS: Worldwide burden of,
risk factors for, and trends in pancreatic cancer.
Gastroenterology. 160:744–754. 2021. View Article : Google Scholar : PubMed/NCBI
|
|
3
|
Khalaf N, El-Serag HB, Abrams HR and
Thrift AP: Burden of pancreatic cancer: From epidemiology to
practice. Clin Gastroenterol Hepatol. 19:876–884. 2021. View Article : Google Scholar : PubMed/NCBI
|
|
4
|
Anderson NM and Simon MC: The tumor
microenvironment. Curr Biol. 30:R921–R925. 2020. View Article : Google Scholar : PubMed/NCBI
|
|
5
|
Mao X, Xu J, Wang W, Liang C, Hua J, Liu
J, Zhang B, Meng Q, Yu X and Shi S: Crosstalk between
cancer-associated fibroblasts and immune cells in the tumor
microenvironment: New findings and future perspectives. Mol Cancer.
20:1312021. View Article : Google Scholar : PubMed/NCBI
|
|
6
|
Ziani L, Chouaib S and Thiery J:
Alteration of the antitumor immune response by cancer-associated
fibroblasts. Front Immunol. 9:4142018. View Article : Google Scholar : PubMed/NCBI
|
|
7
|
Beer TW, Ng LB and Murray K: Mast cells
have prognostic value in Merkel cell carcinoma. Am J Dermatopathol.
30:27–30. 2008. View Article : Google Scholar : PubMed/NCBI
|
|
8
|
Kolset SO and Pejler G: Serglycin: A
structural and functional chameleon with wide impact on immune
cells. J Immunol. 187:4927–4933. 2011. View Article : Google Scholar : PubMed/NCBI
|
|
9
|
Weniger M, Honselmann KC and Liss AS: The
extracellular matrix and pancreatic cancer: A complex relationship.
Cancers (Basel). 10:3162018. View Article : Google Scholar : PubMed/NCBI
|
|
10
|
Leinwand J and Miller G: Regulation and
modulation of antitumor immunity in pancreatic cancer. Nat Immunol.
21:1152–1159. 2020. View Article : Google Scholar : PubMed/NCBI
|
|
11
|
Mizrahi JD, Surana R, Valle JW and Shroff
RT: Pancreatic cancer. Lancet. 395:2008–2020. 2020. View Article : Google Scholar : PubMed/NCBI
|
|
12
|
Gelse K, Pöschl E and Aigner T:
Collagens-structure, function, and biosynthesis. Adv Drug Deliv
Rev. 55:1531–1546. 2003. View Article : Google Scholar : PubMed/NCBI
|
|
13
|
Klingberg S, Mortimore R, Parkes J, Chick
JE, Clague AE, Murrell D, Weedon D and Glass IA: Prenatal diagnosis
of dominant dystrophic epidermolysis bullosa, by COL7A1 molecular
analysis. Prenat Diagn. 20:618–622. 2000. View Article : Google Scholar : PubMed/NCBI
|
|
14
|
Martins VL, Vyas JJ, Chen M, Purdie K,
Mein CA, South AP, Storey A, McGrath JA and O'Toole EA: Increased
invasive behaviour in cutaneous squamous cell carcinoma with loss
of basement-membrane type VII collagen. J Cell Sci. 122:1788–1799.
2009. View Article : Google Scholar : PubMed/NCBI
|
|
15
|
Kita Y, Mimori K, Tanaka F, Matsumoto T,
Haraguchi N, Ishikawa K, Matsuzaki S, Fukuyoshi Y, Inoue H,
Natsugoe S, et al: Clinical significance of LAMB3 and COL7A1 mRNA
in esophageal squamous cell carcinoma. Eur J Surg Oncol. 35:52–58.
2009. View Article : Google Scholar : PubMed/NCBI
|
|
16
|
Baba Y, Iyama K, Honda S, Ishikawa S,
Miyanari N and Baba H: Cytoplasmic expression of type VII collagen
is related to prognosis in patients with esophageal squamous cell
carcinoma. Oncology. 71:221–228. 2006. View Article : Google Scholar : PubMed/NCBI
|
|
17
|
Oh SE, Oh MY, An JY, Lee JH, Sohn TS, Bae
JM, Choi MG and Kim KM: Prognostic value of highly expressed type
VII collagen (COL7A1) in patients with gastric cancer. Pathol Oncol
Res. 27:16098602021. View Article : Google Scholar : PubMed/NCBI
|
|
18
|
Wickham H: (2016) ggplot2: Elegant
graphics for data analysis. Springer-Verlag; New York: ISBN
978-3-319-24277-4.
|
|
19
|
Robin X, Turck N, Hainard A, Tiberti N,
Lisacek F, Sanchez JC and Müller M: pROC: An open-source package
for R and S+ to analyze and compare ROC curves. BMC Bioinformatics.
12:772011. View Article : Google Scholar : PubMed/NCBI
|
|
20
|
Love MI, Huber W and Anders S: Moderated
estimation of fold change and dispersion for RNA-seq data with
DESeq2. Genome Biol. 15:5502014. View Article : Google Scholar : PubMed/NCBI
|
|
21
|
Yu G, Wang LG, Han Y and He QY:
clusterProfiler: An R package for comparing biological themes among
gene clusters. OMICS. 16:284–287. 2012. View Article : Google Scholar : PubMed/NCBI
|
|
22
|
Hänzelmann S, Castelo R and Guinney J:
GSVA: Gene set variation analysis for microarray and RNA-seq data.
BMC Bioinformatics. 14:72013. View Article : Google Scholar : PubMed/NCBI
|
|
23
|
Bindea G, Mlecnik B, Tosolini M,
Kirilovsky A, Waldner M, Obenauf AC, Angell H, Fredriksen T,
Lafontaine L, Berger A, et al: Spatiotemporal dynamics of
intratumoral immune cells reveal the immune landscape in human
cancer. Immunity. 39:782–795. 2013. View Article : Google Scholar : PubMed/NCBI
|
|
24
|
Nagy Á, Munkácsy G and Győrffy B:
Pancancer survival analysis of cancer hallmark genes. Sci Rep.
11:60472021. View Article : Google Scholar : PubMed/NCBI
|
|
25
|
Livak KJ and Schmittgen TD: Analysis of
relative gene expression data using real-time quantitative PCR and
the 2(−Delta Delta C(T)) method. Methods. 25:402–408. 2001.
View Article : Google Scholar : PubMed/NCBI
|
|
26
|
Walker C, Mojares E and Del Río Hernández
A: Role of extracellular matrix in development and cancer
progression. Int J Mol Sci. 19:30282018. View Article : Google Scholar : PubMed/NCBI
|
|
27
|
Gatseva A, Sin YY, Brezzo G and Van
Agtmael T: Basement membrane collagens and disease mechanisms.
Essays Biochem. 63:297–312. 2019. View Article : Google Scholar : PubMed/NCBI
|
|
28
|
Martins VL, Caley MP, Moore K, Szentpetery
Z, Marsh ST, Murrell DF, Kim MH, Avari M, McGrath JA, Cerio R, et
al: Suppression of TGFβ and angiogenesis by type VII collagen in
cutaneous SCC. J Natl Cancer Inst. 108:djv2932015. View Article : Google Scholar : PubMed/NCBI
|
|
29
|
Pedersen SF, Flinck M and Pardo LA: The
interplay between dysregulated ion transport and mitochondrial
architecture as a dangerous liaison in cancer. Int J Mol Sci.
22:52092021. View Article : Google Scholar : PubMed/NCBI
|
|
30
|
Marchi S, Giorgi C, Galluzzi L and Pinton
P: Ca2+ fluxes and cancer. Mol Cell. 78:1055–1069. 2020. View Article : Google Scholar : PubMed/NCBI
|
|
31
|
Han Y, Liu C, Zhang D, Men H, Huo L, Geng
Q, Wang S, Gao Y, Zhang W, Zhang Y and Jia Z: Mechanosensitive ion
channel Piezo1 promotes prostate cancer development through the
activation of the Akt/mTOR pathway and acceleration of cell cycle.
Int J Oncol. 55:629–644. 2019.PubMed/NCBI
|
|
32
|
Oshi M, Newman S, Tokumaru Y, Yan L,
Matsuyama R, Endo I, Katz MHG and Takabe K: High G2M pathway score
pancreatic cancer is associated with worse survival, particularly
after margin-positive (R1 or R2) resection. Cancers (Basel).
12:28712020. View Article : Google Scholar : PubMed/NCBI
|
|
33
|
Krebs AM, Mitschke J, Losada ML,
Schmalhofer O, Boerries M, Busch H, Boettcher M, Mougiakakos D,
Reichardt W, Bronsert P, et al: The EMT-activator Zeb1 is a key
factor for cell plasticity and promotes metastasis in pancreatic
cancer. Nat Cell Biol. 19:518–529. 2017. View Article : Google Scholar : PubMed/NCBI
|
|
34
|
Zhou P, Li B, Liu F, Zhang M, Wang Q, Liu
Y, Yao Y and Li D: The epithelial to mesenchymal transition (EMT)
and cancer stem cells: Implication for treatment resistance in
pancreatic cancer. Mol Cancer. 16:522017. View Article : Google Scholar : PubMed/NCBI
|
|
35
|
Fang Y, Saiyin H, Zhao X, Wu Y, Han X and
Lou W: IL-8-positive tumor-infiltrating inflammatory cells are a
novel prognostic marker in pancreatic ductal adenocarcinoma
patients. Pancreas. 45:671–678. 2016. View Article : Google Scholar : PubMed/NCBI
|
|
36
|
Zhang Y, Velez-Delgado A, Mathew E, Li D,
Mendez FM, Flannagan K, Rhim AD, Simeone DM, Beatty GL and di
Magliano MP: Myeloid cells are required for PD-1/PD-L1 checkpoint
activation and the establishment of an immunosuppressive
environment in pancreatic cancer. Gut. 66:124–136. 2017. View Article : Google Scholar : PubMed/NCBI
|
|
37
|
Protti MP and De Monte L: Immune
infiltrates as predictive markers of survival in pancreatic cancer
patients. Front Physiol. 4:2102013. View Article : Google Scholar : PubMed/NCBI
|
|
38
|
Yang MW, Tao LY, Jiang YS, Yang JY, Huo
YM, Liu DJ, Li J, Fu XL, He R, Lin C, et al: Perineural invasion
reprograms the immune microenvironment through cholinergic
signaling in pancreatic ductal adenocarcinoma. Cancer Res.
80:1991–2003. 2020. View Article : Google Scholar : PubMed/NCBI
|
|
39
|
Marcon F, Zuo J, Pearce H, Nicol S,
Margielewska-Davies S, Farhat M, Mahon B, Middleton G, Brown R,
Roberts KJ and Moss P: NK cells in pancreatic cancer demonstrate
impaired cytotoxicity and a regulatory IL-10 phenotype.
Oncoimmunology. 9:18454242020. View Article : Google Scholar : PubMed/NCBI
|