Introduction
Colon adenocarcinoma (COAD) is the third leading
cause of cancer-related mortality worldwide and the fatality rate
is as high as 50.2%, according to statistics for 2020 (1). COAD accounts for 80–90% of colon
cancer on the basis of pathological classification. At present, the
5-year survival rate of patients with COAD without distant
metastasis has an improved prognosis, but the survival rate of
patients with distant metastases is <30% (2). Target therapies and immune checkpoint
blockade therapies have shown desirable results in both early-stage
and advanced-stage colon cancer, but resistance is a major unsolved
problem (3,4). Therefore, a comprehensive
understanding of the genetic variation and Tumor microenvironment
(TME) of colon cancer is the best choice for treatment and
prognostic assessment.
In the 1960s, the era of cancer treatment using
copper was beginning (5). A
previous study confirmed higher levels of copper in the serum and
tumor tissue compared with that in healthy subjects (6). Copper participates in the
proliferation, angiogenesis and metastasis of tumors (7). Therefore, abnormal copper levels may
be a new target for cancer therapy (8). Unbalanced copper homeostasis may cause
irreversible damage to cells. The cell death mechanism caused by
copper is distinct from all the other known programmed cell death
mechanisms, such as apoptosis, pyroptosis, ferroptosis and
necroptosis, and this non-specific mechanism is termed
‘cuproptosis’ (9). Cuproptosis, as
a new form of programmed cell death, sheds light on tumor
treatments. According to a recent study, cuproptosis is mediated by
an ancient mechanism: Mitochondrial respiration. Mitochondria are
essential regulators of cell proliferation and the dysregulation of
mitochondrial function are closely associated with colon cancer
(10). A close correlation between
blood copper levels and colorectal cancer has been discovered
(11). However, the relationship
between COAD and cuproptosis-associated genes remains to be
elucidated. The following genes, FDX1, LIPT1, LIAS, DLD, DLAT,
PDHA1 and PDHB can rescue cells from cuproptosis, while
the three other genes (MTF1, GLS and CDKN2A) are the
sensitizers of cuproptosis through whole genome CRISPR-Cas9
knockout screening (9). Copper
ionophores, including the importer SLC31A1 (12) and copper chelators, including the
exporters ATP7B (13–15)
were used to maintain the copper homeostasis. The overexpression of
SCL31A1 and deletion of ATP7B could increase
sensitivity to cuproptosis. These 12 genes have been confirmed to
be closely associated with cuproptosis (9). The correlation of cuproptosis with
prognosis of COAD remains to be elucidated. Therefore, the role of
cuproptosis in tumorigenesis and the relationship between
cuproptosis-associated genes and COAD are waiting for
exploration.
The present study explored the potential
relationship between 12 cuproptosis-associated genes and COAD.
Patients with COAD were divided into two cuproptosis-related
molecular subtypes according to the expression levels of 12
cuproptosis-associated genes in each sample. The patients were then
classified into three gene subtypes according to differentially
expressed genes (DEGs) of prognostic value based on the two
cuproptosis-related subtypes. Finally, a risk score and a nomogram
predicting pattern were established to predict survival probability
and immune characteristics of COAD, which may predict patient
prognosis and immunotherapeutic sensitivity.
Materials and methods
COAD data integration
The RNA transcriptome dataset [Fragments Per
Kilobase Million (FPKM)], tumor somatic mutation data and clinical
data of COAD including survival time, survival status, age, sex,
stage and tumor node metastasis TMN classification, which were
downloaded from the Cancer Genome Atlas (TCGA; http://portal.gdc.cancer.gov/) database on April
22, 2022. GSE17536 was obtained from the Gene Expression Omnibus
(GEO; http://www.ncbi.nlm.nih.gov/geo/). All mRNA expression
data were collected from human tumor or para-carcinoma tissues.
FPKM format was transformed into the Transcripts Per Kilobase
Million (TPM) form (16,17). The batch effect of the merged
datasets and other unrelated variables were removed by the package
SVA of R software 4.1.1 (https://www.r-project.org/) (18). Patients without clinical information
were excluded, a total of 623 patients were included in the
subsequent analyses.
Identification of subtypes and
biological function enrichment
The consensus unsupervised clustering analysis was
used to stratify patients into distinct molecular subtypes
according to the expression levels of 12 cuproptosis-associated
genes in each patient. The differences in prognosis and survival
rate of subtypes were assessed using the univariate Cox regression
and the Kaplan-Meier survival analysis generated by the ‘survival’
and ‘survminer’ R packages (19).
Gene set variation analysis (GSVA) was applied to ascertain the
different enrichment of molecular subtypes in biological processes
with the Kyoto Encyclopedia of Genes and Genomes (KEGG) and
Hallmark gene set (http://www.gsea-msigdb.org/gsea/downloads
c2.cp.kegg.v7.5.1.symbols.gmt and h.all.v7.5.1.symbols.gmt were
downloaded on June 25, 2022.).
Construction of the risk score
The risk score associated with cuproptosis prognosis
was calculated to quantify the individual colon tumors. First, the
differentially expressed genes (DEGs) between the cuproptosis
subtypes were identified and the prognostic DEGs were screened out
by the univariate Cox regression analysis with P<0.001, to
classify the patients into three subtypes (cuproptosis gene subtype
A, B and C) using a consensus unsupervised clustering method.
Second, based on the prognostic DEGs, the least absolute shrinkage
and selection operator (LASSO) Cox regression algorithm was applied
to minimize the risk of over-fitting by the ‘glmnet’ R package
(19). Last, the key genes and
their correlative coefficients were obtained using multivariate Cox
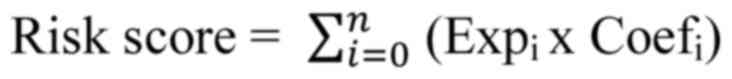
analysis to establish risk score. The risk score of each patient
was calculated as follows:
Expi and Coefi represented
each gene's expression and correlative coefficient, respectively.
The patients were divided into the low-risk group (<median
value) or the high-risk group (≥median value) (19). The median is a measure of the
central tendency of the data and represents the general level of
the data, which means that a lot of the data in a dataset are not
affected by the data that is too large or too small. The ‘survival’
R package was used to determine the survival rate of two risk
groups. Finally, in order to verify the reliability of the risk
score, all patients with COAD were randomly categorized into the
internal group (training group, n=312) and the external validation
groups (testing group, n=311) with the R package ‘caret’ (19).
To assess whether the risk score was independent of
other clinicopathological features, forest maps for univariate and
multivariate independent prognostic analyses were performed. A
time-dependent receiver operating characteristic (ROC) curve was
used to evaluate the reliability of prognosis for 1-, 3-, 5-years.
In addition, the present study investigated whether the risk score
maintained its superior performance to the traditional
clinicopathological features (age, sex, stage, T, M, N) by the ROC
curve.
Reverse transcription-quantitative
(RT-q) PCR
Total RNA was extracted from HCT-116 colon cancer
cell lines and HT-29 colorectal cancer cell lines
(1×10⁵/ml; American Type Culture Collection) using
TRIzol reagent (Invitrogen; Thermo Fisher Scientific, Inc.) and TB
Green Premix Ex Taq™ II (Takara Bio, Inc.). Complementary DNA
(cDNA) was synthesized using the total RNA and a PrimeScript RT
reagent kit (Takara Bio, Inc.). SYBR Green assays were used to
perform the RT-qPCR on CFX 96 Thermocycler (Bio-Rad Laboratories,
Inc.). RNA extraction, cDNA synthesis, and qPCR were performed
according to the manufacturer's protocols. Amplification conditions
were 5 min at 95°C and then 40 cycles each consisting of 10 sec at
95°C, 1 min at 60°C and 10 sec at 72°C. The data were calculated
through the 2−ΔΔCq (19), normalizing with GAPDH. The primer
sequences used for RT-qPCR in this study are listed in Table SI. Experiments were repeated three
times.
Analysis of immune function,
checkpoints, tumor mutation burden (TMB), microsatellite
instability (MSI) and drug susceptibility between two risk
groups
TIMER, CIBERSORT, CIBERSORT-ABS, quanTIseq,
MCP-counter, xCell and EPIC algorithms (20) were used to assess the expression
level of immune cells by correlation analysis of risk score. The
present study also validated differential expression of immune cell
subpopulations-related function, immune checkpoints and MSI between
low- and high-risk groups. Next, the datasets of 448 COAD-related
mutations from the TCGA database were downloaded to compare the
score of TMB by Spearman correlation analysis. To explore the
difference of drug susceptibility between the two risk groups, the
‘pRRophetic’ algorithm and ‘ggpubr’ packages (19) were used to calculate the
semi-inhibitory concentration (IC50) values of commonly
used immunotherapeutic drugs in cancer treatment.
Construction of a nomogram scoring
pattern
Nomogram scoring pattern was constructed by the
‘Regplot’ package based on the results of independent prognostic
analyses according to different clinical characteristics and risk
score (21). In the nomogram
scoring pattern, each variable was matched with a score. The scores
of all variables in each patient were added to get the total scores
(22), which would indicate the
survival probability of each patient <1-, 3-, 5-years,
respectively.
Statistical analyses
All statistical analyses were performed by R version
4.1.1 and P<0.05 was considered to indicate a statistically
significant difference. Significantly differences of model genes
between the normal group and HCT-116 or HT-29 cells in the RT-qPCR
analysis were measured by two ways of analysis of variance with
Bonferroni's post-test.
Results
Variation of cuproptosis-associated
genes in COAD
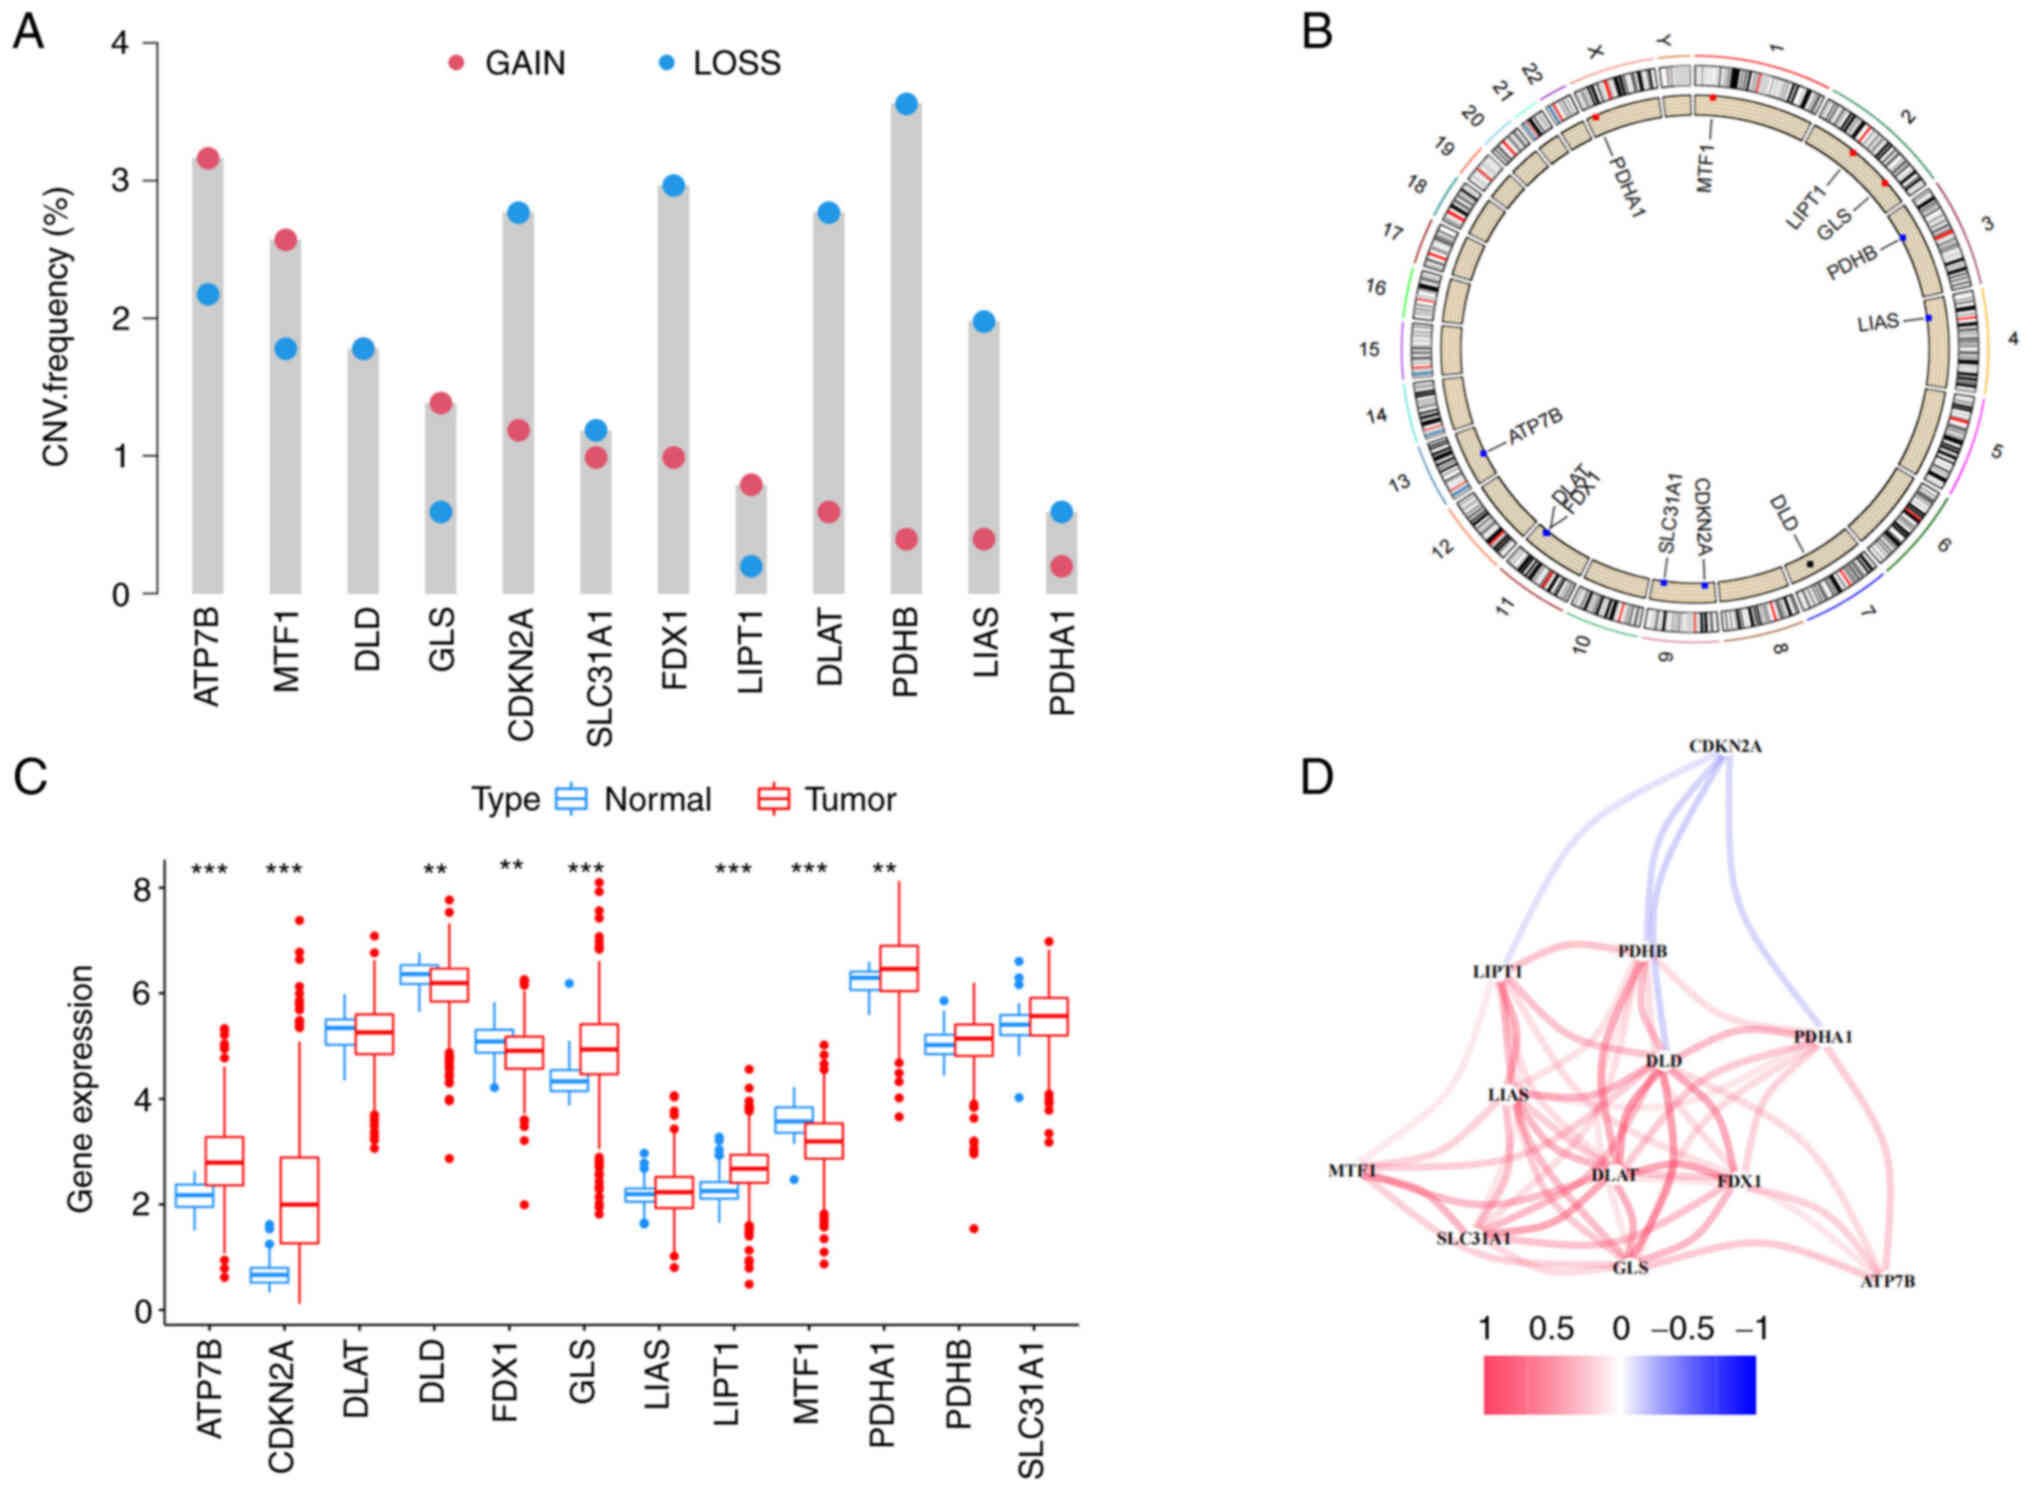
The analysis flow chart is Fig. S1. First, copy number variation
(CNV) of 12 cuproptosis-associated genes were explored and it was
found that PDHB had the highest CNV deletion followed by
FDX1, CDKN2A, DLAT, LIAS, DLD, whereas ATP7B, MTF1,
GLS and LIPT1 had CNV amplification (Fig. 1A). The circle graph shows the
location of CNV alteration on respective chromosomes (Fig. 1B). Furthermore, the expression level
of cuproptosis-associated genes between normal tissues and COAD was
compared. It was discovered that PDHA1, ATP7B, CDKN2A, GLS
and LIPT1 were significantly increased in tumor tissues, but
MTF1, DLD and FDX1 were increased in normal tissues.
The expression levels of most genes were positively correlated with
the change in CNV. Compared with normal tissues, CNV loss such as
FDX1 and DLD was expressed at lower levels in tumors,
while CNV gain such as ATP7B, GLS and LIPT1 were
significantly increased in tumors, suggesting that CNV regulates
mRNA expression of genes (Fig. 1C).
However, CNV deletion of CDKN2A showed higher expression in
tumors, while CNV amplification of MTF1 downregulated mRNA
expression in tumors. It might be that CNV is not the only factor
that regulates mRNA expression (23). Other factors, such as transcription
factors or DNA methylation, can also regulate mRNA expression
(24,25). It was observed that 11 out of 12
genes were positively regulated by polygenic correlation analysis,
but CDKN2A was an exception (Fig. 1D). Last, the prognosis of 12
cuproptosis-associated genes was performed and CDKN2A was
identified as the best independent predictive factor (P=0.034; HR:
1.20985; 95% CI: 1.06503-1.37437). The results indicated that the
genetic variation and expression of 12 cuproptosis-associated genes
are different between normal tissues and COAD, indicating that they
have a potential role in tumorigenesis.
Identification of cuproptosis subtypes
and enrichment analysis of biological function
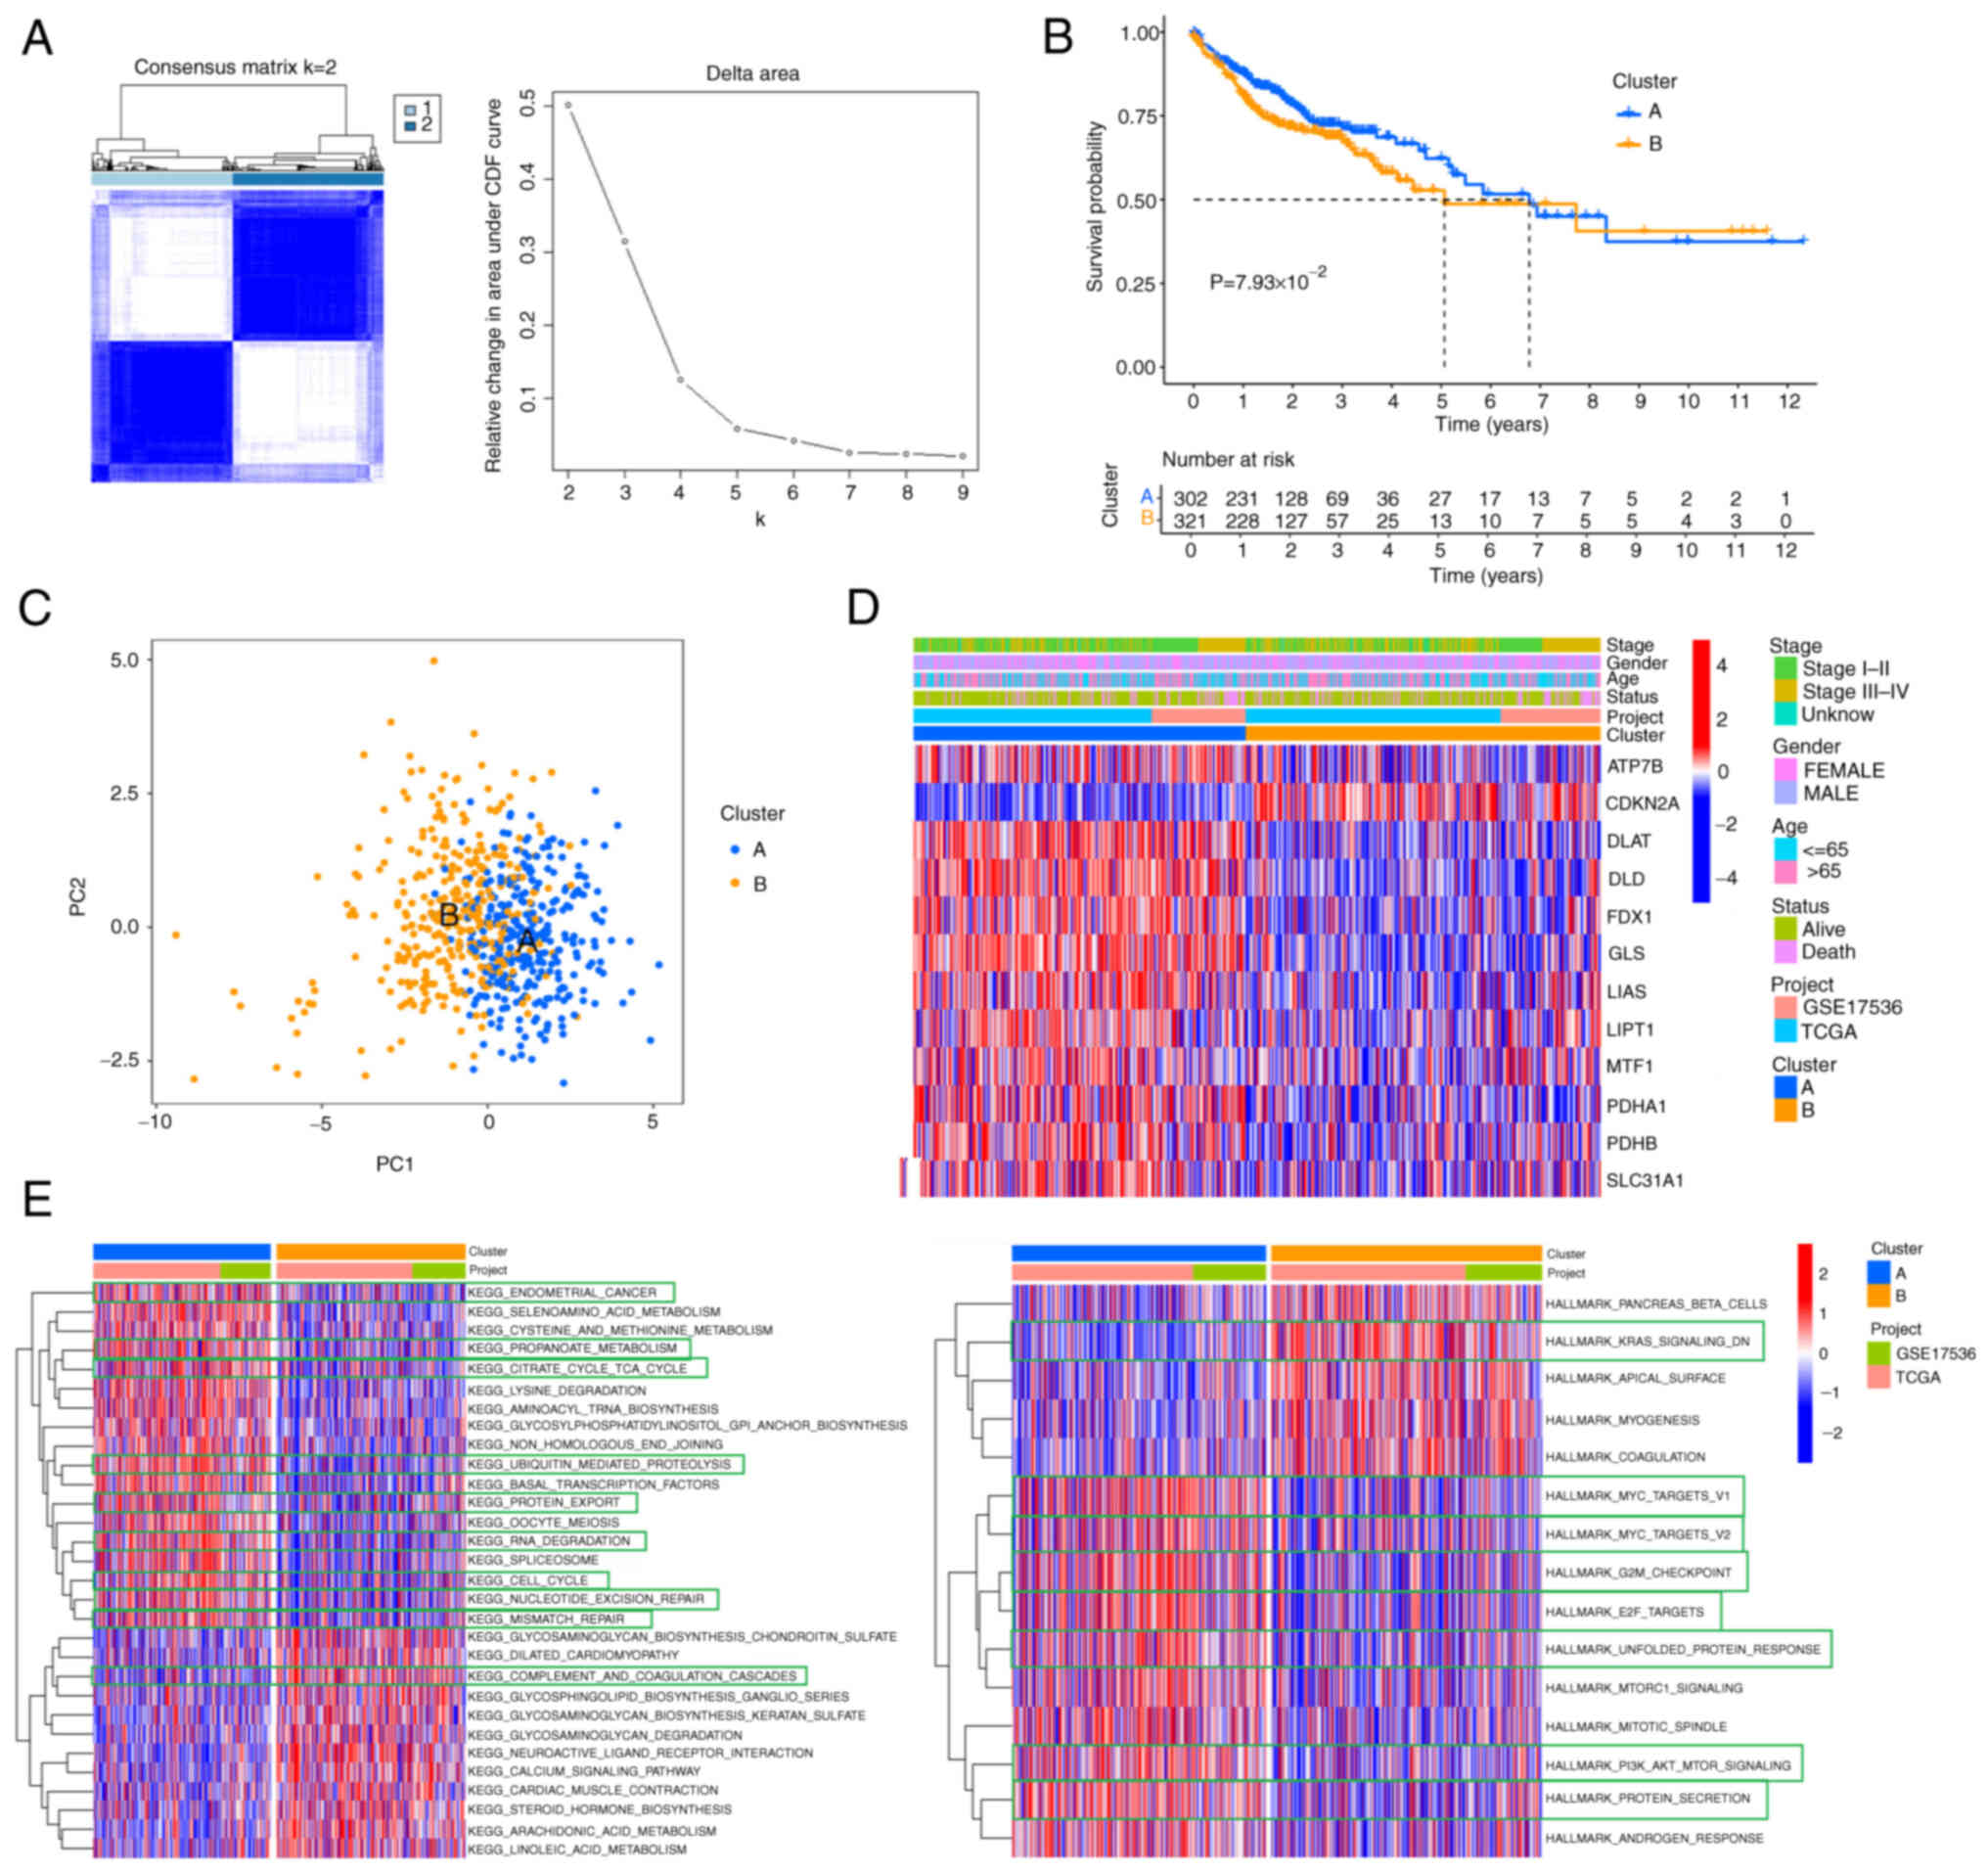
The present study categorized 623 patients into two
subtypes, including 302 cases in subtype A and 321 cases in subtype
B, based on the optimal selection k=2. The cumulative distribution
function (CDF) curve increased gradually and smoothly (Fig. 2A). These were termed cluster A and
B, respectively. The survival analysis showed cluster A had an
improved survival rate than cluster B within seven years (Fig. 2B). The differences between the two
subtypes were revealed by principal component analysis (PCA)
analysis (Fig. 2C). Furthermore, a
heat map of the clinical characteristics of two clusters showed
that most cuproptosis-associated genes were highly expressed in
cluster A, while the minority was expressed in cluster B (Fig. 2D). But CDKN2A was highly
expressed in cluster B. It was hypothesized that CDKN2A was
associated with tumorigenesis and had an impact on survival.
CDKN2A can be regarded as a promising biomarker of colon
cancer (26). CDKN2A, as an
important marker of epithelial-mesenchymal transition, tends to be
upregulated in colon cancer (27).
Cluster B had more mortality and advanced stage (stage III–IV)
compared with cluster A. Finally, gene set variation analysis
(GSVA) analysis in KEGG showed that cancer or immune-related
pathways, molecular processes, including endometrial cancer, cell
cycle, ubiquitin-mediated proteolysis and TCA cycle pathway were
enriched in cluster A (Fig. 2E).
Additionally, the GSVA in Hallmark found the diverse pathways were
highly enriched in cluster A, such as MYC targets, G2M checkpoint,
E2F targets, unfolded protein response and PI3K/AKT/mTOR signaling.
According to the above analyses, it was hypothesized that
cuproptosis-associated genes might regulate immune-related and cell
death-related molecular processes and pathways to inhibit the
progression of tumors (28).
Identification of gene subtypes and
construction of the risk score
The two subtypes were compared to find 5,366 DEGs
from the intersection. The prognostic values of 29 genes were
subsequently screened by univariate Cox regression analysis.
Corresponding to cuproptosis-related subtypes, the consensus
clustering algorithm was also used to stratify patients into three
genomic subtypes based on 29 prognostic genes termed gene subtypes
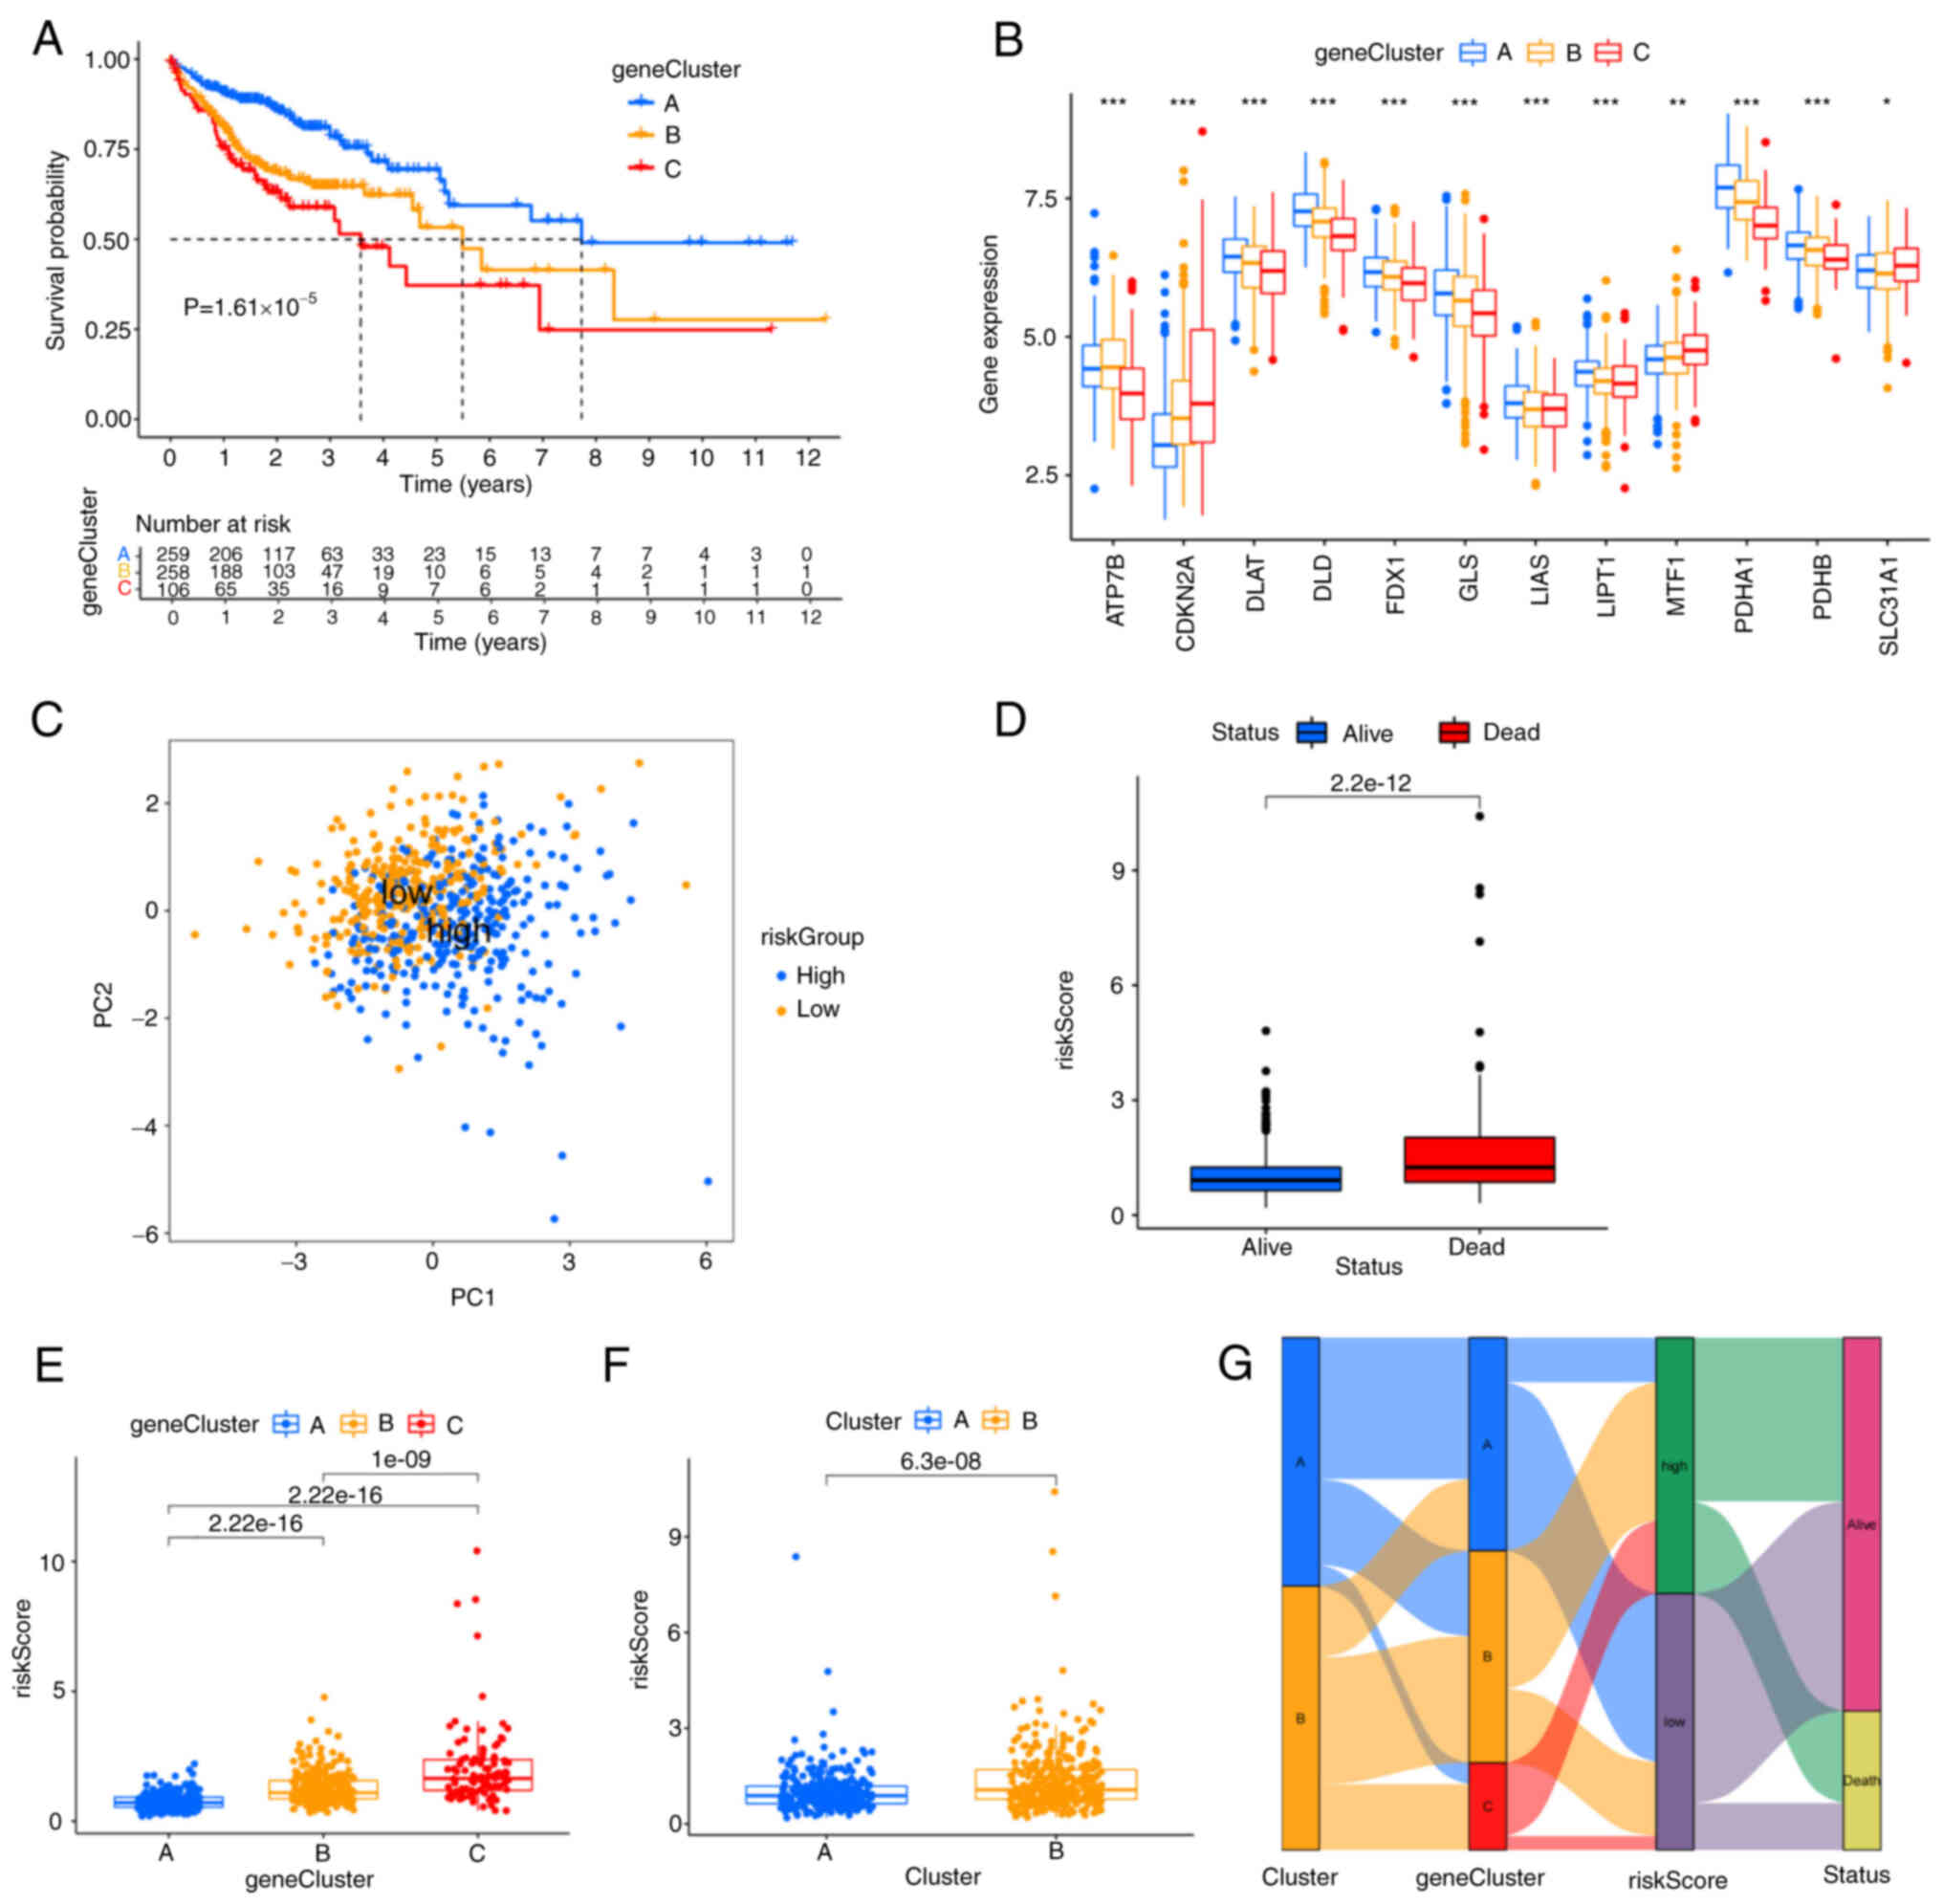
A, B and C. The survival curves showed that gene cluster A had the
best survival advantages over the other two clusters (Fig. 3A). In addition, there were
significant differences in the expression level of
cuproptosis-associated genes among the three gene subtypes and most
them were highly expressed in subtype A (Fig. 3B). As expected, CDKN2A was
highly expressed in cluster C with the poorest survival rate. To
further understand the characteristics of cuproptosis in each
patient, the risk score was established, the key 7 model genes and
their correlative coefficients were obtained by LASSO and
multivariate Cox regression analysis (Table SII), including three high-risk
genes (KDM3A, HSPB1 and UPK3B) and four
low-risk genes (PMM2, ACOX1,
PPARGC1A and EPHB2). The risk score of
each patient was constructed as follows:
Risk score=(−0.34559 × expressionPMM2) +
(−0.44662 × expressionACOX1) + (0.79297 ×
expressionKDM3A) + (0.14968 ×
expressionHSPB1) + (−0.20650 ×
expressionPPARGC1A) + (0.19863 ×
expressionUPK3B) + (−0.14950 ×
expressionEPHB2).
The patients with risk score lower than the median
value of 0.9555921 were categorized into the low-risk group
(n=312), while those with risk score higher than the median value
were placed in the high-risk group (n=311). The discernible
separation between high- and low-risk groups was conducted by PCA
analysis (Fig. 3C). As the risk
score increased, patient mortality increased (Fig. 3D). It was discovered that the risk
score showed different distribution in cuproptosis clusters and
gene clusters. The risk score of gene cluster C was the highest,
while cuproptosis-related cluster B was markedly correlated with a
higher risk score (Fig. 3E and F).
The Sankey diagram showed the changes in attributions of individual
patients and the majority of patients from the low-risk group
survived (Fig. 3G). The above
results indicated the risk score was negatively correlated with the
patient's survival, while survival rates decreased with increased
risk scores.
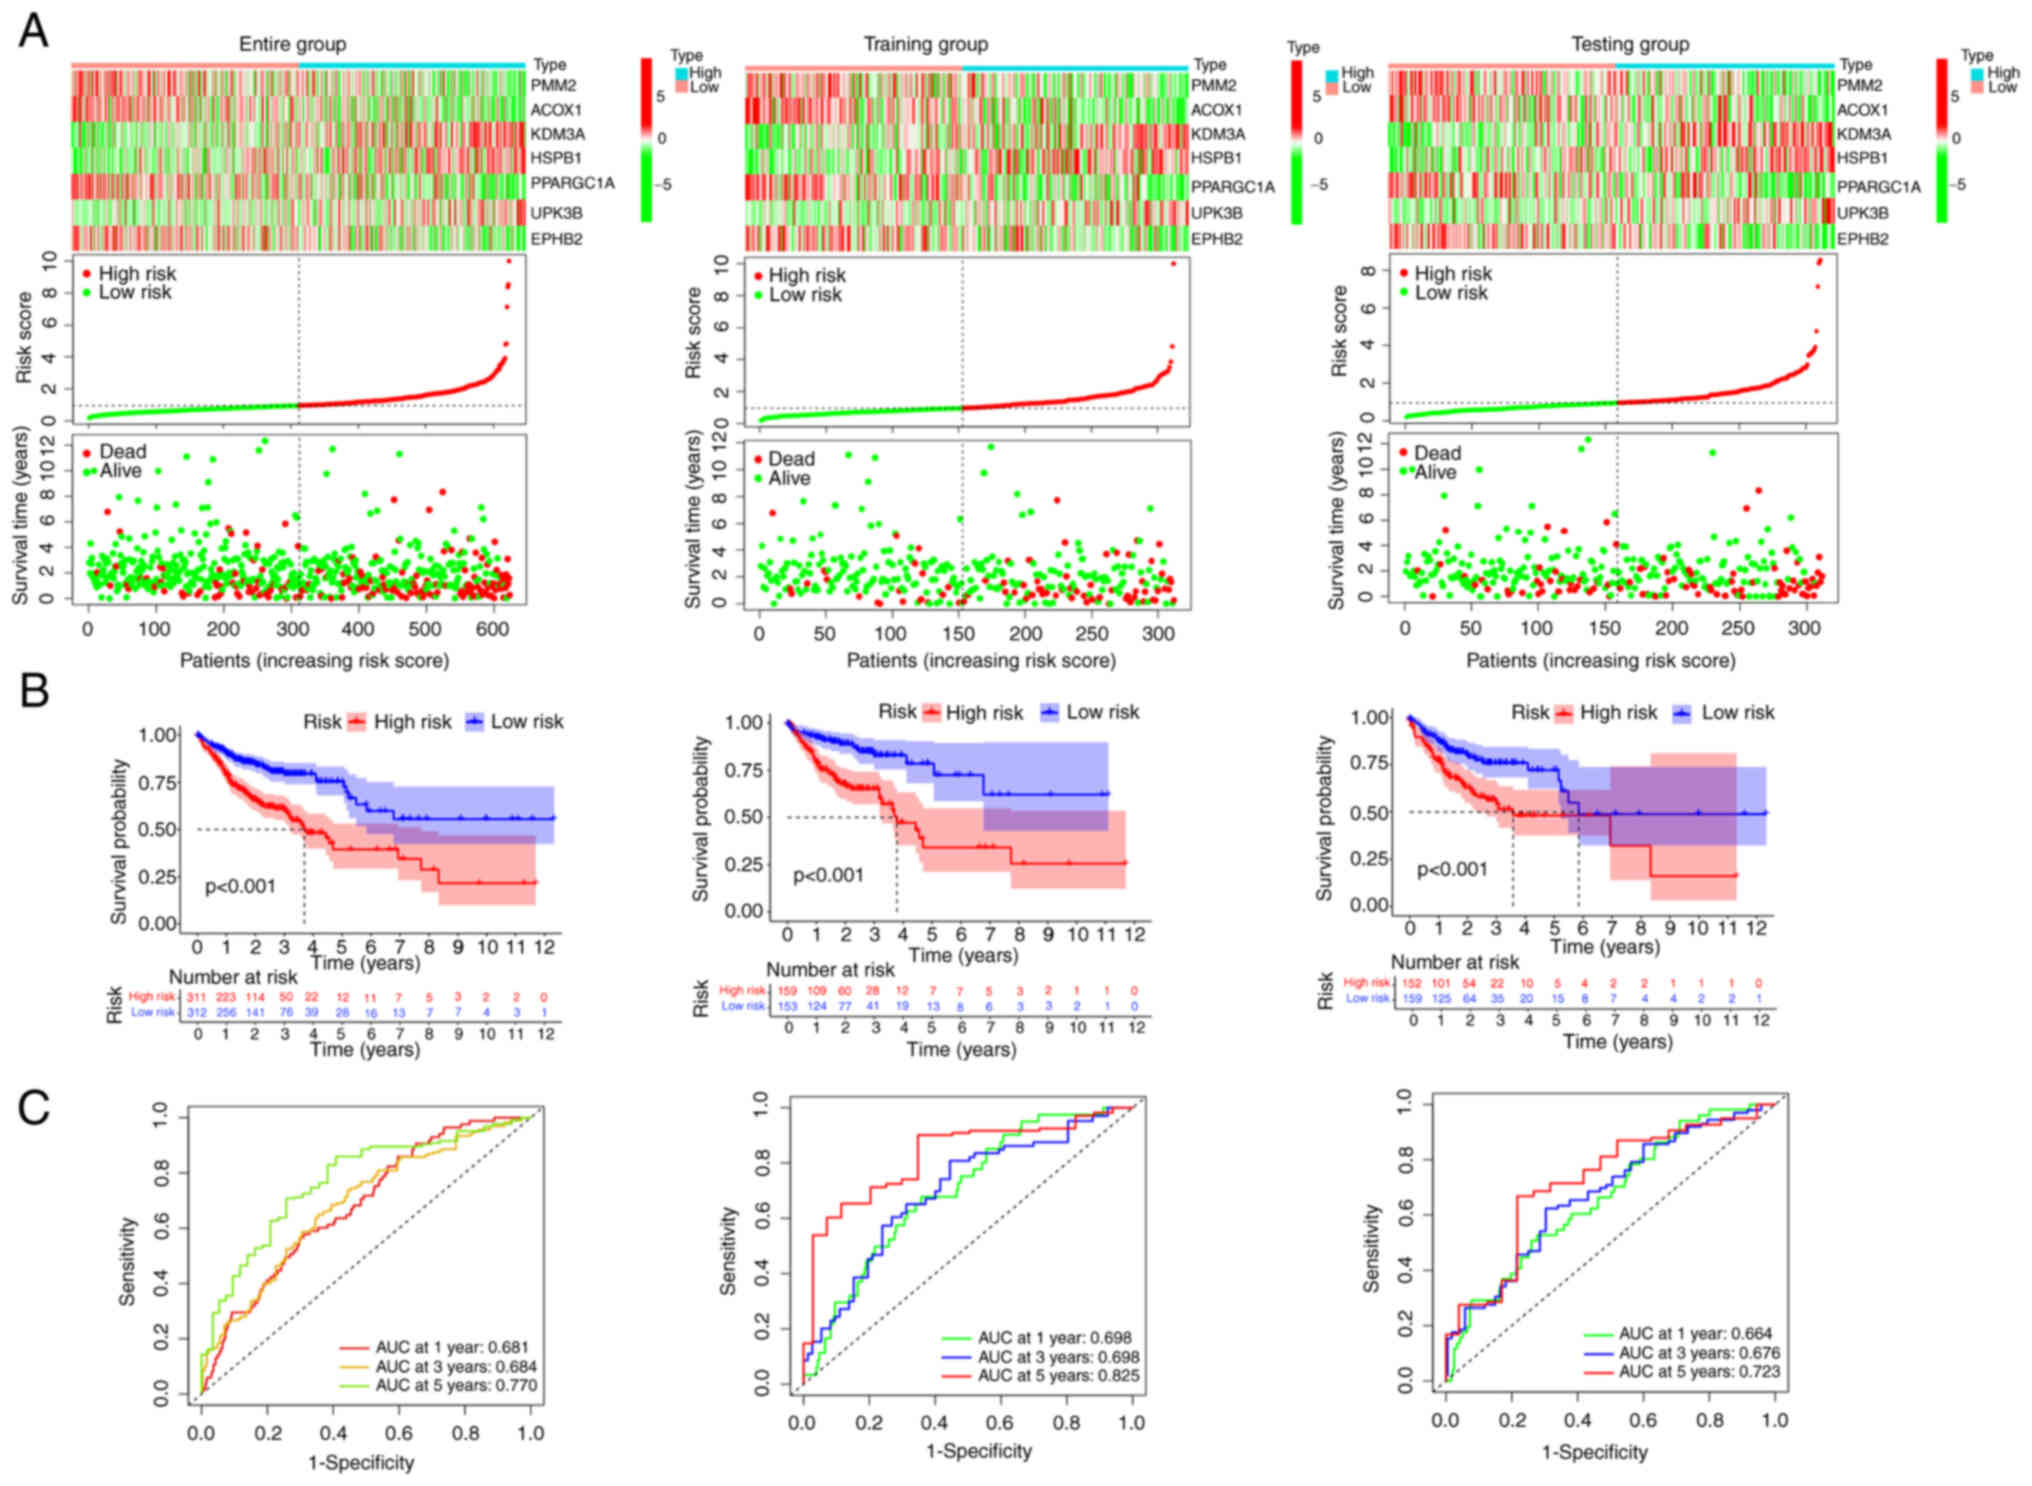
To validate the prognostic reliability of risk
score, all patients were randomly stratified into the training
group (n=312) and the testing group (n=311). The patients were also
classified into low- or high-risk groups according to the above
risk score formula and the median value. The three high-risk genes
(KDM3A, HSPB1 and UPK3B) were highly
expressed in the high-risk group according to the heat map and the
survival status distribution plot revealed that as the risk score
increased, the mortality also increased (Fig. 4A). Survival analysis revealed a
significantly improved prognosis in the low-risk group than in the
high-risk group (P<0.001; Fig.
4B). Furthermore, the area under the curve (AUC) values of the
patients' 1-, 3-, 5-year survival rates were predicted as 0.681,
0.684 and 0.770 in the entire group, respectively. The AUC value of
training and testing groups were all >0.6 (Fig. 4C). The patient survival status
distribution plot, survival analysis and ROC showing the same
tendencies of the two risk groups in the entire, training and
testing groups. All of these indicated that the risk score had a
stable performance to predict the prognosis of patients with
COAD.
Analysis of independent prognosis and
immune infiltration of risk score
To further confirm that the risk score was superior
to the other clinical characteristics, univariate and multivariate
independent prognostic analyses were performed. The risk score was
confirmed as an independent prognostic factor (P<0.001; HR:
1.350; 95% CI: 1.189-1.534; Fig. 5A and
B). ROC curves were used to determine whether the risk score
could be used as an early prediction for COAD. It was found the
area under the risk score curve of 5-year AUC was the largest,
implying that the sensitivity and specificity of this prognostic
pattern are more feasible than the other clinical factors (Fig. 5C). The high-risk group was closely
associated with higher stromal scores and immune scores by
difference analysis in the TME (Fig.
5D), suggesting the higher estimate scores and the lower tumor
purity in the high-risk group. Analysis of gliomas showed that
tumors with lower purity had higher malignancy and worse prognosis
(29). Low tumor purity was an
independent predictor of poor prognosis in colon cancer with a
higher TMB and stronger immunophenotype (30). As shown in Fig. 5E, the abscissa is the correlation
coefficient of the risk score. If the correlation coefficient was
>0, the expression level of immune cells was positively
correlated with the risk score; otherwise, it was negatively
correlated. The expression levels of most immune cells was
positively correlated with the risk score and it demonstrated that
most immune cells tended to be higher enriched in the high-risk
group. In addition, the association between individual immune cells
and risk score was confirmed by correlation analysis. The risk
score was negatively correlated with plasma B cells, resting NK
cells and activated memory CD4+ T cells (Fig. S2A-C; R<0; P<0.05). By
contrast, the risk score was positively correlated with endothelial
cells, M0 macrophages, M1 macrophages, M2 Macrophages, CD8+ T cells
and T cell regulatory cells (Tregs; Fig. S2D-I; R≥0; P<0.05). As shown in
Fig. 5F, VEGF/toll-like
receptor/TGFβ/T cell receptor/Rig I-like
receptor/NOTCH/MAPK/chemokine signaling pathways were positively
correlated with the risk score, demonstrating that these
immune-related pathways were enriched in the high-risk group.
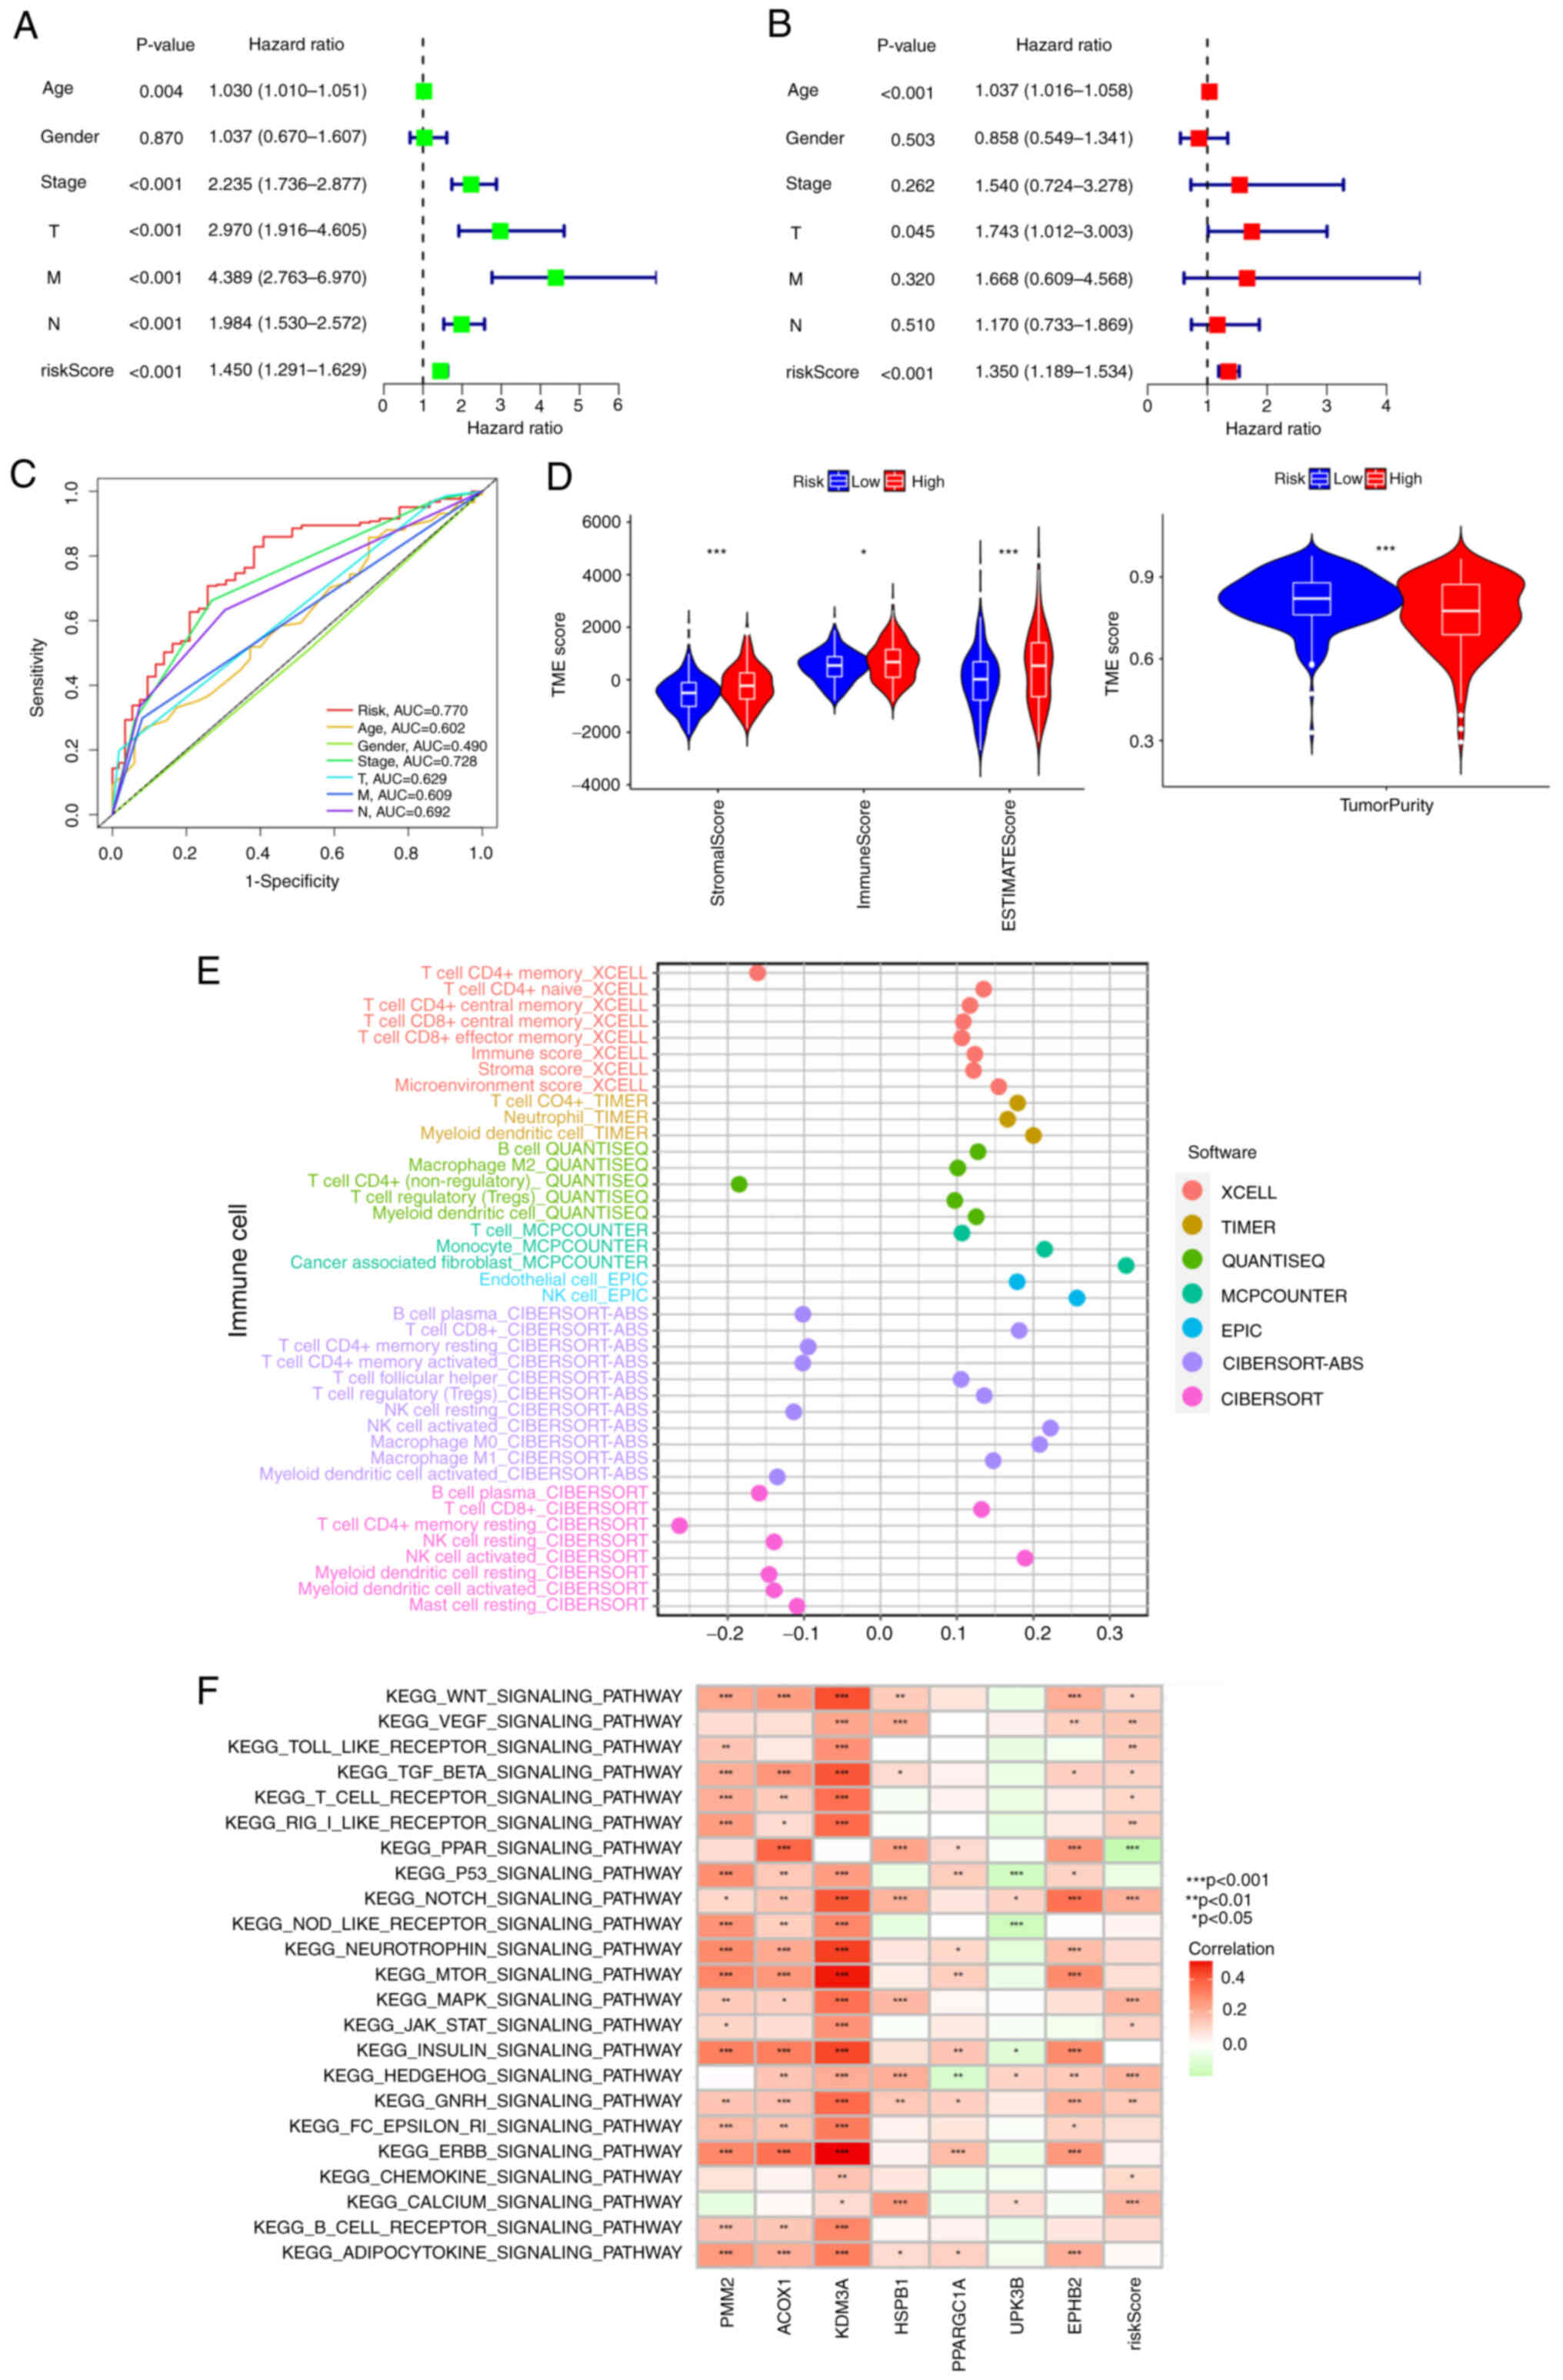 | Figure 5.Independent prognosis and immune
infiltration analyses. (A) Univariate Cox regression analysis
identification of individual factors associated with patient
survival. (B) Multivariate Cox regression analysis identify
independent prognostic factors and the result indicated that the
risk score could as independent prognostic factors (HR:1.350, 95%
CI: 1.189-1.534). Green represents the value of hazard ratio in
univariate and red represents the value of HR in multivariate
analysis. (C) The feature of AUC with a risk score of 5-year was
superior to traditional clinicopathological features in predicting
prognosis. (D) Correlations between risk score and immune, stromal
scores and tumor purity, *P<0.05, **P<0.01 and ***P<0.001.
(E) The correlation coefficient of immune cell expression. The
TIMER, CIBERSORT, CIBERSORT-ABC, quanTIseq, MCP-counter, xCell,
EPIC algorithms to assess the expression level of different immune
cell types. (F) KEGG pathway enrichment analysis: the abscissa is
the patient's KEGG pathways and the ordinate are seven model genes
and risk score. Red is positive, green is negative. HR, hazard
ratio; CI, confidence interval; KEGG, Kyoto Encyclopedia of Genes
and Genomes; AUC, area under the curve |
To investigate the differences in clinical
characteristics in high- and low-risk groups, the percent weight of
age, sex, stage, T, M, N was explored in two risk groups. The
results showed that patients of age >65, male, advanced-stage
tumor stage, T and M occupied the higher proportion in the
high-risk group (Fig. S3A-F).
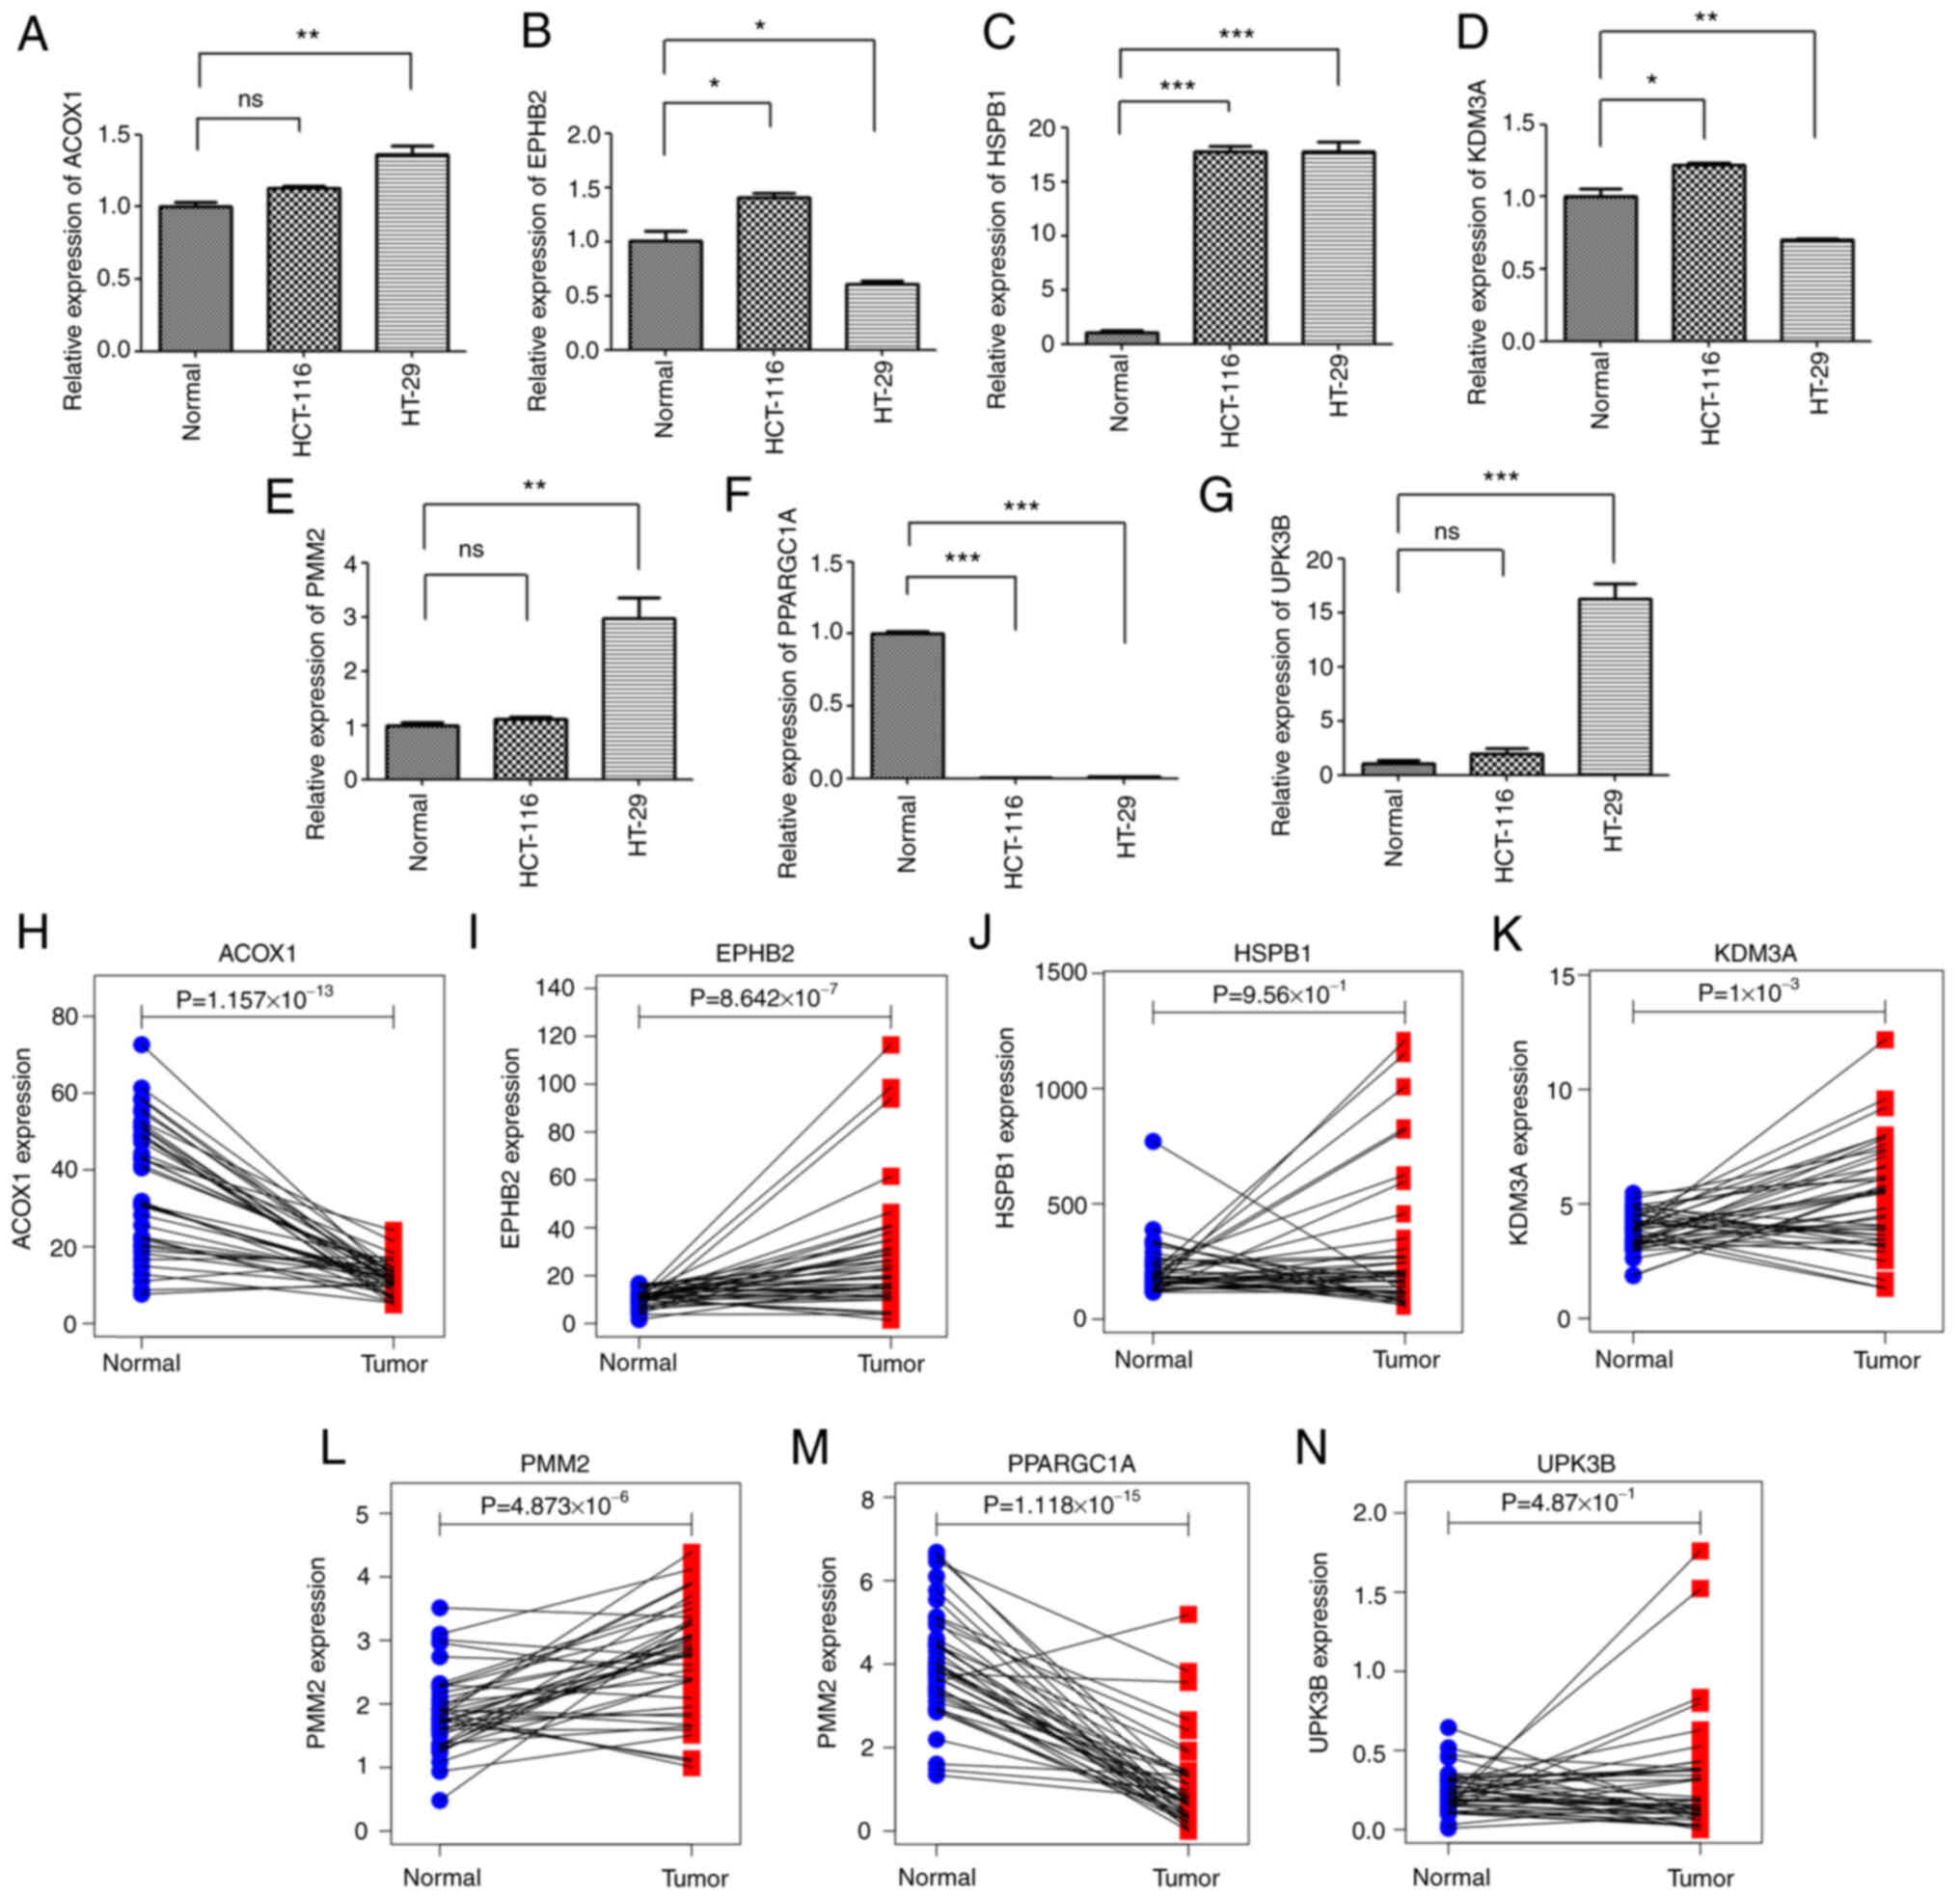
RT-qPCR analysis
The expression levels of seven model genes in
HCT-116 and HT-29 cells were investigated by RT-qPCR and the
expression of HSPB1 was the highest in tumor
cells compared with normal tissue cells. As a low-risk gene,
PPARGC1 is highly expressed in normal tissues. The
expression levels of PMM2,
ACOX1 and UPK3B were upregulated in
HCT-116 and HT-29 cells and KDM3A, EPHB2 only in
HCT-116 colon cancer cells compared to the expressed levels in the
normal tissue cells (Fig. 6A-G). By
RT-qPCR analysis, the expression trend of most model genes between
normal and tumor tissues was basically consistent with the results
based on TCGA data analysis (Fig.
6H-N).
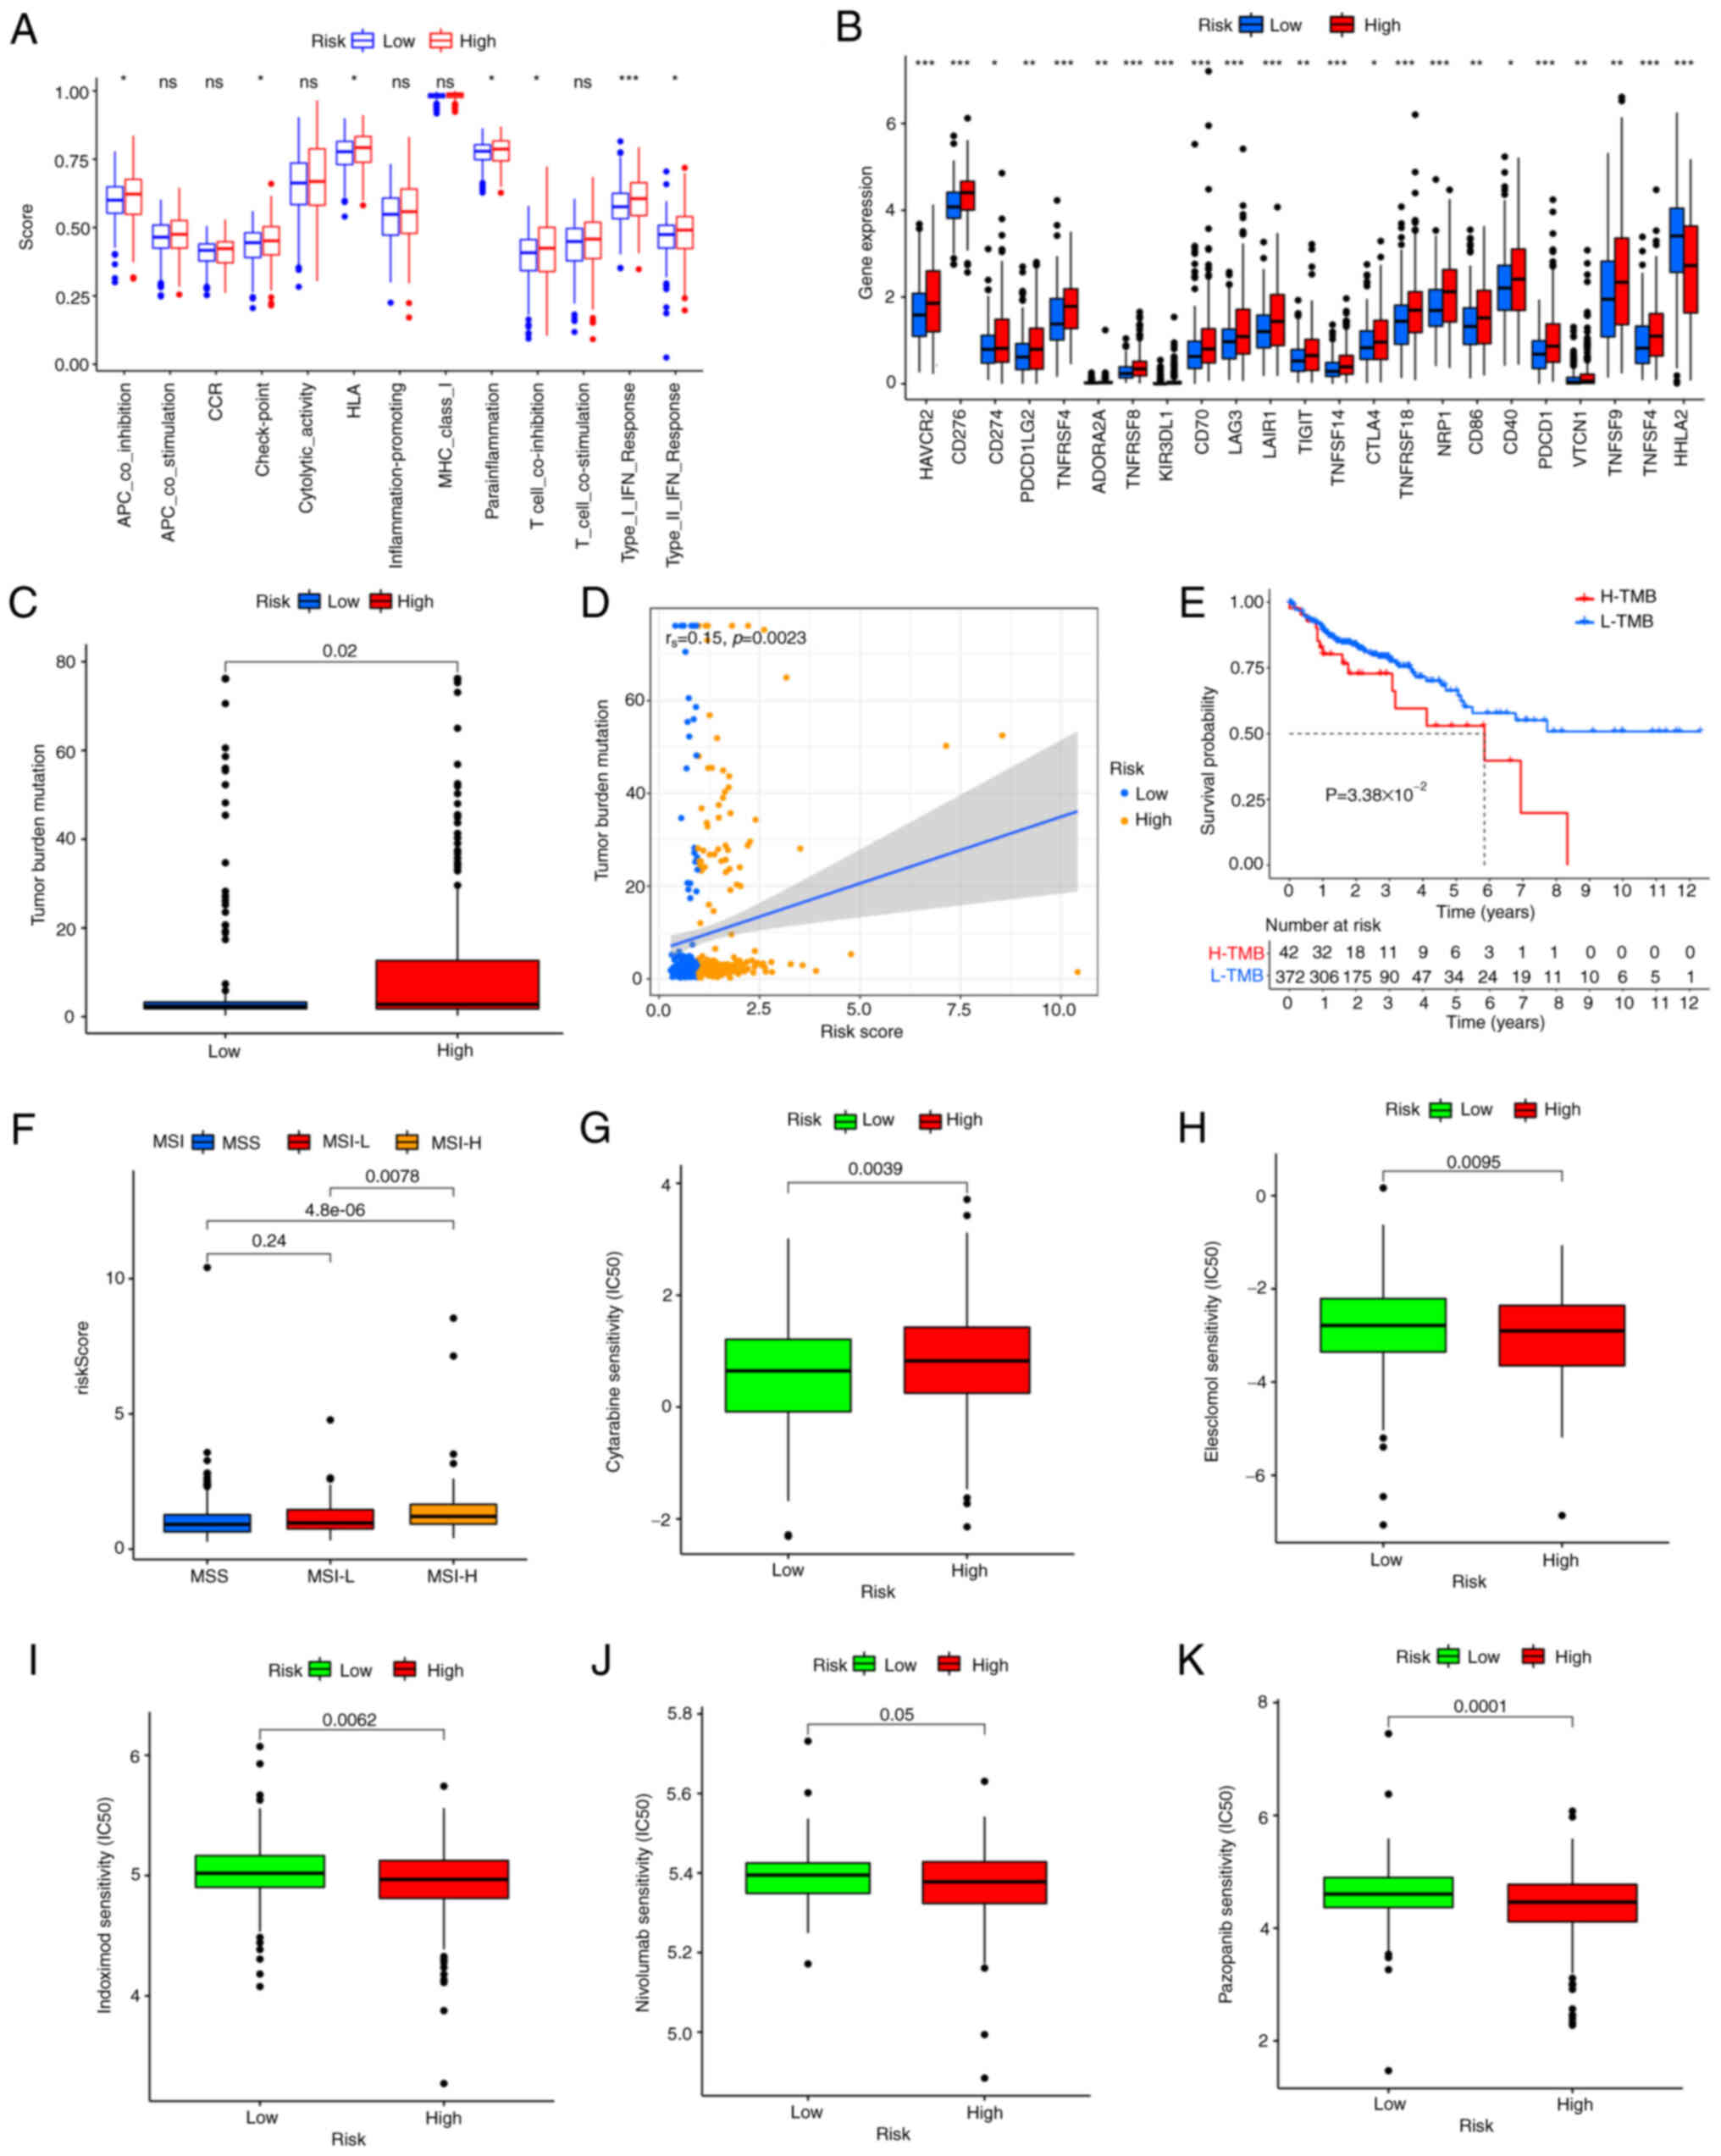
Immune function, checkpoints, TMB, MSI
and drug susceptibility analysis
The immune cell subpopulations related functions
between two risk groups were evaluated by ssGESA analysis and the
following T cell functions: APC co-inhibition, checkpoint, HLA,
para inflammation, T cell co-inhibition and type I/II IFN response
were highly enriched in the high-risk group (Fig. 7A). A previous study has elucidated
the critical role of checkpoint inhibitor utilized in
immunotherapies (31). Therefore,
the differences in the expression levels of 23 immune checkpoints
between the two risk groups was investigated and the expression
levels of CD274 (PD-L1), PDCD-1 (PD-1) and CTLA 4, etc. in the
high-risk group were significantly higher than those in the
low-risk group (Fig. 7B). The above
results demonstrated that the high-risk group had a great deal of
immune cell infiltration, the enrichment of immune-related pathways
and a higher expression level of immune checkpoints. It might be
more sensitive to immunotherapies.
Based on the risk score, the differences in TMB, MSI
and drug sensitivity between the two risk groups was assessed. Some
evidence suggests that patients with high TMB may benefit from
immunotherapy (5). Fig. 7C showed that the high-risk group had
a higher TMB compared with the low-risk group, indicating that an
apparent positive correlation could be displayed between risk score
and TMB. Spearman correlation analysis confirmed the above results
(rs=0.15; P=0.0023; Fig.
7D). According to the TMB optimal cut-off value, patients were
divided into the high- and the low-mutation group. The prognosis of
low-TMB was improved compared with that of high-TMB through
survival analysis (Fig. 7E). MSI-H
increased with the increases of risk score (Fig. 7F) and the patients with
high-frequency MSI-H are more sensitive to and benefit greatly from
immunotherapies (11). Finally,
commonly used immunotherapeutic drugs and the copper ion carrier
Elesclomol were searched to evaluate the sensitivities of patients
in two risk groups. Most patients in the high-risk group had lower
IC50 values, such as Elesclomol, Indoximod, nivolumab
and Pazopanib (Fig. 7H-M), while
Cytarabine was lower in the low-risk group. Together, these results
confirmed that the patients in the high-risk group were more
sensitive to immunotherapy.
Construction of a prognostic nomogram
pattern
Considering the practicability of the risk score in
predicting the survival status of patients with COAD, a nomogram
scoring pattern combining risk score and clinicopathological
characteristics was established to predict survival probability in
1-, 3- and 5-years. As shown in Fig.
8A, the score of age was 48, the score of risk score was 22 in
the low-risk group and the total score was 466, predicting the
survival probability of less than 1-year was 18.9%, <3-year was
41.7% and <5-year was 61.2%. A subsequent calibration plot
proved the prediction accuracy of the nomogram pattern. The closer
of predicting cures are to the gray diagonal (actual curves), the
more accurate the nomogram pattern will be (Fig. 8B). The results of nomogram analysis
demonstrated that the survival probability increased while the
patient lived longer.
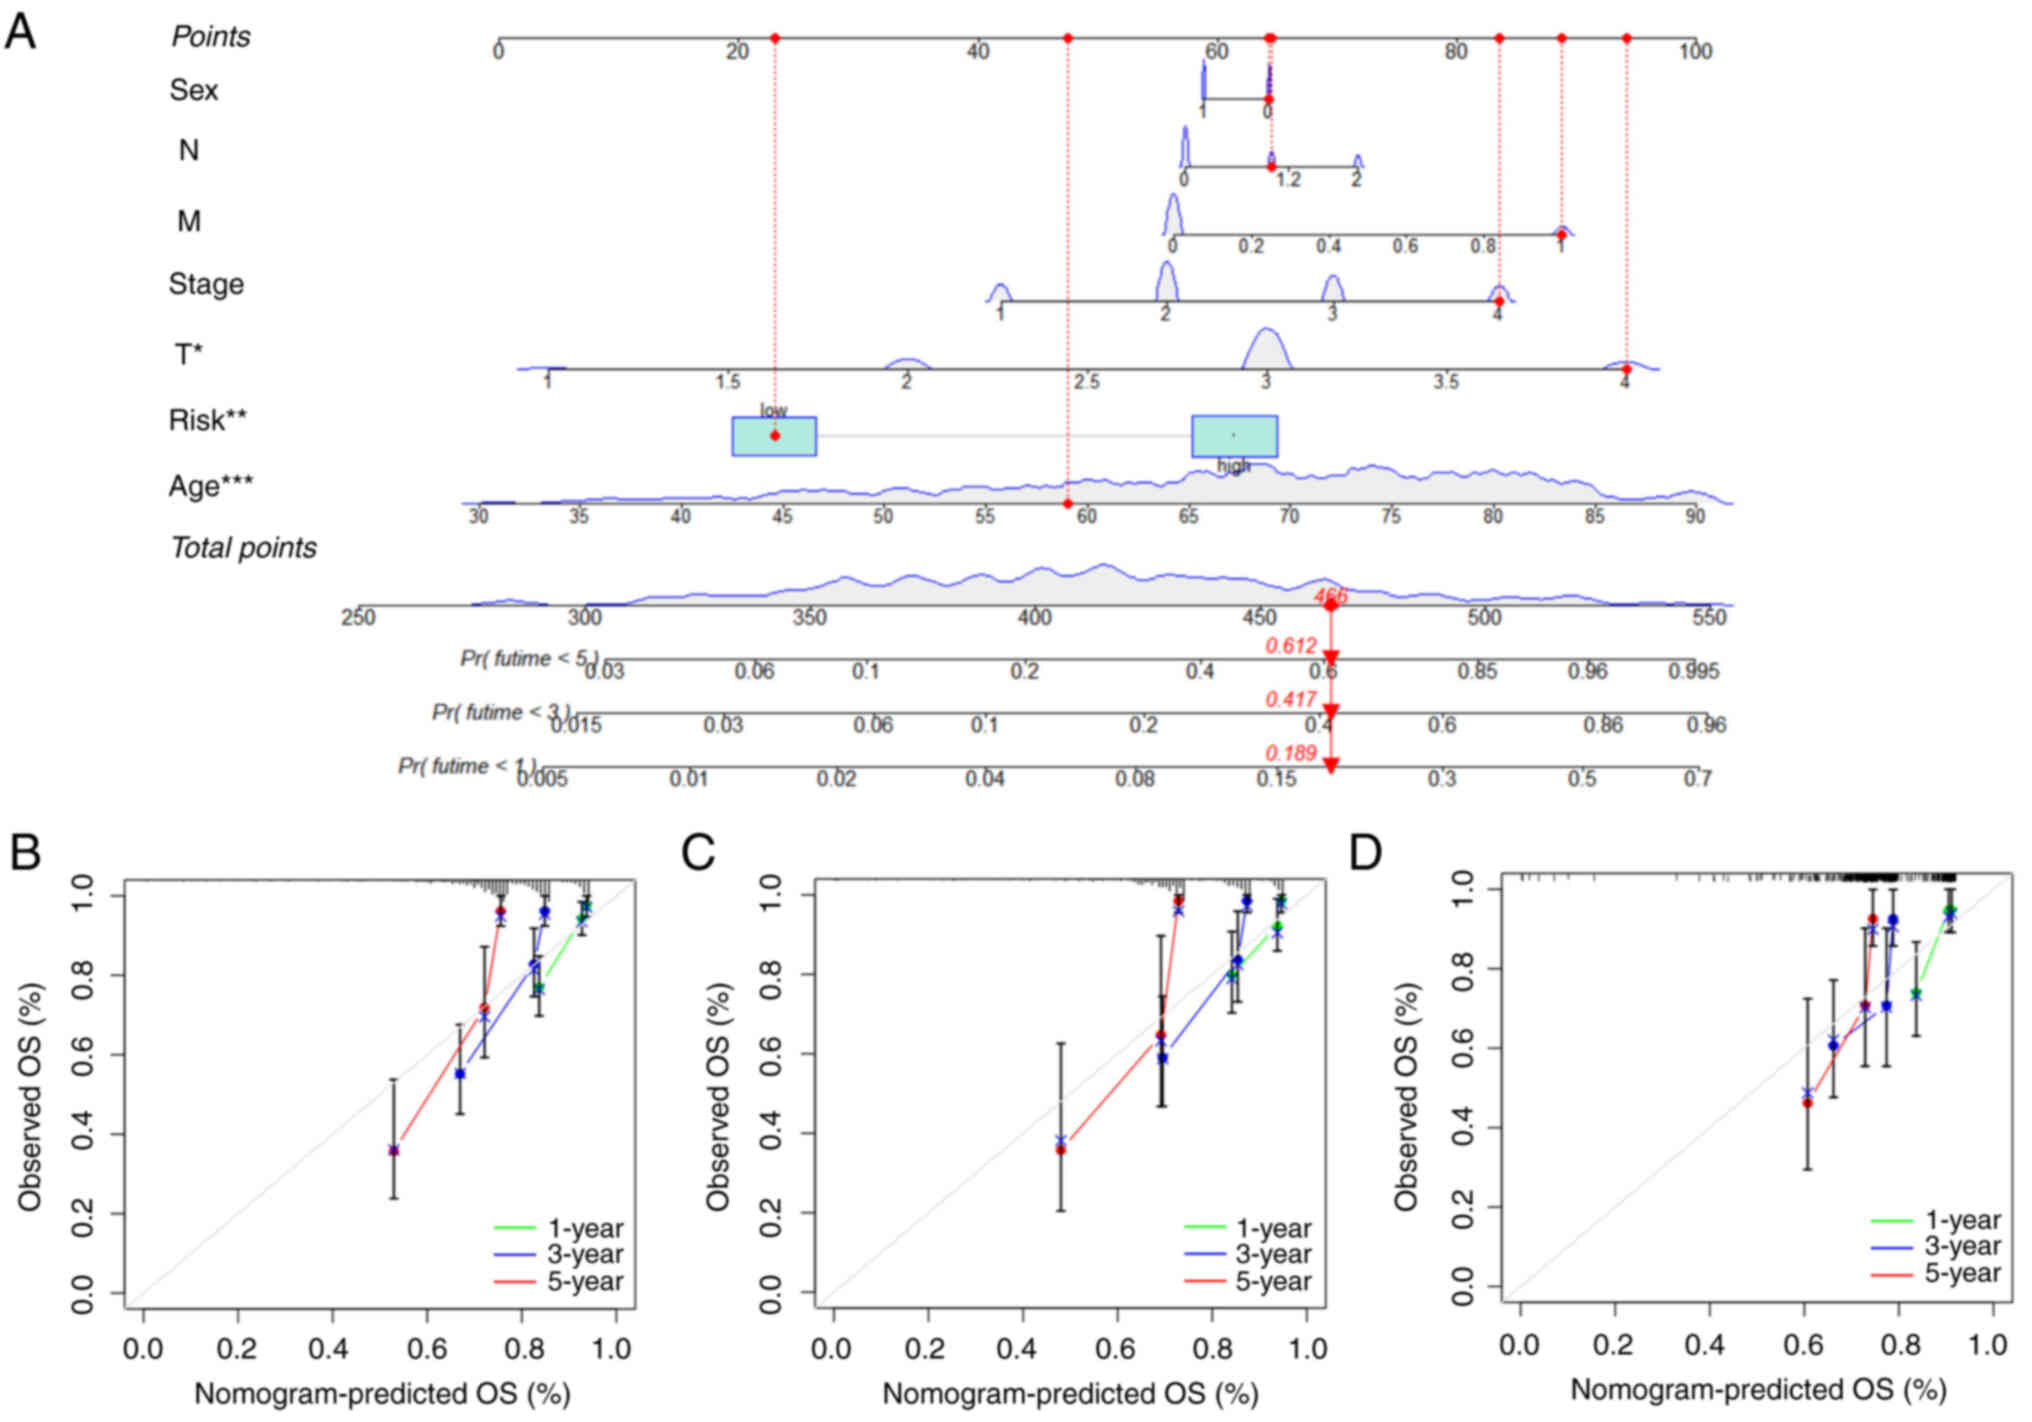 | Figure 8.Construction of a nomogram scoring
pattern. (A) Nomogram scoring pattern for predicting the 1-, 3-,
5-year survival probability of single patients with COAD. (B)
Calibration curves of the nomogram for predicting of 1-, 3-, 5-year
observed OS in entire group. (C) Calibration curves of the nomogram
for predicting of 1-, 3-, 5-year observed OS in training group. (D)
Calibration curves of the nomogram for predicting of 1-, 3-, 5-year
observed OS in testing group. COAD, colon adenocarcinoma; OS,
overall survival. |
Discussion
The present study first evaluated the variation of
cuproptosis-associated genes and found that CNV might affect the
expression levels of cuproptosis-associated genes between normal
tissues and COAD, indicating their potential role in tumorigenesis.
Next, all patients were divided into two subtypes according to the
following three criteria: Firstly, the area under the CDF curve is
not increased obviously. When CDF reaches the approximate maximum
value, the analysis result is reliable. Secondly, the inter-subtype
correlation decreased, while the intra-subtype correlation
increased after clustering. Lastly, enough samples in the subtype
were available. Compared to subtype B, subtype A had improved
survival and subtype B had more advanced-stage clinicopathological
features. KEGG and Hallmark enrichment analyses were applied and
determined that subtype A was mainly enriched in molecular
processes or tumor immune-related signaling pathways. In addition,
three gene subtypes were identified on the base of
prognosis-related DEGs. The subtype with higher expression of
cuproptosis-associated genes showed an overall survival advantage
over those with lower gene expression, indicating that these
upregulated cuproptosis-associated genes may inhibit COAD by
mediating pathways associated with cell death and immune
responses.
Considering the heterogeneity of patients, the risk
score was constructed based on seven key genes. As predicted,
patients with the low-risk score had more prolonged overall
survival compared with those with the high-risk score. However,
patients with high-risk score displayed significant immune
infiltration, immune function, immune checkpoints, TMB, MSI and
drug susceptibility. The tumor cells surrounding TME include tumor
immune infiltrating cells, fibroblasts, lymphocytes and
inflammatory cells derived from bone marrow (32). The number of tumor-infiltrating T
cells in colorectal cancer tissues were higher compared with that
in normal tissues and the higher infiltration indicated an improved
prognosis (33–35).
Activated CD4+ and CD8+ T
cells play an important role in the immune defense of colorectal
cancer (33,36). By contrast, Tregs suppress abnormal
immune responses to self-antigens as well as anticancer immune
responses, which was associated with poor prognosis (37) and some studies have shown that
immunosuppressive and tumor-associated macrophage M2 (38,39) or
Tregs are associated with poor prognosis. As shown in Fig. S2, the high-risk group had higher
fractions of macrophage M2 and Tregs. MSI-H is generally considered
to predict a good prognosis of tumors, but there are exceptions.
The high-risk group in the present study had a poor prognosis due
to low tumor purity and the presence of immunosuppressive cells,
such as M2 Macrophages and Tregs. Moreover, the high-risk group
correlated with impaired antitumor immunity, including the immune
function of T cell co inhibition and type I/II IFN response
(Fig. 7A). Therefore, the weakened
antitumor immunity in patients (40) in the high-risk group may be the
reason for their poor prognosis (29,30).
Research has shown the abundance of B cell enrichment involved in
immune responses, which was identified as the most powerful
prognostic factor for prolonged survival (41,42).
In addition, tumor-infiltrating B cells are associated with an
improved prognosis and a lower risk of recurrence in colorectal
cancer (43,44). In the present study, the enrichment
of plasma B cells in low-risk group was higher and this might be
the reason the low-risk group had improved survival than the
high-risk group.
The different distributions of 7 model genes in
epithelial cells of normal tissue, HCT-116 and HT-29 cells were
analyzed by RT-qPCR. Most genes were expressed in colon tumor
cells, indicating that these genes were involved in the colon tumor
progression. HSPB1 expression was the highest in
HCT-116 and HT-29 cells, and it is mainly released by endothelial
cells and plays a key role in regulating the balance of
angiogenesis (45). It is closely
associated with the depth of primary colorectal tumors (46). PMM2 and
EPHB2 were observed at higher levels in COAD
tissues (47,48). KDM3A is overexpressed in
various types of cancer and this gene appears to be an ideal target
for cancer therapy (49).
Based on the immune system of the patient, tumor
immunotherapy can enhance the immune response against tumor escape
and reduce the off-target effect. The immunotherapy includes immune
checkpoint inhibitors (ICIs), thymosin and biological cells (such
as dendritic cells and chimeric antigen receptor T cells). CTLA 4,
PD-1 and PD-L1 have been widely used in clinical research and
studies have proved their safety and effectiveness (50,51).
ICIs have been used to treat colorectal cancer (52). The present study observed higher
expression levels of checkpoints in the high-risk group indicating
that the high-risk group would have improved drug susceptibility.
Immunotherapy with the anti-PD-1 nivolumab displays favorable
outcomes compared with conventional therapies (53). Elesclomol plays a potential role in
the treatment of colorectal cancer (54). The patients with high-risk scores
might be more sensitive to ICIs responses and Elesclomol,
Indoximod, nivolumab and Pazopanib had a treatment advantage in the
high-risk group. ICIs can effectively treat advanced MSI-H tumors
and MSI-H can be used as a biomarker for treatment (55). The present study hypothesized that
the proportion of patients with MSI-H was higher in the high-risk
group. Consistent with the results, the expression levels of PD-1,
PD-L1 and CTLA4 were significantly upregulated in MSI-H patients
(56).
Finally, a quantitative nomogram predicting pattern
was established by integrating risk score and clinical
characteristics of COAD to further improve the prognosis and health
assessment of the patient and improve the feasibility of the risk
score. To provide suggestions for clinical treatment, this nomogram
prediction pattern can be used to predict the survival probability
of each patient at a specific time.
Supplementary Material
Supporting Data
Supporting Data
Acknowledgements
Not applicable.
Funding
The present study was supported by an academic research project
of Jianghan University (grant nos. 1010/08190006 and
1010/08190001).
Availability of data and materials
All data generated or analyzed during this study are
included in this published article and its supplementary
material.
Authors' contributions
GY and BS conceived and designed the study, and GY
conducted the data analysis and wrote the manuscript. HW carried
out experimental verification. All the authors read and approved
the final manuscript. GY and BS confirm the authenticity of all the
raw data.
Ethics approval and consent to
participate
Not applicable.
Patient consent for publication
Not applicable.
Competing interests
The authors declare that they have no competing
interests.
References
|
1
|
Sung H, Ferlay J, Siegel RL, Laversanne M,
Soerjomataram I, Jemal A and Bray F: Global cancer statistics 2020:
GLOBOCAN estimates of incidence and mortality worldwide for 36
cancers in 185 countries. CA Cancer J Clin. 71:209–249. 2021.
View Article : Google Scholar : PubMed/NCBI
|
|
2
|
Almatroudi A: The incidence rate of
colorectal cancer in Saudi Arabia: An observational descriptive
epidemiological analysis. Int J Gen Med. 13:977–990. 2020.
View Article : Google Scholar : PubMed/NCBI
|
|
3
|
Kanani A, Veen T and Søreide K:
Neoadjuvant immunotherapy in primary and metastatic colorectal
cancer. Br J Surg. 108:1417–1425. 2021. View Article : Google Scholar : PubMed/NCBI
|
|
4
|
Goc J, Lv M, Bessman NJ, Flamar AL, Sahota
S, Suzuki H, Teng F, Putzel GG; JRI Live Cell Bank; Eberl G, ; et
al: Dysregulation of ILC3s unleashes progression and immunotherapy
resistance in colon cancer. Cell. 184:5015–5030.e16. 2021.
View Article : Google Scholar : PubMed/NCBI
|
|
5
|
Jiang Y, Huo Z, Qi X, Zuo T and Wu Z:
Copper-induced tumor cell death mechanisms and antitumor
theragnostic applications of copper complexes. Nanomedicine (Lond).
17:303–324. 2022. View Article : Google Scholar : PubMed/NCBI
|
|
6
|
Lelièvre P, Sancey L, Coll JL, Deniaud A
and Busser B: The multifaceted roles of copper in cancer: A trace
metal element with dysregulated metabolism, but also a target or a
bullet for therapy. Cancers (Basel). 12:35942020. View Article : Google Scholar : PubMed/NCBI
|
|
7
|
da Silva DA, De Luca A, Squitti R,
Rongioletti M, Rossi L, Machado CML and Cerchiaro G: Copper in
tumors and the use of copper-based compounds in cancer treatment. J
Inorg Biochem. 226:1116342022. View Article : Google Scholar : PubMed/NCBI
|
|
8
|
De Luca A, Barile A, Arciello M and Rossi
L: Copper homeostasis as target of both consolidated and innovative
strategies of anti-tumor therapy. J Trace Elem Med Biol.
55:204–213. 2019. View Article : Google Scholar : PubMed/NCBI
|
|
9
|
Tsvetkov P, Coy S, Petrova B, Dreishpoon
M, Verma A, Abdusamad M, Rossen J, Joesch-Cohen L, Humeidi R,
Spangler RD, et al: Copper induces cell death by targeting
lipoylated TCA cycle proteins. Science. 375:1254–1261. 2022.
View Article : Google Scholar : PubMed/NCBI
|
|
10
|
Yang S, He X, Zhao J, Wang D, Guo S, Gao
T, Wang G, Jin C, Yan Z, Wang N, et al: Mitochondrial transcription
factor A plays opposite roles in the initiation and progression of
colitis-associated cancer. Cancer Commun (Lond). 41:695–714. 2021.
View Article : Google Scholar : PubMed/NCBI
|
|
11
|
Baszuk P, Marciniak W, Derkacz R,
Jakubowska A, Cybulski C, Gronwald J, Dębniak T, Huzarski T,
Białkowska K, Pietrzak S, et al: Blood copper levels and the
occurrence of colorectal cancer in Poland. Biomedicines.
9:16282021. View Article : Google Scholar : PubMed/NCBI
|
|
12
|
Lutsenko S: Dynamic and cell-specific
transport networks for intracellular copper ions. J Cell Sci.
134:jcs2405232021. View Article : Google Scholar : PubMed/NCBI
|
|
13
|
Baldari S, Di Rocco G, Heffern MC, Su TA,
Chang CJ and Toietta G: Effects of copper chelation on
BRAFV600E positive colon carcinoma cells. Cancers
(Basel). 11:6592019. View Article : Google Scholar : PubMed/NCBI
|
|
14
|
Cui L, Gouw AM, LaGory EL, Guo S,
Attarwala N, Tang Y, Qi J, Chen YS, Gao Z, Casey KM, et al:
Mitochondrial copper depletion suppresses triple-negative breast
cancer in mice. Nat Biotechnol. 39:357–367. 2021. View Article : Google Scholar : PubMed/NCBI
|
|
15
|
Davis CI, Gu X, Kiefer RM, Ralle M, Gade
TP and Brady DC: Altered copper homeostasis underlies sensitivity
of hepatocellular carcinoma to copper chelation. Metallomics.
12:1995–2008. 2020. View Article : Google Scholar : PubMed/NCBI
|
|
16
|
Zhao S, Ye Z and Stanton R: Misuse of RPKM
or TPM normalization when comparing across samples and sequencing
protocols. RNA. 26:903–909. 2020. View Article : Google Scholar : PubMed/NCBI
|
|
17
|
Conesa A, Madrigal P, Tarazona S,
Gomez-Cabrero D, Cervera A, McPherson A, Szcześniak MW, Gaffney DJ,
Elo LL, Zhang X and Mortazavi A: A survey of best practices for
RNA-seq data analysis. Genome Biol. 17:132016. View Article : Google Scholar : PubMed/NCBI
|
|
18
|
Gautier L, Cope L, Bolstad BM and Irizarry
RA: affy-analysis of Affymetrix GeneChip data at the probe level.
Bioinformatics. 20:307–315. 2004. View Article : Google Scholar : PubMed/NCBI
|
|
19
|
Song W, Ren J, Xiang R, Kong C and Fu T:
Identification of pyroptosis-related subtypes, the development of a
prognosis model, and characterization of tumor microenvironment
infiltration in colorectal cancer. Oncoimmunology. 10:19876362021.
View Article : Google Scholar : PubMed/NCBI
|
|
20
|
Sturm G, Finotello F, Petitprez F, Zhang
JD, Baumbach J, Fridman WH, List M and Aneichyk T: Comprehensive
evaluation of transcriptome-based cell-type quantification methods
for immuno-oncology. Bioinformatics. 35:i436–i445. 2019. View Article : Google Scholar : PubMed/NCBI
|
|
21
|
Sui Z, Wu X, Du L, Wang H, Yuan L, Zhang
JV and Yu Z: Characterization of the immune cell infiltration
landscape in esophageal squamous cell carcinoma. Front Oncol.
12:8793262022. View Article : Google Scholar : PubMed/NCBI
|
|
22
|
Iasonos A, Schrag D, Raj GV and Panageas
KS: How to build and interpret a nomogram for cancer prognosis. J
Clin Oncol. 26:1364–1370. 2008. View Article : Google Scholar : PubMed/NCBI
|
|
23
|
Sebestyén E, Singh B, Miñana B, Pagès A,
Mateo F, Pujana MA, Valcárcel J and Eyras E: Large-scale analysis
of genome and transcriptome alterations in multiple tumors unveils
novel cancer-relevant splicing networks. Genome Res. 26:732–744.
2016. View Article : Google Scholar : PubMed/NCBI
|
|
24
|
Koch A, Joosten SC, Feng Z, de Ruijter TC,
Draht MX, Melotte V, Smits KM, Veeck J, Herman JG, Van Neste L, et
al: Analysis of DNA methylation in cancer: Location revisited. Nat
Rev Clin Oncol. 15:459–466. 2018. View Article : Google Scholar : PubMed/NCBI
|
|
25
|
Lambert SA, Jolma A, Campitelli LF, Das
PK, Yin Y, Albu M, Chen X, Taipale J, Hughes TR and Weirauch MT:
The human transcription factors. Cell. 172:650–665. 2018.
View Article : Google Scholar : PubMed/NCBI
|
|
26
|
Xu J, Dai S, Yuan Y, Xiao Q and Ding K: A
prognostic model for colon cancer patients based on eight signature
autophagy genes. Front Cell Dev Biol. 8:6021742020. View Article : Google Scholar : PubMed/NCBI
|
|
27
|
Kang N, Xie X, Zhou X, Wang Y, Chen S, Qi
R, Liu T and Jiang H: Identification and validation of
EMT-immune-related prognostic biomarkers CDKN2A, CMTM8 and ILK in
colon cancer. BMC Gastroenterol. 22:1902022. View Article : Google Scholar : PubMed/NCBI
|
|
28
|
Lv H, Liu X, Zeng X, Liu Y, Zhang C, Zhang
Q and Xu J: Comprehensive analysis of cuproptosis-related genes in
immune infiltration and prognosis in Melanoma. Front Pharmacol.
13:9300412022. View Article : Google Scholar : PubMed/NCBI
|
|
29
|
Zhang C, Cheng W, Ren X, Wang Z, Liu X, Li
G, Han S, Jiang T and Wu A: Tumor purity as an underlying key
factor in glioma. Clin Cancer Res. 23:6279–6291. 2017. View Article : Google Scholar : PubMed/NCBI
|
|
30
|
Mao Y, Feng Q, Zheng P, Yang L, Liu T, Xu
Y, Zhu D, Chang W, Ji M, Ren L, et al: Low tumor purity is
associated with poor prognosis, heavy mutation burden, and intense
immune phenotype in colon cancer. Cancer Manag Res. 10:3569–3577.
2018. View Article : Google Scholar : PubMed/NCBI
|
|
31
|
Havel JJ, Chowell D and Chan TA: The
evolving landscape of biomarkers for checkpoint inhibitor
immunotherapy. Nat Rev Cancer. 19:133–150. 2019. View Article : Google Scholar : PubMed/NCBI
|
|
32
|
Turley SJ, Cremasco V and Astarita JL:
Immunological hallmarks of stromal cells in the tumour
microenvironment. Nat Rev Immunol. 15:669–682. 2015. View Article : Google Scholar : PubMed/NCBI
|
|
33
|
Ma R, Yuan D, Guo Y, Yan R and Li K:
Immune effects of γδ T cells in colorectal cancer: A review. Front
Immunol. 11:16002020. View Article : Google Scholar : PubMed/NCBI
|
|
34
|
Kuwahara T, Hazama S, Suzuki N, Yoshida S,
Tomochika S, Nakagami Y, Matsui H, Shindo Y, Kanekiyo S, Tokumitsu
Y, et al: Intratumoural-infiltrating CD4 + and FOXP3 + T cells as
strong positive predictive markers for the prognosis of resectable
colorectal cancer. Br J Cancer. 121:659–665. 2019. View Article : Google Scholar : PubMed/NCBI
|
|
35
|
Governa V, Trella E, Mele V, Tornillo L,
Amicarella F, Cremonesi E, Muraro MG, Xu H, Droeser R, Däster SR,
et al: The Interplay Between neutrophils and CD8+ T
cells improves survival in human colorectal cancer. Clin Cancer
Res. 23:3847–3858. 2017. View Article : Google Scholar : PubMed/NCBI
|
|
36
|
Zhang L, Yu X, Zheng L, Zhang Y, Li Y,
Fang Q, Gao R, Kang B, Zhang Q, Huang JY, et al: Lineage tracking
reveals dynamic relationships of T cells in colorectal cancer.
Nature. 564:268–272. 2018. View Article : Google Scholar : PubMed/NCBI
|
|
37
|
Tanaka A and Sakaguchi S: Regulatory T
cells in cancer immunotherapy. Cell Res. 27:109–118. 2017.
View Article : Google Scholar : PubMed/NCBI
|
|
38
|
Pan Y, Yu Y, Wang X and Zhang T:
Tumor-associated macrophages in tumor immunity. Front Immunol.
11:5830842020. View Article : Google Scholar : PubMed/NCBI
|
|
39
|
Sousa S, Brion R, Lintunen M, Kronqvist P,
Sandholm J, Mönkkönen J, Kellokumpu-Lehtinen PL, Lauttia S,
Tynninen O, Joensuu H, et al: Human breast cancer cells educate
macrophages toward the M2 activation status. Breast Cancer Res.
17:1012015. View Article : Google Scholar : PubMed/NCBI
|
|
40
|
Liang JY, Wang DS, Lin HC, Chen XX, Yang
H, Zheng Y and Li YH: A novel ferroptosis-related gene signature
for overall survival prediction in patients with hepatocellular
carcinoma. Int J Biol Sci. 16:2430–2441. 2020. View Article : Google Scholar : PubMed/NCBI
|
|
41
|
Helmink BA, Reddy SM, Gao J, Zhang S,
Basar R, Thakur R, Yizhak K, Sade-Feldman M, Blando J, Han G, et
al: B cells and tertiary lymphoid structures promote immunotherapy
response. Nature. 577:549–555. 2020. View Article : Google Scholar : PubMed/NCBI
|
|
42
|
Petitprez F, de Reyniès A, Keung EZ, Chen
TW, Sun CM, Calderaro J, Jeng YM, Hsiao LP, Lacroix L, Bougoüin A,
et al: B cells are associated with survival and immunotherapy
response in sarcoma. Nature. 577:556–560. 2020. View Article : Google Scholar : PubMed/NCBI
|
|
43
|
Berntsson J, Nodin B, Eberhard J, Micke P
and Jirström K: Prognostic impact of tumour-infiltrating B cells
and plasma cells in colorectal cancer. Int J Cancer. 139:1129–1139.
2016. View Article : Google Scholar : PubMed/NCBI
|
|
44
|
Meshcheryakova A, Tamandl D, Bajna E,
Stift J, Mittlboeck M, Svoboda M, Heiden D, Stremitzer S,
Jensen-Jarolim E, Grünberger T, et al: B cells and ectopic
follicular structures: Novel players in anti-tumor programming with
prognostic power for patients with metastatic colorectal cancer.
PLoS One. 9:e990082014. View Article : Google Scholar : PubMed/NCBI
|
|
45
|
Lee YJ, Lee HJ, Choi SH, Jin YB, An HJ,
Kang JH, Yoon SS and Lee YS: Soluble HSPB1 regulates VEGF-mediated
angiogenesis through their direct interaction. Angiogenesis.
15:229–242. 2012. View Article : Google Scholar : PubMed/NCBI
|
|
46
|
Hung CS, Huang CY, Hsu YW, Makondi PT,
Chang WC, Chang YJ, Wang JY and Wei PL: HSPB1 rs2070804
polymorphism is associated with the depth of primary tumor. J Cell
Biochem. 121:63–69. 2020. View Article : Google Scholar : PubMed/NCBI
|
|
47
|
Cui Z, Sun G, Bhandari R, Lu J, Zhang M,
Bhandari R, Sun F, Liu Z and Zhao S: Comprehensive analysis of
glycolysis-related genes for prognosis, immune features, and
candidate drug development in colon cancer. Front Cell Dev Biol.
9:6843222021. View Article : Google Scholar : PubMed/NCBI
|
|
48
|
Herath NI, Spanevello MD, Doecke JD, Smith
FM, Pouponnot C and Boyd AW: Complex expression patterns of Eph
receptor tyrosine kinases and their ephrin ligands in colorectal
carcinogenesis. Eur J Cancer. 48:753–762. 2012. View Article : Google Scholar : PubMed/NCBI
|
|
49
|
Cho HS, Toyokawa G, Daigo Y, Hayami S,
Masuda K, Ikawa N, Yamane Y, Maejima K, Tsunoda T, Field HI, et al:
The JmjC domain-containing histone demethylase KDM3A is a positive
regulator of the G1/S transition in cancer cells via
transcriptional regulation of the HOXA1 gene. Int J Cancer.
131:E179–E189. 2012. View Article : Google Scholar : PubMed/NCBI
|
|
50
|
Wang Y, Zhang H, Liu C, Wang Z, Wu W,
Zhang N, Zhang L, Hu J, Luo P, Zhang J, et al: Immune checkpoint
modulators in cancer immunotherapy: Recent advances and emerging
concepts. J Hematol Oncol. 15:1112022. View Article : Google Scholar : PubMed/NCBI
|
|
51
|
Bagchi S, Yuan R and Engleman EG: Immune
checkpoint inhibitors for the treatment of cancer: Clinical impact
and mechanisms of response and resistance. Annu Rev Pathol.
16:223–249. 2021. View Article : Google Scholar : PubMed/NCBI
|
|
52
|
Marin-Acevedo JA, Dholaria B, Soyano AE,
Knutson KL, Chumsri S and Lou Y: Next generation of immune
checkpoint therapy in cancer: New developments and challenges. J
Hematol Oncol. 11:392018. View Article : Google Scholar : PubMed/NCBI
|
|
53
|
Roudko V, Cimen Bozkus C, Greenbaum B,
Lucas A, Samstein R and Bhardwaj N: Lynch syndrome and MSI-H
cancers: From mechanisms to ‘off-the-shelf’ cancer vaccines. Front
Immunol. 12:7578042021. View Article : Google Scholar : PubMed/NCBI
|
|
54
|
Llosa NJ, Cruise M, Tam A, Wicks EC,
Hechenbleikner EM, Taube JM, Blosser RL, Fan H, Wang H, Luber BS,
et al: The vigorous immune microenvironment of microsatellite
instable colon cancer is balanced by multiple counter-inhibitory
checkpoints. Cancer Discov. 5:43–51. 2015. View Article : Google Scholar : PubMed/NCBI
|
|
55
|
Ieranò C, Righelli D, D'Alterio C,
Napolitano M, Portella L, Rea G, Auletta F, Santagata S, Trotta AM,
Guardascione G, et al: In PD-1+ human colon cancer cells NIVOLUMAB
promotes survival and could protect tumor cells from conventional
therapies. J Immunother Cancer. 10:e0040322022. View Article : Google Scholar : PubMed/NCBI
|
|
56
|
Gao W, Huang Z, Duan J, Nice EC, Lin J and
Huang C: Elesclomol induces copper-dependent ferroptosis in
colorectal cancer cells via degradation of ATP7A. Mol Oncol.
15:3527–3544. 2021. View Article : Google Scholar : PubMed/NCBI
|