Introduction
Lung cancer is the leading cause of cancer death
worldwide, and has a poor prognosis in spite of recent advances in
therapy (1). Approximately 85% of
lung cancers are non-small cell lung cancer (NSCLC). The outcome of
curative surgery in patients with NSCLC associated with several
clinicopathological prognostic features, such as smoking history,
gene mutations, and pathological stage (2,3).
However, no reliable prognostic factor for NSCLC after curative
resection has been identified yet.
Glucose metabolism plays an important role in the
proliferation in cancer cells (4,5).
Cancer cells rely more on anaerobic glycolysis than mitochondrial
oxidation, even in the presence of ample oxygen; this is known as
the Warburg effect (6). This
suggests that cancer malignancy might be influenced by enzymes
involved in glucose metabolism, especially those involved in
anaerobic glycolysis within the cancer cells (7,8).
Glucose transporters (GLUTs) are responsible for
glucose uptake through the cell membrane to compensate for the
increased glucose metabolism in cancer cells. GLUT1 is
overexpressed in both solid and hematological cancers (9–11). The
relationship between GLUT1 and various cancers, including gastric
cancer, hepatic cancer, prostate cancer, thyroid cancer, head and
neck cancer, and NSCLC, has been reported (12). A meta-analysis reported that GLUT1
overexpression in NSCLC is associated with a poor prognosis
(13). In contrast, other studies
suggest that GLUT1 affects the prognosis in patients with NSCLC and
has a different effect in complete resection (14–17).
Thus, the relationship between GLUT1 and NSCLC following curative
R0 operation remains unclear.
Pyruvate kinase M2 (PKM2) is a glucose metabolic
enzyme that promotes anaerobic glycolysis, and its selective
expression plays an important role in the Warburg effect (18). Guo et al reported a
correlation between PKM2 expression and good prognosis in patients
with lung adenocarcinoma as well as a correlation between higher
expression of PKM2 with shorter overall and disease-free survival
(19). In contrast, Rzechonek et
al reported that PKM2 has a low specificity and its utility in
NSCLC diagnosis or evaluation of cancer progression is limited
(20). Thus, the role of PKM2 as a
prognostic marker in NSCLC remains controversial.
GLUT1 is overexpressed in hypoxic environments and
its overexpression is associated with increased glucose metabolism
through anaerobic glycolysis in cancer cells (21). PKM2 also plays an important role in
anaerobic glycolysis in cancer cells. Thus, these two enzymes
involved in glucose uptake and metabolism may have a significant
effect on tumor malignancy. However, to best of our knowledge,
there is no studies that examined the correlation between the
glucose uptake affected by GLUT1 and glucose metabolism pathway by
PKM2 on the clinicopathological features and prognosis associated
with NSCLC. The purpose of this study is to identify a reliable
glucose metabolic enzyme-based prognostic predictor for NSCLC
following curative R0 surgery.
Materials and methods
Patient selection
This single-center retrospective cohort study was
conducted with clinical course of 665 patients with NSCLC who
underwent surgical procedure at the Osaka City University Hospital,
Osaka, Japan, between January 2010 and December 2016. We excluded
patients from the investigation who underwent R1 or R2 surgery, who
received preoperative chemotherapy and/or radiation therapy, who
did not undergo curative resection procedures such as
segmentectomy, wedge resection or lobectomy without mediastinal
lymph node dissection. A total of 445 patients were enrolled in
this study, and all of whom were diagnosed with histologically
confirmed stage 0 to IIIA primary NSCLC and who underwent radical
resection (other than lobectomy and mediastinal lymph node
dissection). We determined pathological findings according to the
8th edition of the Union for International Cancer Control TNM
classification. The regimen of adjuvant chemotherapy was determined
in consultation with of surgeons, radiologists, and oncologists.
All patients underwent follow-up examinations every 2–6 months,
which involved chest radiography, computed tomography, and
assessment of tumor markers.
This study was conducted in accordance with the
Declaration of Helsinki and approved by the Osaka City University
Ethics Committee (approval number 2019-006). Written informed
consent was obtained from all the patients prior to the operative
procedure. All procedures involving humans were performed in
accordance with the relevant guidelines and regulations.
GLUT1 and PKM2 immunostaining
Immunohistochemical staining was performed on
paraffin-embedded sections of primary lesions obtained from 445
patients with NSCLC. We deparaffinize the slides with a thickness
of 4 µm in xylene and hydrated in decreasing concentrations of
ethyl alcohol and incubate the sections with 3% hydrogen peroxide
to block endogenous peroxidase activity. Then, we heated the
sections in Target Retrieval Solution (DAKO, Carpinteria, CA, USA)
for 10 min at 105°C using an autoclave. Nonspecific binding was
blocked by incubating the sections with 10% normal rabbit serum for
10 min. The specimens were incubated with anti-GLUT1 antibodies
(sc-377228; 1:150; Santa Cruz Biotechnology, Dallas, TX, USA; RRID:
AB_2716767) for 30 min at 24°C and with anti-PKM2 antibodies
(sc-365684; 1:200; Santa Cruz Biotechnology; RRID: AB_2716767) at
4°C overnight. Subsequently, these sections were incubated with a
mouse linker for 10 min, and a peroxidase-labeled polymer solution
(Histofine SAB-PO(M), #424022, Nichirei Biosciences Inc., Tokyo,
Japan) for 5 min, then counterstained with Mayer's hematoxylin
(#131-09665; FUJIFILM Wako Pure Chemical Corporation, Osaka, Japan)
for 30 sec at 24°C.
Immunohistochemical analysis
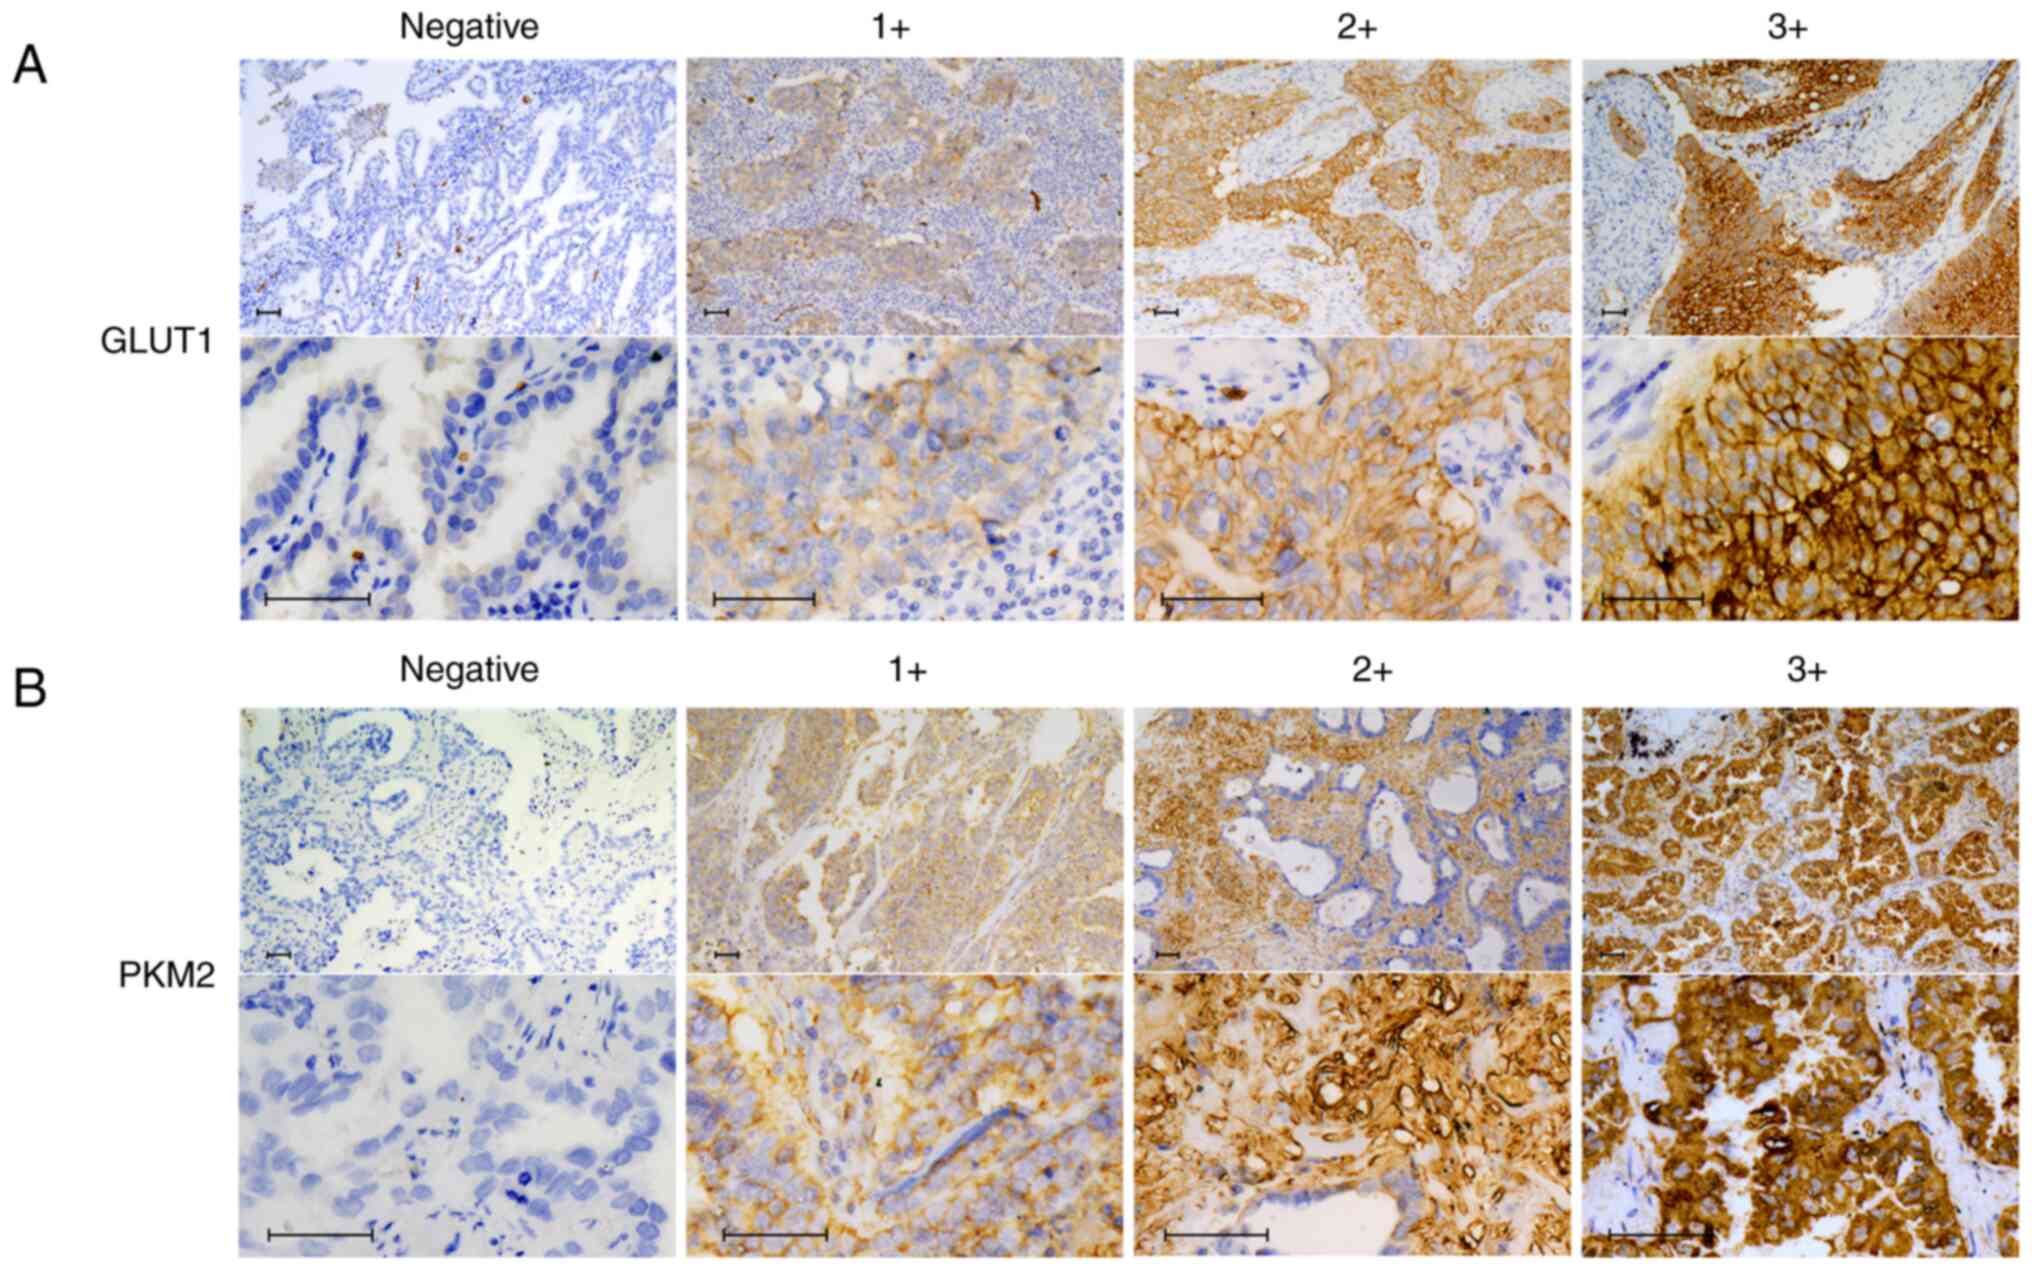
In this study, we evaluate immunostaining intensity
score by visual scoring with a BZ-X710 microscope (Keyence, Osaka,
Japan). Positive immunostaining of GLUT1 and PKM2 were evaluated
based on the intensity of membranous staining in the innermost part
of the tumor and the proportion of immunoreactive cells. The
immunostaining intensity score was defined as follows: 0, negative;
1+, weakly positive; 2+, positive; 3+, strongly positive (Fig. 1). The immunostaining proportion
score was determined by estimating the proportion of positive cells
and defined as follows: 0, no immunoreactive cells; 1+, <30%
immunoreactive cells; 2+, 40–70% immunoreactive cells; 3+, >80%
immunoreactive cells. We calculated the final numerical score by
summing up the two scores and ranged from 0 to 6; both GLUT1 and
PKM2 expressions were considered positive when the total score was
≥4. We evaluated the association between clinicopathological
features and the expression levels of GLUT1 and PKM2.
Bioinformatics analysis
The ProggeneV2 (http://genomics.jefferson.edu/proggene/) database
sourced the relevant data (22).
The GSE 42127 dataset was used to evaluate the prognostic value of
GLUT1 and PKM2 in NSCLC survival (23). Kaplan-Meier plots were used for
overall survival rates, then compared with the Log rank test with
GSE 42127 dataset.
Statistical analysis
The χ2 test was used to determine
significant differences between covariates. Survival duration was
constructed using the Kaplan-Meier method and analyzed using the
log-rank test. The Cox proportional hazards model was used for
multivariate analysis. Multivariate analysis was performed between
variables with significant difference in univariate analysis.
P<0.05 was considered statistically significant. All statistical
analyses were performed using EZR (Saitama Medical Center, Jichi
Medical University, Saitama, Japan), a graphical user interface of
R (version 2.13.0) and a modified version of the R commander
(version 1.6-3) (The R Foundation for Statistical Computing,
Vienna, Austria) (24).
Results
Relationship between GLUT1 and PKM2
expression and clinicopathological features
The clinicopathological features of all 445 patients
based on GLUT1 and PKM2 expression are summarized in Table I. The median age was 69 years
(range, 34–91 years). In total, 106 (24%) and 190 (43%) specimens
were GLUT1-positive and PKM2-positive, respectively. Thus, there
were 65 (15%) GLUT1- and PKM2-positive (G+/P+ group) patients.
GLUT1-positivity significantly associated with sex (P<0.001) and
the presence of squamous cell carcinoma (P<0.001), lymphatic
invasion (P<0.001), venous invasion (P=0.005), pleural invasion
(P<0.001), and depth of invasion (P<0.001), as opposed to
GLUT1 negativity. PKM2 positivity was not significantly associated
with any of the clinicopathological features of patients with
NSCLC. There was a significant positive association between GLUT1
and PKM2 expression (P<0.001). GLUT1- and PKM2-positivity
significantly associated with sex (P=0.016) and the absence of
adenocarcinoma (P<0.001), lymphatic invasion (P=0.004), and
pleural invasion (P=0.014). In patients with stage 0-I NSCLC, 59
patients had squamous cell carcinoma. Table II shows the relationship between
expression of GLUT1 and clinicopathologic features in patients with
squamous cell carcinoma and non-squamous cell carcinoma. There was
no significant difference in any of clinicopathological features in
patients with squamous cell carcinoma. Compared to all of 445
patients with NSCLC, patients with non-squamous cell carcinoma
showed similar result except lymph node metastasis.
GLUT1-positivity significantly associated with lymph node
metastasis (P=0.017) as opposed to GLUT1-negativity. We compared
the maximum standardized uptake value (SUVmax) of
[18F]fluorodeoxyglucose positron emission
tomography/computed tomography (18F-FDG-PET) of primary
tumor between patients with G+/P+ expression and other expressions,
but there was no significant difference (data not shown).
 | Table I.Relationship between expression of
GLUT1 and/or PKM2 and clinicopathologic features in 445 patients
with NSCLC. |
Table I.
Relationship between expression of
GLUT1 and/or PKM2 and clinicopathologic features in 445 patients
with NSCLC.
|
| GLUT1
expression | PKM2
expression | GLUT1 and PKM2
expression |
|---|
|
|
|
|
|
|---|
| Variables (N) | Positive
(n=106) | Negative
(n=339) | P-value | Positive
(n=190) | Negative
(n=255) | P-value | G+/P+ (n=65) | Others (n=380) | P-value |
|---|
| Age, years |
|
|
|
|
|
|
|
|
|
| <65
(136) | 32 (30.2%) | 104 (30.7%) | 1 | 59 (31.1%) | 77 (30.2%) | 0.917 | 18 (27.7%) | 118 (31.1%) | 0.663 |
| ≥65
(309) | 74 (69.8%) | 235 (69.3%) |
| 131 (68.9%) | 178 (69.8%) |
| 47 (72.3%) | 262 (68.9%) |
|
| Sex |
|
|
|
|
|
|
|
|
|
| Female
(155) | 19 (17.9%) | 136 (40.1%) | <0.001 | 60 (31.6%) | 95 (37.3%) | 0.228 | 14 (21.5%) | 141 (37.1%) | 0.016 |
| Male
(290) | 87 (82.1%) | 203 (59.9%) |
| 130 (68.4%) | 160 (62.7%) |
| 51 (78.5%) | 239 (62.9%) |
|
| Smoking |
|
|
|
|
|
|
|
|
|
| Yes
(313) | 68 (64.2%) | 245 (72.3%) | 0.115 | 135 (71.1%) | 178 (69.8%) | 0.834 | 45 (69.2%) | 268 (70.5%) | 0.883 |
| No
(132) | 38 (35.8%) | 94 (27.7%) |
| 55 (28.9%) | 77 (30.2%) |
| 20 (30.8%) | 112 (29.5%) |
|
| Histology |
|
|
|
|
|
|
|
|
|
|
Adenocarcinoma (299) | 39 (36.8%) | 260 (76.7%) | <0.001 | 126 (66.3%) | 173 (67.8%) | 0.894 | 29 (44.6%) | 270 (71.1%) | <0.001 |
|
Squamous cell carcinoma
(120) | 58 (54.7%) | 62 (18.3%) |
| 52 (27.4%) | 68 (26.7%) |
| 30 (46.2%) | 90 (23.7%) |
|
|
Othersa (26) | 9 (8.5%) | 17 (5.0%) |
| 12 (6.3%) | 14 (5.5%) |
| 6 (9.2%) | 20 (5.3%) |
|
| Lymphatic
invasion |
|
|
|
|
|
|
|
|
|
|
Negative (305) | 56 (52.8%) | 249 (73.5%) | <0.001 | 123 (64.7%) | 182 (71.4%) | 0.149 | 34 (52.3%) | 271 (71.3%) | 0.004 |
|
Positive (140) | 50 (47.2%) | 90 (26.5%) |
| 67 (35.3%) | 73 (28.6%) |
| 31 (47.7%) | 109 (28.7%) |
|
| Venous
invasion |
|
|
|
|
|
|
|
|
|
|
Negative (366) | 77 (72.6%) | 289 (85.3%) | 0.005 | 157 (82.6%) | 209 (82.0%) | 0.901 | 48 (73.8%) | 318 (83.7%) | 0.077 |
|
Positive (79) | 29 (27.4%) | 50 (14.7%) |
| 33 (17.4%) | 46 (18.0%) |
| 17 (26.2%) | 62 (16.3%) |
|
| Pleural
invasion |
|
|
|
|
|
|
|
|
|
|
Negative (331) | 63 (59.4%) | 268 (79.1%) | <0.001 | 145 (76.3%) | 186 (72.9%) | 0.444 | 40 (61.5%) | 291 (76.6%) | 0.014 |
|
Positive (114) | 43 (40.6%) | 71 (20.9%) |
| 45 (23.7%) | 69 (27.1%) |
| 25 (38.5%) | 89 (23.4%) |
|
| Depth of
invasion |
|
|
|
|
|
|
|
|
|
| T1 or
T2 (384) | 80 (75.5%) | 304 (89.7%) | <0.001 | 162 (85.3%) | 222 (87.1%) | 0.581 | 51 (78.5%) | 333 (87.6%) | 0.053 |
| T3 or
T4 (61) | 26 (24.5%) | 35 (10.3%) |
| 28 (14.7%) | 33 (12.9%) |
| 14 (21.5%) | 47 (12.4%) |
|
| Lymph node
metastasis |
|
|
|
|
|
|
|
|
|
| N0
(346) | 76 (71.7%) | 270 (79.6%) | 0.108 | 144 (75.8%) | 202 (79.2%) | 0.421 | 45 (69.2%) | 301 (79.2%) | 0.078 |
| N1 or
N2 (99) | 30 (28.3%) | 69 (20.4%) |
| 46 (24.2%) | 53 (20.8%) |
| 20 (30.8%) | 79 (20.8%) |
|
| pStage |
|
|
|
|
|
|
|
|
|
|
0-IIb (365) | 83 (78.3%) | 282 (83.2%) | 0.25 | 154 (81.1%) | 211 (82.7%) | 0.708 | 50 (76.9%) | 315 (82.9%) | 0.293 |
| III
(80) | 23 (21.7%) | 57 (16.8%) |
| 36 (18.9%) | 44 (17.3%) |
| 15 (23.1%) | 65 (17.1%) |
|
| PKM2
expression |
|
|
|
|
|
|
|
|
|
|
Negative (255) | 41 (38.7%) | 214 (63.1%) | <0.001 |
|
|
|
|
|
|
|
Positive (190) | 65 (61.3%) | 125 (36.9%) |
|
|
|
|
|
|
|
| Table II.Relationship between expression of
GLUT1 and clinicopathologic features in 445 patients with squamous
cell carcinoma and non-squamous cell carcinoma. |
Table II.
Relationship between expression of
GLUT1 and clinicopathologic features in 445 patients with squamous
cell carcinoma and non-squamous cell carcinoma.
|
| GLUT1 expression in
squamous cell carcinoma | GLUT1 expression in
non-squamous cell carcinoma |
|---|
|
|
|
|
|---|
| Variables (N) | Positive
(n=58) | Negative
(n=62) | P-value | Positive
(n=48) | Negative
(n=277) | P-value |
|---|
| Age, years |
|
|
|
|
|
|
| <65
(136) | 15 (25.9%) | 9 (14.5%) | 0.170 | 17 (35.4%) | 95 (34.3%) | 0.871 |
| ≥65
(309) | 43 (74.1%) | 53 (85.5%) |
| 31 (64.6%) | 182 (65.7%) |
|
| Sex |
|
|
|
|
|
|
| Female
(155) | 10 (17.2%) | 7 (11.3%) | 0.435 | 9 (18.8%) | 129 (46.6%) | <0.001 |
| Male
(290) | 48 (82.8%) | 55 (88.7%) |
| 39 (81.2%) | 148 (53.4%) |
|
| Smoking |
|
|
|
|
|
|
| Yes
(313) | 36 (62.1%) | 42 (67.7%) | 0.568 | 32 (66.7%) | 203 (73.3%) | 0.383 |
| No
(132) | 22 (37.9%) | 20 (32.3%) |
| 16 (33.3%) | 74 (26.7%) |
|
| Lymphatic
invasion |
|
|
|
|
|
|
|
Negative (305) | 35 (60.3%) | 43 (69.4%) | 0.341 | 21 (43.8%) | 206 (74.4%) | <0.001 |
|
Positive (140) | 23 (39.7%) | 19 (30.6%) |
| 27 (56.2%) | 71 (25.6%) |
|
| Venous
invasion |
|
|
|
|
|
|
|
Negative (366) | 44 (75.9%) | 52 (83.9%) | 0.362 | 33 (68.8%) | 237 (85.6%) | 0.007 |
|
Positive (79) | 14 (24.1%) | 10 (16.1%) |
| 15 (31.2%) | 40 (14.4%) |
|
| Pleural
invasion |
|
|
|
|
|
|
|
Negative (331) | 38 (65.5%) | 47 (75.8%) | 0.234 | 25 (52.1%) | 221 (79.8%) | <0.001 |
|
Positive (114) | 20 (34.5%) | 15 (24.2%) |
| 23 (47.9%) | 56 (20.2%) |
|
| Depth of
invasion |
|
|
|
|
|
|
| T1 or
T2 (384) | 41 (70.7%) | 50 (80.6%) | 0.286 | 39 (81.2%) | 254 (91.7%) | 0.035 |
| T3 or
T4 (61) | 17 (29.3%) | 12 (19.4%) |
| 9 (18.8%) | 23 (8.3%) |
|
| Lymph node
metastasis |
|
|
|
|
|
|
| N0
(346) | 44 (75.9%) | 41 (66.1%) | 0.315 | 32 (66.7%) | 229 (82.7%) | 0.017 |
| N1 or
N2 (99) | 14 (24.1%) | 21 (33.9%) |
| 16 (33.3%) | 48 (17.3%) |
|
| pStage |
|
|
|
|
|
|
|
0-IIa (365) | 48 (82.8%) | 50 (80.6%) | 0.817 | 35 (72.9%) | 232 (83.8%) | 0.100 |
| III
(80) | 10 (17.2%) | 12 (19.4%) |
| 13 (27.1%) | 45 (16.2%) |
|
| PKM2
expression |
|
|
|
|
|
|
|
Negative (255) | 28 (48.3%) | 40 (64.5%) | 0.097 | 13 (27.1%) | 174 (62.8%) | <0.001 |
|
Positive (190) | 30 (51.7%) | 22 (35.5%) |
| 35 (72.9%) | 103 (37.2%) |
|
Association between GLUT1 expression
and survival of patients with NSCLC
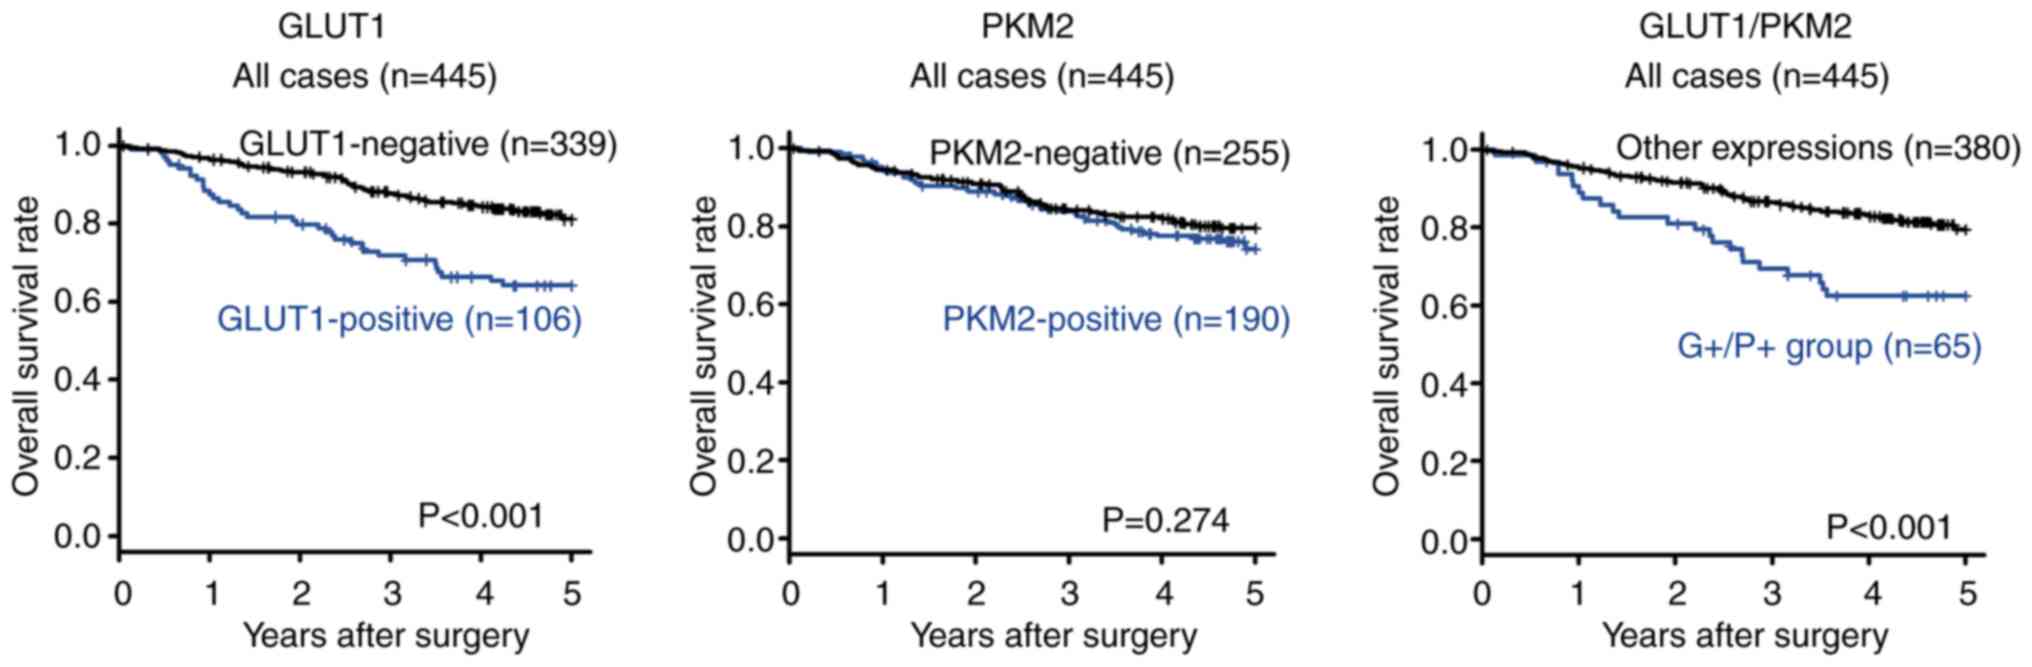
Comparison of the 5-year overall survival rate
between GLUT1-positive and GLUT1-negative patients with NSCLC is
presented in Fig. 2. GLUT1-positive
patients with NSCLC had significantly poorer overall survival rates
(P<0.001) than GLUT1-negative patients. The similar result was
found from the dataset GSE42127 in PROGgeneV2 database (Fig. S1A).
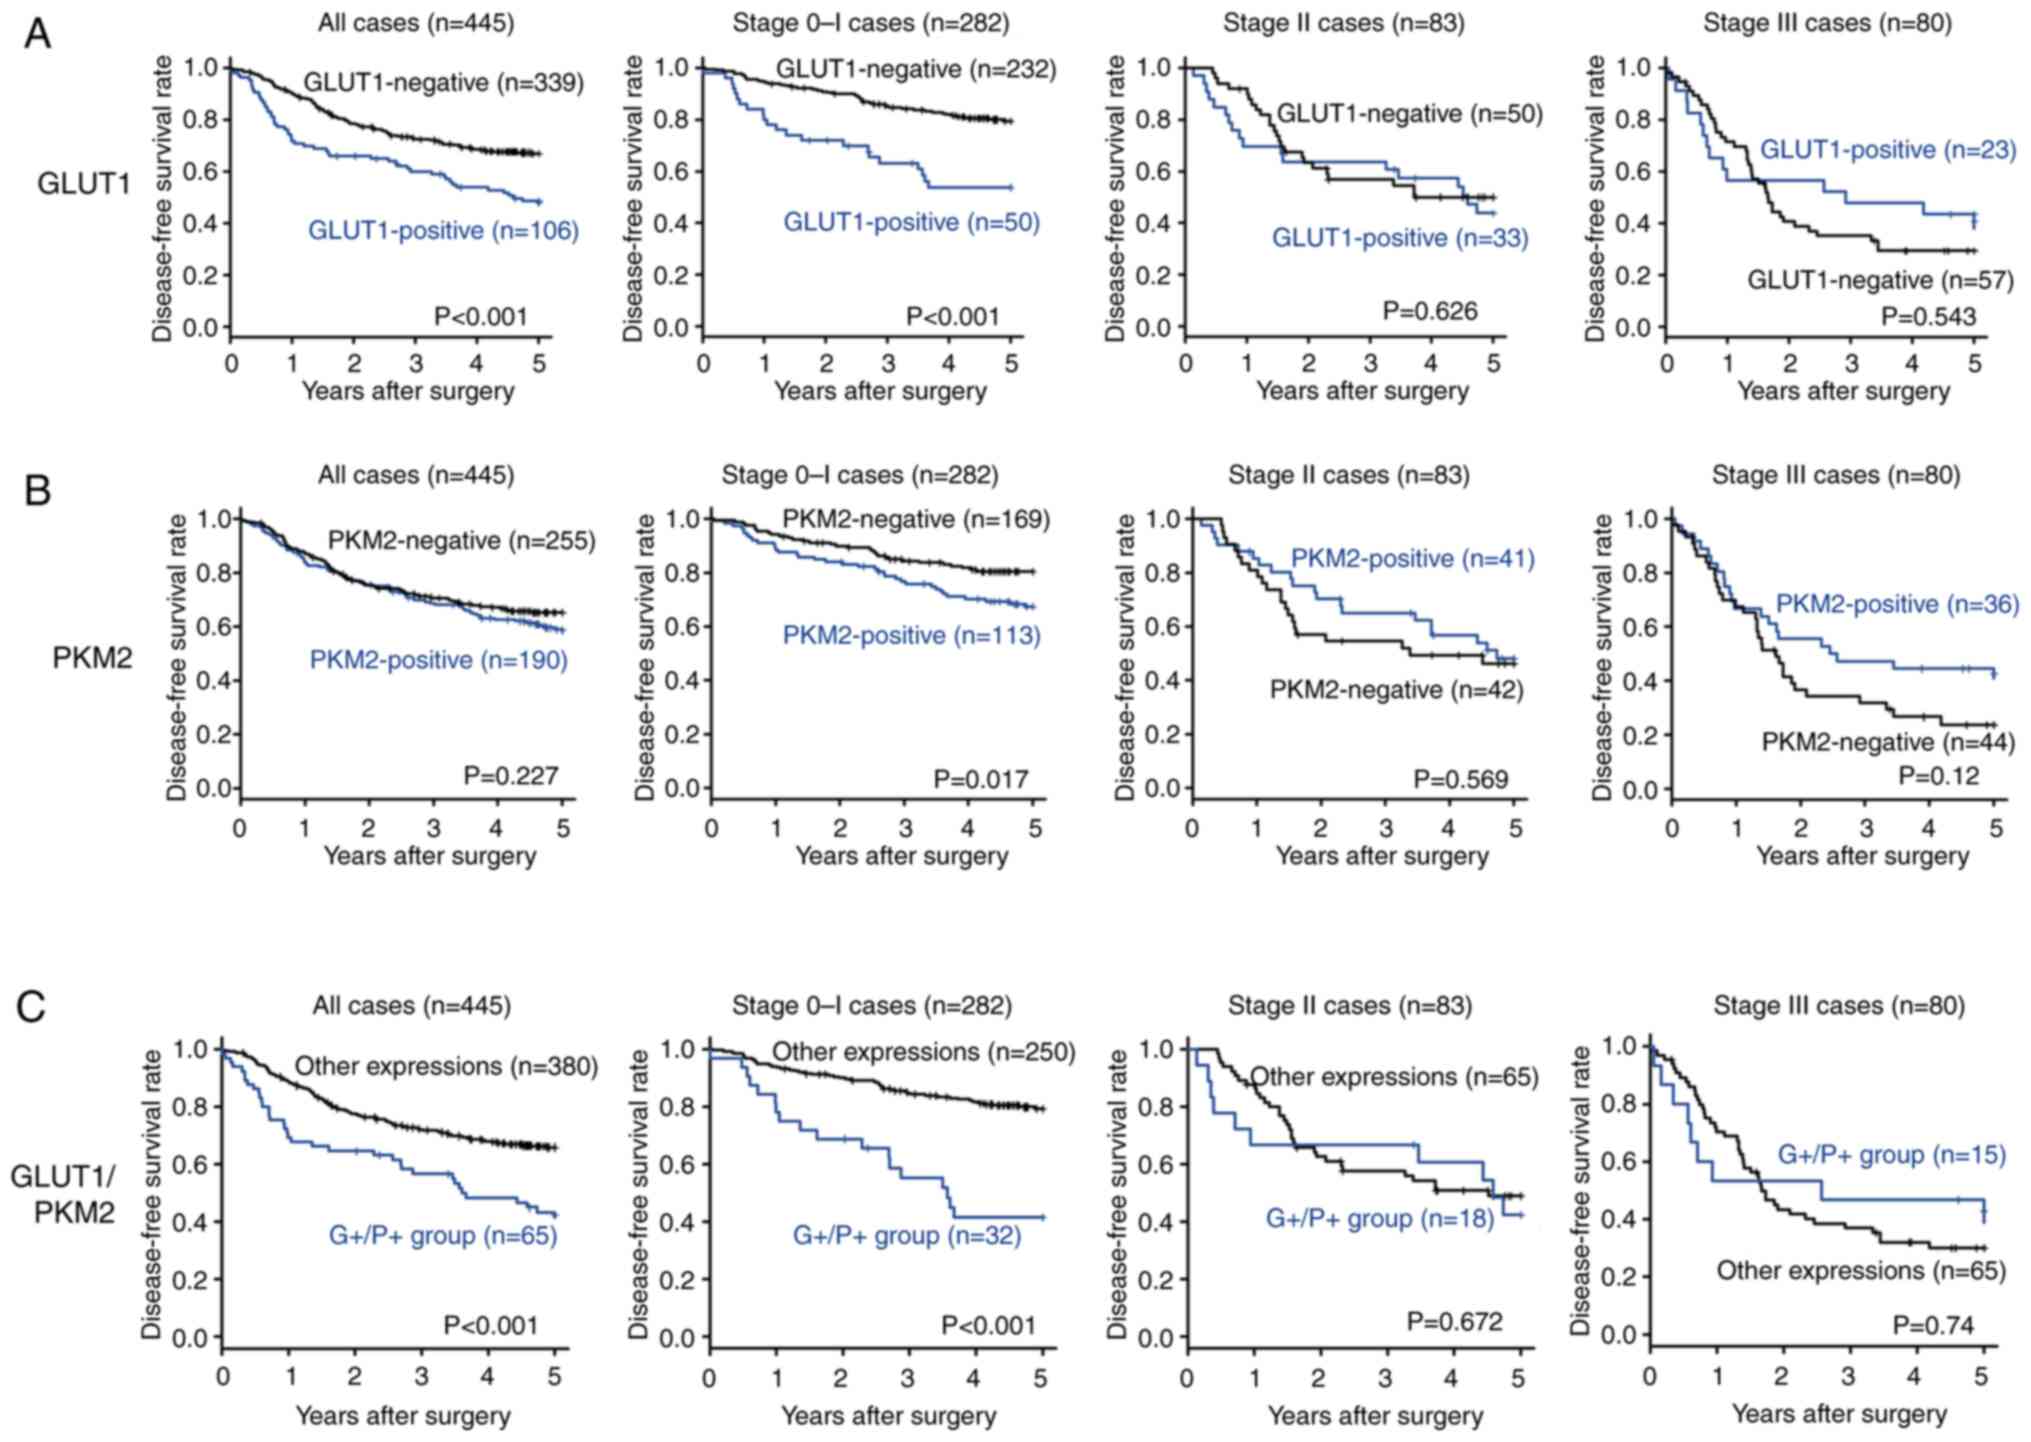
Comparison of the 5-year disease free survival rate
between GLUT1-positive and -negative patients with NSCLC is
presented in Fig. 3A.
GLUT1-positive patients with NSCLC presented significantly poorer
disease-free survival rates (P<0.001) than those who were
GLUT1-negative. Regarding tumor pathological stage, the 5-year
disease-free survival rate of GLUT1-positive patients with stage I
NSCLC was significantly poorer than that of GLUT-1 negative
patients (P<0.001). In contrast, no significant difference in
the 5-year disease-free survival rate was found between patients
with stage II and III NSCLC with positive and negative GLUT1
expressions.
There was no significant difference in overall
survival and disease-free survival rates according to the adjuvant
chemotherapy in patients with GLUT1 positive stage II–III NSCLC
(Fig. S2A and D).
Association between PKM2 expression
and survival of patients with NSCLC
Comparison of the 5-year overall survival rate
between PKM2-positive and PKM2-negative patients with NSCLC is
presented in Fig. 2. There was no
significant difference in the survival rate (P=0.274) between
PKM2-positive and PKM2-negative patients with NSCLC. The similar
result was found from the dataset GSE42127 in PROGgeneV2 database
(Fig. S1B).
Comparison of the 5-year disease free survival rate
between PKM2-positive and -negative patients with NSCLC is
presented in Fig. 3B. There was no
significant difference in the disease-free survival rate (P=0.227)
between PKM2-positive and -negative patients with NSCLC. In terms
of tumor pathological stage, the 5-year disease-free survival rate
of PKM2-positive patients with stage I NSCLC was significantly
poorer than that of PKM2-negative patients (P=0.017). In contrast,
no significant difference in the survival rate was found between
patients with stage II and III NSCLC with positive and negative
PKM2 expression.
There was no significant difference in overall
survival and disease-free survival rates according to the adjuvant
chemotherapy in patients with PKM2 positive stage II–III NSCLC
(Fig. S2B and E).
Association between GLUT1 and/or PKM2
expression and survival of patients with NSCLC
The 5-year overall survival rate based on GLUT1
and/or PKM2 expression in all the 445 patients is presented in
Fig. 2. Patients in the
GLUT1-positive and PKM2-positive (G+/P+) group presented
significantly poorer overall survival rates (P<0.001) than those
in the GLUT1-negative and PKM2-negative (‘other expressions’)
groups.
The 5-year disease-free survival rate based on GLUT1
and/or PKM2 expression in all the 445 patients is presented in
Fig. 3C. Patients in the G+/P+
group presented significantly poorer disease-free survival rates
(P<0.001) than those in the ‘other expressions’ group. Regarding
tumor pathological stage, the 5-year disease-free survival rate of
patients with stage I NSCLC in the G+/P+ group was significantly
poorer than that of patients in the ‘other expressions’ group
(P<0.001). In contrast, no significant difference in survival
was found between patients with stage II and III NSCLC in the G+/P+
group and those in the ‘other expressions’ group (Fig. S3).
There was no significant difference in overall
survival and disease-free survival rates according to the adjuvant
chemotherapy in patients with G+/P+ stage II–III NSCLC (Fig. S2C and F).
Univariate and multivariate
analyses
Table III shows
the results of the univariate and multivariate analyses for overall
survival. Univariate analysis revealed that poor overall survival
was significantly associated with GLUT1 positivity (P<0.001),
GLUT1 and PKM2 positivity (P=0.001), male (P<0.001), smoking
history (P=0.049), histological type of adenocarcinoma (P=0.001),
lymphatic invasion (P=0.006), pleural invasion (P=0.002),
pathological T3/4 (P=0.02), and lymph node metastasis (P=0.014) are
significantly associated with poor overall survival. Multivariate
analysis including the significant factors mentioned above showed
that the male (P<0.001) was significantly associated with poor
overall survival.
| Table III.Univariate and multivariate analysis
of 5-year overall survival of 445 patients with NSCLC. |
Table III.
Univariate and multivariate analysis
of 5-year overall survival of 445 patients with NSCLC.
|
| Univariate
analysis | Multivariate
analysis (GLUT1 and PKM2 separately) | Multivariate
analysis (combination of GLUT1 and PKM2) |
|---|
|
|
|
|
|
|---|
| Variables | HR | 95% CI | P-value | HR | 95% CI | P-value | HR | 95% CI | P-value |
|---|
| GLUT1 |
|
|
|
|
|
|
|
|
|
|
Positive vs. Negative | 2.27 | 1.49–3.45 | <0.001 | 1.45 | 0.92–2.33 | 0.114 |
|
|
|
| PKM2 |
|
|
|
|
|
|
|
|
|
|
Positive vs. Negative | 1.25 | 0.83–1.89 | 0.275 | 1.10 | 0.73–1.67 | 0.643 |
|
|
|
| GLUT1/PKM2 |
|
|
|
|
|
|
|
|
|
| G+/P+
vs. Other expressions | 2.17 | 1.36–3.47 | 0.001 |
|
|
| 1.58 | 0.97–2.58 | 0.067 |
| Sex |
|
|
|
|
|
|
|
|
|
| Male
vs. Female | 4.99 | 2.66–9.37 | <0.001 | 3.95 | 2.06–7.56 | <0.001 | 4.03 | 2.11–7.71 | <0.001 |
| Age, years |
|
|
|
|
|
|
|
|
|
| ≥65 vs.
<65 | 1.37 | 0.87–2.17 | 0.175 |
|
|
|
|
|
|
| Smoking |
|
|
|
|
|
|
|
|
|
| Yes vs.
No | 0.66 | 0.44–2.29 | 0.049 | 0.73 | 0.48–2.22 | 0.146 | 0.71 | 0.34–1.09 | 0.111 |
| Histology |
|
|
|
|
|
|
|
|
|
|
Adenocarcinoma vs. Others | 0.52 | 0.69–0.77 | 0.001 | 0.87 | 0.56–1.35 | 0.531 | 0.83 | 0.54–1.28 | 0.397 |
| Lymphatic
invasion |
|
|
|
|
|
|
|
|
|
|
Positive vs. Negative | 1.78 | 1.18–2.67 | 0.006 | 1.10 | 0.68–1.76 | 0.702 | 1.13 | 0.71–1.80 | 0.608 |
| Venous
invasion |
|
|
|
|
|
|
|
|
|
|
Positive vs. Negative | 1.38 | 0.84–2.29 | 0.206 |
|
|
|
|
|
|
| Pleural
invasion |
|
|
|
|
|
|
|
|
|
|
Positive vs. Negative | 1.94 | 1.27–2.94 | 0.002 | 1.45 | 0.90–2.32 | 0.123 | 1.43 | 0.90–2.29 | 0.131 |
| Pathological T |
|
|
|
|
|
|
|
|
|
| 3 or 4
vs. 1 or 2 | 1.82 | 1.10–3.01 | 0.02 | 1.08 | 0.63–1.85 | 0.771 | 1.10 | 0.65–1.88 | 0.721 |
| Pathological N |
|
|
|
|
|
|
|
|
|
| 1 or 2
vs. 0 | 1.74 | 1.12–2.70 | 0.014 | 1.30 | 0.81–2.09 | 0.273 | 1.27 | 0.79–2.03 | 0.325 |
Table IV shows the
results of the univariate and multivariate analyses for
disease-free survival. Univariate analysis revealed that GLUT1
positivity (P<0.001), GLUT1 and PKM2 positivity (P<0.001),
male (P<0.001), histological type of adenocarcinoma (P=0.03),
lymphatic invasion (P<0.001), venous invasion (P<0.001),
pleural invasion (P<0.001), pathological T3/4 (P<0.001), and
lymph node metastasis (P<0.001) are significantly associated
with poor disease-free survival. Multivariate analysis including
the significant factors mentioned above showed that GLUT1 and PKM2
positivity (P=0.039), male (P=0.003), pleural invasion (P=0.004),
and lymph node metastasis (P<0.001) were significantly
associated with poor disease-free survival.
| Table IV.Univariate and multivariate analysis
of 5-year disease-free survival of 445 patients with NSCLC. |
Table IV.
Univariate and multivariate analysis
of 5-year disease-free survival of 445 patients with NSCLC.
|
| Univariate
analysis | Multivariate
analysis (GLUT1 and PKM2 separately) | Multivariate
analysis (Combination of GLUT1 and PKM2) |
|---|
|
|
|
|
|
|---|
| Variables | HR | 95% CI | P-value | HR | 95% CI | P-value | HR | 95% CI | P-value |
|---|
| GLUT1 |
|
|
|
|
|
|
|
|
|
|
Positive vs. Negative | 1.85 | 1.35–2.56 | <0.001 | 1.33 | 0.92–1.92 | 0.129 |
|
|
|
| PKM2 |
|
|
|
|
|
|
|
|
|
|
Positive vs. Negative | 1.20 | 0.88–1.64 | 0.228 | 1.03 | 0.75–1.41 | 0.854 |
|
|
|
| GLUT1/PKM2 |
|
|
|
|
|
|
|
|
|
| G+/P+
vs. Other expressions | 2.07 | 1.43–2.98 | <0.001 |
|
|
| 1.49 | 1.02–2.19 | 0.039 |
| Sex |
|
|
|
|
|
|
|
|
|
| Male
vs. female | 2.42 | 1.66–3.54 | <0.001 | 1.80 | 1.21–2.69 | 0.004 | 1.81 | 1.22–2.70 | 0.003 |
| Age, years |
|
|
|
|
|
|
|
|
|
| ≥65 vs.
<65 | 1.29 | 0.92–1.83 | 0.144 |
|
|
|
|
|
|
| Smoking |
|
|
|
|
|
|
|
|
|
| Yes vs.
No | 0.78 | 0.56–1.08 | 0.122 |
|
|
|
|
|
|
| Histology |
|
|
|
|
|
|
|
|
|
|
Adenocarcinoma vs. Others | 0.70 | 0.51–0.96 | 0.03 | 1.20 | 0.85–1.72 | 0.299 | 1.20 | 0.83–1.67 | 0.345 |
| Lymphatic
invasion |
|
|
|
|
|
|
|
|
|
|
Positive vs. Negative | 2.36 | 1.74–3.22 | <0.001 | 1.18 | 0.82–1.70 | 0.367 | 1.19 | 0.83–1.71 | 0.34 |
| Venous
invasion |
|
|
|
|
|
|
|
|
|
|
Positive vs. Negative | 2.28 | 1.61–3.22 | <0.001 | 1.24 | 0.85–1.81 | 0.268 | 1.26 | 0.86–1.83 | 0.239 |
| Pleural
invasion |
|
|
|
|
|
|
|
|
|
|
Positive vs. Negative | 2.53 | 1.84–3.46 | <0.001 | 1.72 | 1.19–2.47 | 0.004 | 1.71 | 1.19–2.45 | 0.004 |
| Pathological T |
|
|
|
|
|
|
|
|
|
| 3 or 4
vs. 1 or 2 | 2.31 | 1.60–3.34 | <0.001 | 1.38 | 0.91–2.09 | 0.133 | 1.39 | 0.92–2.11 | 0.118 |
| Pathological N |
|
|
|
|
|
|
|
|
|
| 1 or 2
vs. 0 | 3.10 | 2.26–4.27 | <0.001 | 2.33 | 1.65–3.29 | <0.001 | 2.30 | 1.63–3.24 | <0.001 |
Discussion
In this study, we revealed that GLUT1 positivity was
significantly associated with sex, the histological type of
squamous cell carcinoma, lymphatic invasion, venous invasion,
pleural invasion, depth of invasion, and poor prognosis, but was
not an independent prognostic factor. However, the combination of
GLUT1 and PKM2 expression was found to be a reliable independent
prognostic predictor for patients with NSCLC.
The activities of GLUT1 and PKM2 are associated with
various cancers; however, no study has evaluated the relationship
between GLUT1 and PKM2 expression and the clinicopathological
features associated with NSCLC to date. In this study, positive
expression of both GLUT1 and PKM2 in NSCLC significantly associated
with the male sex, squamous cell carcinoma, lymphatic invasion, and
pleural invasion. Compared with adenocarcinoma, squamous cell
carcinoma is associated with low oxygen-containing environments
(25). This may be due to lower
microvessel density compared to that of adenocarcinoma (26). The lower vessel density of squamous
cell carcinoma leads to hypoxic microenvironment relative to tumor
oxygen demand, and may affect subsequent upregulation of anaerobic
glucose metabolic markers. Under aerobic conditions, normal cells
obtain energy from glucose via mitochondrial oxidative
phosphorylation (27). Upregulation
of anaerobic glycolysis in cancer cells and squamous cell carcinoma
in hypoxic conditions might increase the expression of PKM2
(18,25). In addition, GLUT1 expression may
have been upregulated owing to increased glucose consumption. GLUT1
expression can be enhanced by the hypoxia-inducible factor-1α
(HIF-1α), which is upregulated in hypoxic environments (28). These findings imply that owing to
the relatively lower oxygen levels in the squamous cell carcinoma
environment, squamous cell carcinoma might be more common than
adenocarcinoma in patients with positive expressions of both GLUT1
and PKM2. Since both GLUT1 and PKM2 are glucose metabolism enzymes,
we examined the association between diabetes and the expressions of
these enzymes and observed no significant association (data not
shown).
A correlation between GLUT1 expression and sex was
reported in patients with NSCLC (13,29,30);
however, no correlation has been reported between PKM2 expression
and sex. Moreover, we found a significant association between sex
and GLUT1 expression, but not between sex and PKM2 expression.
Squamous cell carcinoma is closely associated with a history of
smoking, and a large proportion of Japanese men have a history of
smoking (31), which could be the
reason for the high frequency of squamous cell carcinoma in the
G+/P+ group.
The importance of glycolysis in lymphangiogenesis
has been well established (32).
The glucose metabolic enzyme, PKM2, plays an important role in
anaerobic glycolysis and has been reported to promote
lymphangiogenesis and the proliferation and migration of lymphatic
endothelial cells (33). In
addition, high GLUT1 expression was associated with lymph node
metastasis in patients with lung cancer (34), indicating that high GLUT1 expression
in tumors correlates with lymphatic invasion. These results
indicate that patients in the G+/P+ group have a significantly
higher lymphatic invasion rate than those in the ‘other
expressions’ group.
GLUT1 expression is associated with large tumor
sizes in patients with lung cancer (13,34).
Tumor growth activity is partially regulated by PKM2-initiated
tumor angiogenesis (35,36). As tumor size increases, the tumor
edge can reach the visceral pleura. Both GLUT1 and PKM2 have been
reported to promote the invasive ability of tumors (37,38).
These findings suggest that the patients in the G+/P+ group have a
high rate of pleural invasion than those in the ‘other expressions’
group.
There was no significant difference in lymph node
metastasis according to GLUT1 expression in patients with squamous
cell carcinoma, whereas patients with non-squamous cell carcinoma
had significant association between GLUT1 expression and lymph node
metastasis. Positive expression of GLUT1 has been reported to be
associated with lymph node metastasis in patients with lung cancer
(34), and relationship between
lymph node metastasis and GLUT1 expression differs in patients with
adenocarcinoma and non-adenocarcinoma (17). Thus, the effect of GLUT1 on lymph
node metastasis may differ between squamous and non-squamous cell
carcinoma.
While there was no significant difference in
prognosis between PKM2 expression, GLUT1-positive patients with
NSCLC exhibited a significantly poorer overall survival rate and
disease-free survival rate than GLUT1-negative patients. We found
the similar result from the dataset GSE42127 in PROGgeneV2 database
(22,23) (Fig.
S2). GLUT1-positive patients with stage I NSCLC exhibited
poorer disease-free survival rate than GLUT1-negative patients.
This significant difference in disease-free survival among patients
with stage I NSCLC might be attributed to enhanced cancer
malignancy induced by GLUT1 expression (12,13).
On the other hand, the absence of a significant difference in
disease-free survival between patients with stages II and III NSCLC
might be attributed to the high rate of tumor recurrence,
regardless of GLUT1 expression in patients with stage III
NSCLC.
Patients with NSCLC who were positive for both GLUT1
and PKM2 had significantly poorer survival rates than those in the
‘other expressions’ group. The combination of GLUT1 and PKM2 shows
potential as an independent prognostic factor for disease-free
survival in patients with NSCLC who underwent R0 resection. These
results illustrate the importance of evaluating GLUT1 and PKM2
expression in patients with NSCLC. There are several reports about
the prognostic significance of GLUT1 (13–15)
and of PKM2 (19,20). Osugi et al reported the
prognostic significance of the combination of GLUT1 and adenosine
triphosphate-citrate lyase (ACLY) (16) Meijer et al reported that the
combination of GLUT1 and monocarboxylate transporter 4 (MCT4) as a
useful prognostic marker (17).
These two enzymes are related to glucose metabolism, but not the
enzyme of glucose metabolism pathway itself. The novelty of this
study is to examine the association between the glucose uptake
affected by GLUT1 and glucose metabolism pathway by PKM2 on the
clinicopathological features and prognosis associated with NSCLC.
Cancer cells that positively express both GLUT1 and PKM2 are
upregulated during anaerobic glycolysis and are associated with
high malignancy. Malignant tumors cause hypoxic environments
because they grow more rapidly than they undergo angiogenesis.
Cancer cells have robust anaerobic glycolysis; thus, the Warburg
effects increase the glucose requirement of cancer cells (6). GLUT1 overexpression promotes glucose
uptake, whereas PKM2 overexpression promotes anaerobic glycolysis.
These findings suggest that cancer cells positively express both
GLUT1 and PKM2 may uptake larger amounts of glucose and switch to
anaerobic glycolysis owing to increased glucose metabolism rates.
We found significantly poor prognosis in G+/P+ group especially in
stage 0-I. This may be due to the activation of malignancy of
cancer cells in early hypoxic area, which was caused by upregulated
glycolysis by GLUT1 and PKM2. We did not find the significant
difference of SUVmax in primary tumor between patients with G+/P+
expression and other expressions in this study. In lung cancer,
however, a high SUVmax score of 18F-FDG-PET, which
reflects glucose metabolism in tumors, is considered an indicator
of malignancy (39). The
combination of GLUT1 and PKM2 expression might be a useful
prognostic marker for lung cancer following curative R0 operation
and possibly serve as a potential treatment target and an adjuvant
chemotherapeutic regimen for patients with NSCLC.
However, this study had some limitations. First,
owing to the retrospective nature of the study, not all parameters
were analyzed in the patients; moreover, some patients dropped out
and were unavailable for follow-up. Second, GLUT1 and PKM2
expression were evaluated via immunohistochemistry alone; thus,
future studies should perform alternate methods to assess GLUT1 and
PKM2 expression to validate our findings.
In conclusion, both of GLUT1 and PKM2 positive
expression have a higher lymphatic invasion rate. The combination
of GLUT1 and PKM2 is a reliable prognostic predictor in patients
with NSCLC following curative resection and may be used as a
clinical target for NSCLC.
Supplementary Material
Supporting Data
Acknowledgements
The authors would like to thank Ms. Akiko Tsuda
(Osaka Metropolitan University Graduate School of Medicine), for
their technical assistance.
Funding
This study was supported by KAKENHI (Grants-in-Aid for
Scientific Research, grant no. 21H03008) by the Japan Society for
the Promotion of Science.
Availability of data and materials
The datasets used and/or analyzed during the current
study are available from the corresponding author on reasonable
request.
Authors' contributions
RI conceived and designed the study, provided
administrative support and the materials or patients in the study,
collected and assembled the data, analyzed and interpreted the
data, and drafted the manuscript. MY conceived and designed the
study, provided administrative support, analyzed and interpreted
the data, and made critical revisions to the manuscript. TT
prepared the paraffin-embedded sections, performed immunostaining,
analyzed and interpreted the data. NI conceived and designed the
study, and prepared the materials and patients in the study. HK
prepared the paraffin-embedded sections, performed immunostaining,
and analyzed and interpreted the data. HI prepared the
paraffin-embedded sections, performed immunostaining, collected and
assembled the data, and analyzed and interpreted the data. YY
collected and assembled the data. NN prepared the paraffin-embedded
sections, performed immunostaining, and made critical revisions to
the manuscript. RI and MY confirm the authenticity of all the raw
data. All authors read and approved the final manuscript.
Ethics approval and consent to
participate
The study was conducted in accordance with the
Declaration of Helsinki and approved by the Osaka City University
Ethics Committee (approval number 2019-006). Written informed
consent was obtained from all the patients prior to the operative
procedure. All procedures involving humans were performed in
accordance with the relevant guidelines and regulations.
Patient consent for publication
Not applicable.
Competing interests
The authors declare that they have no competing
interests.
References
|
1
|
Torre LA, Bray F, Siegel RL, Ferlay J,
Lortet-Tieulent J and Jemal A: Global cancer statistics, 2012. CA
Cancer J Clin. 65:87–108. 2015. View Article : Google Scholar : PubMed/NCBI
|
|
2
|
Maemondo M, Inoue A, Kobayashi K, Sugawara
S, Oizumi S, Isobe H, Gemma A, Harada M, Yoshizawa H, Kinoshita I,
et al: Gefitinib or chemotherapy for non-small-cell lung cancer
with mutated EGFR. N Engl J Med. 362:2380–2388. 2010. View Article : Google Scholar : PubMed/NCBI
|
|
3
|
Molina JR, Yang P, Cassivi SD, Schild SE
and Adjei AA: Non-small cell lung cancer: Epidemiology, risk
factors, treatment, and survivorship. Mayo Clin Proc. 83:584–594.
2008. View
Article : Google Scholar : PubMed/NCBI
|
|
4
|
Abdel-Wahab AF, Mahmoud W and Al-Harizy
RM: Targeting glucose metabolism to suppress cancer progression:
Prospective of anti-glycolytic cancer therapy. Pharmacol Res.
150:1045112019. View Article : Google Scholar : PubMed/NCBI
|
|
5
|
Lebelo MT, Joubert AM and Visagie MH:
Warburg effect and its role in tumourigenesis. Arch Pharm Res.
42:833–847. 2019. View Article : Google Scholar : PubMed/NCBI
|
|
6
|
Warburg O: On the origin of cancer cells.
Science. 123:309–314. 1956. View Article : Google Scholar : PubMed/NCBI
|
|
7
|
Thews O and Riemann A: Tumor pH and
metastasis: A malignant process beyond hypoxia. Cancer Metastasis
Rev. 38:113–129. 2019. View Article : Google Scholar : PubMed/NCBI
|
|
8
|
Pavlova NN and Thompson CB: The emerging
hallmarks of cancer metabolism. Cell Metab. 23:27–47. 2016.
View Article : Google Scholar : PubMed/NCBI
|
|
9
|
Jun YJ, Jang SM, Han HL, Lee KH, Jang KS
and Paik SS: Clinicopathologic significance of GLUT1 expression and
its correlation with Apaf-1 in colorectal adenocarcinomas. World J
Gastroenterol. 17:1866–1873. 2011. View Article : Google Scholar : PubMed/NCBI
|
|
10
|
Grabellus F, Nagarajah J, Bockisch A,
Schmid KW and Sheu SY: Glucose transporter 1 expression, tumor
proliferation, and iodine/glucose uptake in thyroid cancer with
emphasis on poorly differentiated thyroid carcinoma. Clin Nucl Med.
37:121–127. 2012. View Article : Google Scholar : PubMed/NCBI
|
|
11
|
Luo XM, Zhou SH and Fan J: Glucose
transporter-1 as a new therapeutic target in laryngeal carcinoma. J
Int Med Res. 38:1885–1892. 2010. View Article : Google Scholar : PubMed/NCBI
|
|
12
|
Carvalho KC, Cunha IW, Rocha RM, Ayala FR,
Cajaíba MM, Begnami MD, Vilela RS, Paiva GR, Andrade RG and Soares
FA: GLUT1 expression in malignant tumors and its use as an
immunodiagnostic marker. Clinics (Sao Paulo). 66:965–972. 2011.
View Article : Google Scholar : PubMed/NCBI
|
|
13
|
Tan Z, Yang C, Zhang X, Zheng P and Shen
W: Expression of glucose transporter 1 and prognosis in non-small
cell lung cancer: A pooled analysis of 1665 patients. Oncotarget.
8:60954–60961. 2017. View Article : Google Scholar : PubMed/NCBI
|
|
14
|
Minami K, Saito Y, Imamura H and Okamura
A: Prognostic significance of p53, Ki-67, VEGF and Glut-1 in
resected stage I adenocarcinoma of the lung. Lung Cancer. 38:51–57.
2002. View Article : Google Scholar : PubMed/NCBI
|
|
15
|
Andersen S, Eilertsen M, Donnem T,
Al-Shibli K, Al-Saad S, Busund LT and Bremnes RM: Diverging
prognostic impacts of hypoxic markers according to NSCLC histology.
Lung Cancer. 72:294–302. 2011. View Article : Google Scholar : PubMed/NCBI
|
|
16
|
Osugi J, Yamaura T, Muto S, Okabe N,
Matsumura Y, Hoshino M, Higuchi M, Suzuki H and Gotoh M: Prognostic
impact of the combination of glucose transporter 1 and ATP citrate
lyase in node-negative patients with non-small lung cancer. Lung
Cancer. 88:310–318. 2015. View Article : Google Scholar : PubMed/NCBI
|
|
17
|
Meijer TW, Schuurbiers OC, Kaanders JH,
Looijen-Salamon MG, de Geus-Oei LF, Verhagen AF, Lok J, van der
Heijden HF, Rademakers SE, Span PN and Bussink J: Differences in
metabolism between adeno- and squamous cell non-small cell lung
carcinomas: Spatial distribution and prognostic value of GLUT1 and
MCT4. Lung Cancer. 76:316–323. 2012. View Article : Google Scholar : PubMed/NCBI
|
|
18
|
Jiang L and Deberardinis RJ: Cancer
metabolism: When more is less. Nature. 489:511–512. 2012.
View Article : Google Scholar : PubMed/NCBI
|
|
19
|
Guo CY, Zhu Q, Tou FF, Wen XM, Kuang YK
and Hu H: The prognostic value of PKM2 and its correlation with
tumour cell PD-L1 in lung adenocarcinoma. BMC Cancer. 19:2892019.
View Article : Google Scholar : PubMed/NCBI
|
|
20
|
Rzechonek A, Kaminska A, Mamczur P,
Drapiewski A and Budzynski W: Limited clinical significance of
dimeric form of pyruvate kinase as a diagnostic and prognostic
biomarker in non-small cell lung cancer. Adv Exp Med Biol.
955:51–57. 2017. View Article : Google Scholar : PubMed/NCBI
|
|
21
|
Tirpe AA, Gulei D, Ciortea SM, Crivii C
and Berindan-Neagoe I: Hypoxia: Overview on hypoxia-mediated
mechanisms with a focus on the role of HIF genes. Int J Mol Sci.
20:61402019. View Article : Google Scholar : PubMed/NCBI
|
|
22
|
Goswami CP and Nakshatri H: PROGgeneV2:
Enhancements on the existing database. BMC Cancer. 14:9702014.
View Article : Google Scholar : PubMed/NCBI
|
|
23
|
Tang H, Xiao G, Behrens C, Schiller J,
Allen J, Chow CW, Suraokar M, Corvalan A, Mao J, White MA, et al: A
12-gene set predicts survival benefits from adjuvant chemotherapy
in non-small cell lung cancer patients. Clin Cancer Res.
19:1577–1586. 2013. View Article : Google Scholar : PubMed/NCBI
|
|
24
|
Kanda Y: Investigation of the freely
available easy-to-use software ‘EZR’ for medical statistics. Bone
Marrow Transplant. 48:452–458. 2013. View Article : Google Scholar : PubMed/NCBI
|
|
25
|
Schuurbiers OCJ, Meijer TW, Kaanders JH,
Looijen-Salamon MG, de Geus-Oei LF, van der Drift MA, van der
Heijden EH, Oyen WJ, Visser EP, Span PN and Bussink J: Glucose
metabolism in NSCLC is histology-specific and diverges the
prognostic potential of 18FDG-PET for adenocarcinoma and squamous
cell carcinoma. J Thorac Oncol. 9:1485–1493. 2014. View Article : Google Scholar : PubMed/NCBI
|
|
26
|
Fan C, Yu J, Liu Y, Xu H and Wang E:
Increased NDRG1 expression is associated with advanced T stages and
poor vascularization in non-small cell lung cancer. Pathol Oncol
Res. 18:549–556. 2012. View Article : Google Scholar : PubMed/NCBI
|
|
27
|
Li Z and Zhang H: Reprogramming of
glucose, fatty acid and amino acid metabolism for cancer
progression. Cell Mol Life Sci. 73:377–392. 2016. View Article : Google Scholar : PubMed/NCBI
|
|
28
|
Masoud GN and Li W: HIF-1α pathway: Role,
regulation and intervention for cancer therapy. Acta Pharm Sin B.
5:378–389. 2015. View Article : Google Scholar : PubMed/NCBI
|
|
29
|
Sasaki H, Shitara M, Yokota K, Hikosaka Y,
Moriyama S, Yano M and Fujii Y: Overexpression of GLUT1 correlates
with Kras mutations in lung carcinomas. Mol Med Rep. 5:599–602.
2012.PubMed/NCBI
|
|
30
|
Maki Y, Soh J, Ichimura K, Shien K,
Furukawa M, Muraoka T, Tanaka N, Ueno T, Yamamoto H, Asano H, et
al: Impact of GLUT1 and Ki-67 expression on early-stage lung
adenocarcinoma diagnosed according to a new international
multidisciplinary classification. Oncol Rep. 29:133–140. 2013.
View Article : Google Scholar : PubMed/NCBI
|
|
31
|
Sobue T, Suzuki T, Fujimoto I, Matsuda M,
Doi O, Mori T, Furuse K, Fukuoka M, Yasumitsu T, Kuwahara O, et al:
Case-control study for lung cancer and cigarette smoking in Osaka,
Japan: Comparison with the results from Western Europe. Jpn J
Cancer Res. 85:464–473. 1994. View Article : Google Scholar : PubMed/NCBI
|
|
32
|
Yu P, Alves TC, Kibbey RG and Simons M:
Metabolic analysis of lymphatic endothelial cells. Methods Mol
Biol. 1846:325–334. 2018. View Article : Google Scholar : PubMed/NCBI
|
|
33
|
Jiang H, Zou Y, Zhao J, Li X, Yang S, Zhou
X, Mou D, Zhong W and Cai Y: Pyruvate kinase M2 mediates glycolysis
in the lymphatic endothelial cells and promotes the progression of
lymphatic malformations. Am J Pathol. 191:204–215. 2021. View Article : Google Scholar : PubMed/NCBI
|
|
34
|
Zhang B, Xie Z and Li B: The
clinicopathologic impacts and prognostic significance of GLUT1
expression in patients with lung cancer: A meta-analysis. Gene.
689:76–83. 2019. View Article : Google Scholar : PubMed/NCBI
|
|
35
|
Li Z, Yang P and Li Z: The multifaceted
regulation and functions of PKM2 in tumor progression. Biochim
Biophys Acta. 1846:285–296. 2014.PubMed/NCBI
|
|
36
|
Li L, Zhang Y, Qiao J, Yang JJ and Liu ZR:
Pyruvate kinase M2 in blood circulation facilitates tumor growth by
promoting angiogenesis. J Biol Chem. 289:25812–25821. 2014.
View Article : Google Scholar : PubMed/NCBI
|
|
37
|
Zahra K, Dey T, Ashish Mishra SP and
Pandey U: Pyruvate kinase M2 and cancer: The role of PKM2 in
promoting tumorigenesis. Front Oncol. 10:1592020. View Article : Google Scholar : PubMed/NCBI
|
|
38
|
Kubo Y, Aishima S, Tanaka Y, Shindo K,
Mizuuchi Y, Abe K, Shirabe K, Maehara Y, Honda H and Oda Y:
Different expression of glucose transporters in the progression of
intrahepatic cholangiocarcinoma. Hum Pathol. 45:1610–1617. 2014.
View Article : Google Scholar : PubMed/NCBI
|
|
39
|
Cerfolio RJ, Bryant AS, Ohja B and
Bartolucci AA: The maximum standardized uptake values on positron
emission tomography of a non-small cell lung cancer predict stage,
recurrence, and survival. J Thorac Cardiovasc Surg. 130:151–159.
2005. View Article : Google Scholar : PubMed/NCBI
|