Introduction
Lung cancer is one of the most common malignancies
worldwide and remains the leading cause of cancer-related death
(1). The incidence of lung cancer
is still increasing in the world, and screening by chest X-ray and
computed tomography (CT) has shown a high success rate in
diagnosis. Recent advances in targeted therapy for lung cancer have
shown benefits for patients with adenocarcinoma (AC) who harbor
mutations in driver genes. However, less satisfactory results have
been obtained for more complex cases, such as drug-resistant cases,
and treatment options for non-AC cases are limited (2,3).
Therefore, the overall cure and survival rates in patients with
advanced-stage lung cancer remain low (22% 5-year overall survival
rate) (4). This compels researchers
to find more effective and useful biomarkers for diagnosis,
prognosis and further clarification of the unknown pathological
aspects of lung cancer. Ideally, the identification and better
characterization of more easily accessible and cost-effective
biomarkers could revolutionize the diagnoses and therapies for
these types of cancer.
Proteins secreted by cancer cells are potentially
useful candidates for circulating tumor markers. Although assays,
predominantly ELISA, evaluating a number of clinically relevant
proteins in serum have been established, several of which have been
reported to be useful in the diagnosis and monitoring of advanced
cancers, such as CEA, NSE and CYFRA21-1 (5–7), these
assays have not been suited to use for mass screening or diagnosis
in the early stages of cancer, due to their relatively low
sensitivity/specificity and high costs.
The trefoil factor (TFF) family, which comprises
gastric peptide pS2/TFF1, spasmolytic peptide/TFF2 and intestinal
trefoil factor/TFF3, are expressed and secreted in almost all
mucus-secreting cells in mucosal surfaces, predominantly those of
the gastrointestinal tract (8,9). TFFs
are small (7–12 kDa) protease-resistant proteins with a conserved
‘trefoil’ domain, which contains 3 disulfide bonds that provide
functional stability (8,10). TFFs can be detected as monomeric,
homo-dimeric or hetero-dimeric forms in secretions and serve an
essential role in epithelial restitution and mucosal protection
(8,10).
Individual TFFs have been characterized as follows.
In vitro experiments using cultured cells have reported that
TFF1 serves a pivotal role in enhanced growth, survival, migration
and invasion of pancreatic and colonic cancer cells (11–13).
Similarly, overexpression of TFF3 has been reported to drive
proliferation, migration and invasion, and the angiogenic and
antiapoptotic capacities of breast and colonic cancer cells
(13–16). Notably, high TFF expression levels
have been reported clinically in breast (TFF1 and 3) (17), lung (TFF1 and 3) (18,19),
pancreas (TFF2) (20) and colon
cancers (TFF3) (21). Moreover,
expression of TFF2 has been reported to be predictive of a more
aggressive phenotype in gastric cancer (22,23)
and TFF3 in gastric (23–25), colorectal (25,26)
and breast cancer (25,27). However, loss of TFF1 is carcinogenic
in mice (10,28), and the region of chromosome 21q22.3
in which the 3 TFF genes are clustered is frequently deleted in
human gastric cancer (10). In
cancer cell lines, exogenous TFF1 consistently reduced cell
proliferation by delaying the G1 to S phase transition in human
colonic and gastric carcinoma cells (29). Similarly, in a previous study, it
was shown that TFF1 can suppress cell proliferation, survival,
migration and invasion in lung carcinoma cells (30). Notably, the expression of TFF1 is
also predictive of improved survival time for patients with breast
cancer (27,31). Moreover, TFF3 was also reported to
inhibit the growth of colorectal cancer cells, in a cell-type
dependent manner (32). In clinical
specimens, TFF3 expression was reported to be lower in colorectal
cancer compared with normal tissue (33). These observations indicate that TFF1
and TFF3 can also function as tumor suppressor-like proteins.
Serum TFFs (sTFFs) have been sporadically reported
as possible biomarkers in cancer screening: TFF1 and TFF3 for
breast (17), gastric (34,35),
colorectal (36) and endometrial
cancer (37), and all TFFs for
prostate cancer (38). Moreover,
sTFF1 and sTFF3 have been described as possible prognostic markers
in endometrial (37), gastric
(39) and colorectal cancer
(40,41). However, the utility of TFF3, as
suggested by its high serum concentration in patients with lung
cancer regardless of histological type (42), has yet to be established as a
clinical diagnostic tool. Moreover, the potential correlation
between serum and/or urinary TFFs (uTFFs) and tissue expression has
yet to be assessed.
To extend previously reported in vitro
analysis (30) into potential in
vivo clinical analyses, a comprehensive survey of all TFFs in
both serum and urine was conducted in the present study. uTFF
analysis was of particular interest as this is a completely
non-invasive diagnostic method and is potentially suitable for mass
screening. Overall data were evaluated clinicopathologically and
compared to protein expression levels of TFFs in cancer
tissues.
Materials and methods
Patients
Patients' clinicopathological profiles, including
tumor stage by TNM classification (43) were presented in Table I and further details were presented
in Table SI. The study population
consisted of 199 patients according to the following inclusion
criteria; those with lung cancer, without history of malignant
tumor nor history of other malignant tumor, who had undergone
surgery at the Saitama Medical Center at Jichi Medical University
(Saitama, Japan) from January 2017 to Jul 2019. These patients
included of 142 AC, 45 squamous cell carcinoma (SCC), 4 large cell
carcinoma (LCC), 4 small cell carcinoma (SmCC) and 4 pleomorphic
carcinoma cases. Serum and urine were collected from 198 healthy
individuals (Table SII), whose
ages (range, 38–75 years old; mean, 67.5 years old) and sex (127
males and 71 females) were matched as closely as possible with the
patients with lung cancer (range, 32–93 years old; mean, 69.3 years
old; 128 males and 71 females). Patients or healthy individuals
were excluded from the study if they had a history of malignancy,
pre-operative chemotherapy and/or diabetes mellitus. Individuals
with a Helicobacter pylori infection were also excluded from
the study as this infection has been reported to enhance sTFF
levels (35).
 | Table I.Patients and tumor
characteristics. |
Table I.
Patients and tumor
characteristics.
|
| ELISA | IHC |
|---|
|
|
|
|
|---|
|
Characteristics | Patients
(n=199) | Control
(n=198) | Patients
(n=100) |
|---|
| Sex, n |
|
|
|
|
Male | 128 | 127 | 65 |
|
Female | 71 | 71 | 35 |
| Age, years |
|
|
|
| <70,
n | 95 | 95 | 47 |
| >70,
n | 104 | 103 | 53 |
|
Range | 32-93 | 38-75 | 32-93 |
| Mean,
median | 69.3, 71 | 67.5, 71 | 68.6, 70 |
| Histology, n |
|
|
|
| AC | 142 |
| 73 |
|
SCC | 45 |
| 23 |
|
LCC | 4 |
| 1 |
|
SmCC | 4 |
| 2 |
|
Pleomorphic | 4 |
| 1 |
| pT factor, n |
|
|
|
|
Tis | 6 |
| 2 |
|
T1mi | 19 |
| 12 |
|
T1a | 30 |
| 15 |
|
T1b | 37 |
| 18 |
|
T1c | 16 |
| 6 |
|
T2a | 42 |
| 22 |
|
T2b | 18 |
| 9 |
| T3 | 20 |
| 10 |
| T4 | 11 |
| 6 |
| pN factor, n |
|
|
|
| N0 | 148 |
| 70 |
| N1 | 23 |
| 12 |
| N2 | 28 |
| 18 |
| pStage, n |
|
|
|
| I | 125 |
| 63 |
| II | 41 |
| 14 |
|
IIIa | 33 |
| 23 |
All patients and healthy individuals were confirmed
to have normal urinary creatinine levels, and all uTFFs were
normalized to urinary creatinine to avoid variations in urinary
protein concentration.
ELISA
A total of 0.5 ml of serum and 2 ml of morning urine
were collected from each patient after overnight fasting. The
samples were centrifuged at 5,000 × g for 15 min at 0°C and the
supernatant collected. All serum and urine samples were frozen at
−80°C before use. Polyclonal anti-sera were raised in our
laboratory, in rabbits immunized with recombinant human TFF1, TFF2
and TFF3 which had also been prepared in our laboratory as
previously described (32). The IgG
fraction was affinity purified using protein A into a concentrated
solution of 1 mg/ml. Each antibody solution was diluted with PBS to
a 1/200 working solution and was coated onto 96-well microtiter
plates. Concentrations of serum or urine TFF1, TFF2 and TFF3 were
measured using these in-house ELISA plates generated by coating
with antibodies against TFF1, TFF2 or TFF3, as previously reported
(17,35). Detection sensitivities were 7.0
pg/ml for TFF1, 30.0 pg/ml for TFF2 and 30.0 pg/ml for TFF3. It has
been previously reported that each TFF antibody reacted
specifically and no cross reactivity with other TFFs was reported
(17,35). Appropriate sample dilutions were
determined to place samples within the linear range of the
calibration curve, generated using recombinant human TFF1, 2 or 3
as previously described (35).
Absorbance at 450 nm was measured on a DTX-880 plate reader
(Beckman Coulter, Inc.) and sample TFF concentrations were
calculated from the calibration curves. There was no difference in
the detection quality between serum and urine TFFs.
Tissues and immunohistochemistry
(IHC)
Of the 199 samples of primary lung carcinoma
obtained by surgery in the Saitama Medical Center, 100 samples
which had been preserved and fixed at a high quality, and
demonstrated no necrosis or degeneration and positive staining in
bronchial gland cells, were prepared for IHC by paraffin section.
These 100 samples consisted of 73 AC, 23 SCC, 1 LCC, 2 SmCC and 1
pleomorphic carcinoma case (Table
I). Tissues from pathological lesions, together with adjacent
normal tissues were fixed in 10% formaldehyde at room temperature
for 24 h. Tissues were sliced into small pieces, embedded in
paraffin and cut into 3.5 µm sections. Heat-induced epitope was
performed using PT Link (cat. no. PT100/PT101; Agilent
Technologies, Inc.) and EnVisionTM FLEX Target Retrieval
Solution, High pH (pH 9.0; cat. no. S2367; Agilent Technologies,
Inc.) for TFF1 and TFF3, and Low pH (pH 6.0; cat. no. #S2031;
Agilent Technologies, Inc.) for TFF-2 at 95°C for 30 min. As the
antibodies used for ELISA did not react in paraffin-embedded
tissues, commercialized primary antibodies as follows were used:
Anti-TFF1 rabbit polyclonal (1:350; cat. no. PA5-31863; Invitrogen;
Thermo Fisher Scientific, Inc.), anti-TFF2, rabbit polyclonal
(1:50; cat. no. ab131147; Abcam) and anti-TFF3 rabbit monoclonal
(1:300; cat. no. ab108599; Abcam). Sections were incubated with the
blocking solution included in the kit for 20 min at room
temperature, with primary antibodies at 4°C overnight and with
secondary antibodies for 20 min at room temperature and
visualization was performed with a Catalyzed Signal Amplification
System II kit which included secondary antibodies (cat. no. K1497
and K1501; Agilent Technologies, Inc.). A total of 5 high
magnification fields of view were randomly selected from each
section and 200 cells were counted per field. Images were digitally
captured using a BX51 bright-field microscope (Olympus Corporation)
equipped with a DP-72 digital camera in conjunction with the
cellSens imaging software (version 1.18, Olympus Corporation).
Adobe Photoshop was used for image processing (CS4 Extended; Adobe
Systems Europe, Ltd.)
IHC score was determined semi-quantitatively by
multiplication of the ‘positive fraction’ with the
‘intensity-score’ according to the following system. Firstly, the
positive fraction was sub-divided as follows: i) 0, no staining;
ii) 1, <10% staining; iii) 2, 10–50% staining; and iv) 3,
>50% staining of cells with intensity score >0. Secondly,
intensity-score was determined as follows: i) 0 if there was no
staining or staining was weaker than that in non-neoplastic cells;
ii) 1 if the staining was the same as in non-neoplastic cells; and
iii) 2 if there was more intense staining than in the
non-neoplastic cells. An IHC score >0 was defined as ‘positive’
(44). Staining was evaluated by
two observers and discordance was resolved by discussion.
Statistical analysis
Statistical analyses were performed using the JMP
software package (version 11; SAS Institute, Inc.) and StatMate IV
(GraphPad Software; Dotmatics). Sufficient sample sizes were
confirmed and statistics were calculated with a 0.80 power at the
0.05α level using EZR 1.54 (https://www.softpedia.com/get/Science-CAD/EZR.shtml).
The Receiver operating characteristics (ROC)
sensitivity and specificity of serum or urine TFFs were plotted and
the figures were generated using EZR 1.54 (https://www.softpedia.com/get/Science-CAD/EZR.shtml).
Area under the curve (AUC) was calculated to determine the marker
cut-off points and the discriminatory potential of each TFF, as
well as each combination of TFFs. Logistic regression modeling was
used to estimate the odds ratio with 95% confidence interval (CI)
to construct a final composite score. Validation of analysis was
performed using Fisher's exact test in all sample groups, including
those from patients with lung cancer and from healthy individuals,
with the cut-off value (threshold) showing the highest AUC
(combination of sTFF1/2/3 + uTFF1/3). Observers' agreement in the
evaluation of IHC results was analyzed using κ statistics as
follows: i) 0, poor agreement; ii) 0<κ<0.2, slight agreement;
iii) 0.2<κ<0.4, fair agreement; iv) 0.4<κ<0.6, moderate
agreement; v) 0.6<κ<0.8, substantial agreement; and vi)
0.8<κ<1.0, almost perfect agreement. The Spearman's rank
correlation coefficient (ρ) was used as a measure of correlation
between levels of each TFF assessed using ELISA or between IHC
score and TFFs levels. Results were categorized as follows: i) no
correlation, ρ=0; ii) equivocal, ρ<0.2; iii) low,
0.2<ρ<0.4; iv) substantial, 0.4<ρ<0.7; v) high,
0.7<ρ<1.0; and vi) complete, ρ=1.0. The difference in TFF
levels among clinicopathological variables were analyzed using
Mann-Whitney U test between two groups or Kruskal-Wallis test
followed by Dunn's test among multiple groups. All tests were
two-sided and P<0.05 was considered to indicate a
statistically significant difference.
Results
Serum and urine TFFs
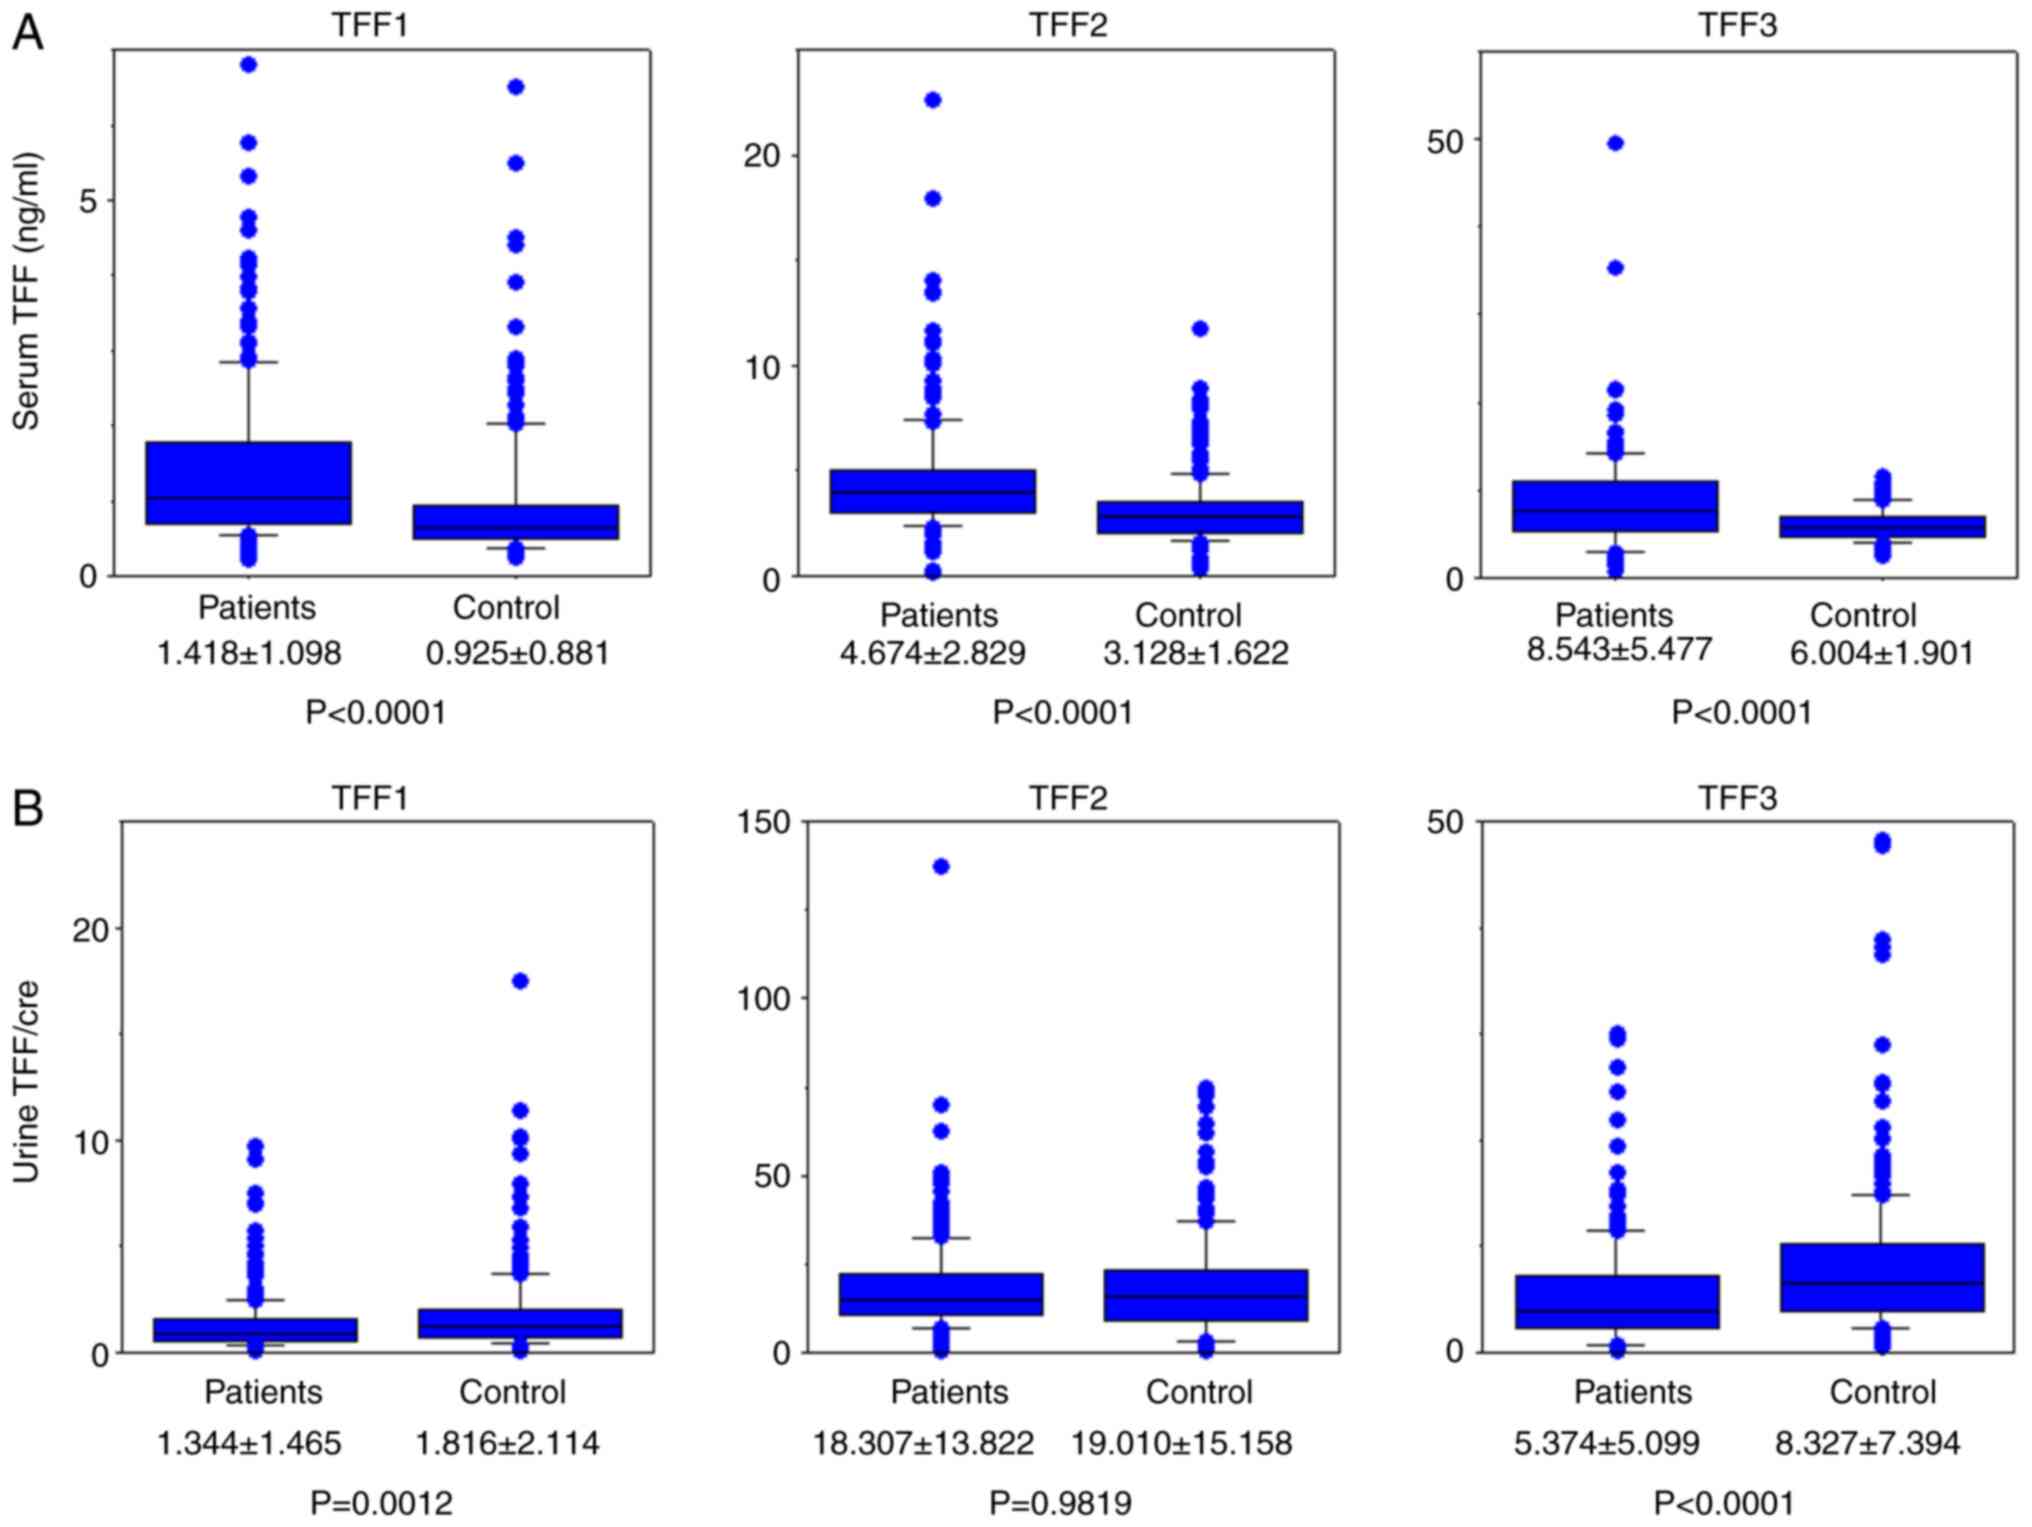
Concentrations of all TFFs in serum and urine were
measured using ELISA. All raw results from patients with lung
cancer and from healthy individuals are presented in Tables SI and SII, respectively. sTFF1, sTFF2 and sTFF3
concentrations in patients with lung cancer were all significantly
higher compared with those in healthy individuals (P<0.0001;
Fig. 1A). uTFF1 and uTFF3 values
normalized using the creatinine level were lower in patients with
lung cancer (P=0.0012 and P<0.0001, respectively; Fig. 1B).
Based on the results of upregulated sTFFs and
downregulated uTFFs in patients with lung cancer, the precise
diagnostic potential of either source alone or in combination was
explored to evaluate how well these levels in patients with lung
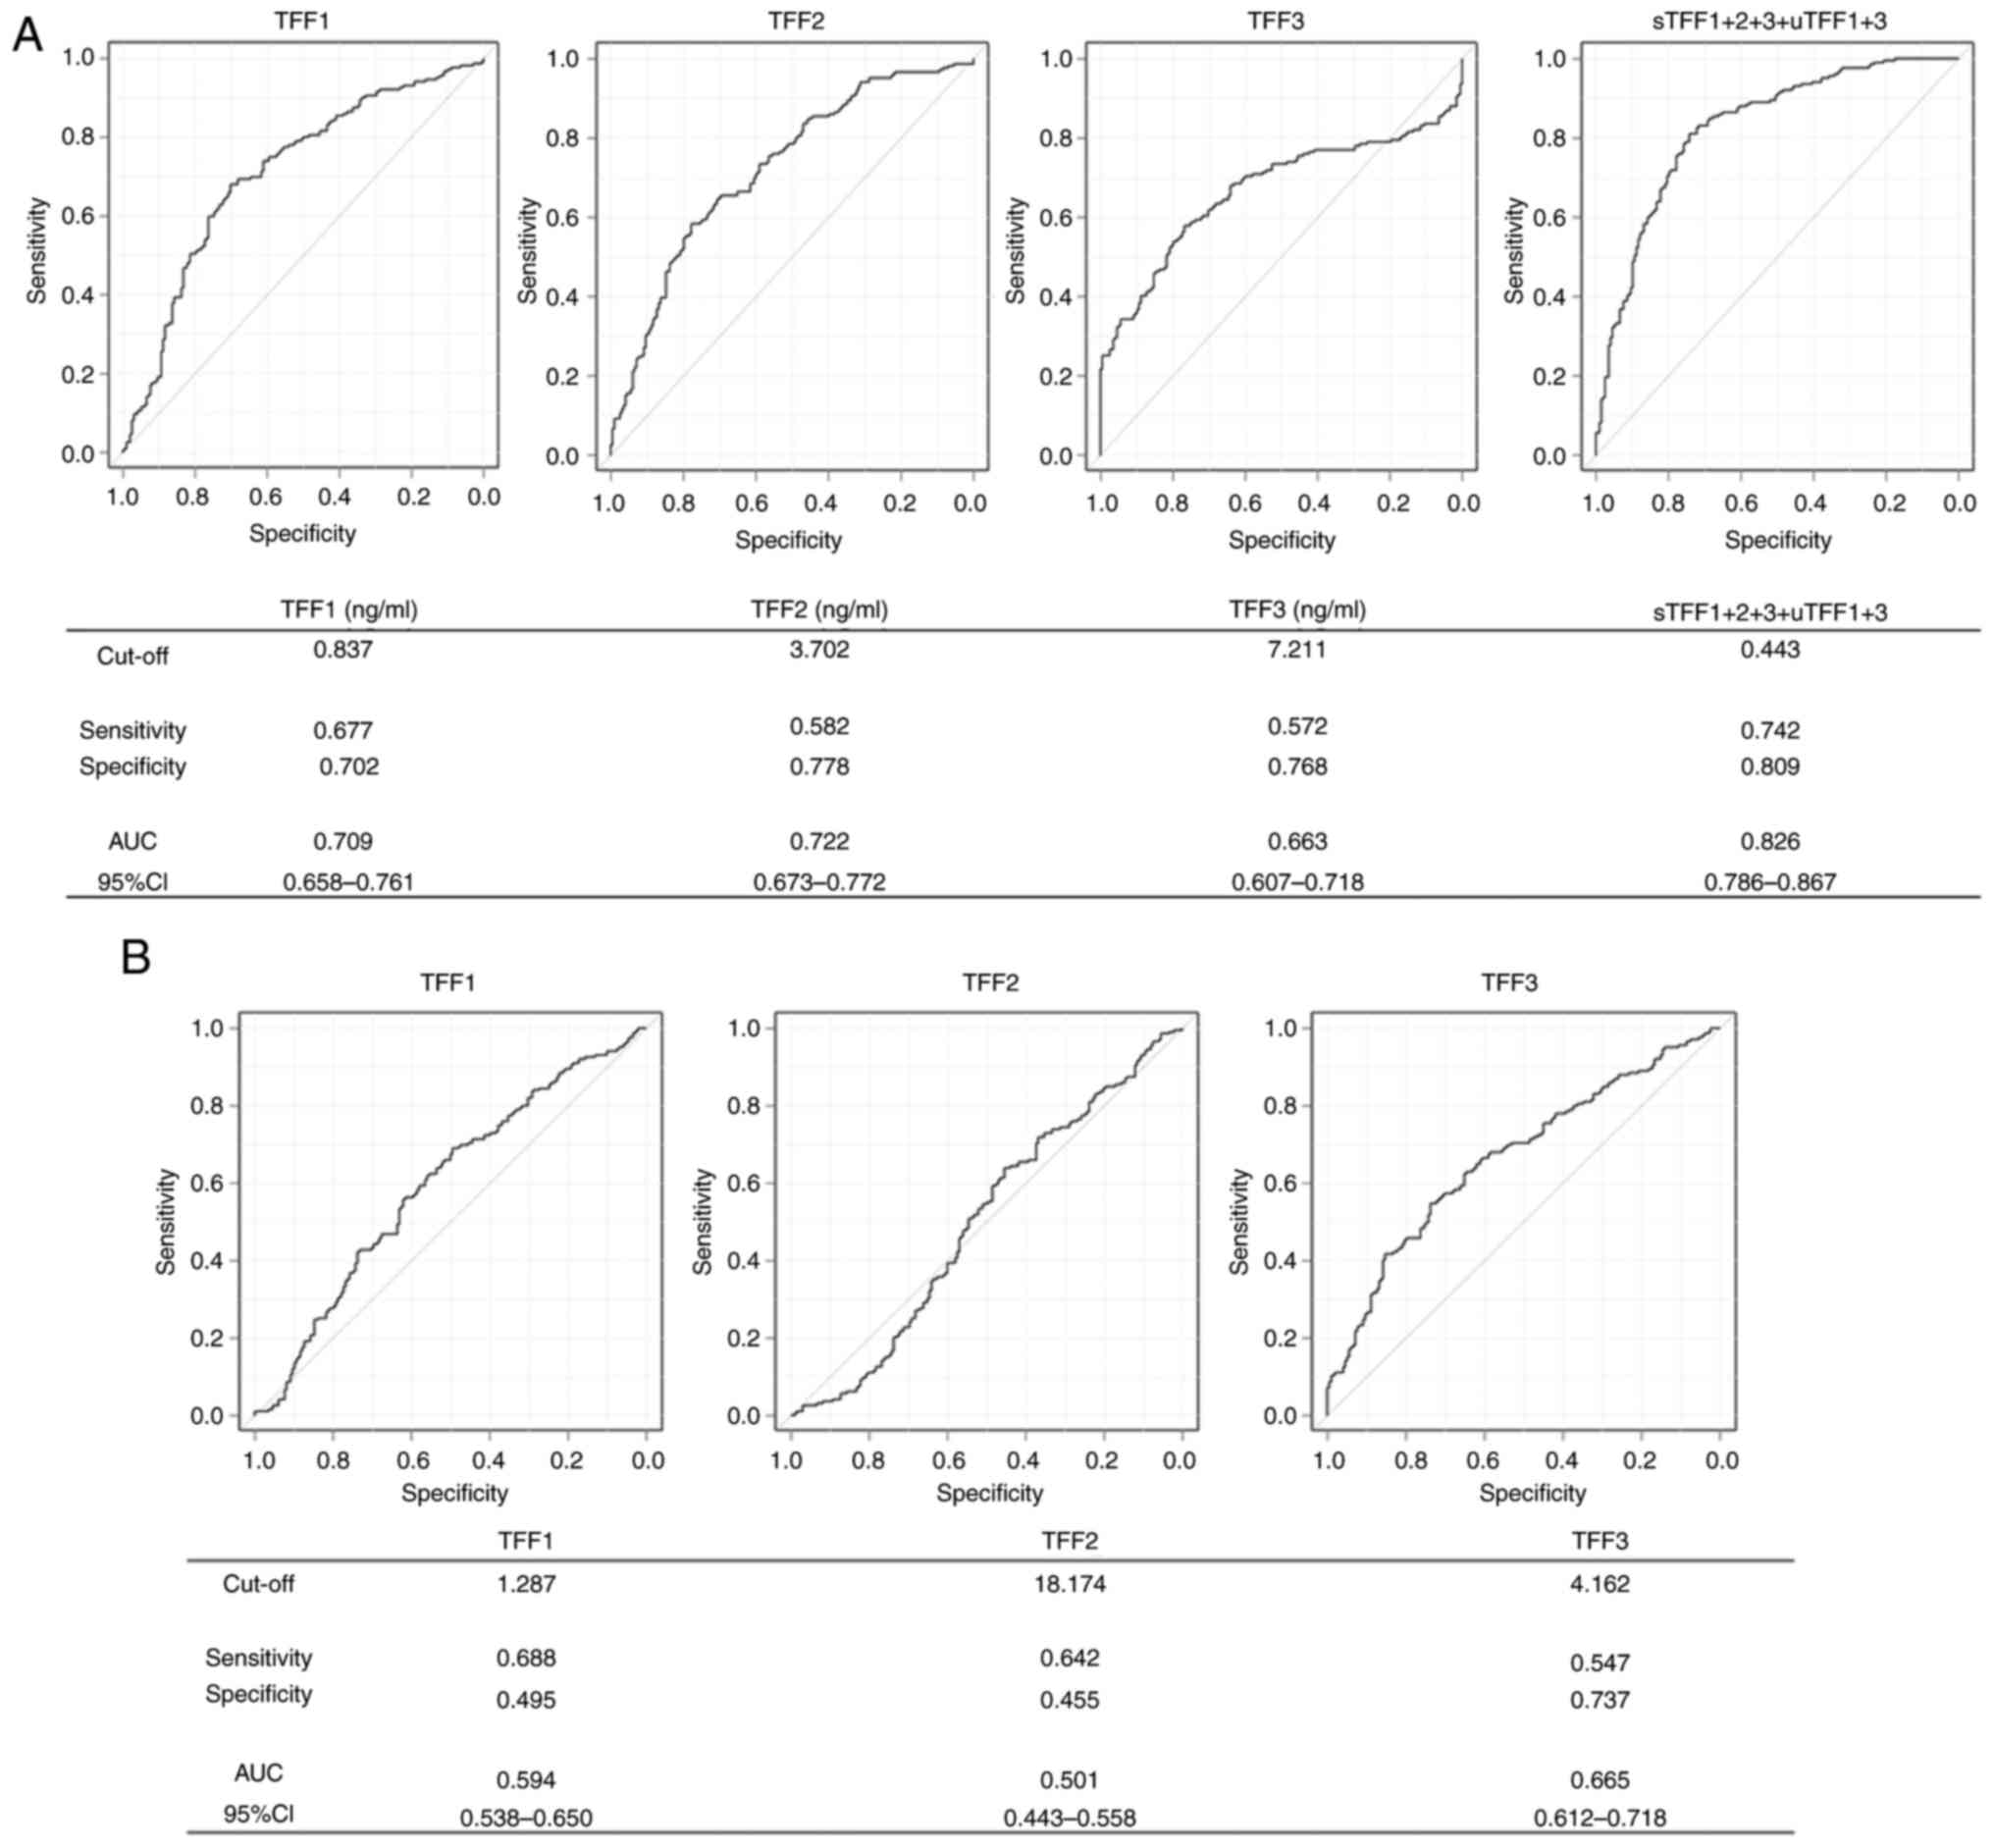
cancer or healthy individuals could be differentiated. The ability
to detect and segregate patients with lung cancer by ROC analysis
was assessed, which generated a graphical plot of the sensitivity
vs. specificity of TFF levels. AUC and sensitivity or specificity
at the optimal cut-offs are presented in Fig. 2. For serum, the AUC/cut-off values
for TFF1, TFF2 and TFF3 were 0.709/0.837, 0.722/3.702 and
0.663/7.211 ng/ml, respectively (Fig.
2A). With these cut-off values, the sensitivity/specificity for
discriminating between patients with lung cancer and healthy
individuals were calculated as 0.677/0.702 in TFF1, 0.582/0.778 in
TFF2 and 0.572/0.768 in TFF3. For urine, the AUC/cut-off values for
TFF1, TFF2 and TFF3 were 0.594/1.287, 0.501/18.174 and 0.665/4.162,
respectively (Fig. 2B). The
resultant sensitivity/specificity values were 0.688/0.495 for TFF1,
0.642/0.455 for TFF2 and 0.547/0.737 for TFF3.
The diagnostic potential of TFF data in combination
was also evaluated. Among the AUCs calculated, the highest value
was for the combination of sTFF1 + 2 + 3 with uTFF1 + 3, which was
0.826 with a cut-off value of 0.443 (Fig. 2A). Therefore, while any single TFF
discriminated patients with lung cancer, this combination of TFFs
demonstrated an improved diagnostic performance.
Validation of TFFs for their potential
in diagnostic screening
Instead of dividing the clinical sample groups into
training and validation sets, the utility of TFFs as a biomarker
for baseline screening was evaluated in all 397 cases of both
patients with lung cancer and healthy individuals (Tables SI and SII). A cut-off value of 0.443 was used,
which showed the highest AUC by the combination of sTFF1 + 2 + 3
and uTFF1 + 3. Cases were divided into 4 categories as shown in the
cross-tabulation table (Table II)
and the differences were statistically analyzed. With this cut-off
value, the sensitivity and the specificity of patients with lung
cancer and healthy individuals were 0.804 and 0.742, respectively,
and the positive and negative predictive values were 0.758 and
0.790, respectively. The difference was determined to be
statistically significant using Fisher's exact test
(P<0.0001).
| Table II.Case-distribution of all participants
separated with the cut-off (0.443) by the combination of sTFF1 + 2
+ 3 with uTFF1 + 3 (n=397). |
Table II.
Case-distribution of all participants
separated with the cut-off (0.443) by the combination of sTFF1 + 2
+ 3 with uTFF1 + 3 (n=397).
| Patients | >cut-off | <cut-off | Statistical
result |
|---|
| Patients with lung
cancer (n=199) | 160 | 39 |
Sensitivity=0.804 |
| Healthy individuals
(n=198) | 51 | 147 |
Specificity=0.742 |
| Statistical
result | Positive predictive
value=0.758 | Negative predictive
value=0.790 |
P=7.09×10⁻²⁹ |
Expression of TFFs by IHC
In parallel to the ELISA, TFF expression by IHC was
also analyzed. Inter-observer agreement in the evaluation of
staining results ranged from ‘substantial agreement’ to ‘almost
perfect agreement’ (TFF1, κ=0.837; TFF2, κ=0.791; TFF3, κ=0.830).
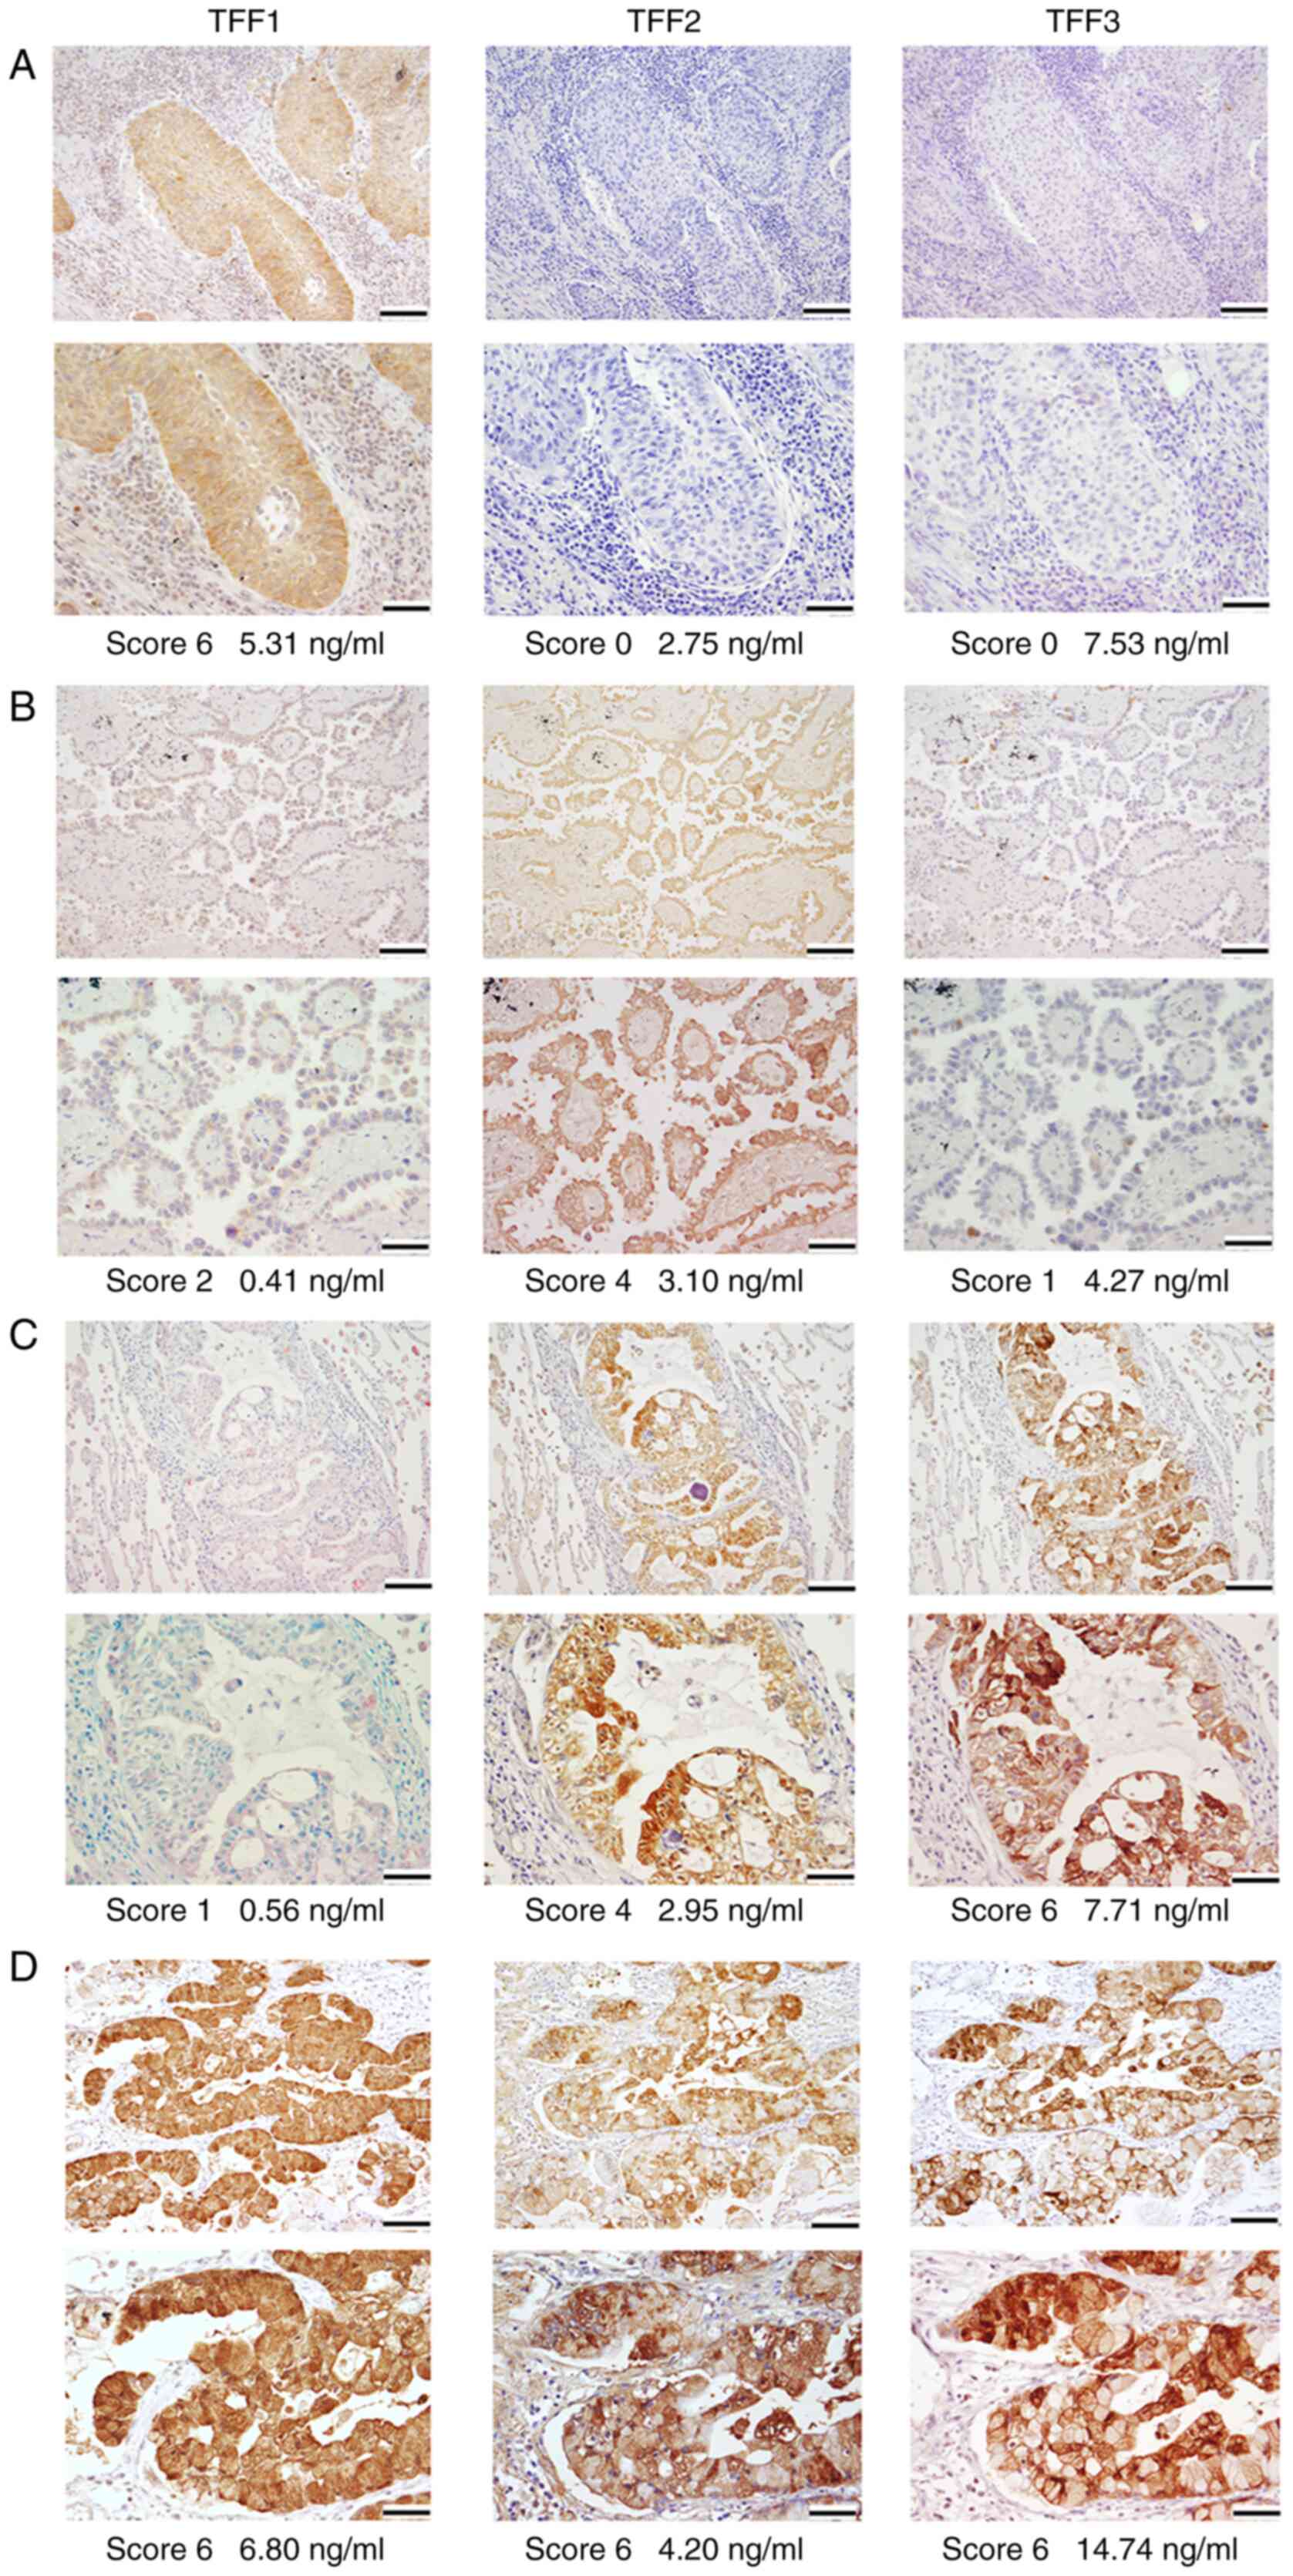
Representative IHC results are presented in Fig. 3, with staining results detailed in
Table III, and the results of
individual patients presented in Table
SIII. All TFFs were expressed in the cytoplasm of bronchial
glands and occasionally in bronchial epithelial cells, but not in
the alveolar epithelial cells or interstitial cells in normal
tissue. Among the 100 cancer cases analyzed, TFF1, TFF2 and TFF3
were positively stained in 41 (41.0%), 37 (37.0%) and 50 cases
(50.0%), respectively. TFF1 was expressed in the cytoplasm of 29/73
(39.7%) and 12/23 (52.2%) cases of AC and SCC, respectively, but in
no cases of SmCC, LCC or pleomorphic carcinoma. IHC scores of TFF1
staining were categorized into the following results: score 6, 3
cases; score 4, 8 cases; score 3, 10 cases; score 2, 13 cases;
score 1, 7 cases; score 0, 59 cases. TFF2 was expressed in the
cytoplasm of 25/73 (34.2%), 10/23 (43.5%), 2/2 (100%) and 0/2 cases
(0%) of AC, SCC, SmCC and others (pleomorphic carcinoma and large
cell carcinoma), respectively. TFF3 was expressed in the cytoplasm
of 38/73 (52.1%), 12/23 (52.2%) cases of AC and SCC, respectively
and none (0/4) of others (Table
III). Overall, 83 out of 100 (83.0%) cases were positive for at
least one of TFF1, TFF2 and TFF3 when assessed by IHC staining.
There were no specific microscopic staining patterns, such as
co-expression or reciprocal expression, among these three proteins
as a whole.
| Table III.Results of immunohistochemical
staining (n=100). |
Table III.
Results of immunohistochemical
staining (n=100).
|
| TFF1 | TFF2 | TFF3 |
|---|
|
|
|
|
|
|---|
| IHC score | 0 | 1 | 2 | 3 | 4 | 6 | 0 | 1 | 2 | 3 | 4 | 6 | 0 | 1 | 2 | 3 | 4 | 6 |
|---|
| Total number of
cases | 59 | 7 | 13 | 10 | 8 | 3 | 63 | 5 | 16 | 7 | 6 | 3 | 50 | 11 | 20 | 4 | 6 | 9 |
| Histological type
(cases), n |
|
|
|
|
|
|
|
|
|
|
|
|
|
|
|
|
|
|
| AC
(73) | 44 | 5 | 11 | 6 | 5 | 2 | 48 | 4 | 9 | 6 | 5 | 1 | 35 | 9 | 15 | 3 | 6 | 5 |
| SCC
(23) | 11 | 2 | 2 | 4 | 3 | 1 | 13 | 1 | 5 | 1 | 1 | 2 | 11 | 2 | 5 | 1 | 0 | 4 |
| LCC
(1) | 1 | 0 | 0 | 0 | 0 | 0 | 1 | 0 | 0 | 0 | 0 | 0 | 1 | 0 | 0 | 0 | 0 | 0 |
| SmCC
(2) | 2 | 0 | 0 | 0 | 0 | 0 | 0 | 0 | 2 | 0 | 0 | 0 | 2 | 0 | 0 | 0 | 0 | 0 |
|
Pleomorphic (1) | 1 | 0 | 0 | 0 | 0 | 0 | 1 | 0 | 0 | 0 | 0 | 0 | 1 | 0 | 0 | 0 | 0 | 0 |
Correlation between sTFFs and
uTFFs
Correlations between serum and urine TFFs levels
were determined using Spearman's rank correlation test. As shown in
Table IV, the correlation
coefficient (ρ) was generally higher between sTFF1 and sTFF2 in
both the patients with lung cancer and the healthy individuals. The
ρ between sTFF1 and sTFF2 was 0.494 in patients and 0.473 in
healthy individuals (deemed ‘substantial correlation’; both
P<0.001). Furthermore, there was a significant positive
correlation between sTFF1 and sTFF2 in all groups of pT
pathological tumor stage (pT) or pathological nodal stage (pN)
categories (except pT4) as well as in AC, which demonstrated
ρ-values ranging from 0.448-0.717. Most of the ρ-values were within
the range of ‘substantial correlation’, while the pN1 group had a
score of 0.717, which was categorized as a ‘high correlation’. In
healthy individuals, all uTFF1, uTFF2 and uTFF3 values were
correlated with each other in contrast to the patients with lung
cancer. In the patients with lung cancer, the positive correlation
between TFF1 and TFF2 was weaker in urine and the ρ-values between
uTFF1 and uTFF2 were within the range of ‘substantial correlation’
in pT2, pT4 (marginally) and pN1-2 groups. uTFF1 and uTFF3 showed
‘high correlation’ in pT4 and ‘substantial correlation’ in pN1/2
groups of lung cancer cases, but uTFF2 and uTFF3 correlated only in
pT4 with ρ=0.736, although it indicated a ‘high correlation’.
Between sTFF and uTFF, a ‘substantial correlation’ was observed for
all TFFs (TFF1, 0.516; TFF2, 0.463; TFF3, 0.560; P<0.0001 for
all; Table V). No inverse
correlation was found between each sTFF or uTFF.
| Table IV.Correlation coefficients (ρ) between
each TFF and P-values analyzed by Spearman's rank correlation
test. |
Table IV.
Correlation coefficients (ρ) between
each TFF and P-values analyzed by Spearman's rank correlation
test.
|
| Serum | Urine |
|---|
|
|
|
|
|---|
|
| TFF1 vs. TFF2 | TFF1 vs. TFF3 | TFF2 vs. TFF3 | TFF1 vs. TFF2 | TFF1 vs. TFF3 | TFF2 vs. TFF3 |
|---|
|
|
|
|
|
|
|
|
|---|
| Characteristic | ρ | P-value | ρ | P-value | ρ | P-value | ρ | P-value | ρ | P-value | ρ | P-value |
|---|
| Healthy individuals
(n=198) | 0.473* | <0.001 | 0.294 | - | 0.352 | - | 0.528* | <0.001 | 0.756** | <0.001 | 0.545* | <0.001 |
| Patients
(n=199) | 0.494* | <0.001 | 0.348 | - | 0.349 | - | 0.345 | - | 0.339 | - | 0.162 | - |
| pTis/T1 | 0.497* | <0.001 | 0.326 | - | 0.443* | <0.001 | 0.265 | - | 0.304 | - | 0.108 | - |
| pT2 | 0.486* | <0.001 | 0.458* | <0.001 | 0.230 | - | 0.471* | <0.001 | 0.352 | - | 0.172 | - |
| pT3 | 0.567* | 0.0091 | 0.322 | - | 0.316 | - | 0.393 | - | 0.322 | - | 0.319 | - |
| pT4 | 0.582 | 0.066 | 0.418 | 0.203 | 0.109 | - | 0.609* | 0.052 | 0.718** | 0.016 | 0.736** | 0.013 |
| pN0 | 0.448* | <0.001 | 0.289 | - | 0.344 | - | 0.283 | - | 0.286 | - | 0.120 | - |
| pN1 | 0.717** | <0.001 | 0.707** | <0.001 | 0.743** | <0.001 | 0.592* | 0.0029 | 0.420* | 0.046 | 0.356 | - |
| pN2 | 0.602* | <0.001 | 0.459* | 0.014 | 0.273 | - | 0.535* | 0.0033 | 0.484* | 0.009 | 0.270 | - |
| Adenocarcinoma | 0.570* | <0.001 | 0.345 | - | 0.353 | - | 0.374 | - | 0.312 | - | 0.154 | - |
| Squamous cell | 0.334 | - | 0.187 | - | 0.396 | - | 0.392 | - | 0.269 | - | 0.096 | - |
| carcinoma |
|
|
|
|
|
|
|
|
|
|
|
|
| Table V.Correlation Coefficients (ρ) between
sTFF, uTFF and IHC score by Spearman's rank correlation test in
patients with lung cancer. |
Table V.
Correlation Coefficients (ρ) between
sTFF, uTFF and IHC score by Spearman's rank correlation test in
patients with lung cancer.
| Factor | sTFF1 | sTFF2 | sTFF3 | IHC score |
|---|
| uTFF (n=199) |
|
|
|
|
| ρ | 0.516* | 0.195 | 0.139 | 0.197 |
|
P-valuea | <0.000 | - | - | - |
| uTFF2 (n=199) |
|
|
|
|
| ρ | 0.128 | 0.463* | −0.008 | −0.281 |
|
P-valuea | - | <0.0001 | - | - |
| uTFF3 (n=199) |
|
|
|
|
| ρ | 0.169 | 0.234 | 0.560* | 0.342 |
|
P-valuea | - | - | <0.0001 | - |
| IHC score
(n=100) |
|
|
|
|
| ρ | 0.563* | −0.657* | 0.813** | - |
|
P-valuea | <0.0001 | <0.0001 | <0.0001 | - |
Correlation of sTFFs and uTFFs with
IHC scores
The correlations between sTFF and uTFF levels and
IHC-determined TFF expression levels in lung cancer tissues were
examined, the results of which are presented in Table V. A statistically significant
correlation between sTFF1-3 levels and IHC scores was demonstrated.
Using Spearman's correlation test, sTFF1 and sTFF3 showed ρ-values
of 0.563 and 0.813 with the IHC scores, respectively (‘substantial’
or ‘high correlation’, respectively; P<0.0001), whereas TFF2 had
a ρ-value of −0.657 (‘substantial inverse correlation’;
P<0.0001). Moreover, analysis using Kruskal-Wallis test followed
by Dunn's test, groups with a higher IHC score generally showed
higher sTFF1 and sTFF3 at statistically significant levels
(P<0.0001; Table VI). However,
a significant inverse association was confirmed for sTFF2. Analysis
of urine data using Spearman's test, demonstrated no correlation
with IHC score (TFF1, ρ=0.197; TFF2, ρ=−0.281; TFF3, ρ=0.342;
Table V).
| Table VI.Association between sTFF levels and
clinicopathological variables. |
Table VI.
Association between sTFF levels and
clinicopathological variables.
|
|
| sTFF1 | sTFF2 | sTFF3 |
|---|
|
|
|
|
|
|
|---|
| Clinicopathological
factors (n=199) | Number of
cases | Mean + SD | P-value | Mean + SD | P-value | Mean + SD | P-value |
|---|
| Age, years |
|
|
|
|
|
|
|
| <70,
n | 95 | 1.351±1.192 | 0.0764 | 4.472±3.058 | 0.0728 | 8.243±5.923 | 0.1932 |
| >70,
n | 104 | 1.479±1.007 |
| 4.859±2.604 |
| 8.817±5.049 |
|
| Sex |
|
|
|
|
|
|
|
|
Male | 128 | 1.396±1.003 | 0.7101 | 4.579±2.570 | 0.738 | 8.959±6.051 | 0.216 |
|
Female | 71 | 1.458±1.259 |
| 4.846±3.258 |
| 7.793±5.419 |
|
| pT factor |
|
|
|
|
|
|
|
|
pTis/T1/T2 | 168 | 1.408±1.108 | 0.928 | 4.801±2.862 | 0.018 | 8.311±4.662 | 0.729 |
|
pT3/T4 | 31 | 1.469±1.060 |
| 3.987±2.582 |
| 9.803±8.662 |
|
| pN factor |
|
|
|
|
|
|
|
|
pN0/1 | 171 | 1.473±1.129 | 0.033 | 4.770±2.912 | 0.2521 | 8.227±4.690 | 0.3174 |
|
pN2 | 28 | 1.082±0.825 |
| 4.087±2.216 |
| 10.215±8.835 |
|
| pStage |
|
|
|
|
|
|
|
| I | 125 | 1.481±1.167 | 0.085 | 4.814±2.933 | 0.093 | 8.419±4.883 | 0.618 |
| II | 41 | 1.492±1.064 |
| 4.145±2.390 |
| 7.870±4.182 |
|
|
IIIa | 33 | 1.086±0.794 |
| 3.971±2.134 |
| 9.850±8.303 |
|
| Histological
type |
|
|
|
|
|
|
|
|
Adenocarcinoma | 142 | 1.448±1.160 | 0.5596 | 4.880±3.007 | 0.154 | 8.644±5.814 | 0.3939 |
|
Squamous cell carcinoma | 45 | 1.418±0.9820 |
| 4.380±2.500 |
| 8.764±4.558 |
|
| Small
cell carcinoma | 4 | 1.241±1.043 |
| 2.996±0.906 |
| 5.809±3.558 |
|
|
Othersa | 8 | 1.004±0.493 |
| 3.683±0.885 |
| 7.251±4.986 |
|
| IHC score | 100 |
|
|
|
|
|
|
| 0 |
| 38.746 | <0.0001 | 63.873 | <0.0001 | 29.460 | <0.0001 |
| 1 |
| 47.000 |
| 67.600 |
| 46.727 |
|
| 2 |
| 56.385 |
| 26.125 |
| 70.250 |
|
| 3 |
| 75.700 |
| 22.000 |
| 77.500 |
|
| 4 |
| 81.125 |
| 11.000 |
| 91.333 |
|
| 6 |
| 98.667 |
| 16.667 |
| 88.889 |
|
Association of sTFFs and uTFFs with
clinicopathological features
Next, sTFF and uTFF levels were compared with
clinicopathological variables (Tables
VI and VII, respectively). In
the pT category, the pTis/1/2 group showed a higher sTFF2 mean
value than the pT3/4 group, at a statistically significant level
(P=0.018). Furthermore, the pN0/1 group had a higher mean sTFF1
value than the pN2 group, at a statistically significant level
(P=0.033). Histologically, although SCC cases had a significantly
higher mean uTFF1 value than AC (P=0.027), AC had a higher mean
level of uTFF2, but not at the level of statistical significance
(P=0.062). No significant difference in TFF levels was demonstrated
for any other factors.
| Table VII.Association between uTFF levels and
clinicopathological variables. |
Table VII.
Association between uTFF levels and
clinicopathological variables.
|
|
| uTFF1 | uTFF2 | uTFF3 |
|---|
|
|
|
|
|
|
|---|
|
Clinicopathological) factors (n=199 | Number of
cases | Mean + SD | P-value | Mean + SD | P-value | Mean + SD | P-value |
|---|
| Age, years |
|
|
|
|
|
|
|
|
<70 | 95 | 1.397±1.696 | 0.620 | 19.522±16.988 | 0.603 | 5.411±5.452 | 0.813 |
|
>70 | 104 | 1.295±1.223 |
| 17.198±10.064 |
| 5.341±4.780 |
|
| Sex |
|
|
|
|
|
|
|
|
Male | 128 | 1.366±1.448 | 0.281 | 16.538±9.463 | 0.126 | 5.454±5.194 | 0.734 |
|
Female | 71 | 1.304±1.505 |
| 21.460±19.023 |
| 5.230±4.956 |
|
| pT factor |
|
|
|
|
|
|
|
|
pTis/T1/T2 | 168 | 1.334±1.500 | 0.760 | 18.647±14.232 | 0.174 | 5.394±5.138 | 0.841 |
|
pT3/T4 | 31 | 1.397±1.279 |
| 16.466±11.366 |
| 5.266±4.960 |
|
| pN factor |
|
|
|
|
|
|
|
|
pN0/1 | 171 | 1.397±1.542 | 0.309 | 18.531±14.202 | 0.623 | 5.389±5.107 | 0.943 |
|
pN2 | 28 | 1.018±0.797 |
| 16.958±11.346 |
| 5.285±5.139 |
|
| pStage |
|
|
|
|
|
|
|
| I | 125 | 1.376±1.240 | 0.399 | 16.355±9.641 | 0.243 | 5.277±4.886 | 0.98 |
| II | 41 | 1.558±1.510 |
| 18.561±21.203 |
| 4.958±3.929 |
|
|
IIIa | 33 | 1.171±1.035 |
| 14.864±8.759 |
| 4.793±4.437 |
|
| Histological
type |
|
|
|
|
|
|
|
|
Adenocarcinoma | 142 | 1.273±1.503 | 0.027 | 19.512±14.974 | 0.062 | 5.483±5.172 | 0.444 |
|
Squamous cell carcinoma | 45 | 1.704±1.467 |
| 16.094±10.861 |
| 5.343±5.158 |
|
| Small
cell carcinoma | 4 | 0.780±0.383 |
| 9.874±5.352 |
| 2.347±1.978 |
|
|
Othersa | 8 | 0.971±0.786 |
| 14.395±4.235 |
| 5.509±4.914 |
|
| IHC score
(n=100) |
|
|
|
|
|
|
|
| 0 |
| 45.169 | - | 56.302 | - | 41.120 | - |
| 1 |
| 65.571 |
| 48.400 |
| 55.727 |
|
| 2 |
| 49.692 |
| 42.563 |
| 57.750 |
|
| 3 |
| 74.000 |
| 44.857 |
| 42.750 |
|
| 4 |
| 54.500 |
| 25.833 |
| 75.333 |
|
| 6 |
| 34.667 |
| 37.000 |
| 67.000 |
|
Discussion
The identification of novel diagnostic markers is
valuable not only because it enables the early detection of
disease, but also as it may allow post-operative or
post-chemotherapeutic monitoring of patients.
The involvement of TFFs in cancer has been
previously described, and their normal biological functions have
been shown to be quite diverse. Aberrant expression of TFFs, in
particular, of TFF1 and TFF3, has been observed in numerous types
of clinical cancer, including those of the breast and the lung
(8,45). Furthermore, higher expression of
TFF1 and/or TFF3 has been reported to be associated with
chemoresistance (46,47), lymph node/distant metastasis, high
Tumor-Node-Metastasis stage and a poor prognosis in colorectal
(13,48), gastric (24) and endometrial cancer (37).
sTFFs have been sporadically reported as cancer
biomarkers in the literature (17,34,36–38,49,50).
In particular, sTFF1 and sTFF3 have been described as predictive
markers for lymph node metastasis and for worse prognosis in
prostatic (38), gastric (39) and colorectal cancer (46,48,51).
Consistently, decreased sTFF3 levels were significantly associated
with positive responses to chemotherapy in both gastric and
colorectal cancer (52).
In lung cancer, sTFF1 has been described as a marker
of AC, and the level of sTFF1 was reported to have normalized
following the removal of tumors in a small sample group, although
these values did not reach levels of significance as a screening
tool for tumors (53). However,
sTFF3 has been reported to be elevated in all histological types of
lung cancer (42). Overall, as
there have not been many reports on the involvement of TFFs in lung
cancer, conclusions are somewhat equivocal. In particular, changes
in sTFF and uTFF levels have not previously been investigated in
precise detail. Therefore, the utility of TFFs in diagnosing lung
cancer is still controversial. In the present study, the utility of
TFFs as serum or urinary biomarkers were evaluated with additional
analyses of the relationship between TFF expression in lung cancer
tissue and clinicopathological factors.
Firstly, all sTFF levels were significantly higher
in patients with lung cancer (P<0.0001), while uTFFs were lower.
In the latter, the results were statistically significant for uTFF1
and 3, but not for uTFF2. Using ROC analysis, TFFs successfully
discriminated patients with lung cancer from healthy individuals
and an analysis of combined sTFFs and uTFFs gave the highest AUC of
0.826. Currently established markers for lung cancer have shown
satisfactorily high AUCs, with carcinoembryonic antigen (CEA)
providing an AUC up to 0.850 in AC (5), CYFRA21-1 and ‘SCC-antigen’ providing
AUCs up to 0.930 and 0.780, respectively in SCC (5), and neuron-specific enolase (NSE) and
pro-gastrin-releasing peptide providing AUCs up to 0.890 and 0.950,
respectively in SmCC (7). However,
the AUCs for these markers evaluated against all histological types
as a whole were far lower. The combination of
CYFRA/CEA/NSE/‘SCC-antigen’ for combined lung cancer cases
demonstrated an AUC of 0.854 compared with non-cancer cases
(6). the AUC obtained in the
present study by combining 5 values from 3 proteins, 2 of which
were from urine, was equivalent to that value regardless of
histological type. Indeed, the screening and diagnostic potential
of sTFF1 + 2 + 3 with uTFF1 + 3 was verified in this sample group,
when assessed as a whole (Table
II).
As another detection tool, low-dose helical CT
(LDCT) is a sensitive screening method and demonstrates high
performance in the detection of pulmonary nodules and could
therefore detect a high proportion of small cancers at an early
stage in baseline screening. For the detection of cancer, the
highest reported sensitivity was 96%, but with the lowest
sensitivity at 49% (54). However,
the highest reported specificity was 95%, but with the lowest
sensitivity at 55% (55) for the
detection of cancer among all pulmonary nodules, including
non-neoplastic lesions. The sensitivity/specificity in the ELISA
system used in the present study was 74.2/80.9%; both values being
in the middle of those previously reported highest and lowest
scores. Moreover, LCDT has a consistently high false-positive rate
(≤98%) in single baseline examination, depending on the entry and
imaging diagnostic criteria (56).
For example, inflammatory scarring, hamartoma and fungal granuloma
are major factors that could contribute to a high false-positive
rate (56,57). This is a major limitation of LDCT as
a method for screening. Accordingly, repeated examinations are
necessary with this method and in diagnoses, baseline examination
must be re-evaluated by further investigation, such as follow-up
with detailed (high resolution, thin section) CT, usually repeated
3–4 times over 2–4 years (54,57).
Furthermore, results of randomized trials have not yet confirmed
that LDCT screening has a measurable effect in decreasing mortality
(56,58). Overall, the ELISA screening method
utilized in the present study is more convenient and thus, has the
potential to be more prognostic at baseline screening than results
reported using LDCT, to date.
In the patients with lung cancer analyzed in the
present study, TFF levels were higher in serum but lower in urine.
It was hypothesized that TFFs may be present in a modified form in
serum, including as homo- or heterodimers, and thus, are not
rapidly excreted into the urine through normal turnover in patients
with lung cancer. In healthy individuals, all TFFs are present in
un-modified form in serum and are rapidly excreted into the urine
through normal turnover. Supporting the aforementioned hypothesis,
all uTFF levels showed ‘substantial’ to ‘high’ correlation with
each other in healthy individuals, i.e., all TFF were coordinately
excreted. However, such a correlation was not found among patients
with lung cancer as a whole (Table
IV).
Secondly, the observation that sTFF2 levels were
higher in the pTis/1/2 group compared with the pT3/4 group and
sTFF1 was higher in the pN0/1 group compared with the pN2 group
suggested that upregulation of TFF1and TFF2 was an early and
transient phenomenon during tumor growth and nodal metastasis in
lung carcinoma. Moreover, patients with SCC showed higher uTFF1
levels, but patients with AC showed higher uTFF2 levels. However,
the significance and the mechanism of such differences depending on
the histological type are unclear.
Thirdly, TFF1, TFF3 and, less intensely, TFF2
demonstrated positive IHC staining in normal bronchial epithelial
cells and bronchial glands in the lung in the present study, as has
been previously described (59,60).
All TFFs were detected in cancer tissues of AC, SCC and SmCC, with
a slightly higher frequency in SCC: i.e., 43.5-52.2% in SCC vs.
34.2-52.1% in AC and none in the other subtypes, except for SmCC in
which both cases expressed TFF2 (IHC score of 2). Although AC, SCC
and a minor fraction of SmCC have been reported to express TFF1
(18,61), the present study was, to the best of
our knowledge, the first report of IHC expression of all TFFs in
all histological types.
Fourthly, in a previous report on breast carcinoma,
TFF1, but not TFF3, was reported to show a positive correlation
between serum concentration and IHC staining (17). sTFF2 was lower in patients with
cancer in that study, however, a statistical analysis could not be
performed due to the absence of TFF2-positive cases as assessed
using IHC (17). However, in the
present study, TFF1 and TFF3 were demonstrated to show a positive
correlation between serum concentrations and IHC score, and a
‘substantial’ inverse correlation for TFF2 by Spearman's test.
These results for TFF1 and TFF3 were also demonstrated to be
statistically significant, ie, the concentration of sTFF1 and sTFF3
was higher in groups having a higher IHC score. There are numerous
possible mechanisms to explain the inverse correlation between high
sTFF2 and low IHC score. Aberrantly overexpressed TFF2 may be
secreted into the bronchial lumen, but not into serum. For example,
in well differentiated breast cancer, polarized TFF3 expression
leads to secretion into the ductal lumen, but not into serum
(27). Alternatively, a major
fraction of elevated sTFF2 may not derive directly from cancer, but
from the mucus-secreting cells of bronchial glands. Lastly, TFF2
may be exhausted in cancer cells after increased secretion into the
serum even if it is aberrantly overexpressed. Collectively, sTFFs
may be regulated at numerous levels in a complex manner, such as
expression in the cells, secretion into the lumen or the serum and
excretion into the urine.
Functionally, TFF1 in the stomach has been described
as being involved in the formation of a protective mucous layer
(62) and stabilization of cell
junctions by binding to MUC2, MUC5AC (8,63) and
gastrokine-2 (GKN2) (64). TFF2
also binds to GKN2 (64) and MUC6
(65), and maintains the inner
layer of the gastric mucus (66).
TFF3 is a constituent of goblet cells in both the small and large
intestine, but not in the stomach, and co-localizes with MUC5B and
MUC8 in bronchial gland mucous cells (10,60),
and with MUC5AC in respiratory goblet cells (60,67).
Therefore, in the lungs, TFFs bind with mucin from the bronchial
gland, in a manner similar to the stomach, and thereby may maintain
cell adhesion and support restitution. In cancer, it is not
surprising that TFFs are secreted from the bronchial glands and
protect the adjacent bronchial mucosa from deleterious damage as a
safe-guard mechanism. Indeed, the induction of mucinous metaplasia
was reported in transgenic mice with high TFF3 expression (68). Therefore, by physical and/or
chemical stimuli, TFF actively serves a role in enhancing the
production of mucin, which contains its binding partners.
Previous studies suggested mutual regulation among
TFFs. TFF2KO mice were reported to have shown
high TFF3 expression in the gastric antrum (69). In a rat model of colitis, TFF1
expression was elevated and TFF3 was decreased in the colon during
the acute phase of disease (70),
whereas the opposite pattern of expression was demonstrated in the
restitution phase (70,71). Hence, a coordinated regulation of
TFF expression to ensure mucosal protection and restitution
depending on the stage of the disease may exist. In the present
study, although sTFF1 and sTFF2 levels showed ‘substantial’ to
‘high’ correlation in patients with lung cancer as a whole or in
each pTN category, concurrent relative suppression, i.e., inverse
correlation, of sTFF3 was not found. Moreover, although the
staining frequencies and intensities of TFF1 and TFF3 were
predominant compared with TFF2, no specific pattern of staining,
such as exact overlapping or reciprocal staining of each TFF, was
observed.
In contrast with other cancer-specific markers, TFFs
are produced not only by cancer cells, but also by non-neoplastic
cells as components of tissue-protective mucin (8) or regulators of inflammation (72). Therefore, although the clinical
utility of circulating and excreting TFFs as cancer biomarkers for
the diagnostic screening of lung cancer may be cautiously
evaluated, increased TFFs levels also reflects epithelial damage.
Regardless of the underlying mechanism, results from the present
study demonstrated that discrimination between patients with lung
cancer and healthy individuals using TFFs was possible, and that
all TFFs assessed provided unique biomarker information that could
contribute to a panel of markers having significant diagnostic
potential. However, a limitation of the present study was the short
period of patient follow-up, and thus the long-term prognostic
power of TFFs could not be precisely evaluated.
Based on the results of the present study, it is
proposed that this combined serum/urine assay of TFFs represents a
novel, easily monitored tool for accurately diagnosing lung cancer,
with TFF1 and TFF2 levels in particular showing good correlation
with clinicopathological factors. This assay may permit
larger-scale cancer screening, particularly in the early stages of
disease. Considering the limitations of the present work, further
studies to clarify how sTFF and uTFF levels change after surgery
and to clarify any correlation with relapse and metastases, as well
as detailed analysis in relation to smoking history are required.
If these efforts are successful, this s/uTFFs analysis may further
contribute to cancer management and provide a tool to monitor the
course of the disease after surgery and to evaluate the effects of
adjuvant therapy.
Supplementary Material
Supporting Data
Acknowledgements
The authors would like to thank Ms Emi Kimura
(Department of Pathology, International University of Health and
Welfare Hospital, Nasushiobara, Japan), for their assistance with
manuscript preparation.
Funding
This work was partially supported by the Japan Society for the
Promotion of Science (grant no. 17K08727, 20K07378, 16H06277,
22H04923 and 23501295), Grants-in-Aid for Scientific Research for
Priority Areas of Cancer (grant no. 17015018), Innovative Areas
from the Ministry of Education, Culture, Sports, Science and
Technology, Japan (grant nos. 221S0001, Ca180066, Ca190058,
Ca200066 and Ca210033), the Smoking Research Foundation and the
Princess Takamatsu Cancer Research Fund.
Availability of data and materials
The datasets used and/or analyzed during the current
study could be available from the corresponding author on
reasonable request.
Authors' contributions
YD and SN designed the study. KM and YD performed
immunohistochemical staining and evaluated the results. KM, YI, MF
and TY performed sample preparation and ELISA and contributed to
the quantification. TK, HT, YO and SN collected the clinical
samples. KM, TK and HT statistically analyzed the data and
undertook its interpretation. YI, MF and YO established the ELISA
experimental system and provided technical support. KM, YD, TK, HT
and SN drafted and completed the manuscript. KM, YD and TK confirm
the authenticity of all the raw data. All authors read and approved
the final version of the manuscript.
Ethics approval and consent to
participate
This study protocol adhered to the principles of the
Declaration of Helsinki and was approved by the Institutional
Ethics Committee in Saitama Medical Center, Jichi Medial University
(Saitama, Japan; approval no. S17-035, S20-137), the University of
Tokyo (Tokyo, Japan; approval no. 11414-[1,2]) and Kyoto
Prefectural University of Medicine (Kyoto, Japan; approval no.
ERB-C-1239-1,2). Written informed consent was obtained from all
participants.
Patient consent for publication
Not applicable.
Competing interests
The authors declare that they have no competing
interests.
Glossary
Abbreviations
Abbreviations:
|
TFF
|
trefoil factor
|
|
AC
|
adenocarcinoma
|
|
SCC
|
squamous cell carcinoma
|
|
LCC
|
large cell carcinoma
|
|
SmCC
|
small cell carcinoma
|
References
|
1
|
Siegel RL, Miller KD and Jemal A: Cancer
statistics, 2019. CA Cancer J Clin. 69:7–34. 2019. View Article : Google Scholar : PubMed/NCBI
|
|
2
|
Sharma SV, Bell DW, Settleman J and Haber
DA: Epidermal growth factor receptor mutations in lung cancer. Nat
Rev Cancer. 7:169–181. 2007. View
Article : Google Scholar : PubMed/NCBI
|
|
3
|
Yu HA, Arcila ME, Rekhtman N, Sima CS,
Zakowski MF, Pao W, Kris MG, Miller VA, Ladanyi M and Riely GJ:
Analysis of tumor specimens at the time of acquired resistance to
EGFR-TKI therapy in 155 patients with EGFR-mutant lung cancers.
Clin Cancer Res. 19:2240–2247. 2013. View Article : Google Scholar : PubMed/NCBI
|
|
4
|
Siegel RL, Miller KD, Fuchs HE and Jemal
A: Cancer statistics, 2022. CA Cancer J Clin. 72:7–33. 2022.
View Article : Google Scholar : PubMed/NCBI
|
|
5
|
Chen ZQ, Huang LS and Zhu B: Assessment of
seven clinical tumor markers in diagnosis of non-small-cell lung
cancer. Dis Markers. 2018:98451232018. View Article : Google Scholar : PubMed/NCBI
|
|
6
|
Wen Z, Huang Y, Ling Z, Chen J, Wei X, Su
R, Tang Z, Wen Z, Deng Y and Hu Z: Lack of efficacy of combined
carbohydrate antigen markers for lung cancer diagnosis. Dis
Markers. 2020:47167932020. View Article : Google Scholar : PubMed/NCBI
|
|
7
|
Lamy PJ, Grenier J, Kramar A and Pujol JL:
Pro-gastrin-releasing peptide, neuron specific enolase and
chromogranin A as serum markers of small cell lung cancer. Lung
Cancer. 29:197–203. 2000. View Article : Google Scholar : PubMed/NCBI
|
|
8
|
Kjellev S: The trefoil factor family-small
peptides with multiple functionalities. Cell Mol Life Sci.
66:1350–1369. 2009. View Article : Google Scholar
|
|
9
|
Thim L: Trefoil peptides: From structure
to function. Cell Mol Life Sci. 53:888–903. 1997. View Article : Google Scholar
|
|
10
|
Xiao P, Ling H, Lan G, Liu J, Hu H and
Yang R: Trefoil factors: Gastrointestinal-specific proteins
associated with gastric cancer. Clin Chim Acta. 450:127–134. 2015.
View Article : Google Scholar
|
|
11
|
Arumugam T, Brandt W, Ramachandran V,
Moore TT, Wang H, May FE, Westley BR, Hwang RF and Logsdon CD:
Trefoil factor 1 stimulates both pancreatic cancer and stellate
cells and increases metastasis. Pancreas. 40:815–822. 2011.
View Article : Google Scholar : PubMed/NCBI
|
|
12
|
Rodrigues S, Rodrigue CM, Attoub S, Flejou
JF, Bruyneel E, Bracke M, Emami S and Gespach C: Induction of the
adenoma-carcinoma progression and Cdc25A-B phosphatases by the
trefoil factor TFF1 in human colon epithelial cells. Oncogene.
25:6628–6636. 2006. View Article : Google Scholar : PubMed/NCBI
|
|
13
|
Yusufu A, Shayimu P, Tuerdi R, Fang C,
Wang F and Wang H: TFF3 and TFF1 expression levels are elevated in
colorectal cancer and promote the malignant behavior of colon
cancer by activating the EMT process. Int J Oncol. 55:789–804.
2019.
|
|
14
|
Kannan N, Kang J, Kong X, Tang J, Perry
JK, Mohankumar KM, Miller LD, Liu ET, Mertani HC, Zhu T, et al:
Trefoil factor 3 is oncogenic and mediates anti-estrogen resistance
in human mammary carcinoma. Neoplasia. 12:1041–1053. 2010.
View Article : Google Scholar
|
|
15
|
Pandey V, Wu ZS, Zhang M, Li R, Zhang J,
Zhu T and Lobie PE: Trefoil factor 3 promotes metastatic seeding
and predicts poor survival outcome of patients with mammary
carcinoma. Breast Cancer Res. 16:4292014. View Article : Google Scholar : PubMed/NCBI
|
|
16
|
Taupin DR, Kinoshita K and Podolsky DK:
Intestinal trefoil factor confers colonic epithelial resistance to
apoptosis. Proc Natl Acad Sci USA. 97:799–804. 2000. View Article : Google Scholar : PubMed/NCBI
|
|
17
|
Ishibashi Y, Ohtsu H, Ikemura M, Kikuchi
Y, Niwa T, Nishioka K, Uchida Y, Miura H, Aikou S, Gunji T, et al:
Serum TFF1 and TFF3 but not TFF2 are higher in women with breast
cancer than in women without breast cancer. Sci Rep. 7:48462017.
View Article : Google Scholar : PubMed/NCBI
|
|
18
|
Ruibal A, Nunez MI, del Rio MC, Garcia
Diez S, Rodriguez J and Alvarez De Linera JA: Cytosolic pS2 levels
in 154 non-small-cell lung carcinomas. Correlation with other
clinical and biological parameters. Rev Esp Med Nucl. 21:109–114.
2002.(In Spanish). View Article : Google Scholar
|
|
19
|
Amelung JT, Buhrens R, Beshay M and
Reymond MA: Key genes in lung cancer translational research: A
meta-analysis. Pathobiology. 77:53–63. 2010. View Article : Google Scholar : PubMed/NCBI
|
|
20
|
Ohshio G, Suwa H, Kawaguchi Y, Imamura M,
Yamaoka Y, Yamabe H, Matsumoto M, Yoshioka H, Hashimoto Y and
Takeda H: Differential expression of human spasmolytic polypeptide
(trefoil factor family-2) in pancreatic carcinomas, ampullary
carcinomas, and mucin-producing tumors of the pancreas. Dig Dis
Sci. 45:659–664. 2000. View Article : Google Scholar
|
|
21
|
John R, El-Rouby NM, Tomasetto C, Rio MC
and Karam SM: Expression of TFF3 during multistep colon
carcinogenesis. Histol Histopathol. 22:743–751. 2007.
|
|
22
|
Dhar DK, Wang TC, Maruyama R, Udagawa J,
Kubota H, Fuji T, Tachibana M, Ono T, Otani H and Nagasue N:
Expression of cytoplasmic TFF2 is a marker of tumor metastasis and
negative prognostic factor in gastric cancer. Lab Invest.
83:1343–1352. 2003. View Article : Google Scholar
|
|
23
|
Dhar DK, Wang TC, Tabara H, Tonomoto Y,
Maruyama R, Tachibana M, Kubota H and Nagasue N: Expression of
trefoil factor family members correlates with patient prognosis and
neoangiogenesis. Clin Cancer Res. 11:6472–6478. 2005. View Article : Google Scholar : PubMed/NCBI
|
|
24
|
Yamachika T, Werther JL, Bodian C,
Babyatsky M, Tatematsu M, Yamamura Y, Chen A and Itzkowitz S:
Intestinal trefoil factor: A marker of poor prognosis in gastric
carcinoma. Clin Cancer Res. 8:1092–1099. 2002.PubMed/NCBI
|
|
25
|
Yang Y, Lin Z, Lin Q, Bei W and Guo J:
Pathological and therapeutic roles of bioactive peptide trefoil
factor 3 in diverse diseases: Recent progress and perspective. Cell
Death Dis. 13:622022. View Article : Google Scholar : PubMed/NCBI
|
|
26
|
Babyatsky M, Lin J, Yio X, Chen A, Zhang
JY, Zheng Y, Twyman C, Bao X, Schwartz M, Thung S, et al: Trefoil
factor-3 expression in human colon cancer liver metastasis. Clin
Exp Metastasis. 26:143–151. 2009. View Article : Google Scholar : PubMed/NCBI
|
|
27
|
Ahmed ARH, Griffiths AB, Tilby MT, Westley
BR and May FEB: TFF3 is a normal breast epithelial protein and is
associated with differentiated phenotype in early breast cancer but
predisposes to invasion and metastasis in advanced disease. Am J
Pathol. 180:904–916. 2012. View Article : Google Scholar
|
|
28
|
Buache E, Etique N, Alpy F, Stoll I,
Muckensturm M, Reina-San-Martin B, Chenard MP, Tomasetto C and Rio
MC: Deficiency in trefoil factor 1 (TFF1) increases tumorigenicity
of human breast cancer cells and mammary tumor development in
TFF1-knockout mice. Oncogene. 30:3261–3273. 2011. View Article : Google Scholar : PubMed/NCBI
|
|
29
|
Bossenmeyer-Pourie C, Kannan R, Ribieras
S, Wendling C, Stoll I, Thim L, Tomasetto C and Rio MC: The trefoil
factor 1 participates in gastrointestinal cell differentiation by
delaying G1-S phase transition and reducing apoptosis. J Cell Biol.
157:761–770. 2002. View Article : Google Scholar
|
|
30
|
Minegishi K, Dobashi Y, Tsubochi H,
Hagiwara K, Ishibashi Y, Nomura S, Nakamura R, Ohmoto Y and Endo S:
TFF-1 functions to suppress multiple phenotypes associated with
lung cancer progression. Onco Targets Ther. 14:4761–4777. 2021.
View Article : Google Scholar : PubMed/NCBI
|
|
31
|
Thompson AM, Elton RA, Hawkins RA, Chetty
U and Steel CM: PS2 mRNA expression adds prognostic information to
node status for 6-year survival in breast cancer. Br J Cancer.
77:492–496. 1998. View Article : Google Scholar : PubMed/NCBI
|
|
32
|
Uchino H, Kataoka H, Itoh H, Hamasuna R
and Koono M: Overexpression of intestinal trefoil factor in human
colon carcinoma cells reduces cellular growth in vitro and in vivo.
Gastroenterology. 118:60–69. 2000. View Article : Google Scholar : PubMed/NCBI
|
|
33
|
Espinoza I, Agarwal S, Reddy A, Shenoy V,
Subramony C, Sakiyama M, Fair L, Poosarla T, Zhou X, Shannon Orr W,
et al: Expression of trefoil factor 3 is decreased in colorectal
cancer. Oncol Rep. 45:254–264. 2021. View Article : Google Scholar : PubMed/NCBI
|
|
34
|
Huang Z, Zhang X, Lu H, Wu L, Wang D,
Zhang Q and Ding H: Serum trefoil factor 3 is a promising
non-invasive biomarker for gastric cancer screening: A monocentric
cohort study in China. BMC Gastroenterol. 14:742014. View Article : Google Scholar
|
|
35
|
Aikou S, Ohmoto Y, Gunji T, Matsuhashi N,
Ohtsu H, Miura H, Kubota K, Yamagata Y, Seto Y, Nakajima A, et al:
Tests for serum levels of trefoil factor family proteins can
improve gastric cancer screening. Gastroenterology. 141:837–845.
e1–7. 2011. View Article : Google Scholar : PubMed/NCBI
|
|
36
|
Vocka M, Langer D, Petrtyl J, Vockova P,
Hanus T, Kalousova M, Zima T and Petruzelka L: Trefoil factor
family (TFF) proteins as potential serum biomarkers in patients
with metastatic colorectal cancer. Neoplasma. 62:470–477. 2015.
View Article : Google Scholar
|
|
37
|
Bignotti E, Ravaggi A, Tassi RA, Calza S,
Rossi E, Falchetti M, Romani C, Bandiera E, Odicino FE, Pecorelli S
and Santin AD: Trefoil factor 3: A novel serum marker identified by
gene expression profiling in high-grade endometrial carcinomas. Br
J Cancer. 99:768–773. 2008. View Article : Google Scholar : PubMed/NCBI
|
|
38
|
Vestergaard EM, Borre M, Poulsen SS, Nexo
E and Torring N: Plasma levels of trefoil factors are increased in
patients with advanced prostate cancer. Clin Cancer Res. 12((3 Pt
1)): 807–812. 2006. View Article : Google Scholar : PubMed/NCBI
|
|
39
|
Im S, Yoo C, Jung JH, Choi HJ, Yoo J and
Kang CS: Reduced expression of TFF1 and increased expression of
TFF3 in gastric cancer: Correlation with clinicopathological
parameters and prognosis. Int J Med Sci. 10:133–140. 2013.
View Article : Google Scholar
|
|
40
|
Casado E, Garcia VM, Sanchez JJ, Gomez Del
Pulgar MT, Feliu J, Maurel J, Castelo B, Moreno Rubio J, Lopez RA,
Garcia-Cabezas MA, et al: Upregulation of trefoil factor 3 (TFF3)
after rectal cancer chemoradiotherapy is an adverse prognostic
factor and a potential therapeutic target. Int J Radiat Oncol Biol
Phys. 84:1151–1158. 2012. View Article : Google Scholar : PubMed/NCBI
|
|
41
|
Li Q, Wang K, Su C and Fang J: Serum
Trefoil Factor 3 as a protein biomarker for the diagnosis of
colorectal cancer. Technol Cancer Res Treat. 16:440–445. 2017.
View Article : Google Scholar
|
|
42
|
Qu Y, Yang Y, Ma D and Xiao W: Increased
trefoil factor 3 levels in the serum of patients with three. Oncol
Rep. 27:1277–1283. 2012. View Article : Google Scholar : PubMed/NCBI
|
|
43
|
Amin MB, Greene FL, Edge SB, Compton CC,
Gershenwald JE, Brookland RK, Meyer L, Gress DM, Byrd DR and
Winchester DP: The Eighth Edition AJCC Cancer Staging Manual:
Continuing to build a bridge from a population-based to a more
‘personalized’ approach to cancer staging. CA Cancer J Clin.
67:93–99. 2017. View Article : Google Scholar : PubMed/NCBI
|
|
44
|
Dobashi Y, Tsubochi H, Matsubara H, Inoue
J, Inazawa J, Endo S and Ooi A: Diverse involvement of isoforms and
gene aberrations of Akt in human lung carcinomas. Cancer Sci.
106:772–781. 2015. View Article : Google Scholar
|
|
45
|
Ribieras S, Tomasetto C and Rio MC: The
pS2/TFF1 trefoil factor, from basic research to clinical
applications. Biochim Biophys Acta. 1378:F61–F77. 1998.
|
|
46
|
Xue H, Lu B, Zhang J, Wu M, Huang Q, Wu Q,
Sheng H, Wu D, Hu J and Lai M: Identification of serum biomarkers
for colorectal cancer metastasis using a differential secretome
approach. J Proteome Res. 9:545–555. 2010. View Article : Google Scholar : PubMed/NCBI
|
|
47
|
Chen RM, Chiou YS, Chong QY, Poh HM, Tan
TZ, Zhang MY, Ma L, Zhu T, Pandey V, Basappa, Kumar AP and Lobie
PE: Pharmacological Inhibition of TFF3 Enhances Sensitivity of CMS4
Colorectal Carcinoma to 5-Fluorouracil through Inhibition of p44/42
MAPK. Int J Mol Sci. 20:62152019. View Article : Google Scholar
|
|
48
|
Yusup A, Huji B, Fang C, Wang F, Dadihan
T, Wang HJ and Upur H: Expression of trefoil factors and TWIST1 in
colorectal cancer and their correlation with metastatic potential
and prognosis. World J Gastroenterol. 23:110–120. 2017. View Article : Google Scholar
|
|
49
|
Xie H, Guo JH, An WM, Tian ST, Yu HP, Yang
XL, Wang HM and Guo Z: Diagnostic value evaluation of trefoil
factors family 3 for the early detection of colorectal cancer.
World J Gastroenterol. 23:2159–2167. 2017. View Article : Google Scholar
|
|
50
|
Kaise M, Miwa J, Tashiro J, Ohmoto Y,
Morimoto S, Kato M, Urashima M, Ikegami M and Tajiri H: The
combination of serum trefoil factor 3 and pepsinogen testing is a
valid non-endoscopic biomarker for predicting the presence of
gastric cancer: A new marker for gastric cancer risk. J
Gastroenterol. 46:736–745. 2011. View Article : Google Scholar
|
|
51
|
Huang YG, Li YF, Wang LP and Zhang Y:
Aberrant expression of trefoil factor 3 is associated with
colorectal carcinoma metastasis. J Cancer Res Ther. 9:376–380.
2013. View Article : Google Scholar : PubMed/NCBI
|
|
52
|
Xiao L, Liu YP, Xiao CX, Ren JL and Guleng
B: Serum TFF3 may be a pharamcodynamic marker of responses to
chemotherapy in gastrointestinal cancers. BMC Clin Pathol.
14:262014. View Article : Google Scholar
|
|
53
|
Higashiyama M, Doi O, Kodama K, Yokuchi H,
Inaji H and Tateishi R: Estimation of serum level of pS2 protein in
patients with lung adenocarcinoma. Anticancer Res. 16:2351–2355.
1996.PubMed/NCBI
|
|
54
|
Swensen SJ, Jett JR, Hartman TE, Midthun
DE, Sloan JA, Sykes AM, Aughenbaugh GL and Clemens MA: Lung cancer
screening with CT: Mayo Clinic experience. Radiology. 226:756–761.
2003. View Article : Google Scholar : PubMed/NCBI
|
|
55
|
Sone S, Li F, Yang ZG, Honda T, Maruyama
Y, Takashima S, Hasegawa M, Kawakami S, Kubo K, Haniuda M and
Yamanda T: Results of three-year mass screening programme for lung
cancer using mobile low-dose spiral computed tomography scanner. Br
J Cancer. 84:25–32. 2001. View Article : Google Scholar : PubMed/NCBI
|
|
56
|
Swensen SJ, Jett JR, Sloan JA, Midthun DE,
Hartman TE, Sykes AM, Aughenbaugh GL, Zink FE, Hillman SL, Noetzel
GR, et al: Screening for lung cancer with low-dose spiral computed
tomography. Am J Respir Crit Care Med. 165:508–513. 2002.
View Article : Google Scholar : PubMed/NCBI
|
|
57
|
Manser RL, Irving LB, de Campo MP,
Abramson MJ, Stone CA, Pedersen KE, Elwood M and Campbell DA:
Overview of observational studies of low-dose helical computed
tomography screening for lung cancer. Respirology. 10:97–104. 2005.
View Article : Google Scholar : PubMed/NCBI
|
|
58
|
Pastorino U: Lung cancer screening. Br J
Cancer. 102:1681–1686. 2010. View Article : Google Scholar : PubMed/NCBI
|
|
59
|
dos Santos Silva E, Ulrich M, Doring G,
Botzenhart K and Gott P: Trefoil factor family domain peptides in
the human respiratory tract. J Pathol. 190:133–142. 2000.
View Article : Google Scholar
|
|
60
|
Wiede A, Jagla W, Welte T, Kohnlein T,
Busk H and Hoffmann W: Localization of TFF3, a new mucus-associated
peptide of the human respiratory tract. Am J Respir Crit Care Med.
159((4 Pt 1)): 1330–1335. 1999. View Article : Google Scholar : PubMed/NCBI
|
|
61
|
Wang DG, Johnston CF, Liu WH, Sloan JM and
Buchanan KD: Expression of a breast-cancer-associated protein (pS2)
in human neuro-endocrine tumours. Int J Cancer. 74:270–274. 1997.
View Article : Google Scholar : PubMed/NCBI
|
|
62
|
Ruchaud-Sparagano MH, Westley BR and May
FE: The trefoil protein TFF1 is bound to MUC5AC in human gastric
mucosa. Cell Mol Life Sci. 61:1946–1954. 2004. View Article : Google Scholar
|
|
63
|
Otto WR and Thim L: Trefoil factor
family-interacting proteins. Cell Mol Life Sci. 62:2939–2946. 2005.
View Article : Google Scholar
|
|
64
|
Kouznetsova I, Laubinger W, Kalbacher H,
Kalinski T, Meyer F, Roessner A and Hoffmann W: Biosynthesis of
gastrokine-2 in the human gastric mucosa: Restricted spatial
expression along the antral gland axis and differential interaction
with TFF1, TFF2 and mucins. Cell Physiol Biochem. 20:899–908. 2007.
View Article : Google Scholar : PubMed/NCBI
|
|
65
|
Sturmer R, Muller S, Hanisch FG and
Hoffmann W: Porcine gastric TFF2 is a mucus constituent and differs
from pancreatic TFF2. Cell Physiol Biochem. 33:895–904. 2014.
View Article : Google Scholar : PubMed/NCBI
|
|
66
|
Hoffmann W: Trefoil factor family (TFF)
peptides and their diverse molecular functions in mucus barrier
protection and more: Changing the paradigm. Int J Mol Sci.
21:45352020. View Article : Google Scholar
|
|
67
|
Koh MJ, Shin DH, Lee SJ, Hwang CS, Lee HJ,
Kim A, Park WY, Lee JH, Choi KU, Kim JY, et al: Gastric-type gene
expression and phenotype in non-terminal respiratory unit type
adenocarcinoma of the lung with invasive mucinous adenocarcinoma
morphology. Histopathology. 76:898–905. 2020. View Article : Google Scholar : PubMed/NCBI
|
|
68
|
Ge H, Gardner J, Wu X, Rulifson I, Wang J,
Xiong Y, Ye J, Belouski E, Cao P, Tang J, et al: Trefoil Factor 3
(TFF3) is regulated by food intake, improves glucose tolerance and
induces mucinous metaplasia. PLoS One. 10:e01269242015. View Article : Google Scholar : PubMed/NCBI
|
|
69
|
Baus-Loncar M, Schmid J, Lalani el-N,
Rosewell I, Goodlad RA, Stamp GW, Blin N and Kayademir T: Trefoil
factor 2 (TFF2) deficiency in murine digestive tract influences the
immune system. Cell Physiol Biochem. 16:31–42. 2005. View Article : Google Scholar : PubMed/NCBI
|
|
70
|
Itoh H, Tomita M, Uchino H, Kobayashi T,
Kataoka H, Sekiya R and Nawa Y: cDNA cloning of rat pS2 peptide and
expression of trefoil peptides in acetic acid-induced colitis.
Biochem J. 318((Pt 3)): 939–944. 1996. View Article : Google Scholar : PubMed/NCBI
|
|
71
|
Xian CJ, Howarth GS, Mardell CE, Cool JC,
Familari M, Read LC and Giraud AS: Temporal changes in TFF3
expression and jejunal morphology during methotrexate-induced
damage and repair. Am J Physiol. 277:G785–G795. 1999.
|
|
72
|
Hoffmann W: Trefoil factor family (TFF)
peptides and their links to inflammation: A Re-evaluation and new
medical perspectives. Int J Mol Sci. 22:49092021. View Article : Google Scholar
|