Introduction
Mucinous colorectal adenocarcinoma (MCAC) is defined
as a histologic subtype characterized by the presence of
extracellular mucin >50% of tumor volume and constitutes 10–20%
of all colorectal carcinomas (CRCs) (1). MCAC has specific clinicopathological
features including larger tumor size, poor differentiation, is
commonly located in proximal colon, associated with peritoneal
infiltration and synchronous metastases (2–4).
Molecularly, MCAC is more likely to have aberrations in the MAPK
[Rat Sarcoma (RAS) and v-RAF Murine Sarcoma Viral Oncogene Homolog
B1 (BRAF)] and Phosphatidylinositol-4,5-Bisphosphate-3-Kinase
Catalytic Subunit Alpha (PIK3CA) pathways and associated with
increased microsatellite instability (MSI) and CpG island
methylator phenotype-high (CIMP-H), and less likely to have p53
mutations when compared with non-MCAC (5–7).
Different clinicopathological and molecular features
of MCAC are associated with poor prognosis in metastatic setting
(8,9). Various hypotheses have been claimed
about the poor prognosis of MCAC patients and mostly emphasized
causes were metastasis pattern, tumor sidedness and MSI status
(4,10,11).
In a recent study, primary tumor was mostly located in proximal
colon and had RAS mutation (12).
On the other hand, proximal location and RAS mutation are
characteristics that are well known to be associated with poor
prognosis in metastatic CRC (mCRC) (13,14).
It is an important question whether the mucinous tumor that is
located in the left colon and has wild-type RAS is associated with
poor prognosis or not. Additionally, almost in all recent studies
heterogenous patient groups are included. Therefore, it would be
useful to evaluate mucinous histology in a relatively homogeneous
patient group, independently of poor prognostic features such as
proximal location and RAS mutation.
Treatment resistance is another issue that remains
unclear in MCAC. The number of studies evaluating the survival
outcomes in terms of backbone chemotherapy (CT) regimens in MCAC
patients is limited (10,15,16).
Previously, a few studies emphasized the predictive value of
mucinous histology particularly for biological agents (17–19).
However, in these studies since primary tumors were mostly located
in the proximal colon, bevacizumab was used as the standard first
line therapy.
In the present study, it was aimed to clarify
whether mucinous histology has prognostic and/or predictive role in
mCRC patients treated with standard first-line therapy included
anti- Epidermal Growth Factor Receptor (EGFR) agents, when primary
tumor has wild-type RAS and located in left-side colon. In
addition, it was aimed to investigate whether the backbone CT
regimen made a difference in terms of survival outcomes in MCAC and
non-MCAC patients.
Materials and methods
Patient population
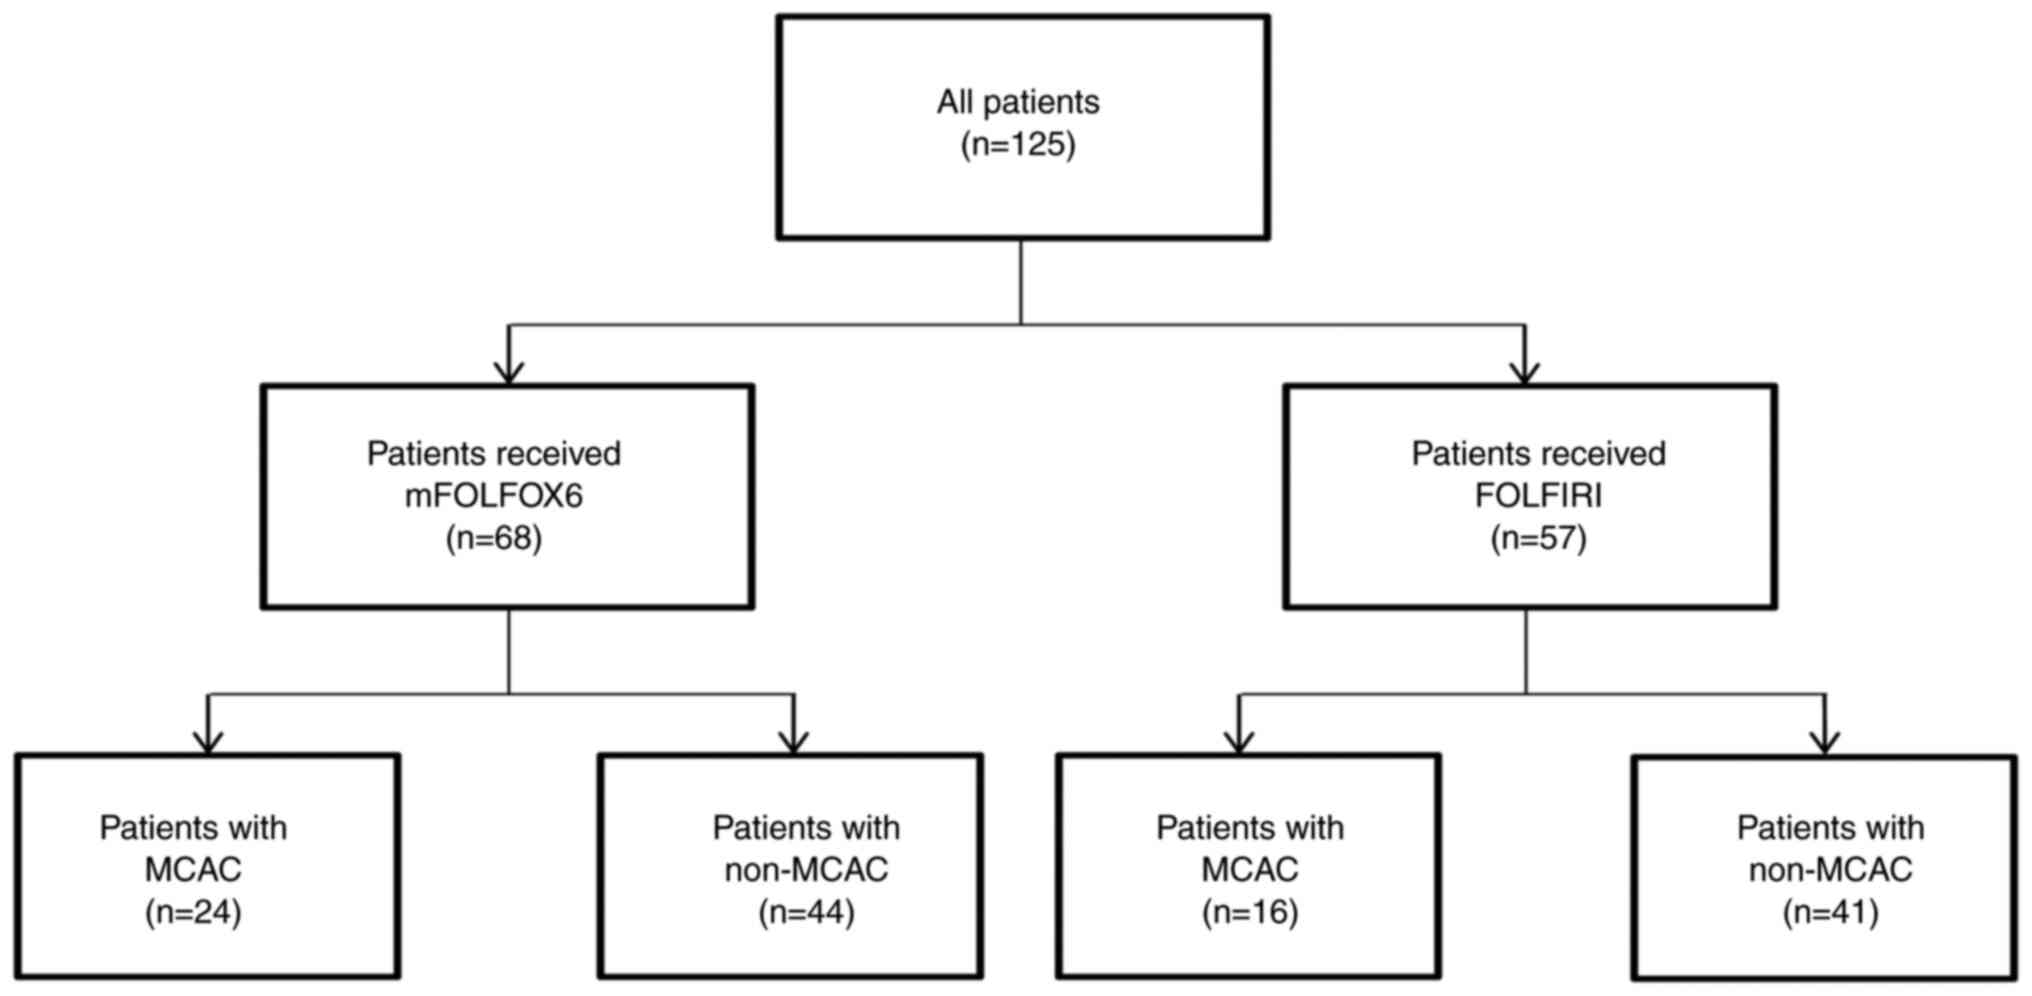
A total of 125 patients with histologically proven
mCRC who were followed up in the medical oncology department of
four institutions between 2012 and 2020 were evaluated
retrospectively. Inclusion criteria were as follows: i) Patients
with histologically confirmed mCRC in the pathology department of
involved institutes; ii) Who had stage 4 [according to AJCC
Tumor-Node-Metastasis (TNM) Staging System], left-sided (splenic
flexure, descending colon, sigmoid colon, and rectum), measurable
disease, and Kirsten Rat Sarcoma/Neuroblastoma Rat Sarcoma
(KRAS/NRAS) wild-type tumor; iii) Who received anti-EGFR containing
regimens as first-line therapy; iv) Who underwent palliative or
curative resection of primary tumor in order to accurately evaluate
the mucinous histology percentage. The histologic examinations were
performed by pathologists with more than five years of working
experience in our centers. Patients with secondary malignancy were
excluded. Data were retrospectively reviewed from patients' files.
Mucinous histology was assessed as per standardized protocols
according to international guidelines (20). The present study protocol was
reviewed and approved (approval no. 09.2021.490) by Local Research
Ethics Committee of Marmara University School of Medicine
(Istanbul, Turkey).
Treatment protocols
Modified FOLFOX6 (mFOLFOX6) and FOLFIRI were used as
backbone CT regimens. mFOLFOX6 was applied as follows: Oxaliplatin
(oxa) 85 mg/m2 on day 1, leucovorin 400 mg/m2
on day 1 and 5-fluorouracil (FU) 400 mg/m2 bolus on day
1, followed by continuous infusion of 2,400 mg/m2 over
48 h, repeated every 2 weeks. FOLFIRI was applied as follows:
Irinotecan (iri) 180 mg/m2 on day 1, leucovorin 400
mg/m2 on day 1 and 5-FU 400 mg/m2 bolus on
day 1, followed by continuous infusion of 2,400 mg/m2
over 48 h, repeated every 2 weeks. Cetuximab (500 mg/m2)
or panitumumab (6 mg/kg) were administered on day 1 and was
repeated every 2 weeks.
Patients who achieved disease control after
12-cycles of anti-EGFR and CT combination were continued with
maintenance therapy (consisted of anti-EGFR agent, 5-FU 400
mg/m2 bolus, leucovorin 400 mg/m2, 5-FU 2,400
mg/m2 infusion over 48 h on day 1, which was repeated
every two weeks) until disease progression or unacceptable
toxicity.
Response assessment
Response assessment was performed within 10 to 15
days following the initial sixth administration and every six
cycles of the 14-day regimens by conventional cross-sectional
imaging. Treatment Response was assessed with using Response
Evaluation Criteria in Solid Tumors (RECIST) Version 1.1 in
radiological imaging (21).
Response criteria for targeted lesions according to
RECIST 1.1 were defined as follows; Complete Response (CR):
Disappearance of all targeted lesions and reduction of all
pathological lymph nodes' axis to <10 mm, Partial Response (PR):
≥30% decrease in sum of the longest diameters (SLD) from baseline,
Stable Disease (SD): Neither PR nor Progressive Disease (PD) with
the Nadir as reference point, PD: ≥20% increase in SLD from Nadir
with an absolute sum of diameter increase ≥5 mm. Or appearance of
one or more new lesions. Response criteria for non-targeted lesions
according to RECIST 1.1 were defined as follows; CR: Disappearance
of all targeted lesions and normalization of tumor marker levels,
PR: No progression, SD: Persistence of one or more non-target
lesions and/or continuation to be above normal of tumor markers,
PD: Unequivocally progression in lesion size.
Progression-free survival (PFS) was defined as the
time interval in months between start of first line therapy and
disease progression, death or last visit if the patient was still
on treatment. Overall survival (OS) was characterized as the time
interval in months between the start of first line therapy and
death or last visit if the patient was still alive.
Study design
Study groups were stratified as MCAC and non-MCAC
patients. MCAC was defined as tumors containing >50%
extracellular mucin, and non-MCAC was defined as tumors containing
no mucin component. Survival analyses were performed firstly
regardless of treatment options and then performed as separating
according to backbone CT regimens. The flow chart of the study
population is shown in Fig. 1.
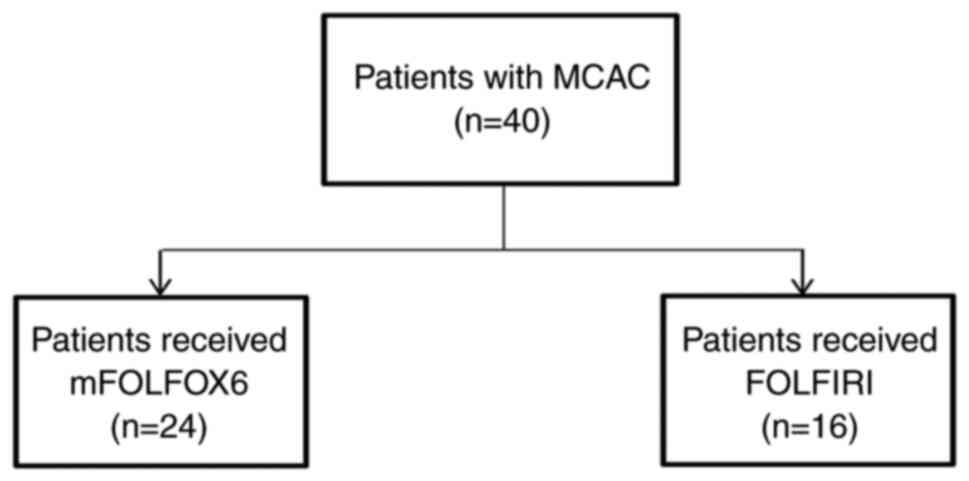
Furthermore, additional survival analyses were performed for the
MCAC patients considering backbone CT regimens. Flow chart of MCAC
patients according to CT regimens is presented in Fig. 2.
Statistical analysis
Descriptive data were recorded as frequencies and
percentages. Continuous variables were presented as median values
with interquartile ranges (IQRs). Chi-square test was used to
compare categorical variables. Survival was estimated with
Kaplan-Meier method and log-rank test. Cox proportional models were
conducted to select factors affecting survival significantly or
with a trend toward significance (P<0.25) in univariate analyses
and to determine independent prognostic indicators in multivariate
analyses using a backward stepwise method. Confidence interval (CI)
was accepted as 95% and P<0.05 was considered to indicate a
statistically significant difference. All statistical analyses were
performed using SPSS version 22.0 (IBM Corp.).
Results
Baseline characteristics and treatments of 125
patients (78 males and 47 females) with a median age of 60 years
(IQR, 52–68) are summarized in Table
I. A total of 40 patients (32.0%) had MCAC and 85 (68.0%)
patients had non-MCAC. Among the entire study population, MCAC and
non-MCAC patients were similar in age, sex, Eastern Cooperative
Oncology Group-Performance Status (ECOG-PS), tumor differentiation,
primary tumor location, number of metastatic sites, BRAF mutation
and mismatch repair (MMR) status (P>0.05 for all). While de
novo metastasis and liver metastasis were more common in
non-MCAC (P<0.001 for both), peritoneal carcinomatosis was more
common in MCAC (P=0.02). All patients received oxa-based or
iri-based CT and anti-EGFR agent in first line setting. Baseline
characteristics of patients according to backbone CT regimen are
shown in Table II. In both
backbone CT groups, MCAC and non-MCAC patients were similar in
terms of age, sex, ECOG-PS, tumor differentiation and number of
metastatic sites (P>0.05 for all). In the mFOLFOX6 group; de
novo metastasis, rectum location and liver metastasis were more
frequent in non-MCAC patients (P<0.001, P=0.01 and P=0.001,
respectively). The FOLFIRI group was relatively more homogeneous
and only metastasis pattern was different between non-MCAC and MCAC
patients. Additionally, among MCAC patients who received FOLFIRI,
there were no patients with BRAF mutation or MSI tumor, but no
statistical difference was identified.
 | Table I.Demographic and clinical
characteristics of the study subjects. |
Table I.
Demographic and clinical
characteristics of the study subjects.
|
Characteristics | All (n=125) | MCAC (n=40) | Non-MCAC
(n=85) | P-value |
|---|
| Age, years [Median
(IQR)] | 60 (52–68) | 56 (45–63) | 61 (53–68) | 0.08 |
| Sex |
|
|
|
|
|
Female | 47 (37.6) | 19 (47.5) | 28 (32.9) | 0.11 |
|
Male | 78 (62.4) | 21 (52.5) | 57 (67.1) |
|
| ECOG-PS, n (%) |
|
|
|
|
|
0-1 | 118 (94.4) | 37 (92.5) | 81 (95.3) | 0.67 |
|
2 | 7 (5.6) | 3 (7.5) | 4 (4.7) |
|
| De novo
metastasis (%) | 40 (32.0) | 4 (10%) | 36 (42.4) | <0.001 |
| Tumor
differentiation, n (%) |
|
|
|
|
|
Well | 10 (8.0) | 2 (5.0) | 8 (9.0) |
|
|
Moderate | 81 (64.8) | 22 (55.0) | 59 (69.4) | 0.15 |
|
Poor | 22 (17.6) | 11 (27.5) | 11 (12.9) |
|
|
Unknown | 12 (9.6) | 5 (12.5) | 7 (8.2) |
|
| Tumor
differentiation group, n (%) |
|
|
|
|
|
Well | 10 (8.8) | 2 (5.7) | 8 (10.2) | 0.72 |
|
Moderate and
poor | 103 (91.2) | 33 (94.3) | 70 (89.7) |
|
| Metastasectomy, n
(%) | 4 (3.2) | - | 4 (4.7) | 0.3 |
| Primary tumor
location, n (%) |
|
|
|
|
|
Rectum | 46 (36.8) | 10 (25.0) | 36 (42.4) | 0.06 |
|
Sigmoid or
descending colon | 79 (63.2) | 30 (75.0) | 49 (57.6) |
|
| Metastatic site, n
(%) |
|
|
|
|
|
Liver | 82 (65.6) | 17 (42.5) | 65 (76.5) | <0.001 |
|
Lung | 23 (26.4) | 9 (22.5) | 24 (28.2) | 0.49 |
|
Lymph node | 39 (31.2) | 14 (35.0) | 25 (29.4) | 0.52 |
|
Carcinomatosis
peritoneal | 31 (24.8) | 15 (37.5) | 16 (18.8) | 0.02 |
| Metastatic site
number, n (%) |
|
|
|
|
|
≥2 | 61 (48.8) | 18 (45.0) | 43 (50.5) | 0.48 |
| First-line CT
regimen, n (%) |
|
|
|
|
|
mFOLFOX6 | 68 (54.4) | 24 (60.0) | 44 (51.8) | 0.38 |
|
FOLFIRI | 57 (45.6) | 16 (40.0) | 41 (48.2) |
|
| Anti-EGFR agent, n
(%) |
|
|
|
|
|
Cetuximab | 69 (55.2) | 18 (45.0) | 51 (60.0) | 0.11 |
|
Panitumumab | 56 (44.8) | 22 (55.0) | 34 (40.0) |
|
| Maintenance, n
(%) | 67 (53.6) | 17 (42.5) | 50 (58.8) | 0.08 |
| BRAF, n (%) |
|
|
|
|
|
Mutant | 6 (4.0) | 1 (2.0) | 5 (6.0) | 0.39 |
|
Wild | 119 (96.0) | 39 (98.0) | 80 (94.0) |
|
| MMR status, n
(%) |
|
|
|
|
|
MSI | 5 (4.0) | 3 (7.0) | 2 (2.0) | 0.64 |
|
MSS | 120 (96.0) | 37 (92.0) | 83 (97.0) |
|
| Table II.Demographic and clinical
characteristics according to chemotherapy regimens. |
Table II.
Demographic and clinical
characteristics according to chemotherapy regimens.
|
| Patients received
FOLFOX + anti-EGFR | Patients received
FOLFIRI + anti-EGFR |
|---|
|
|
|
|
|---|
|
Characteristics | MCAC (n=24) | Non-MCAC
(n=44) | P-value | MCAC (n=16) | Non-MCAC
(n=41) | P-value |
|---|
| Age, years [Median
(IQR)] | 59 (46–62) | 62 (53–70) | 0.21 | 52 (44–66) | 59 (52–68) | 0.15 |
| Sex |
|
|
|
|
|
|
|
Female | 10 (41.7) | 15 (34.1) | 0.53 | 9 (56.3) | 13 (31.7) | 0.08 |
|
Male | 14 (58.3) | 29 (65.9) |
| 7 (43.8) | 28 (68.3) |
|
| ECOG-PS, n (%) |
|
|
|
|
|
|
|
0-1 | 22 (91.7) | 42 (95.5) | 0.52 | 15 (93.8) | 39 (95.1) | 0.83 |
|
2 | 2 (8.3) | 2 (4.5) |
| 1 (6.3) | 2 (4.9) |
|
| De novo
metastasis, n (%) | 2 (8.3) | 25 (56.8) | <0.001 | 2 (12.5) | 11 (26.8) | 0.24 |
| Tumor
differentiation, n (%) |
|
|
|
|
|
|
|
Well | 1 (4.2) | 4 (9.1) | 0.39 | 1 (6.3) | 4 (9.8) | 0.28 |
|
Moderate | 14 (58.3) | 31 (70.5) |
| 8 (50.0) | 28 (68.3) |
|
|
Poor | 7 (29.2) | 8 (18.2) |
| 4 (25.0) | 3 (7.3) |
|
|
Unknown | 2 (8.3) | 1 (2.3) |
| 3 (18.8) | 6 (14.6) |
|
| Metastasectomy, n
(%) | - | 2 (4.5) | 0.28 | - | 2 (4.9) | 0.36 |
| Primary tumor
location, n (%) |
|
|
|
|
|
|
|
Rectum | 2 (8.3) | 15 (34.1) | 0.01 | 8 (50.0) | 21 (51.2) | 0.93 |
|
Sigmoid or
descending colon | 22 (91.7) | 29 (65.9) |
| 8 (50.0) | 20 (48.8) |
|
| Metastatic site, n
(%) |
|
|
|
|
|
|
|
Liver | 11 (45.8) | 37 (84.1) | 0.001 | 6 (37.5) | 28 (68.3) | 0.03 |
|
Lung | 6 (25.0) | 9 (20.5) | 0.66 | 3 (18.8) | 15 (36.6) | 0.19 |
|
Lymph node | 8 (33.3) | 14 (31.8) | 0.89 | 6 (37.5) | 11 (26.8) | 0.42 |
|
Carcinomatosis
peritoneal | 9 (37.5) | 11 (25.0) | 0.28 | 6 (37.5) | 5 (12.2) | 0.03 |
| Metastatic site
number, n (%) |
|
|
|
|
|
|
|
≥2 | 13 (54.2) | 26 (59.1) | 0.69 | 5 (31.3) | 18 (43.9) | 0.38 |
| Anti-EGFR agent, n
(%) |
|
|
|
|
|
|
|
Cetuximab | 9 (37.5) | 25 (56.8) | 0.12 | 9 (56.2) | 26 (63.4) | 0.61 |
|
Panitumumab | 15 (62.5) | 19 (43.2) |
| 7 (43.8) | 15 (36.6) |
|
| Maintenance, n
(%) | 11 (45.8) | 29 (65.9) | 0.10 | 6 (37.5) | 21 (51.2) | 0.35 |
| BRAF, n (%) |
|
|
|
|
|
|
|
Mutant | 1 (4.2) | 3 (6.8) | 0.65 | 0 (0.0) | 1 (2.4) | 0.52 |
|
Wild | 23 (95.8) | 41 (93.2) |
| 16 (100.0) | 40 (97.6) |
|
| MMR status, n
(%) |
|
|
|
|
|
|
|
MSI | 3 (12.5) | 1 (2.3) | 0.08 | 0 (0.0) | 2 (4.9) | 0.36 |
|
MSS | 21 (87.5) | 43 (97.7) |
| 16 (100.0) | 39 (95.1) |
|
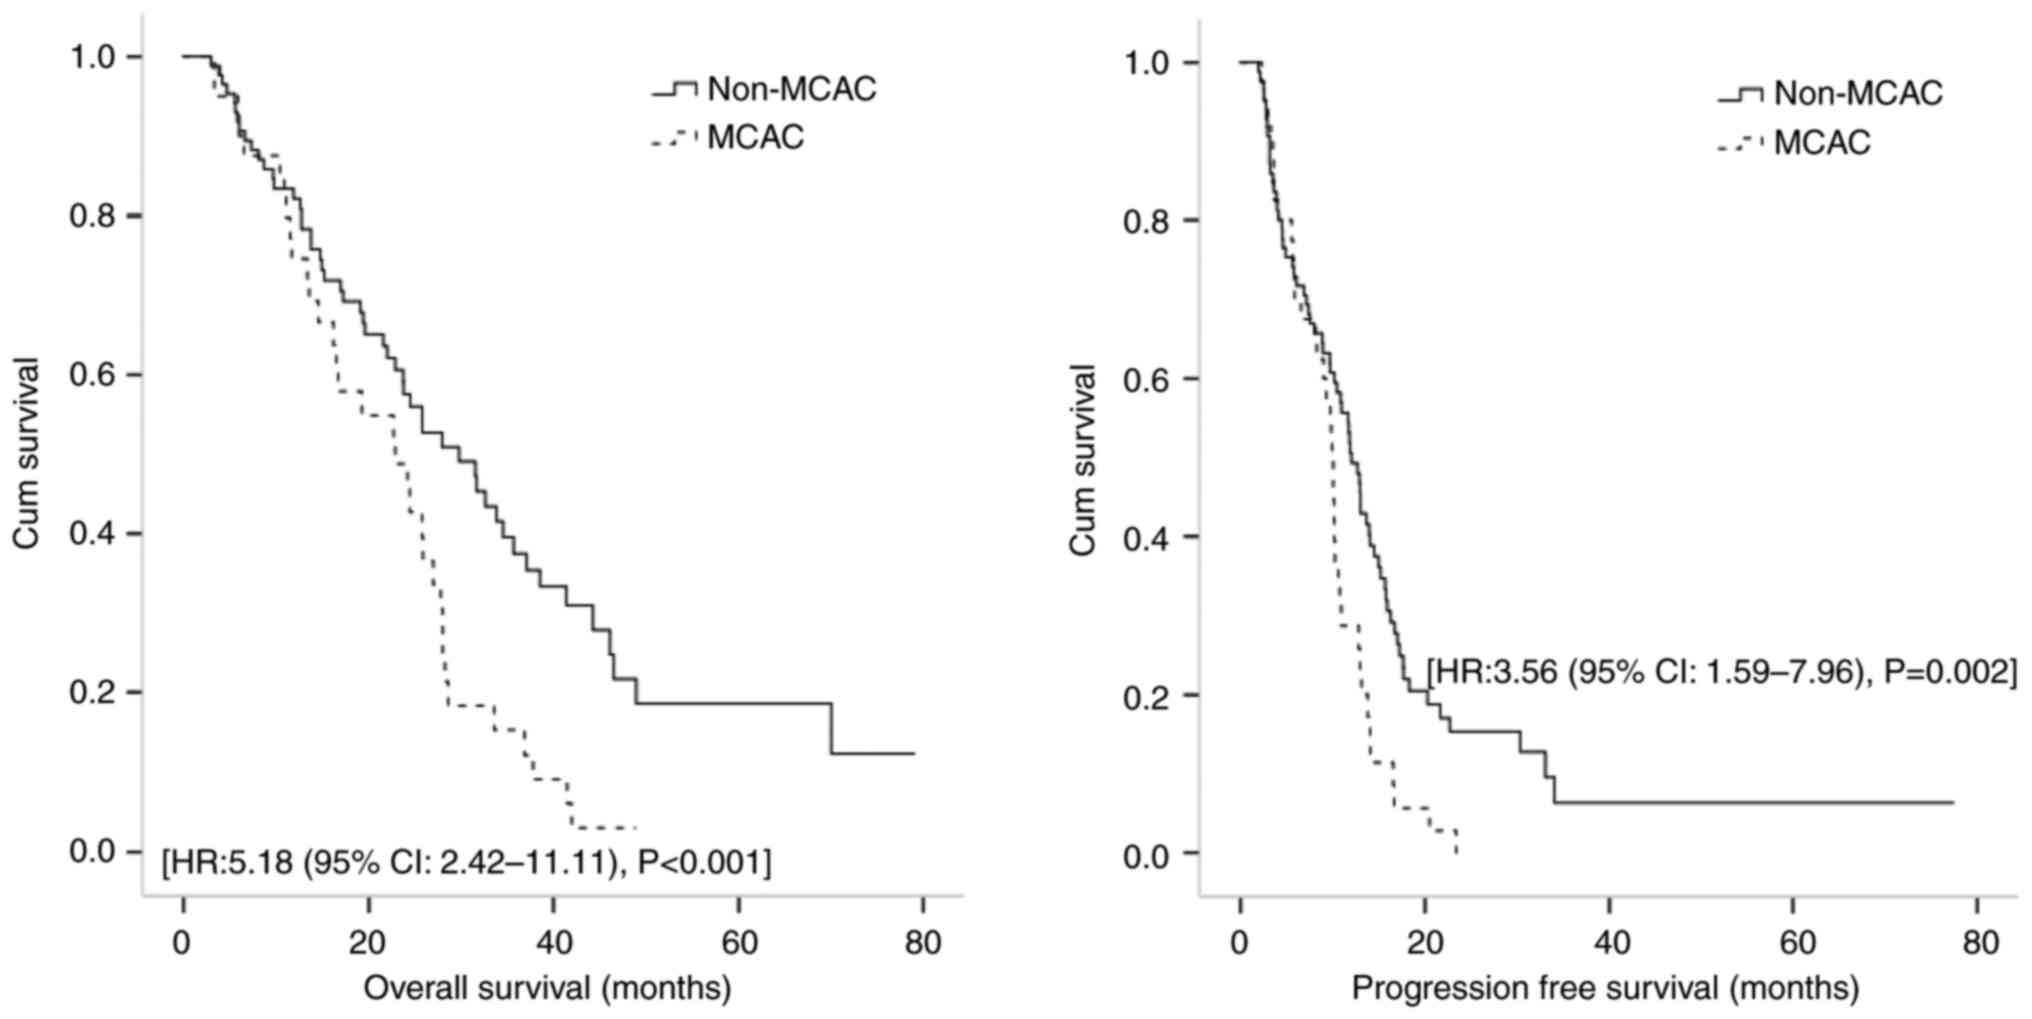
In the whole group without separating backbone CT
regimen, MCAC group had poor OS and PFS. Median follow-up period
was 19.7 months (range 2.2-77.3) and during this time, disease
progression and death occurred in 107 (85.6%) and 86 (68.8%)
patients, respectively. Median PFS with first line treatment was
10.7 (95% CI: 9.3-12.1) months. PFS was significantly lower in MCAC
[9.9 months (95% CI: 9.4-10.3)] than non-MCAC patients [12.0 months
(95% CI, 10.2-13.7)] (P=0.005). Median OS was 25.7 months (95% CI:
22.4-29.1) and was significantly lower in MCAC [22.8 months (95%
CI: 14.5-31.2)] than non-MCAC patients [29.7 months (95% CI,
22.1-37.3)] (P=0.005). Kaplan-Meier curves for OS and PFS according
to mucinous histology are presented in Fig. 3.
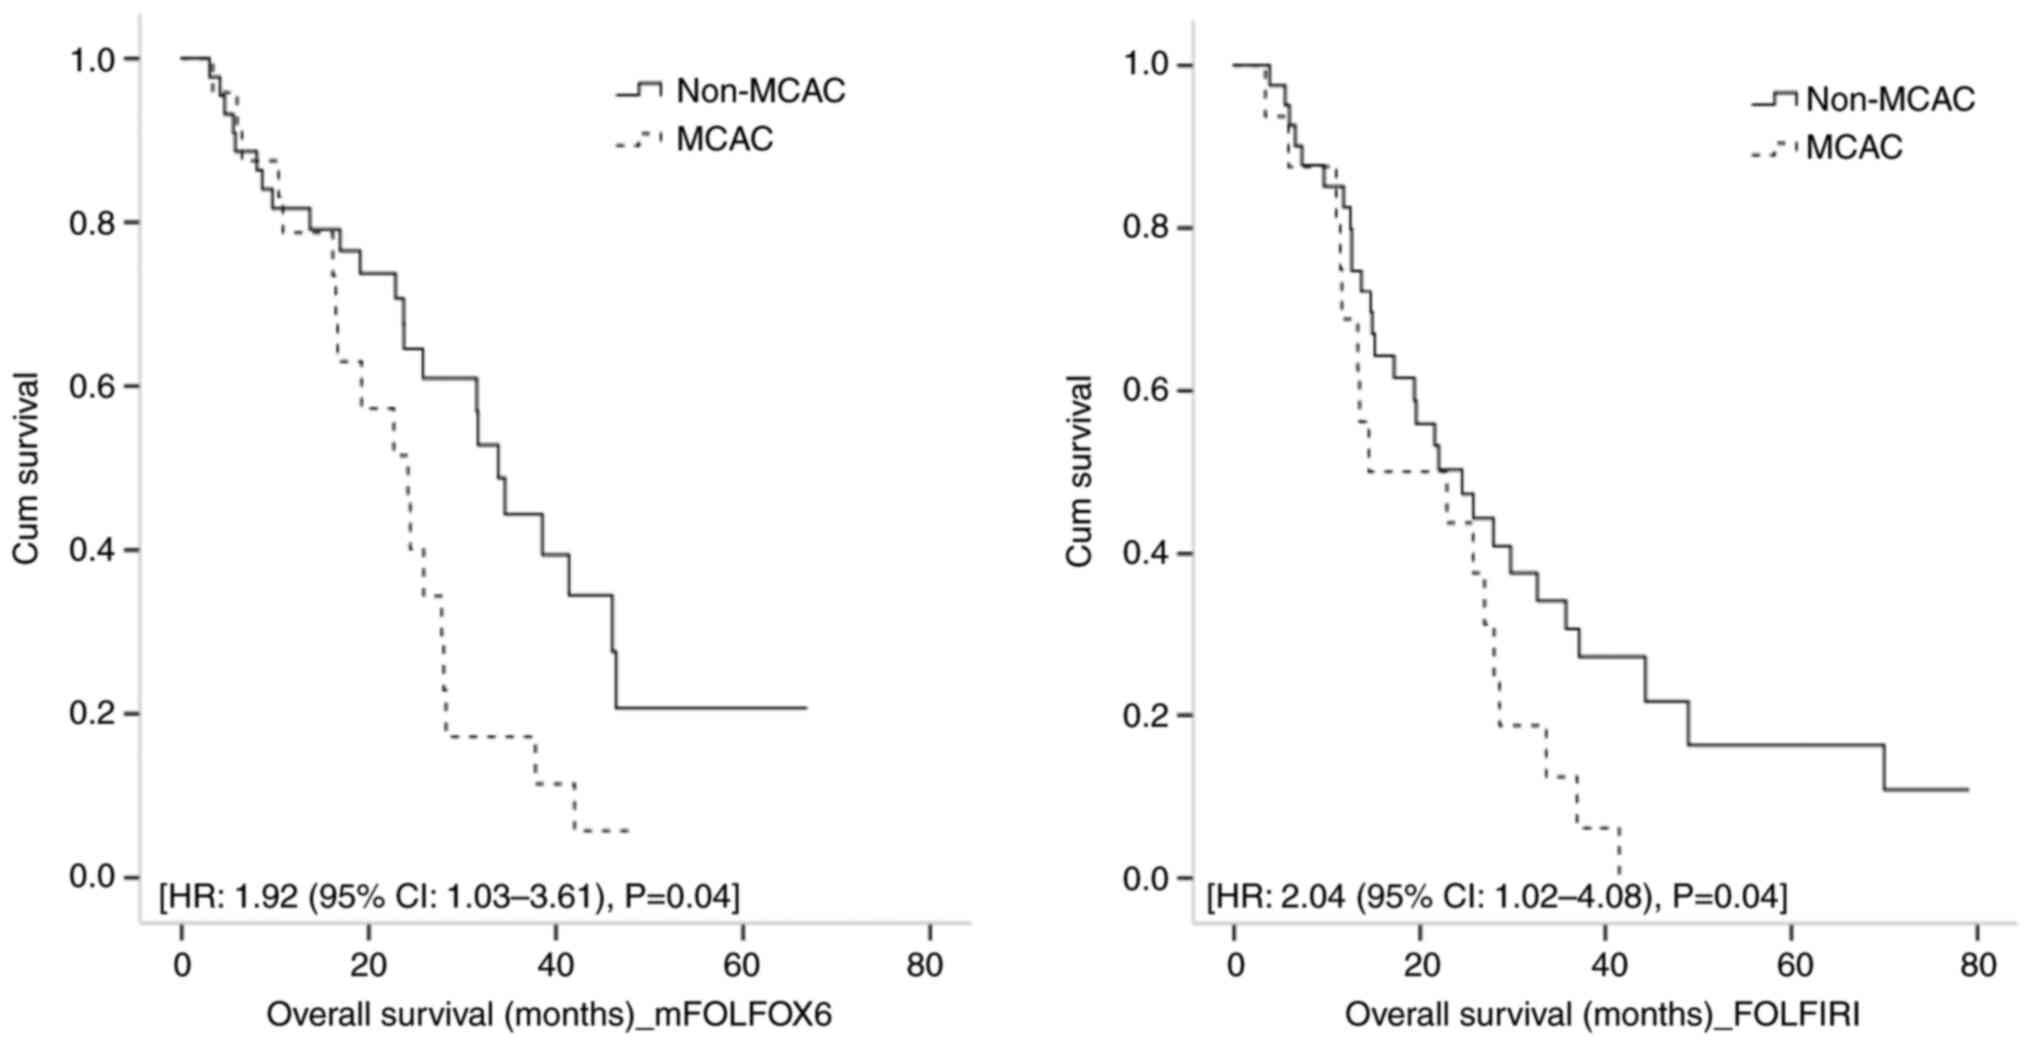
When survival outcomes were evaluated according to
two backbone CT regimens, patients with mucinous histology had
poorer OS in both of regimens. In mFOLFOX6 group, 41 (60.3%)
patients died. Median OS was 26.84 months (95% CI: 20.47-33.21) and
lower in MCAC patients [22.47 months (95% CI: 17.11-27.82)] than
non-MCAC patients [30.85 months (95% CI: 20.98-40.71)] P=0.03]
Moreover, in multivariate analysis mucinous histology was an
independent prognostic factor for poor OS in mFOLFOX6 group [Hazard
Ratio (HR): 1.92, (95% CI: 1.03-3.61), P=0.04]. Univariate and
multivariate analyses for OS in mFOLFOX6 group are demonstrated in
Table III. In FOLFIRI group, 44
(77.2%) patients succumbed. Median OS was 21.38 months (95% CI:
13.69-29.08) and lower in MCAC [14.22 months (95% CI: 0.00-36.24)]
patients than non-MCAC patients [21.38 months (95% CI:
13.18-29.59)], P=0.08. In multivariate analysis, ECOG-PS [HR: 6.28,
(95% CI: 1.39-28.51), P=0.01], de novo metastasis [HR: 2.53
(1.18-5.46), P=0.01], MMR status [HR: 26.00 (95% CI: 2.76-244.95),
P=0.004] and mucinous histology [HR: 4.29 (95% CI: 0.54-33.88),
P=0.04] were independent prognostic factors for OS. Univariate and
multivariate analyses for OS in FOLFIRI group are revealed in
Table IV. Kaplan-Meier curves for
OS in mFOLFOX6 and FOLFIRI group according to mucinous histology
are shown in Fig. 4.
| Table III.Univariate and multivariate analyses
for PFS and OS in mFOLFOX6 group. |
Table III.
Univariate and multivariate analyses
for PFS and OS in mFOLFOX6 group.
|
| PFS | OS |
|---|
|
|
|
|
|---|
|
| Univariate | Multivariate | Univariate | Multivariate |
|---|
|
|
|
|
|
|
|---|
|
Characteristics | Median (95%
CI) | P-value | HR (95% CI) | P-value | Median (95%
CI) | P-value | HR (95% CI) | P-value |
|---|
| Age, years |
|
|
|
|
|
|
|
|
|
<61 |
10.61(9.59–11.62) | 0.73 |
|
| 23.06
(15.92–30.20) | 0.43 |
|
|
|
≥61 | 12.81
(11.52–14.10) |
|
|
| 28.25
(18.77–37.74) |
|
|
|
| Sex |
|
|
|
|
|
|
|
|
|
Female | 11.86
(8.91–14.80) | 0.30 |
|
| 20.69
(14.60–26.79) | 0.04 | Ref. | 0.05 |
|
Male | 12.68
(9.87–15.48) |
|
|
| 30.25
(25.43–35.08) |
| 0.52
(0.27–1.00) |
|
| ECOG-PS, n (%) |
|
|
|
|
|
|
|
|
|
0–1 | 12.02
(9.63–14.41) | 0.003 | Ref. | 0.002 | 27.76
(21.18–34.34) | 0.09 | Ref. | 0.12 |
|
2 | 2.89
(2.44–3.34) |
| 22.27
(3.12–166.22) |
| 6.60
(0.00–23.63) |
| 2.25
(0.79–6.44) |
|
| De novo
metastasis |
|
|
|
|
|
|
|
|
|
(+) | 12.91
(10.42–15.40) | 0.50 |
|
| 30.25
(17.64–42.88) | 0.85 |
|
|
|
(−) | 11.72
(9.46–13.99) |
|
|
| 26.84
(20.37–33.31) |
|
|
|
| Metastasectomy |
|
|
|
|
|
|
|
|
|
(+) | 13.96 (NE-NE) | 0.16 | 1.57
(0.18–13.95) | 0.68 | 22.20 (NE-NE) | 0.34 |
|
|
|
(−) | 11.82
(9.68–13.98) |
| Ref. |
| 26.84
(20.67–33.01) |
|
|
|
| Primary tumor
location |
|
|
|
|
|
|
|
|
|
Rectum | 8.93
(6.77–11.10) | 0.28 |
|
| 23.06
(12.37–33.75) | 0.78 |
|
|
|
Non-rectum | 12.68
(11.21–14.16) |
|
|
| 27.76
(20.69–34.83) |
|
|
|
| Metastatic
site |
|
|
|
|
|
|
|
|
|
Liver | 12.68
(10.32–15.03) | 0.02 | 0.54
(0.25–1.20) | 0.13 | 28.25
(20.16–36.34) | 0.80 |
|
|
|
Lung | 13.10
(10.63–15.58) | 0.80 |
|
| 28.25
(25.93–30.57) | 0.54 |
|
|
|
Lymph node | 11.82
(9.26–14.39) | 0.50 |
|
| 40.90
(13.02–68.78) | 0.23 |
|
|
|
Carcinomatosis
peritoneal | 10.25
(9.26–11.24) | 0.37 |
|
| 22.20
(13.71–30.70) | 0.15 | 1.78
(0.88–3.59) | 0.10 |
| Anti-EGFR
agent |
|
|
|
|
|
|
|
|
|
Cetuximab | 12.68
(9.43–15.93) | 0.34 |
|
| 23.98
(13.31–34.66) | 0.75 |
|
|
|
Panitumumab | 11.28
(10.38–13.28) |
|
|
| 27.76
(20.36–35.16) |
|
|
|
| Histopathology |
|
|
|
|
|
|
|
|
|
Mucinous | 10.15
(9.65–10.64) | 0.008 | 3.86
(1.85–8.10) | <0.001 | 22.47
(17.11–27.82) | 0.03 | 1.92
(1.03–3.61) | 0.04 |
|
Non-mucinous | 13.01
(10.74–15.27) |
| Ref. |
| 30.85
(20.98–40.71) |
| Ref. |
|
| BRAF |
|
|
|
|
|
|
|
|
|
Mutant | 3.58
(0.00–10.60) | 0.27 |
|
| 6.43
(0.00–33.10) | 0.46 |
|
|
|
Wild-type | 11.86
(9.58–14.14) |
|
|
| 27.76
(21.46–34.06) |
|
|
|
| MMR status |
|
|
|
|
|
|
|
|
|
MSI | 3.58
(0.00–10.23) | 0.14 | 1.29
(0.37–4.57) |
| 6.43 (NE-NE) | 0.76 |
|
|
|
MSS | 13.66
(11.08–16.25) |
| Ref. |
| 27.76
(21.45–34.07) |
|
|
|
| Table IV.Univariate and multivariate analyses
for PFS and OS in FOLFIRI group. |
Table IV.
Univariate and multivariate analyses
for PFS and OS in FOLFIRI group.
|
| PFS | OS |
|---|
|
|
|
|
|---|
|
| Univariate | Multivariate | Univariate | Multivariate |
|---|
|
|
|
|
|
|
|---|
|
Characteristics | Median (95%
CI) | P-value | HR (95% CI) | P-value | Median (95%
CI) | P-value | HR (95% CI) | P-value |
|---|
| Age, years |
|
|
|
|
|
|
|
|
|
<57 | 9.69
(7.12–12.27) | 0.80 |
|
| 26.08
(15.70–36.47) | 0.97 |
|
|
|
≥57 | 10.05
(6.95–13.16) |
|
|
| 20.20
(10.67–29.74) |
|
|
|
| Sex |
|
|
|
|
|
|
|
|
|
Female | 8.11
(0.81–15.42) | 0.38 |
|
| 20.20
(9.57–30.14) | 0.10 |
|
|
|
Male | 10.05
(8.20–11.91) |
|
|
| 22.43
(13.58–31.30) |
|
|
|
| ECOG-PS, n (%) |
|
|
|
|
|
|
|
|
|
0–1 | 9.82
(7.27–12.37) | 0.14 | Ref. | 0.44 | 22.43
(17.48–27.39) | <0.001 | Ref. | 0.01 |
|
2 | 4.60
(3.49–5.70) |
| 1.72
(0.42–7.10) |
| 6.07
(3.71–8.44) |
| 6.28
(1.39–28.51) |
|
| De novo
metastasis |
|
|
|
|
|
|
|
|
|
(+) | 8.01
(3.35–12.68) | 0.04 | 2.02
(1.04–3.94) | 0.03 | 13.27
(6.09–20.44) | 0.01 | 2.53
(1.18–5.46) | 0.01 |
|
(−) | 10.94
(7.56–14.32) |
| Ref. |
| 24.67
(19.02–30.32) |
| Ref. |
|
| Metastasectomy |
|
|
|
|
|
|
|
|
|
(+) | 9.69 (NE-NE) | 0.68 |
|
| 20.33 (NE-NE) | 0.92 |
|
|
|
(−) | 9.82
(7.59–12.06) |
|
|
| 21.38
(11.39–31.38) |
|
|
|
| Primary tumor
location |
|
|
|
|
|
|
|
|
|
Rectum | 8.27
(4.39–12.17) | 0.05 | 1.77
(1.00–3.12) | 0.04 | 20.20
(11.39–29.01) | 0.14 |
|
|
|
Non-rectum | 10.94
(7.35–14.53) |
| Ref. |
| 24.67
(11.20–38.13) |
|
|
|
| Metastatic
site |
|
|
|
|
|
|
|
|
|
Liver | 7.16
(2.75–11.57) | 0.79 |
|
| 17.51
(9.99–25.03) | 0.44 |
|
|
|
Lung | 5.78
(0.00–13.44) | 0.63 |
|
| 20.20
(7.88–32.53) | 0.46 |
|
|
|
Lymph node | 10.05
(1.13–18.98) | 0.40 |
|
| 21.38
(11.30–31.46) | 0.62 |
|
|
|
Carcinomatosis
peritoneal | 10.05
(8.41–11.70) | 0.28 |
|
| 22.43
(10.17–34.70) | 0.19 |
|
|
| Anti-EGFR
agent |
|
|
|
|
|
|
|
|
|
Cetuximab | 9.82
(8.18–11.47) | 0.62 |
|
| 24.67
(18.41–30.93) | 0.44 |
|
|
|
Panitumumab | 8.27
(4.04–12.52) |
|
|
| 15.14
(13.62–16.67) |
|
|
|
| Histopathology |
|
|
|
|
|
|
|
|
|
Mucinous | 8.11
(3.41–12.82) | 0.18 | 1.57
(0.85–2.92) | 0.15 | 14.22
(0.00–36.24) | 0.08 | 2.04
(1.02–4.08) | 0.04 |
|
Non-mucinous | 10.87
(8.98–12.77) |
| Ref. |
| 21.38
(13.18–29.59) |
| Ref. |
|
| BRAF |
|
|
|
|
|
|
|
|
|
Mutant | 4.53 (NE-NE) | 0.58 |
|
| 5.91 (NE-NE) | 0.05 | 4.29
(0.54–33.88) | 0.16 |
|
Wild-type | 9.82
(7.77–11.88) |
|
|
| 22.43
(16.07–28.80) |
| Ref. |
|
| MMR status |
|
|
|
|
|
|
|
|
|
MSI | 4.53 (NE-NE) | 0.19 | 4.21
(0.52–33.78) | 0.17 | 5.91 (NE-NE) | 0.007 | 26.00
(2.76–244.95) | 0.004 |
|
MSS | 9.82
(7.91–11.73) |
| Ref. |
| 21.38
(14.98–27.79) |
| Ref. |
|
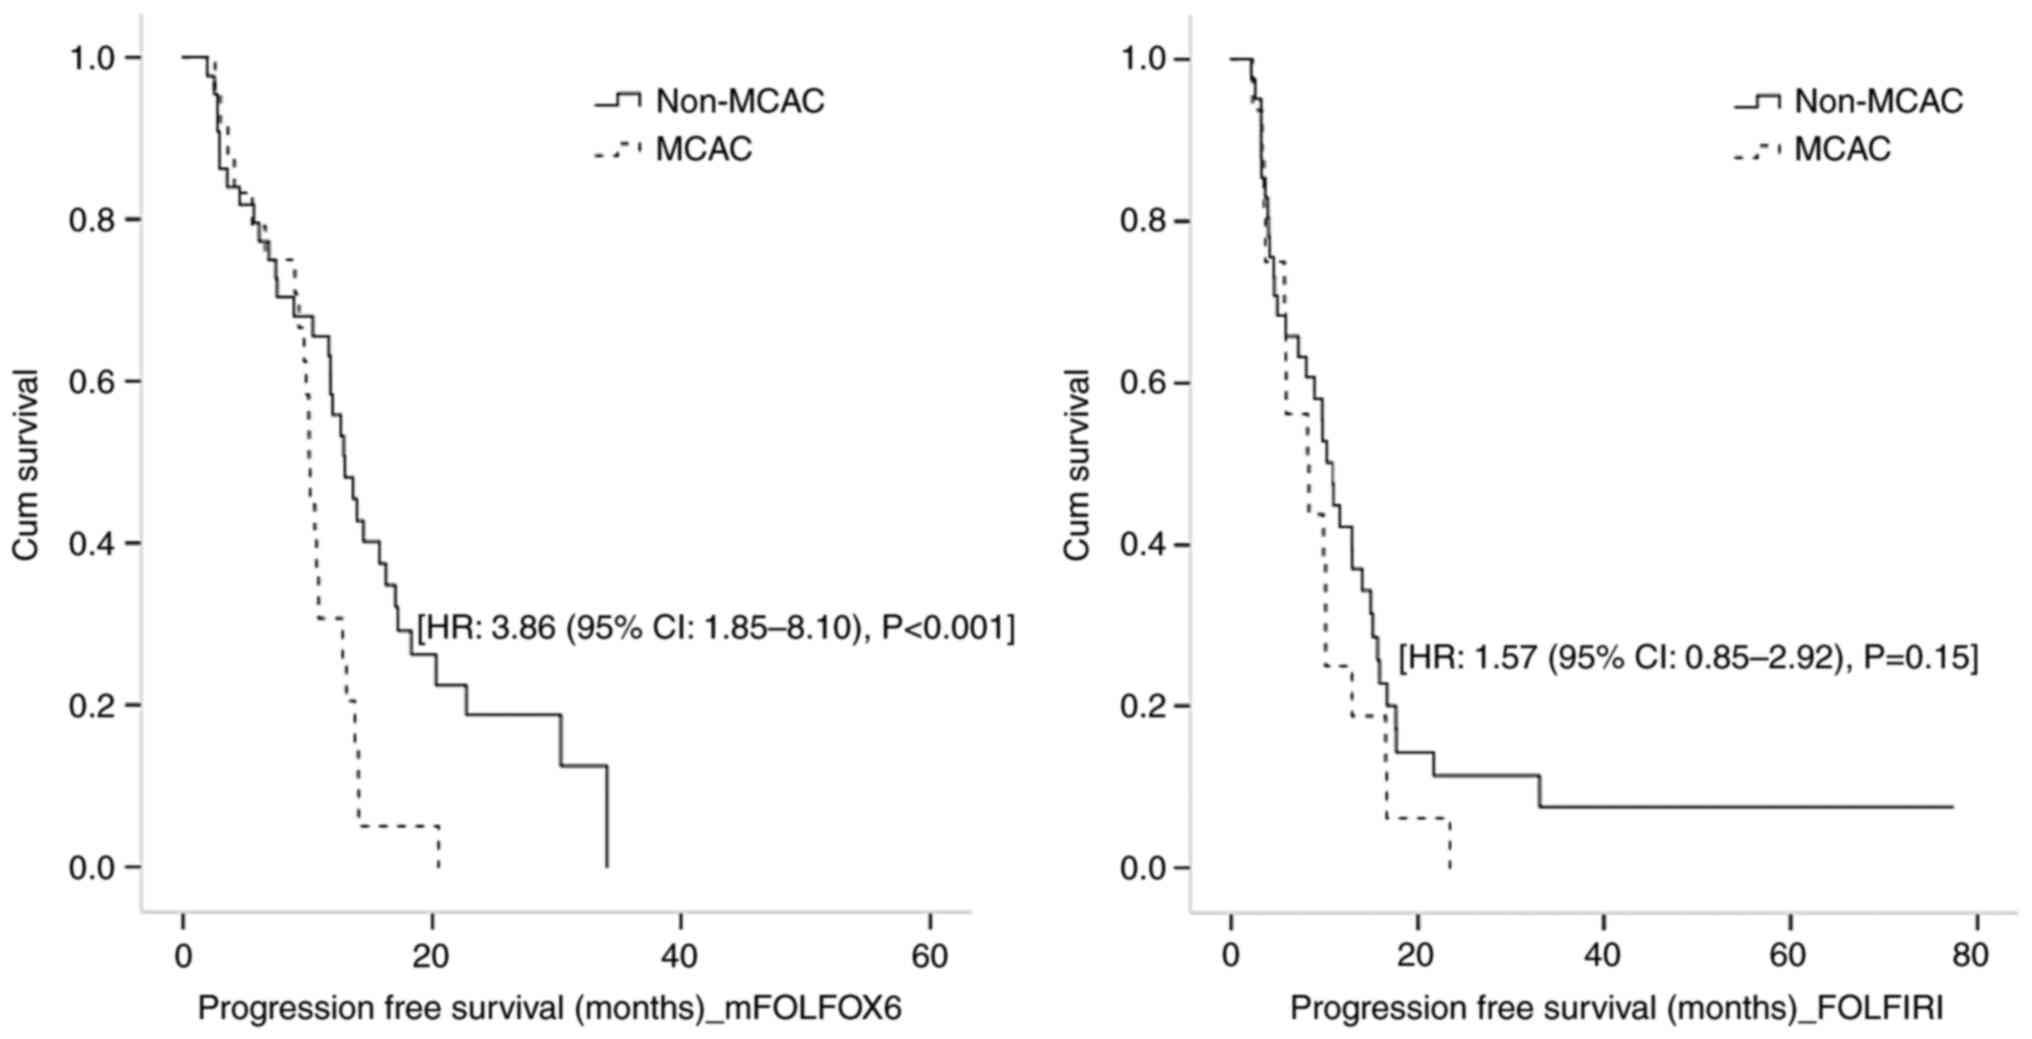
When evaluating PFS by separating backbone CT
regimens, in only mFOLFOX6 group, MCAC was found to be poor
prognostic. In patients receiving mFOLFOX6, disease progression
occurred in 56 (82.3%) patients. Median PFS was 11.86 months (95%
CI: 9.68-14.04) and lower in MCAC patients [10.15 months (95% CI:
9.65-10.64)] than non-MCAC patients [13.01 months (95% CI:
10.74-15.27], P=0.008. After correcting for significant prognostic
factors by multivariate analysis, ECOG-PS [HR: 22.77 (95% CI:
3.12-166.22), P=0.002] and mucinous histology [HR: 3.86 (95% CI:
1.85-8.10), P<0.001] were revealed to be associated with poor
PFS. Univariate and multivariate analyses for PFS in mFOLFOX6 group
are shown in Table III. In
FOLFIRI group, disease progression occurred in 51 (89.5%) patients.
Median PFS was 9.82 months (95% CI: 7.73-11.91) and numerically
shorter in MCAC group [8.11 months (95% CI: 3.41-12.82)] than
non-MCAC group [10.87 months (95% CI: 8.98-12.77)], P=0.18. In
multivariate analysis, de novo metastasis [HR: 2.02, (95%
CI: 1.04-3.94), P=0.03] and rectum location [HR: 1.77, (95% CI:
1.00-3.12), P=0.04] were independent prognostic factors. PFS was
comparable between MCAC and non-MCAC patients [HR: 1.57, (95% CI:
0.85-2.92), P=0.15]. Univariate and multivariate analyses for PFS
in FOLFIRI group are shown in Table
IV. Kaplan-Meier curves for PFS in mFOLFOX6 and FOLFIRI group
according to mucinous histology are demonstrated in Fig. 5.
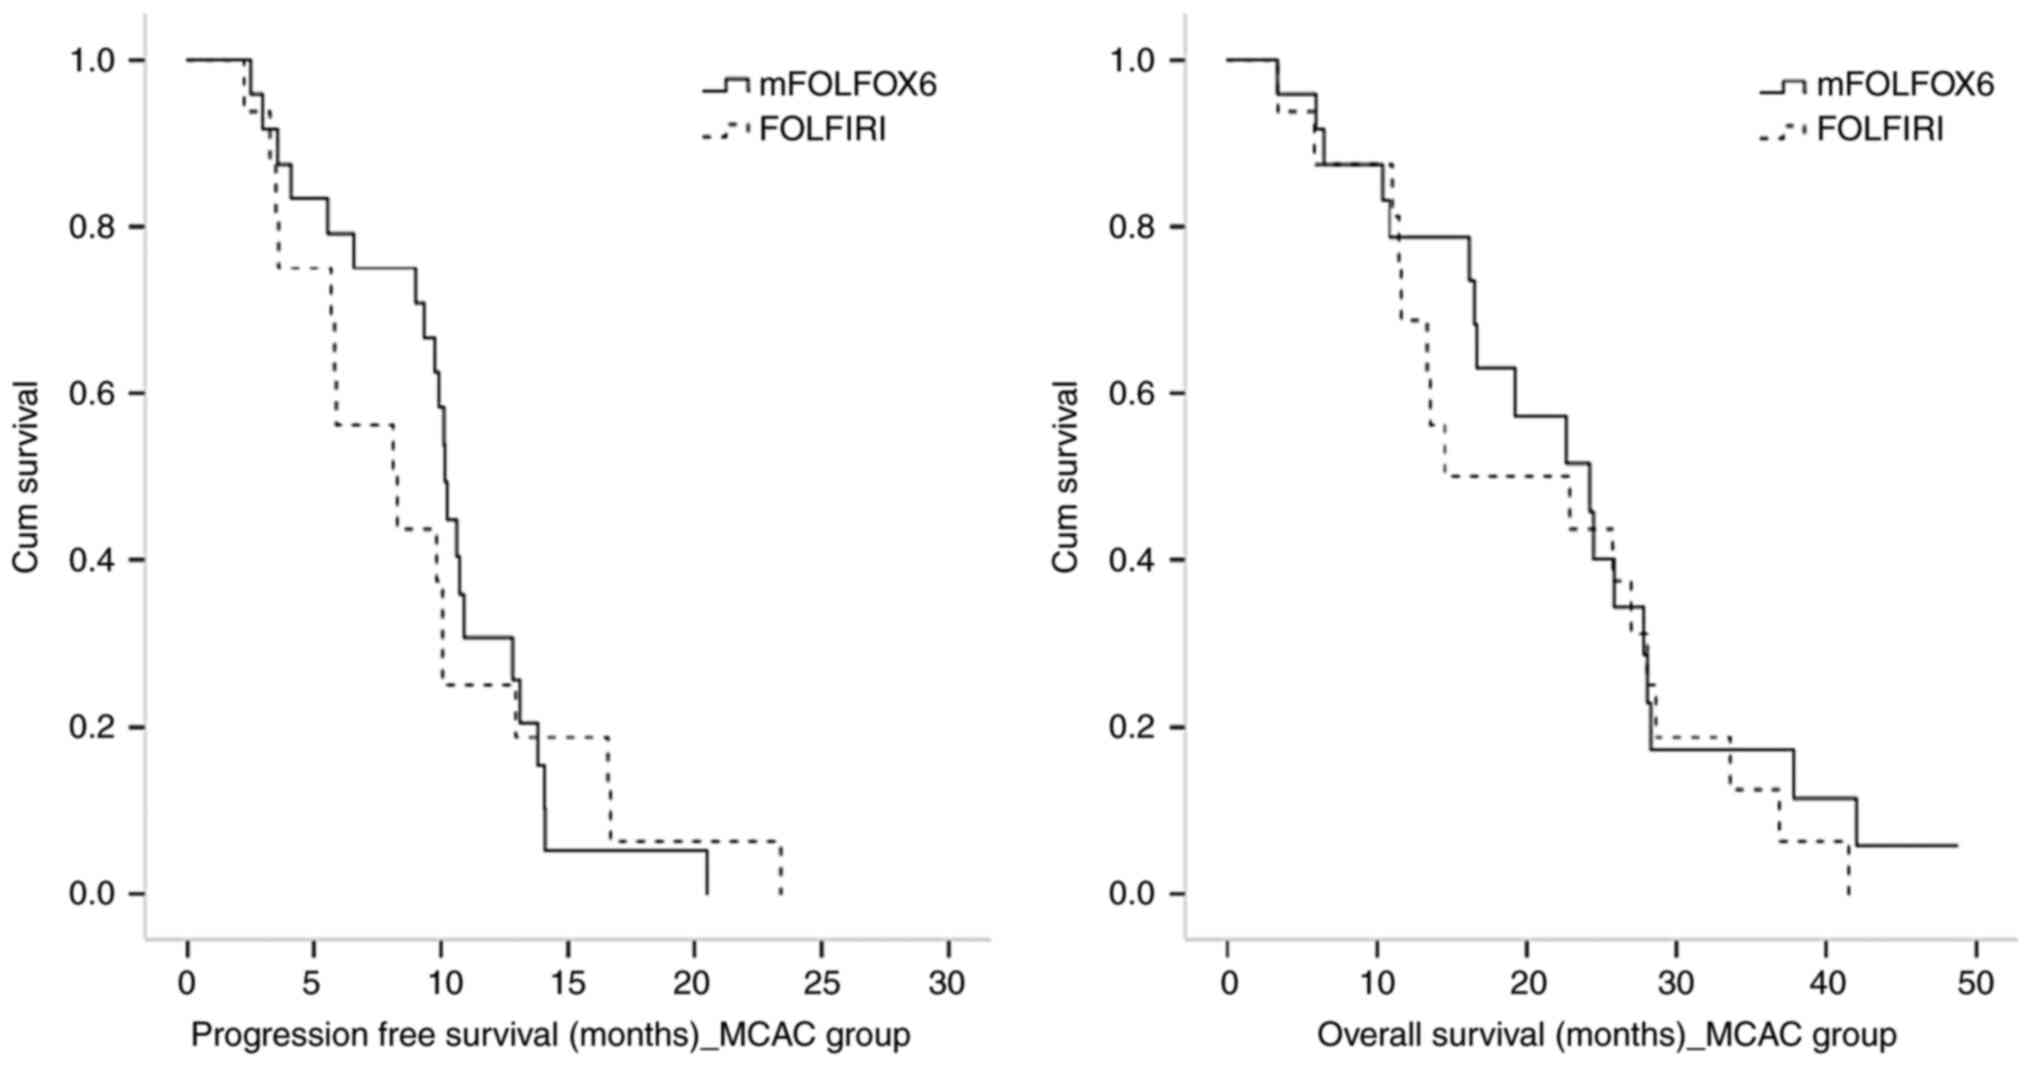
When survival outcomes were analyzed in the MCAC
group, backbone CT regimens did not make a significant difference.
Median OS of MCAC patients receiving mFOLFOX6 and FOLFIRI was 22.47
months (95% CI: 17.12-27.38) and 14.22 months (95% CI: 0.00-36.25),
respectively (P=0.41). Median PFS of MCAC patients receiving
mFOLFOX6 and FOLFIRI was 10.15 months (95% CI: 9.65-10.64) and 8.11
months (95% CI: 3.41-12.82), respectively (P=0.73). Kaplan-Meier
curves for PFS and OS in MCAC group according to backbone CT
regimens are revealed in Fig.
6.
Any grade toxicity was similar between treatment
groups (P=0.39) and observed in 72.0% (49/68 patients) in mFOLFOX6
+ anti-EGFR group and 64.9% (37/57 patients) in FOLFIRI + anti-EGFR
group. Moreover, any grade toxicity rate of MCAC and non-MCAC
patients was similar in treatment groups (83.3 and 65.9%, P=0.13 in
mFOLFOX6 + anti-EGFR group, 68.7 and 63.4%, P=0.70 in FOLFIRI +
anti-EGFR group, respectively). In mFOLFOX6 + anti-EGFR group,
while the most common grade 1–2 toxicities were neuropathy (30.1%),
skin toxicity (29.4%), asthenia (27.9%) and anemia (27.9%), grade
3–4 toxicities were neutropenia (10.3%), nausea (8.8%) and
neuropathy (8.8%). In FOLFIRI + anti-EGFR group, the most common
grade 1–2 toxicities were anemia (26.3%), skin toxicity (26.3%),
asthenia (24.6%) and nausea (21.0%), whereas grade 3–4 toxicities
were neutropenia (12.2%), skin toxicity (5.3%) and diarrhea (5.3%).
Neuropathy was higher in mFOLFOX6 + anti-EGFR group (P=0.001) and
diarrhea was higher in FOLFIRI + anti-EGFR group (P=0.003). There
was no statistically difference in terms of other toxicities
between treatment groups.
Discussion
The present study revealed that mucinous histology
is associated with worse survival outcomes than non-mucinous
histology in left-sided mCRC patients with wild-type RAS who
treated with standard first line therapy. Additionally, in terms of
backbone CT regimens, MCAC patients had poor OS than non-MCAC
patients in both mFOLFOX6 and FOLFIRI groups, and MCAC patients had
poor PFS than non-MCAC patients only in mFOLFOX6 group. However,
when survival analyses were performed for only MCAC group, backbone
CT option did not significantly affect PFS or OS in this distinct
histologic subgroup of mCRC.
Previously, although increasing evidence has
indicated that mucinous histology is a poor prognostic factor in
CRC patients, prognosis and treatment strategy remain conflicting
(3,9,11).
Maisano et al (16), Negri
et al (22) and Mekenkamp
et al (23) demonstrated
poor prognosis of patients with mucinous histology who were treated
with different CT regimens. Conversely, Catalano et al
(10) evaluated both all mCRCs and
only the left-sided ones separately and revealed that prognosis of
patients with mucinous histology was not significantly different
from that with non-mucinous histology. In the aforementioned
studies, study populations were heterogenous in terms of tumor
location and RAS mutation and were mostly located in right colon.
Lan et al (24) analyzed
survival of right- and left-sided CRCs according to histologic
subtype and identified that mucinous histology was associated with
worse 5-year OS compared with non-mucinous histology only in
left-sided CRCs, not in right-sided. The present study included a
relatively homogeneous group of patients compared with the
literature and revealed that among left-sided mCRC patients, OS of
MCAC patients was worse than non-MCAC patients. Prognostic
difference was remarkable, despite the presence of more de
novo metastasis in the non-MCAC group.
There are also several studies investigating the
prognostic importance of mucinous histology according to backbone
CT regimens. Catalano et al (10) compared fluoropyrimidine-based,
oxa-based, and iri-based CT and all regimens included bevacizumab.
They found that in only oxa-based CT group, mucinous histology was
associated with worse prognosis. Zhou et al (18) compared CT plus bevacizumab with CT
plus cetuximab in the first line setting and also analyzed backbone
CT regimens. In patients with mucinous histology, FOLFIRI combined
with bevacizumab or cetuximab indicated an improved prognosis than
oxa-based regimens. In the current study, when OS was analyzed over
backbone CT regimens among patients receiving mFOLFOX6, although
baseline characteristics of the MCAC group indicated an improved
prognosis, mucinous histology was still found to be associated with
poorer OS. Baseline characteristics of patients who received
FOLFIRI were relatively homogeneous. Otherwise, there was no BRAF
mutant or MSI tumor in the MCAC group. Despite the absence of these
features indicating poor prognosis and treatment resistance, MCAC
was also associated with poor prognosis in the FOLFIRI group.
Predictive value of mucinous histology remains
controversial. Several studies emphasized that mucinous and
non-mucinous CRCs show differential expression of CT metabolism and
resistance genes (25,26). Furthermore, Cantero-Recasens et
al (27) suggested that
controlling mucin secretion may reverse chemo-refraction in CRC
cells. Among studies investigating backbone CT and mucinous
histology, Catalano et al (15) included patients receiving oxa-based
or iri-based CT but not biological agent, in 2009. It was found
that mucinous histology was associated with a low response rate for
both CT regimens. In the following years, Catalano et al
(10) studied with patients
receiving CT plus bevacizumab for the first line. They found that
PFS was comparable between mucinous and non-mucinous histology in
either CT regimens, but only in the oxa-based CT group, PFS was
numerically notably lower in patients with mucinous histology. Few
studies have been conducted on its predictive significance for
biological agents. Moretto et al (17), in the left-sided mCRCs, Zhou et
al (18), regardless of tumor
sidedness, emphasized that mucinous histology was a negative
predictive factor for anti-EGFR agents. Wang et al (19) included left-sided RAS/BRAF wild-type
mucinous and non-mucinous mCRC patients. They analyzed mucinous
mCRC patients according to first line treatment and they revealed
that patients who received CT plus bevacizumab had improved PFS
compared with patients who received CT plus anti-EGFR agent.
However, there were only seven patients in each group and the study
did not include analysis for backbone CT regimens. Since the
present study did not include a group who did not receive anti-EGFR
agent, it was not possible to evaluate the effectiveness of the
biological agent. In the present study, mucinous histology was
significantly associated with worse PFS in the mFOLFOX6 group, but
was not in the FOLFIRI group and consistent with the
literature.
Further findings are needed to clarify in terms of
whether there is an extra benefit of a specific CT regimen for the
MCAC patients. Nearly all previous studies compared mucinous
histology with non-mucinous histology. However, Zhou et al
(18) included mucinous and
non-mucinous patients and performed a separate analysis for
patients with mucinous histology according to CT regimens. Patients
received FOLFIRI or oxa-based CT regimens combined with bevacizumab
or cetuximab. For patients with mucinous histology, while in
patients who received bevacizumab, median OS was significantly
longer in combination to FOLFIRI than oxa-based regimens, in
patients who received cetuximab, median OS was comparable between
FOLFIRI and oxa-based regimens. The present study included patients
receiving CT combined with anti-EGFR agents and there was no
statistically significant difference between iri-based or oxa-based
regimens in MCAC patients consistent with the literature.
There are certain major limitations to the present
study. Clinical data based on the retrospective nature have certain
disadvantages to control for all potential confounding bias. The
study included a small number of patients and there were no
patients who had mucinous component (<50% extracellular mucin)
and therefore analyses did not include a comparison between MCAC
and mucinous component. Since the study included only left-sided
mCRC, also no comparison could be made between left-sided and
right-sided MCAC. Single-center histologic revision was not
applied. At the time interval in which data were collected, the
association of BRAF mutation with anti-EGFR resistance was not a
well-known entity. Therefore, the present study included a small
proportion of patients with BRAF mutations, which may partly
explain the poor prognosis and anti-EGFR combined CT resistance.
Additionally, there was a small number of patients who had
MMR-deficient tumor and there was no information about consensus
molecular subtypes, which are other factors that may affect
prognosis.
In conclusion, the present study revealed that
mucinous histology is associated with poor prognosis in left-sided
mCRC with wild-type RAS. Considering analyses of MCAC group, the
results did not indicate an extra benefit of a specific backbone CT
regimen in patients with mucinous mCRC. However, the poor
prognostic role of mucinous histology should be kept in mind.
Additionally, considering analyses of backbone CT groups, poor PFS
of MCAC patients was shown in only among patients receiving
mFOLFOX6 and this finding may be an important issue that needs to
be clarified in future studies.
Acknowledgements
Not applicable.
Funding
Funding: No funding was received.
Availability of data and materials
The data that support the findings of this study may
be available on request from the corresponding author. The data are
not publicly available due to privacy or ethical restrictions.
Authors' contributions
RA conceptualized the study, conducted investigation
and formal analysis, wrote the original draft, developed the study
concept, designed and monitored the study, and collected the data.
MMA, SA, MA, AC and AY collected data. CC performed pathology
review. NCD and OK performed statistical analyses. TAT and SI
collected data, and reviewed and edited the manuscript. OB, IVB, FD
and PFY developed methodology, supervised the study, reviewed and
edited the manuscript. FD and PFY confirm the authenticity of all
the raw data. All authors read and approved the final
manuscript.
Ethics approval and consent to
participate
Written informed consent is not required for the
study due to retrospective design. The present study protocol was
reviewed and approved (approval no. 09.2021.490) by Local Research
Ethics Committee of Marmara University School of Medicine
(Istanbul, Turkey).
Patient consent for publication
Not applicable.
Competing interests
The authors declare that they have no competing
interests.
Glossary
Abbreviations
Abbreviations:
|
anti-EGFR
|
anti-epidermal growth factor
receptor
|
|
BRAF
|
v-RAF murine sarcoma viral oncogene
homolog B1
|
|
CI
|
confidence interval
|
|
CIMP-H
|
CpG island methylator
phenotype-high
|
|
CR
|
complete response
|
|
CRC
|
colorectal carcinoma
|
|
ECOG-PS
|
Eastern cooperative oncology
group-performance status
|
|
HR
|
hazard ratio
|
|
Iri
|
irinotecan
|
|
mCRC
|
metastatic colorectal carcinoma
|
|
CT
|
chemotherapy
|
|
FU
|
fluorouracil
|
|
IQR
|
interquartile ranges
|
|
KRAS
|
Kirsten rat sarcoma
|
|
MCAC
|
mucinous colorectal adenocarcinoma
|
|
MAPK
|
mitogen-activated protein kinase
|
|
MMR
|
mismatch repair
|
|
MSI
|
microsatellite instable
|
|
MSS
|
microsatellite stable
|
|
Non-MCAC
|
non-mucinous colorectal
adenocarcinoma
|
|
NRAS
|
neuroblastoma rat sarcoma
|
|
OS
|
overall survival
|
|
Oxa
|
oxaliplatin
|
|
PD
|
progressive disease
|
|
PIK3CA
|
phosphatidylinositol-4,5-Bisphosphate-3-kinase catalytic subunit
alpha
|
|
PFS
|
progression-free survival
|
|
PR
|
partial response
|
|
RAS
|
rat sarcoma
|
|
RECIST
|
response evaluation criteria in solid
tumors
|
|
SD
|
stable disease
|
|
SLD
|
Sum of the longest diameters
|
|
TNM
|
Tumor-Node-Metastasis
|
References
|
1
|
World Health Organization (WHO), .
Classification of Tumours of the Digestive System. 3. 4th edition.
WHO; Geneva: 2010
|
|
2
|
Chen J, Zhou L, Gao J, Lu T, Wang J, Wu H
and Liang Z: Clinicopathological characteristics and mutation
spectrum of colorectal adenocarcinoma with mucinous component in a
chinese cohort: Comparison with classical adenocarcinoma. Front
Oncol. 10:9172020. View Article : Google Scholar : PubMed/NCBI
|
|
3
|
Li ZP, Liu XY, Kao XM, Chen YT, Han SQ,
Huang MX, Liu C, Tang XY, Chen YY, Xiang D, et al:
Clinicopathological characteristics and prognosis of colorectal
mucinous adenocarcinoma and nonmucinous adenocarcinoma: A
surveillance, epidemiology, and end results (SEER) population-based
study. Ann Transl Med. 8:2052020. View Article : Google Scholar : PubMed/NCBI
|
|
4
|
Park JS, Huh JW, Park YA, Cho YB, Yun SH,
Kim HC, Lee WY and Chun HK: Prognostic comparison between mucinous
and nonmucinous adenocarcinoma in colorectal cancer. Medicine
(Baltimore). 94:e6582015. View Article : Google Scholar : PubMed/NCBI
|
|
5
|
Reynolds IS, Furney SJ, Kay EW, McNamara
DA, Prehn JHM and Burke JP: Meta-analysis of the molecular
associations of mucinous colorectal cancer. Br J Surg. 106:682–691.
2019. View Article : Google Scholar : PubMed/NCBI
|
|
6
|
Hugen N, Simons M, Halilović A, van der
Post RS, Bogers AJ, Marijnissen-van Zanten MA, de Wilt JH and
Nagtegaal ID: The molecular background of mucinous carcinoma beyond
MUC2. J Pathol Clin Res. 1:3–17. 2015. View
Article : Google Scholar : PubMed/NCBI
|
|
7
|
Li X, Sun K, Liao X, Gao H, Zhu H and Xu
R: Colorectal carcinomas with mucinous differentiation are
associated with high frequent mutation of KRAS or BRAF mutations,
irrespective of quantity of mucinous component. BMC Cancer.
20:4002020. View Article : Google Scholar : PubMed/NCBI
|
|
8
|
Ott C, Gerken M, Hirsch D, Fest P,
Fichtner-Feigl S, Munker S, Schnoy E, Stroszczynski C, Vogelhuber
M, Herr W, et al: Advanced mucinous colorectal cancer:
Epidemiology, prognosis and efficacy of chemotherapeutic treatment.
Digestion. 98:143–152. 2018. View Article : Google Scholar : PubMed/NCBI
|
|
9
|
Verhulst J, Ferdinande L, Demetter P and
Ceelen W: Mucinous subtype as prognostic factor in colorectal
cancer: A systematic review and meta-analysis. J Clin Pathol.
65:381–388. 2012. View Article : Google Scholar : PubMed/NCBI
|
|
10
|
Catalano V, Bergamo F, Cremolini C,
Vincenzi B, Negri F, Giordani P, Alessandroni P, Intini R,
Stragliotto S, Rossini D, et al: Clinical impact of first-line
bevacizumab plus chemotherapy in metastatic colorectal cancer of
mucinous histology: A multicenter, retrospective analysis on 685
patients. J Cancer Res Clin Oncol. 146:493–501. 2020. View Article : Google Scholar : PubMed/NCBI
|
|
11
|
Huang A, Yang Y, Shi JY, Li YK, Xu JX,
Cheng Y and Gu J: Mucinous adenocarcinoma: A unique
clinicopathological subtype in colorectal cancer. World J
Gastrointest Surg. 13:1567–1583. 2021. View Article : Google Scholar : PubMed/NCBI
|
|
12
|
Miyakawa T, Kawamura H, Honda M, Takano Y,
Kinuta S, Kamiga T, Yamazaki S, Muto A, Shiraso S, Yamashita N, et
al: Impact of histological subtype on prognosis in stage IV
colorectal cancer: A population-based cohort study. PLoS One.
17:e02646522022. View Article : Google Scholar : PubMed/NCBI
|
|
13
|
Meguid RA, Slidell MB, Wolfgang CL, Chang
DC and Ahuja N: Is there a difference in survival between right-
versus left-sided colon cancers? Ann Surg Oncol. 15:2388–2394.
2008. View Article : Google Scholar : PubMed/NCBI
|
|
14
|
Saravani K, Salarzaei M and Parooie F:
Effect of KRAS and BRAF mutations in metastatic colorectal cancer
patients: A systematic review and meta-analysis based on tumor
sidedness and KRAS subtypes. Hum Antibodies. 29:275–284. 2021.
View Article : Google Scholar : PubMed/NCBI
|
|
15
|
Catalano V, Loupakis F, Graziano F,
Torresi U, Bisonni R, Mari D, Fornaro L, Baldelli AM, Giordani P,
Rossi D, et al: Mucinous histology predicts for poor response rate
and overall survival of patients with colorectal cancer and treated
with first-line oxaliplatin- and/or irinotecan-based chemotherapy.
Br J Cancer. 100:881–887. 2009. View Article : Google Scholar : PubMed/NCBI
|
|
16
|
Maisano R, Azzarello D, Maisano M, Mafodda
A, Bottari M, Egitto G and Nardi M: Mucinous histology of colon
cancer predicts poor outcomes with FOLFOX regimen in metastatic
colon cancer. J Chemother. 24:212–216. 2012. View Article : Google Scholar : PubMed/NCBI
|
|
17
|
Moretto R, Morano F, Ongaro E, Rossini D,
Pietrantonio F, Casagrande M, Antoniotti C, Corallo S, Marmorino F,
Cortiula F, et al: Lack of benefit from Anti-EGFR treatment in RAS
and BRAF wild-type metastatic colorectal cancer with mucinous
histology or mucinous component. Clin Colorectal Cancer.
18:116–124. 2019. View Article : Google Scholar : PubMed/NCBI
|
|
18
|
Zhou YW, Long YX, Chen Y, Liu JY, Pu D,
Huang JY, Bi F, Li Q, Gou HF and Qiu M: First-line therapy of
bevacizumab plus chemotherapy versus cetuximab plus chemotherapy
for metastatic colorectal cancer patients with mucinous
adenocarcinoma or mucinous component. Cancer Med. 10:3388–3402.
2021. View Article : Google Scholar : PubMed/NCBI
|
|
19
|
Wang C, Sandhu J and Fakih M: Mucinous
histology is associated with resistance to anti-EGFR therapy in
patients with left-sided RAS/BRAF wild-type metastatic colorectal
cancer. Oncologist. 27:104–109. 2022. View Article : Google Scholar : PubMed/NCBI
|
|
20
|
Washington K: Excisional biopsy
(polypectomy), local excision (transanal disk excision), colectomy
(total, partial, or segmental resection), rectal resection (low
anterior resection or abdominoperineal resection). College of
American Pathologists; Northfield, IL: 2012
|
|
21
|
Eisenhauer EA, Therasse P, Bogaerts J,
Schwartz LH, Sargent D, Ford R, Dancey J, Arbuck S, Gwyther S,
Mooney M, et al: New response evaluation criteria in solid tumours:
revised RECIST guideline (version 1.1). Eur J Cancer. 45:228–247.
2009. View Article : Google Scholar : PubMed/NCBI
|
|
22
|
Negri FV, Wotherspoon A, Cunningham D,
Norman AR, Chong G and Ross PJ: Mucinous histology predicts for
reduced fluorouracil responsiveness and survival in advanced
colorectal cancer. Ann Oncol. 16:1305–1310. 2005. View Article : Google Scholar : PubMed/NCBI
|
|
23
|
Mekenkamp LJ, Heesterbeek KJ, Koopman M,
Tol J, Teerenstra S, Venderbosch S, Punt CJA and Nagtegaal ID:
Mucinous adenocarcinomas: Poor prognosis in metastatic colorectal
cancer. Eur J Cancer. 48:501–509. 2012. View Article : Google Scholar : PubMed/NCBI
|
|
24
|
Lan YT, Chang SC, Lin PC, Lin CC, Lin HH,
Huang SC, Lin CH, Liang WY, Chen WS, Jiang JK, et al:
Clinicopathological and molecular features of colorectal cancer
patients with mucinous and non-mucinous adenocarcinoma. Front
Oncol. 11:6201462021. View Article : Google Scholar : PubMed/NCBI
|
|
25
|
O'Connell E, Reynolds IS, Salvucci M,
McNamara DA, Burke JP and Prehn JHM: Mucinous and non-mucinous
colorectal cancers show differential expression of chemotherapy
metabolism and resistance genes. Pharmacogenomics J. 21:510–519.
2021. View Article : Google Scholar : PubMed/NCBI
|
|
26
|
Reynolds IS, O'Connell E, Fichtner M,
McNamara DA, Kay EW, Prehn JHM, Furney SJ and Burke JP: Mucinous
adenocarcinoma is a pharmacogenomically distinct subtype of
colorectal cancer. Pharmacogenomics J. 20:524–532. 2020. View Article : Google Scholar : PubMed/NCBI
|
|
27
|
Cantero-Recasens G, Alonso-Marañón J,
Lobo-Jarne T, Garrido M, Iglesias M, Espinosa L and Malhotra V:
Reversing chemorefraction in colorectal cancer cells by controlling
mucin secretion. Elife. 11:e739262022. View Article : Google Scholar : PubMed/NCBI
|