Introduction
Copper is an essential micronutrient and is required
for a wide range of physiological processes in all cell types in
humans. Therefore, copper homeostasis is highly important and the
accumulation of intracellular copper can lead to oxidative stress,
resulting in perturbed cellular function. Recently, a new pattern
of cell death, named copper-dependent death, has been reported and
its mechanism was distinct from other mechanisms known to regulate
cell death as it was demonstrated to occur through the direct
binding of copper to lipid components of the tricarboxylic acid
(TCA) cycle (1). The
dihydrolipoamide dehydrogenase (DLD) gene encodes a member of the
class-I pyridine nucleotide-disulfide oxidoreductase family, and is
a key regulator of the TCA cycle that has also been identified as a
moonlighting protein based on its ability to regulate energy
metabolism and the cell cycle (2).
In the TCA cycle, DLD catalyzes the reduction of NAD+ to
NADH in the second dehydration step (3). Previous studies have found that DLD is
one of seven genes (FDX1, LIPT1, LIAS, DLD, DLAT, PDHA1, and PDHB)
that are involved in copper-dependent death (1,4). Among
these genes, FDX1 is a reductase known to reduce Cu2+ to
its more toxic form, Cu+, and to be a direct target of
elesclomol (4). LIPT1, LIAS, and
DLD are components of the lipoic acid pathway, and DLAT, PDHA1, and
PDHB are protein targets of lipoylation (1,4,5). Tumor
cells depend on glutaminolysis fuelling to carry out the TCA cycle
and essential biosynthetic processes supporting tumor growth, and
DLD, a dehydrogenase found in several multi-enzyme complexes that
regulate energy metabolism, plays an important role in the tumor
biological process (2). It is
therefore important to perform a pan-cancer expression analysis of
copper-induced cell death-associated genes. This information can be
used to assess their association with clinical prognosis and asses
their underlying molecular functions mechanistically. A pan-cancer
analysis of FDX1 was recently conducted, and it was demonstrated
that FDX1 was significantly associated with immune-related pathways
(6). The expression level of FDX1
was also demonstrated to be correlated with immune cell
infiltration, immune checkpoint genes, and immune regulatory genes
(6).
To the best of our knowledge, there is currently no
pan-cancer evidence based on clinical big data that demonstrated
the relationship between DLD and various tumor types. Therefore,
the aim of the present study was to use publicly available
databases to conduct a pan-cancer analysis of DLD, including an
analysis of the DLD expression profile, DLD genetic alteration
associated with survival status and the degree of immune
infiltration. In addition, the present study attempted to assess
the possible underlying molecular mechanisms of DLD in different
cancer types.
Materials and methods
Gene expression
In order to explore DLD expression in pan-cancer,
DLD was first inputted into the ‘Gene DE’ module in tumor immune
estimation resource, version 2 (TIMER2; http://timer.cistrome.org/), before the differential
expression of DLD was observed between adjacent normal and tumor
tissues, which compares data from The Cancer Genome Atlas (TCGA)
project. The ‘Expression Analysis-Box Plots’ module in gene
expression profiling interactive analysis, version 2 (GEPIA2:
http://gepia2.cancer-pku.cn) was used to
obtain the differential expression of DLD between the tumor tissues
and the corresponding normal tissues. Using GEPIA, expression data
in normal tissues were obtained from the genotype-tissue expression
(GTEx) database and TCGA normal data, whereas tumor tissues data
were obtained from the TCGA. In addition, violin plots of DLD
expression at different pathological stages of the tumors were
obtained from GEPIA2 in the ‘stage plots’ module, an interactive
web resource for analyzing cancer Omics data. The University of
Alabama at Birmingham CANcer data analysis Portal (UALCAN;
http://ualcan.path.uab.edu/) was used
for DLD protein expression analysis using the ‘CPTAC’ module.
Survival prognosis
The ‘Survival Map’ module of GEPIA2 was used to
obtain the overall survival (OS) and disease-free survival (DFS)
significance of DLD in 33 tumor types. In the ‘Group Cutoff’ module
‘Median’ was selected, then high (≥50%) and low (<50%) cut-off
values of the expression threshold were used to split the cohorts
into high and low expression groups.
Genetic alteration
In cBioPortal web (https://www.cbioportal.org/), ‘DLD’ was entered into
the ‘Quickselect’ section before ‘TCGA Pan Cancer Atlas Studies’
was selected. The alteration frequency, mutation type and Copy
Number alteration (CNA) of DLD across all TCGA tumors were found in
the ‘Cancer Types Summary’ module. The ‘Comparison’ module was then
used to obtain the data on the OS, DFS, progression-free, and
disease-free survival differences, in addition to the Kaplan-Meier
plots with log-rank P-values.
Immune infiltration
In the TIMER2 web server, the ‘Immune-Gene’ module
was used to explore the association between the degree of immune
infiltration and DLD expression in tumors. Spearson's correlation
analysis in TIMER2 was used to assess this association. As
cancer-associated fibroblasts and CD8+ play a key role
in the tumor microenvironment, cancer-associated fibroblasts and
CD8+ T-cells were selected for analysis. The ‘TIMER’,
‘CIBERSORT-ABS’, ‘CIBERSORT’, ‘XCELL’, ‘QUANTISEQ’, ‘EPIC’, and
‘MCPCOUNTER’ algorithms were applied for the estimation of immune
infiltration. A heatmap and a scatter plot were generated for the
data.
DLD-related gene enrichment
analysis
A single protein name ‘DLD’ was inputted whereas the
organism ‘Homo sapiens’ was selected in the Search Tool for the
Retrieval of Interacting Genes/Proteins (STRING, version 11.5;
http://string-db.org/) online tool. The main
parameters were as follows: i) ‘Low confidence (0.150)’; ii)
‘evidence’; iii) ‘no more than 50 interactors’; and iv)
‘experiments’. Finally, a list of potential DLD-binding proteins
were obtained. The top 100 DLD-correlated targeting genes were also
obtained using the ‘Similar Gene Detection’ module of GEPIA, and a
threshold of 0.6. In addition, in TIMER2, using the ‘gene_corr’
module, gene scatter plots and a heatmap of ‘purity’ and
‘infiltration level’ were obtained. Jvenn (7) was then used to compare the DLD-binding
proteins from STRING and to obtain the related genes from GEPIA,
and the overlap areas represented the common genes of the two
groups. In addition, Kyoto Encyclopedia of Genes and Genomes (KEGG)
(https://www.genome.jp/kegg/) was used
for pathway analysis, using the threshold of a count >3, and
P<0.05. The enriched pathways were visualised with the ‘ggplot2’
R packages (8).
Cell culture
The human ovarian cancer cell line OC3 (cat. no.
HTB-161) was obtained from American Type Culture Collection and the
normal ovarian epithelial cell line IOSE80 (cat. no. CM-H049) was
obtained from Shanghai Gaining Biotechnology Co., Ltd. Dulbecco's
modified Eagle's medium (DMEM) (Invitrogen; Thermo Fisher
Scientific, Inc.) supplemented with 10% Fetal Bovine Serum (FBS)
(Invitrogen; Thermo Fisher Scientific, Inc.) and 1%
penicillin/streptomycin were used to culture the cells at 37°C in a
5% CO2 incubator.
siRNA transfection
Small interfering RNA (siRNA) was purchased from
Shanghai GenePharma Co., Ltd. Transfections were performed as
described previously (9). OC3 cells
were cultured in DMEM supplemented with 10% FBS in a 6-well plate
until 70% confluence, then transfected with siRNA (20 nM) using
Lipofectamine® 3000 (Invitrogen; Thermo Fisher
Scientific, Inc.), according to the manufacturer's instructions.
Transfection was performed at 37°C for 6 h before changing the
transfection medium with fresh culture medium. The cells were
harvested 48 h post-transfection for reverse
transcription-quantitative PCR (RT-qPCR) analysis. The sequences
used were listed in Table I.
 | Table I.siRNA and negative control
sequences. |
Table I.
siRNA and negative control
sequences.
| Name | Sequence (5′-3′) |
|---|
| DLD siRNA | Sense:
GCACUAAUGUGUAAGACAA |
|
| Antisense:
UUGUCUUACACAUUAGUGC |
| Control DLD
siRNA |
AUGAUGGCACGUCGUACAC |
RT-qPCR
The total RNA was extracted from IOSE80 and OC3
cells using TRIzol® reagent (Invitrogen; Thermo Fisher
Scientific, Inc.), including both siRNA transfected and
untransfected cells. After total RNA was extracted, the EasyScript
One Step gDNA Removal and cDNA Synthesis SuperMix (TransGen Biotech
Co., Ltd.) was used to acquire the first strand cDNA following the
manufacturer's protocols. Next, qPCR was performed using TB
Green® Premix EX Taq™ II (Takara Bio, Inc.) with an
Applied Biosystems 7900 Real-Time PCR System (Thermo Fisher
Scientific, Inc.) with an initial denaturation at 95°C for 30 sec,
followed by 95°C for 5 sec and 60°C for 34 sec by 40 cycles and
extension at 72°C for 5 min; final extension at 72°C for 15 min.
The internal RNA standard was β-actin expression. Expression levels
of RNA were calculated based on the comparative 2−ΔΔCq
method (10). The primers used for
RT-qPCR were provided in Table II.
All reactions were performed in triplicate.
| Table II.Primers for reverse
transcription-quantitative PCR. |
Table II.
Primers for reverse
transcription-quantitative PCR.
| Gene | Primer sequence
(5′-3′) |
|---|
| Dihydrolipoamide | F:
TTACACACACCCTGAAGTTGC |
| dehydrogenase | R:
GGATCTTCACCATGCCATCTG |
| β-actin | F:
TCACCCACACTGTGCCCATCTACGA |
|
| R:
CAGCGGAACCGCTCATTGCCAATGG |
Measuring the intracellular
NAD+/NADH ratio
NAD+/NADH assay kit (cat. no. MET-5018;
Cell Biolabs, Inc.) was used to measure the intracellular
NAD+/NADH ratio following the literature reported
protocol (11). For NAD
measurement, siRNA transfected and untransfected OC3 cells grown in
a 48-well plate were killed with 50 µl HClO4 and then
neutralized with an equal volume of KOH, whereas the opposite was
conducted for NADH extraction with an additional heating step
(60°C, 30 min) between KOH and HClO4 additions. After
the addition of 100 µl 100 mM bicine (pH 8), 50 µl cell extract was
mixed with an equal volume of bicine buffer containing 23 µl/ml
ethanol, 0.17 mg/ml MTT, 0.57 mg/ml phenazine ethosulfate, and 10
µg of alcohol dehydrogenase. Finally, a microplate reader was used
to measure the absorption at 450 nm after 1 h incubation at room
temperature.
Cell proliferation assay
Post-transfection, OC3 cells were seeded at a
density of 1,000 cells per well in 96-well plates. A total of five
wells were used as replicates. A total of 10 µl MTT reagent (5
mg/ml) was incubated with the cells (0, 24, 48, and 72 h groups) at
37°C for 2 h. Subsequently, 150 µl DMSO was added to each of the
wells. A microplate reader was used to measure the absorbance at a
wavelength of 490 nm.
Statistical analysis
GraphPad Prism 8.0 (GraphPad Software, Dotmatics,
Inc.) was used to analyse the data using an unpaired Student's
t-test. Data are presented as the mean ± standard deviation.
P<0.05 was considered to indicate a statistically significant
difference. All proliferation experiments were performed in
triplicate.
Results
Gene expression analysis
In the TCGA datasets, it was found that in
Cholangiocarcinoma (CHOL), liver hepatocellular carcinoma (LIHC),
lung squamous cell carcinoma (LUSC), kidney chromophobe (KICH) and
stomach adenocarcinoma (STAD), the expression of DLD was higher
compared with that in the corresponding control tissues. However,
in bladder urothelial carcinoma (BLCA), colon adenocarcinoma
(COAD), breast invasive carcinoma (BRCA), kidney renal clear cell
carcinoma (KIRC), pheochromocytoma and paraganglioma (PCPG), rectum
adenocarcinoma (READ), prostate adenocarcinoma (PRAD), and thyroid
carcinoma (THCA), the expression of DLD was lower compared with
that the corresponding control tissues (Fig. 1A).
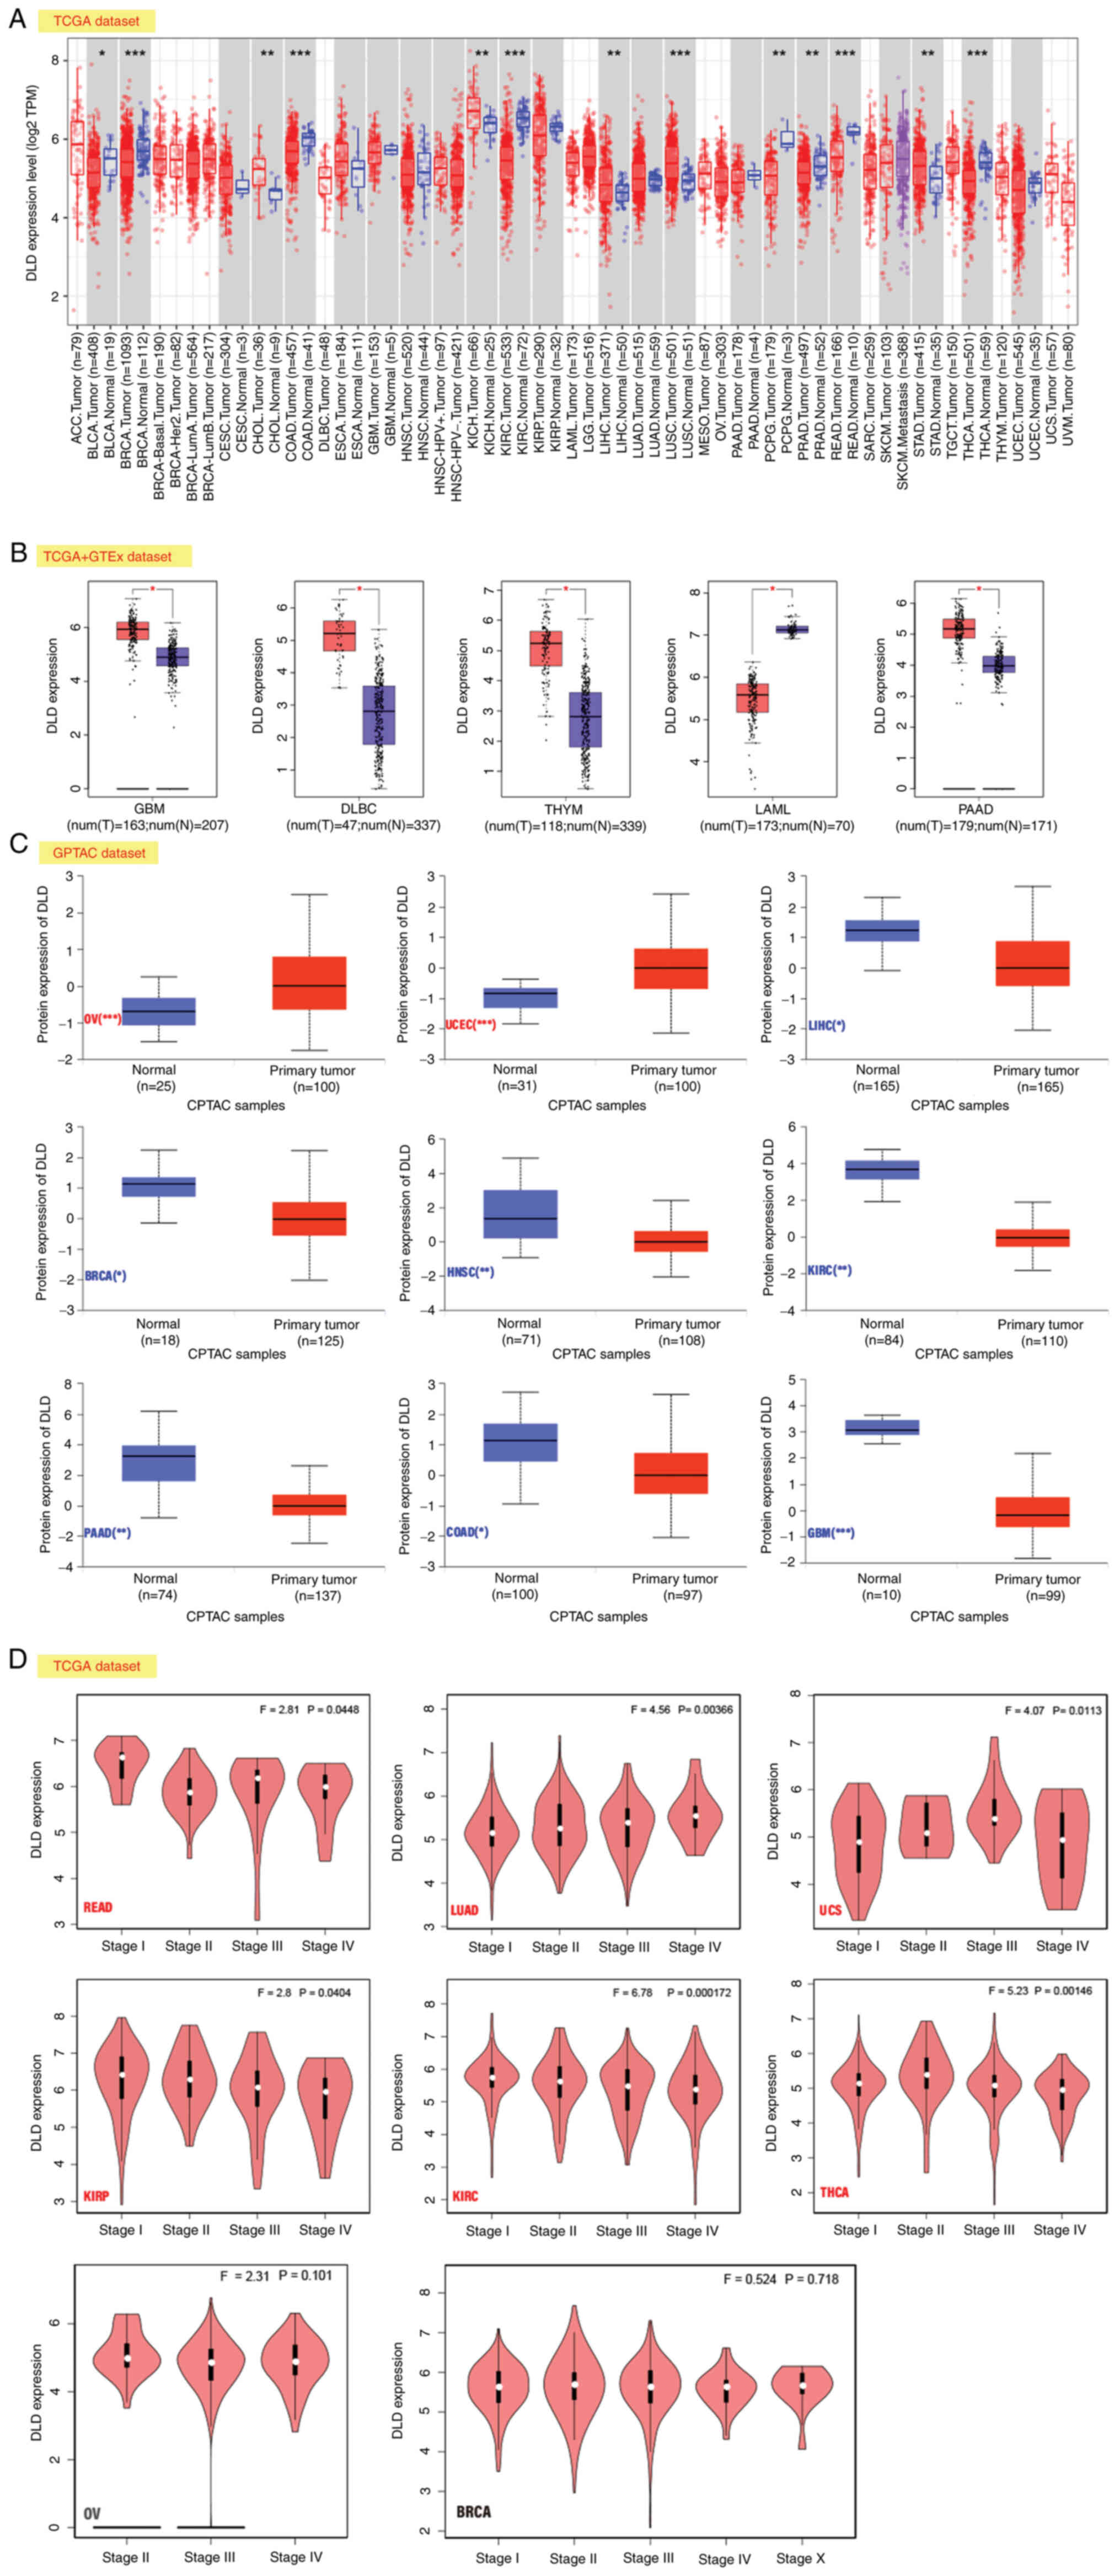 | Figure 1.Expression level of DLD. (A) DLD
expression in different cancers according to TIMER2. (B) DLD
expression levels in GBM, DLBC, THYM, LAML, and PAAD. Data were
taken from TCGA and GTEx databases. The red color indicates DLD
high expression, the blue color indicates DLD low expression. (C)
Comparison of total DLD protein expression levels between normal
tissue and primary tumor tissue according to the CPTAC dataset for
OV, UCEC, LIHC, BRCA, HNSC, KIRC, PAAD, COAD, GBM. (D) Expression
levels of the DLD at different pathological stages in READ, LUAD,
UCS, KIRP, KIRC, THCA, OV and BRCA based on TCGA data. *P<0.05;
**P<0.01; ***P<0.001. DLD, Dihydrolipoamide dehydrogenase;
TIMER2, tumor immune estimation resource; TCGA, The Cancer Genome
Atlas; GTEx, genotype-tissue expression; GBM, glioblastoma
Multiforme; DLBC, lymphoid neoplasm diffuse large B-cell lymphoma;
THYM, thymoma; UCEC, uterine corpus endometrial carcinoma; LAML,
acute myeloid leukemia; READ, rectum adenocarcinoma; PAAD,
pancreatic adenocarcinoma; LUAD, lung adenocarcinoma; UCS, uterine
carcinosarcoma; KIRP, kidney renal papillary cell carcinoma; LIHC,
liver hepatocellular carcinoma; BRCA, breast invasive carcinoma;
HNSC, head and neck squamous cell carcinoma; KIRC, kidney renal
clear cell carcinoma; THCA, thyroid carcinoma; COAD, colon
adenocarcinoma; OV, ovarian serous cystadenocarcinoma. |
The expression profiles of DLD were then evaluated
after including the dataset of normal tissues from GTEx, which
found that DLD expression was higher in glioblastoma multiforme
(GBM), pancreatic adenocarcinoma (PAAD), thymoma (THYM), and
lymphoid neoplasm diffuse large B-cell lymphoma (DLBC). However,
the opposite was found in acute myeloid leukemia (LAML; Fig. 1B).
In ovarian serous cystadenocarcinoma (OV) and
uterine corpus endometrial carcinoma (UCEC), the expression of DLD
was higher compared with that in the normal tissues according to
the results of the CPTAC dataset. By contrast, the expression of
DLD was lower in LIHC, BRCA, head and neck squamous cell carcinoma
(HNSC), PAAD, KIRC, COAD and GBM compared with that in normal
tissues (Fig. 1C).
In READ, lung adenocarcinoma (LUAD), kidney renal
papillary cell carcinoma (KIRP), uterine carcinosarcoma (USC), and
thyroid carcinoma (THCA), the association between DLD expression
and the pathological stages was found to be statistically
significant according to the analysis by the ‘Pathological Stage
Plot’ module of GEPIA. However, in OV and BRCA, there were no
significant associations (Fig.
1D).
The analysis in Fig.
1A is from mRNA expression data obtained from the TCGA database
but the analysis in Fig. 1C is from
protein expression data obtained from the CPTAC database. However,
Fig. 1D is an analysis of the
association between DLD expression and pathological stage, so the
expression levels of DLD in Fig. 1A, C
and D were not similar.
Survival analysis
TCGA datasets were divided into high and low
expression groups according to DLD expression. It was found that in
BRCA, KICH, LUAD and OV, highly expressed DLD was associated with
poor prognosis, specifically OS. By contrast, lower DLD expression
was associated with shorter OS in COAD, KIRC and KIRP (Fig. 2A). In terms of DFS, in lower grade
glioma (LGG) and mesothelioma (MESO), higher DLD expression was
associated with poorer prognosis. However, in KIRC and KIRP, lower
expression of DLD was associated with poor prognosis (Fig. 2B). However, in Fig. 2 there was late time crossover of the
curves, these events may affect the results of the log-rank
analysis. A weighted test, such as the Renyi or Cramer-von Mises
method, should be more appropriate (12). Since the figures were obtained from
GEPIA, a new statistical analysis was not possible.
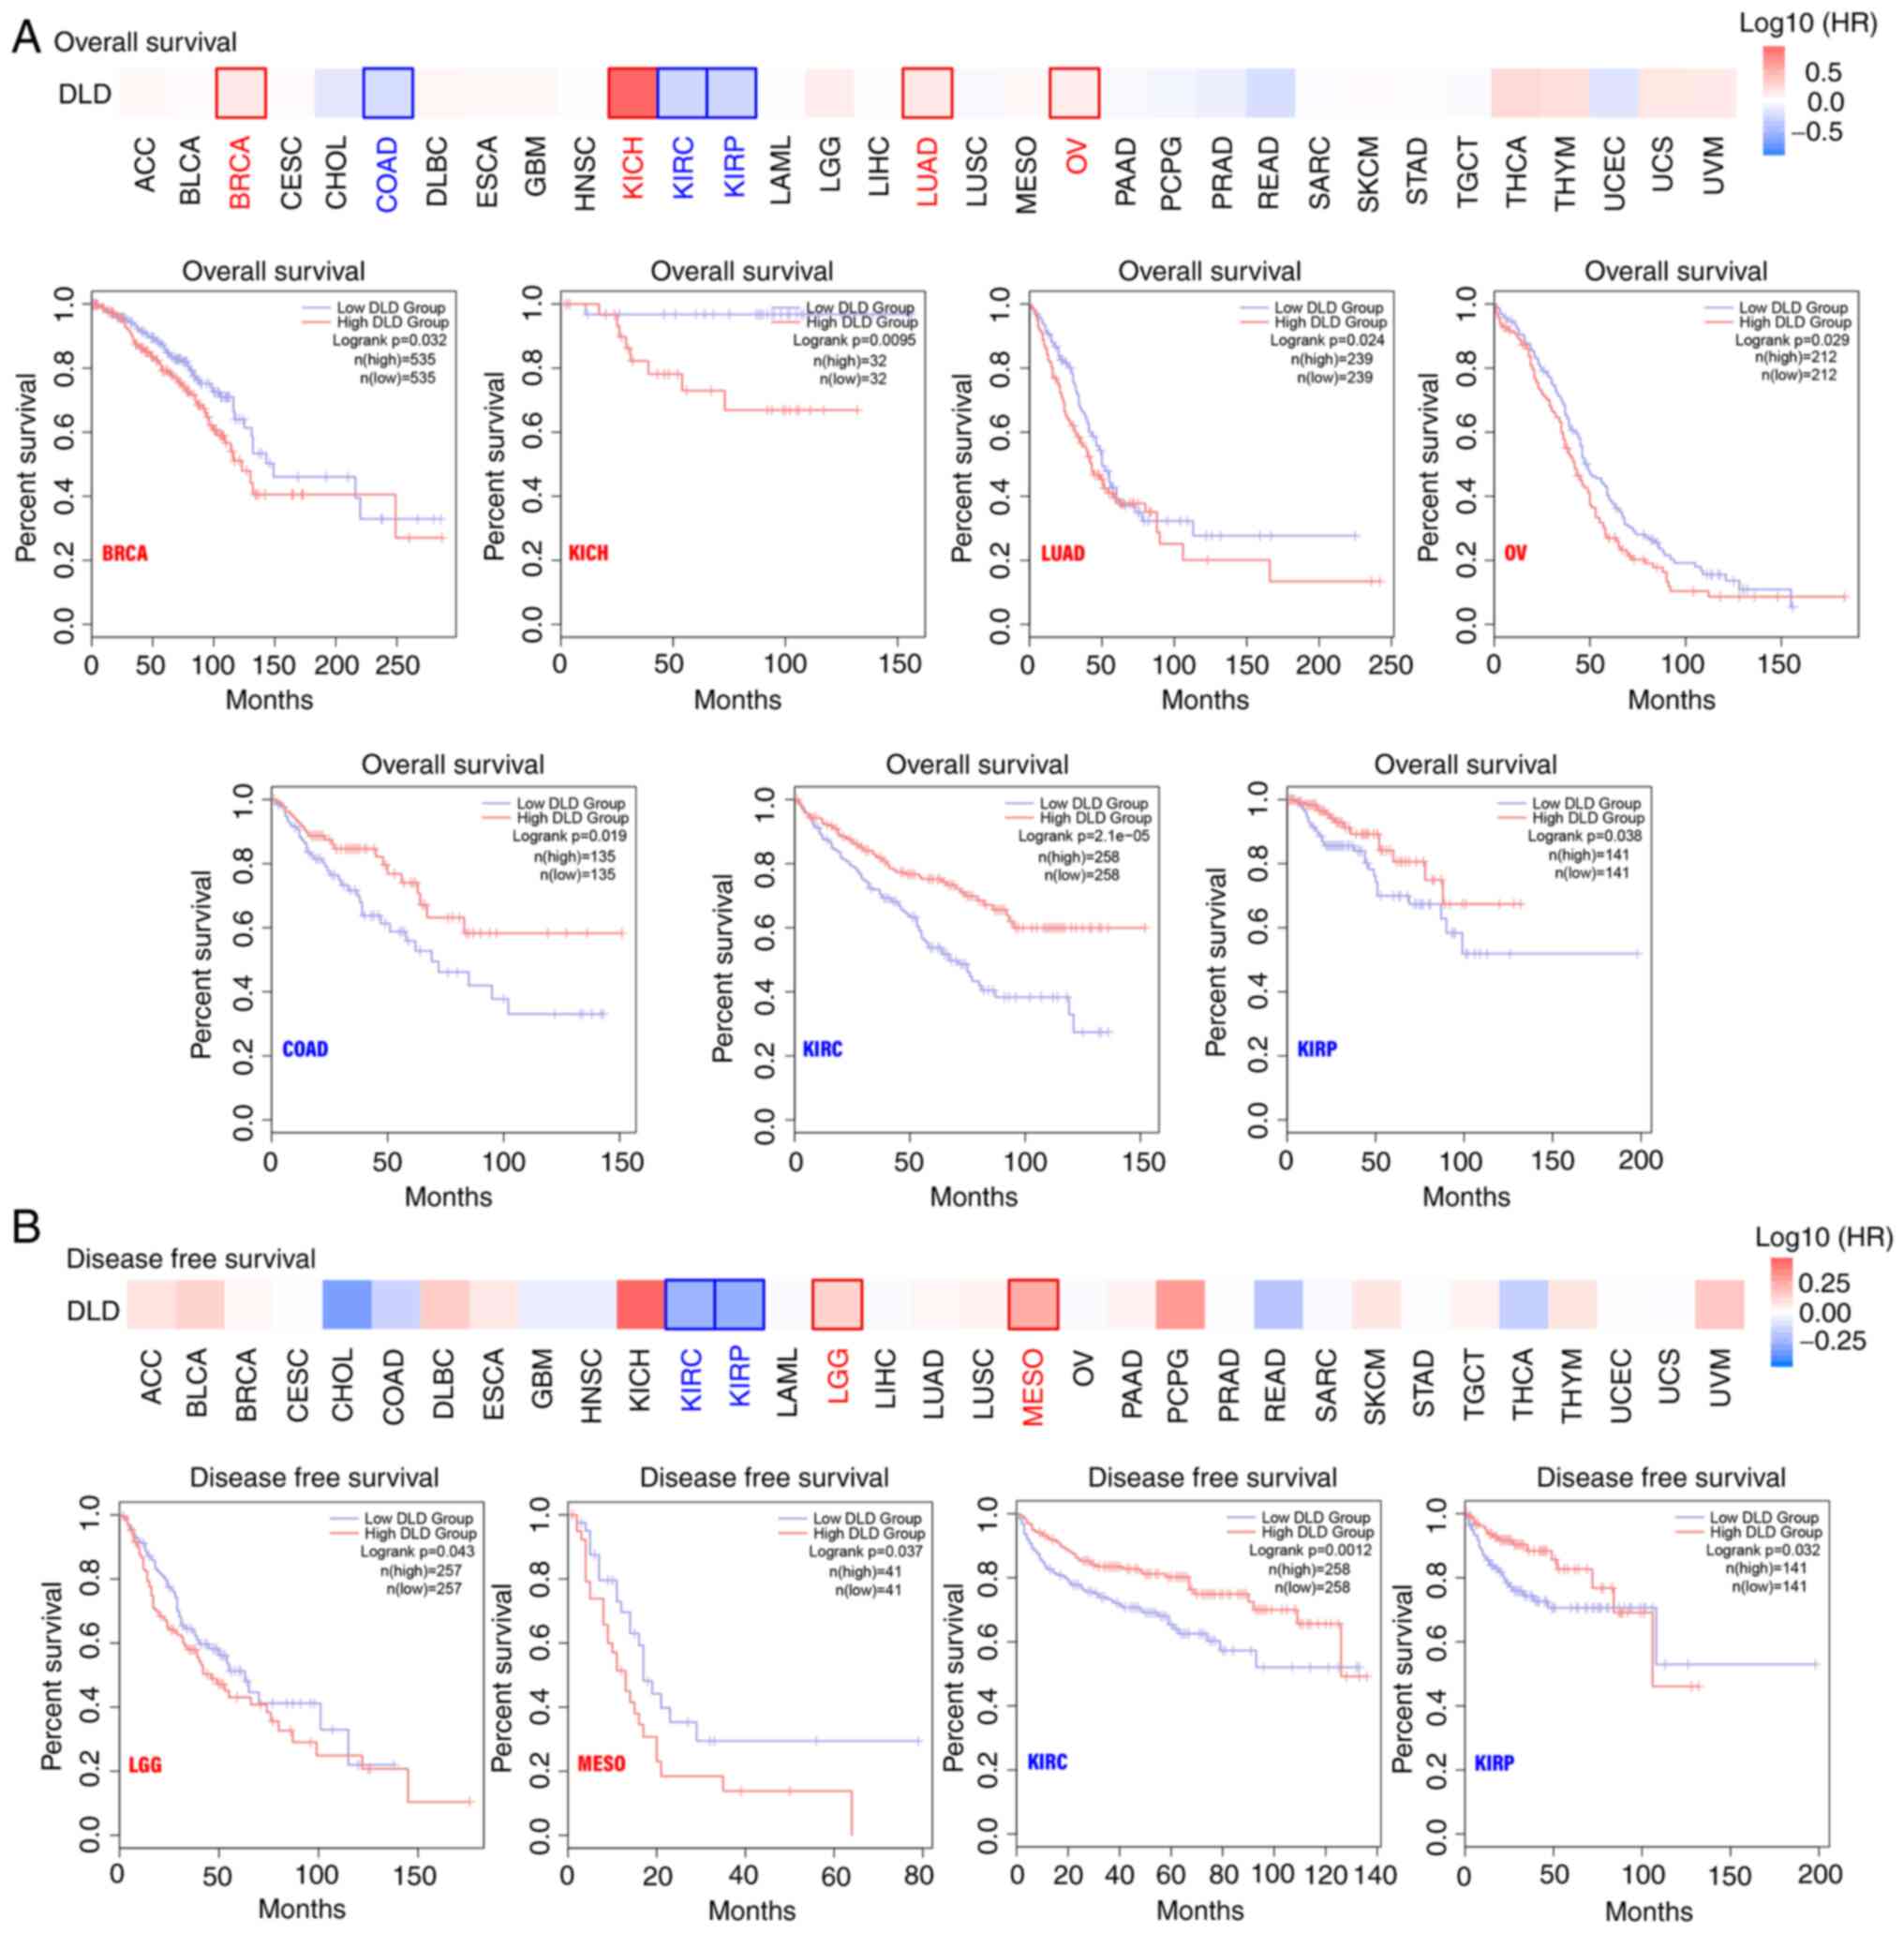 | Figure 2.Relationship between DLD expression
and patient prognosis. The GEPIA2 tool was used to perform (A)
overall survival and (B) disease-free survival analysis. GEPIA,
gene expression profiling interactive analysis; DLD,
Dihydrolipoamide dehydrogenase; BRCA, breast invasive carcinoma;
KICH, kidney chromophobe; LUAD, lung adenocarcinoma; OV, ovarian
serous cystadenocarcinoma; COAD, colon adenocarcinoma; KIRC, kidney
renal clear cell carcinoma; KIRP, kidney renal papillary cell
carcinoma; LGG, brain lower grade glioma; MESO, mesothelioma. |
Genetic alteration analysis
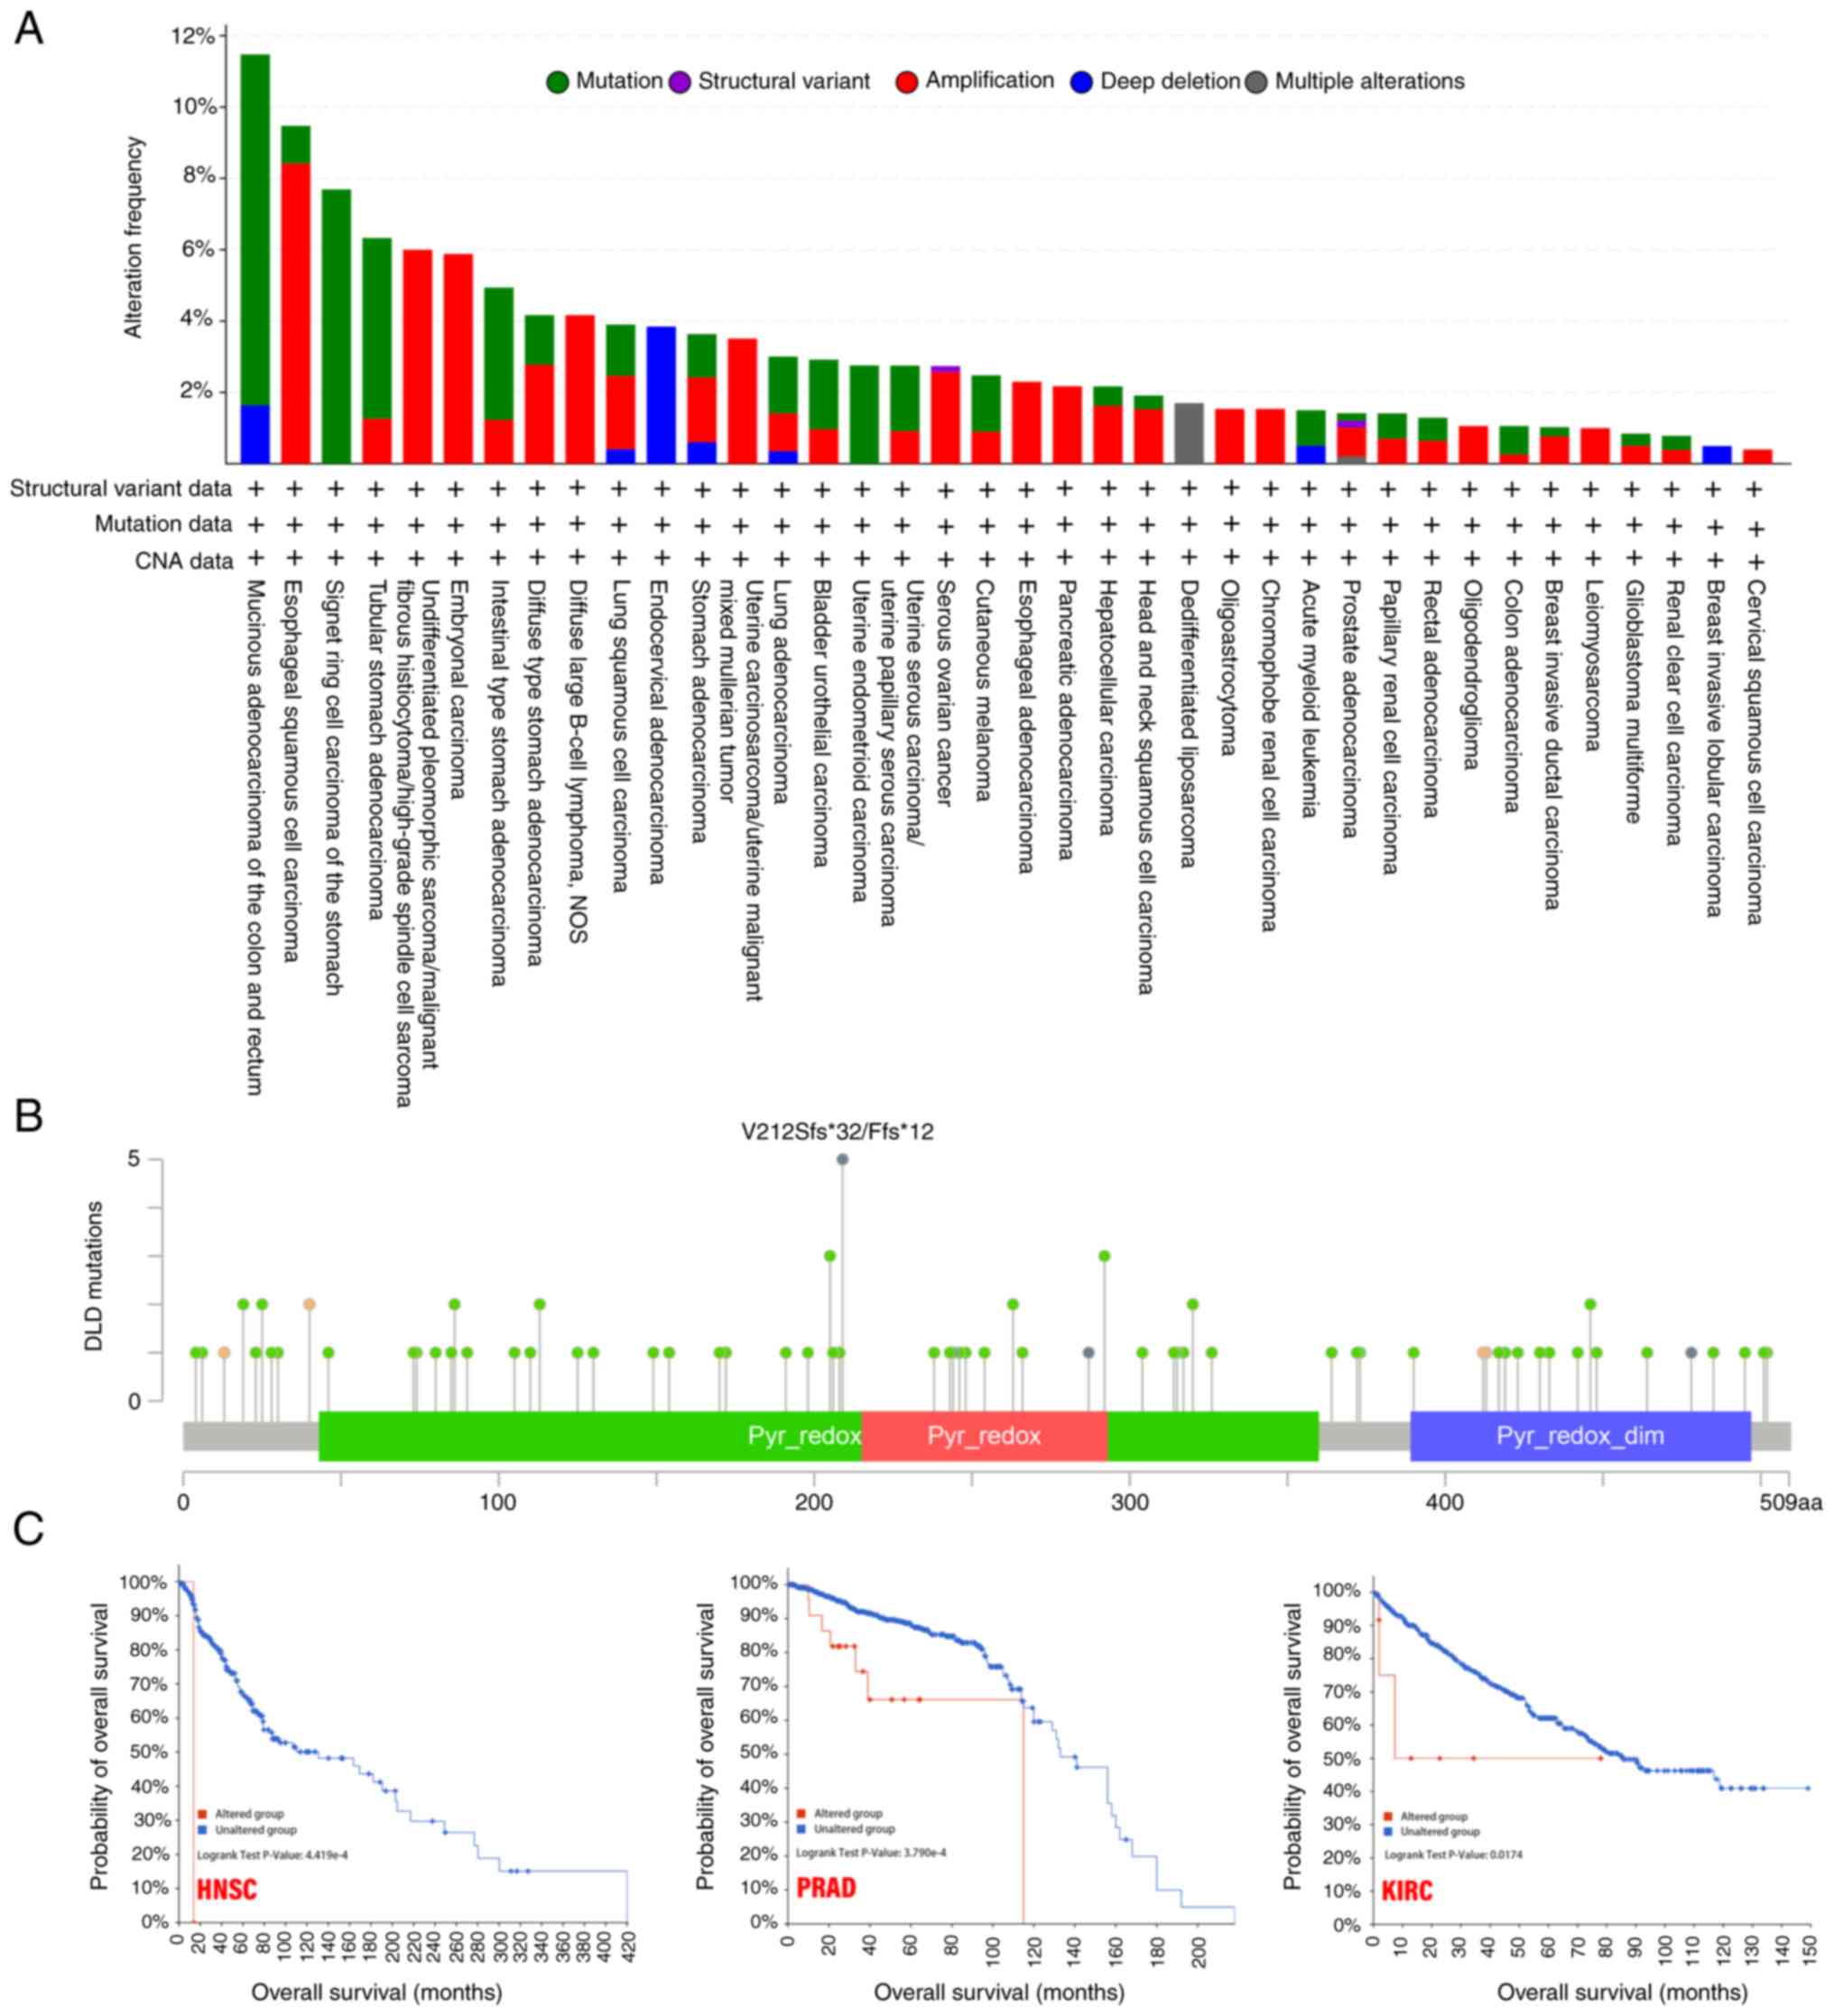
In the different tumor samples, the frequency of
genetic alterations in the DLD gene in a list of cancers was
analyzed. The highest alteration frequency of DLD (>10%)
appeared for patients with mucinous adenocarcinoma of the colon and
rectum, with ‘mutation’ as the primary type. In the
undifferentiated pleomorphic sarcoma/malignant fibrous
histiocytoma/high-grade spindle cell sarcoma cases, ‘amplification’
was the primary type of alteration, with a frequency of ~6%. In
endocervical adenocarcinoma cases, the copy number deletion of DLD
was found to be the most dominant genetic alteration, with a ~4%
frequency (Fig. 3A).
The V212Sfs*32/Ffs*12 alteration in the Pyr_redox
domain was found to be the main type of genetic alteration of DLD
(Fig. 3B). After exploring the
clinical survival prognosis of tumors associated with genetic
alterations of DLD, the results showed that in HNSC, PRAD and KIRC,
the genetic alterations group were associated with poorer prognosis
in terms of OS (Fig. 3C).
Immune infiltration analysis
Tumor-infiltrating immune cells have been previously
implicated in tumor initiation, progression and metastasis
(13). Cancer-associated
fibroblasts can also infiltrate tumors (14). A positive correlation between DLD
expression and the estimated degree of infiltration by
cancer-associated fibroblasts was found in HNSC, and HNSC without
human papillomavirus (HPV) infection. However, there was a negative
correlation between DLD expression and cancer-associated fibroblast
infiltration in KIRC, LUSC, KIRP and THCA (Fig. 4A). Corresponding scatterplot data of
the aforementioned cancers for the correlation between DLD
expression and the estimated infiltration value were also
represented (Fig. 4B).
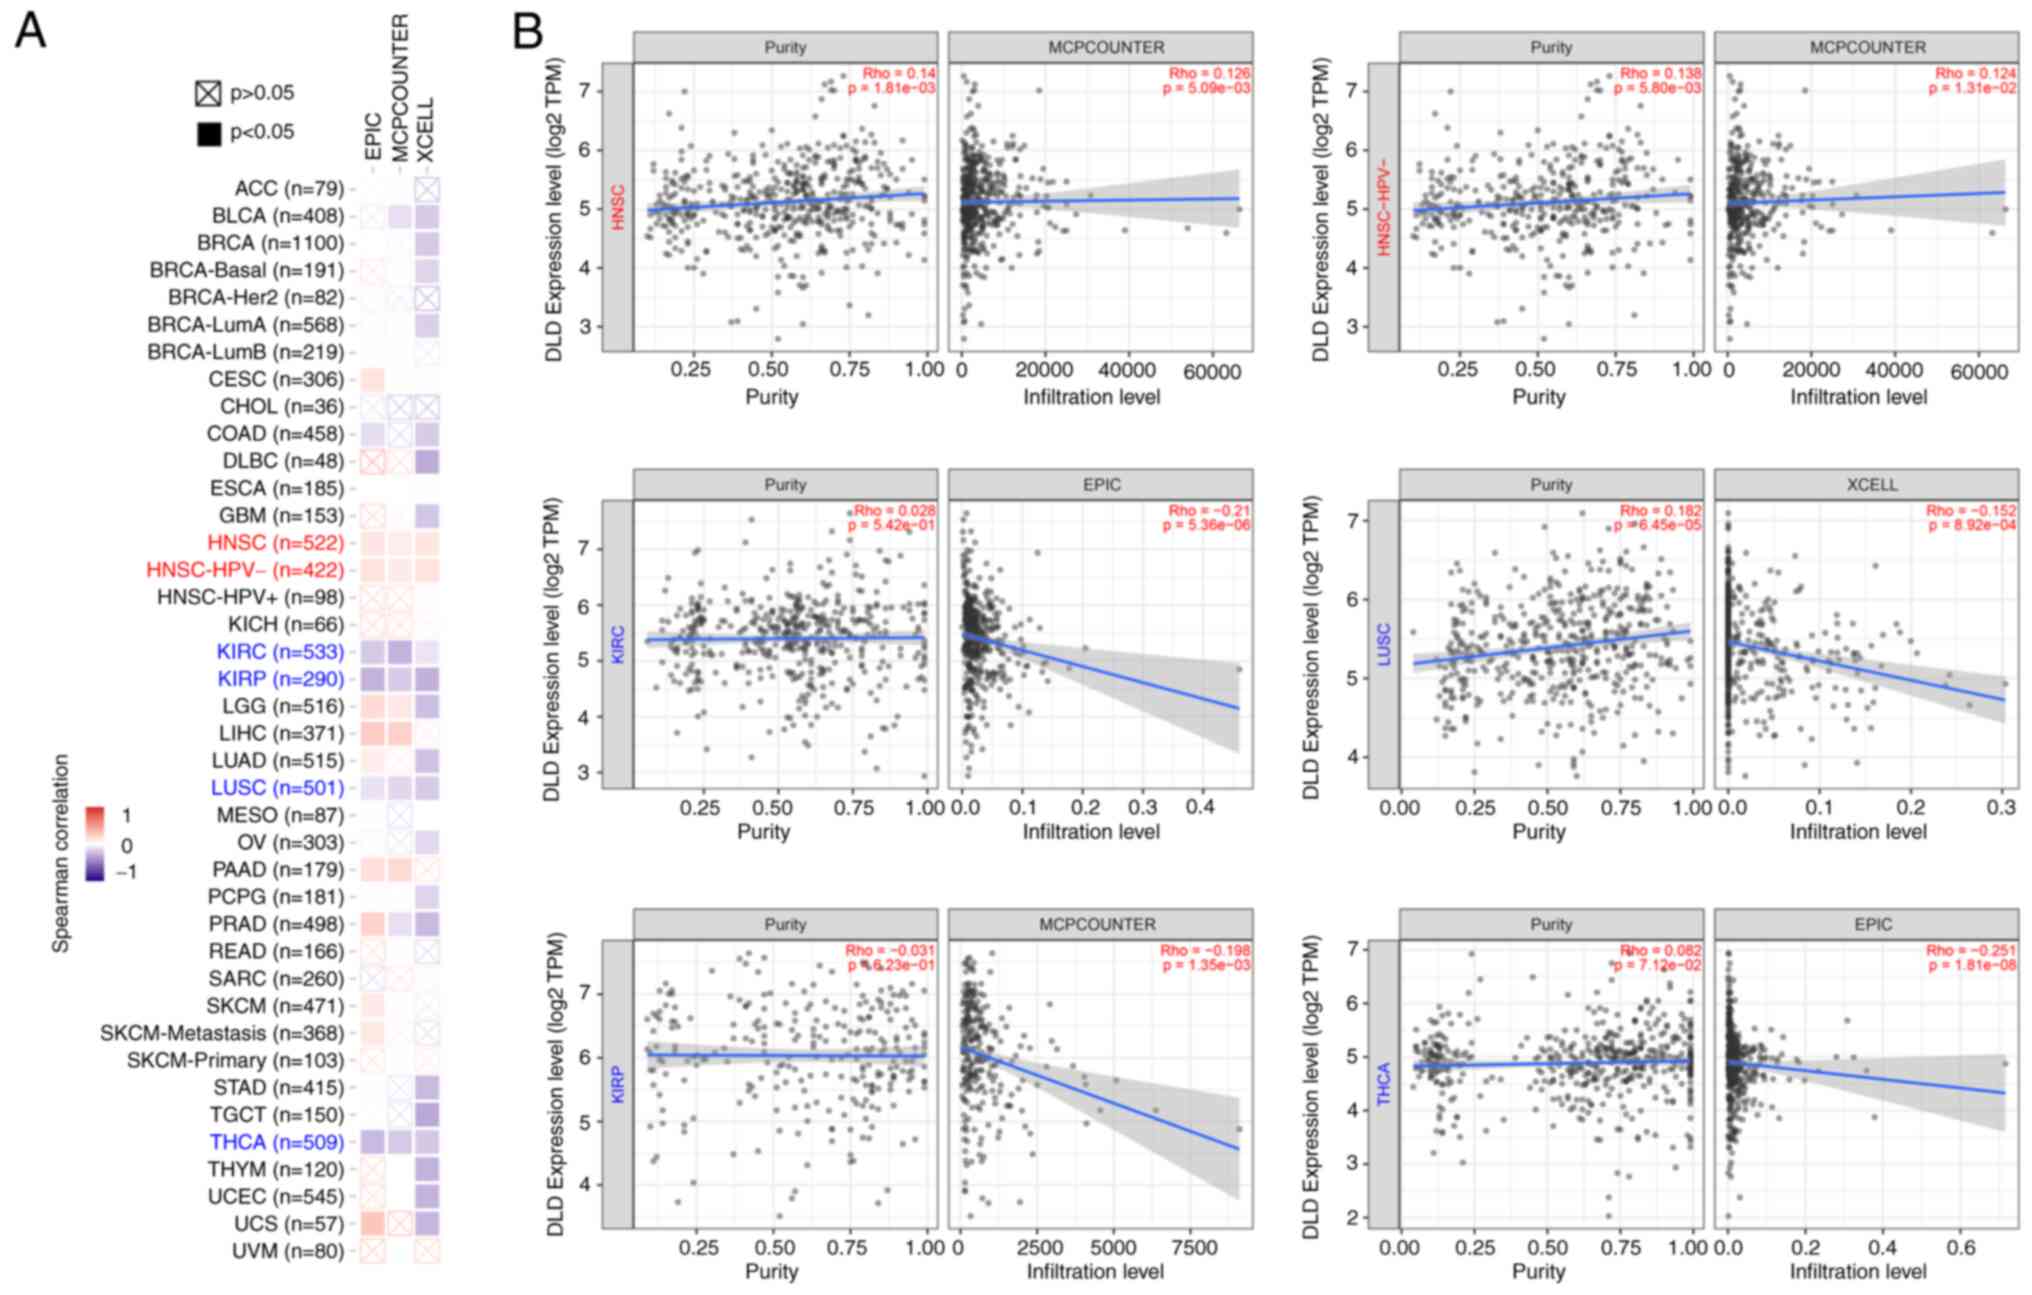 | Figure 4.Relationship between DLD expression
and immune infiltration of fibroblasts associated with cancer. (A)
Heatmap showing the correlation between DLD expression and
infiltration levels of cancer-associated fibroblasts data. (B)
Correlation between DLD expression and the degree of infiltration
by cancer-associated fibroblasts in HNSC, HNSC- HPV-, KIRC, LUSC,
KIRP and THCA. DLD, Dihydrolipoamide dehydrogenase; HNSC, head and
neck squamous cell carcinoma; HNSC-HPV, head and neck squamous cell
carcinoma with human papillomavirus; KIRC, kidney renal clear cell
carcinoma; LUSC, lung squamous cell carcinoma; KIRP, kidney renal
papillary cell carcinoma; THCA, thyroid carcinoma. |
Enrichment analysis
A total of 50 potential DLD-binding proteins were
obtained from the STRING tool to investigate the molecular
mechanisms of DLD in tumorigenesis (Fig. 5A). The top 100 genes associated with
DLD expression were also obtained based on GEPIA. acylglycerol
kinase (AGK), dihydrouridine synthase 4-like (DUS4L), NADH
dehydrogenase Fe-S protein 1 (NDUFS1), peptidase mitochondrial
processing β (PMPCB), and Wiskott-Aldrich syndrome-like (WASL) were
the top five genes that positively associated with DLD expression
(Fig. 5B). The corresponding
heatmap data also showed a positive correlation between DLD
expression and that of the aforementioned five genes in the
majority of the cancer types tested (Fig. 5C). aconitase 2, mitochondrial Fo
complex subunit B1, citrate synthase, cytochrome c, DLAT,
dihydrolipoamide S-succinyltransferase, isocitrate dehydrogenase
3α, NDUFS1, oxoglutarate dehydrogenase, succinate-CoA ligase, and
ubiquinol-cytochrome c reductase core protein II were found to be
in common between the two STRING and GEPIA groups according to Venn
analysis, which mean that these 11 genes were closely related to
DLD (Fig. 5D). KEGG and gene
ontology (GO) enrichment analyses were also performed. It was found
that ‘metabolic pathways’ was the most enriched in the effect of
DLD on tumor pathogenesis by KEGG (Fig.
5E). In addition, ‘cellular metabolic process’ was the pathway
enriched in most genes by GO enrichment analysis (Fig. 5F).
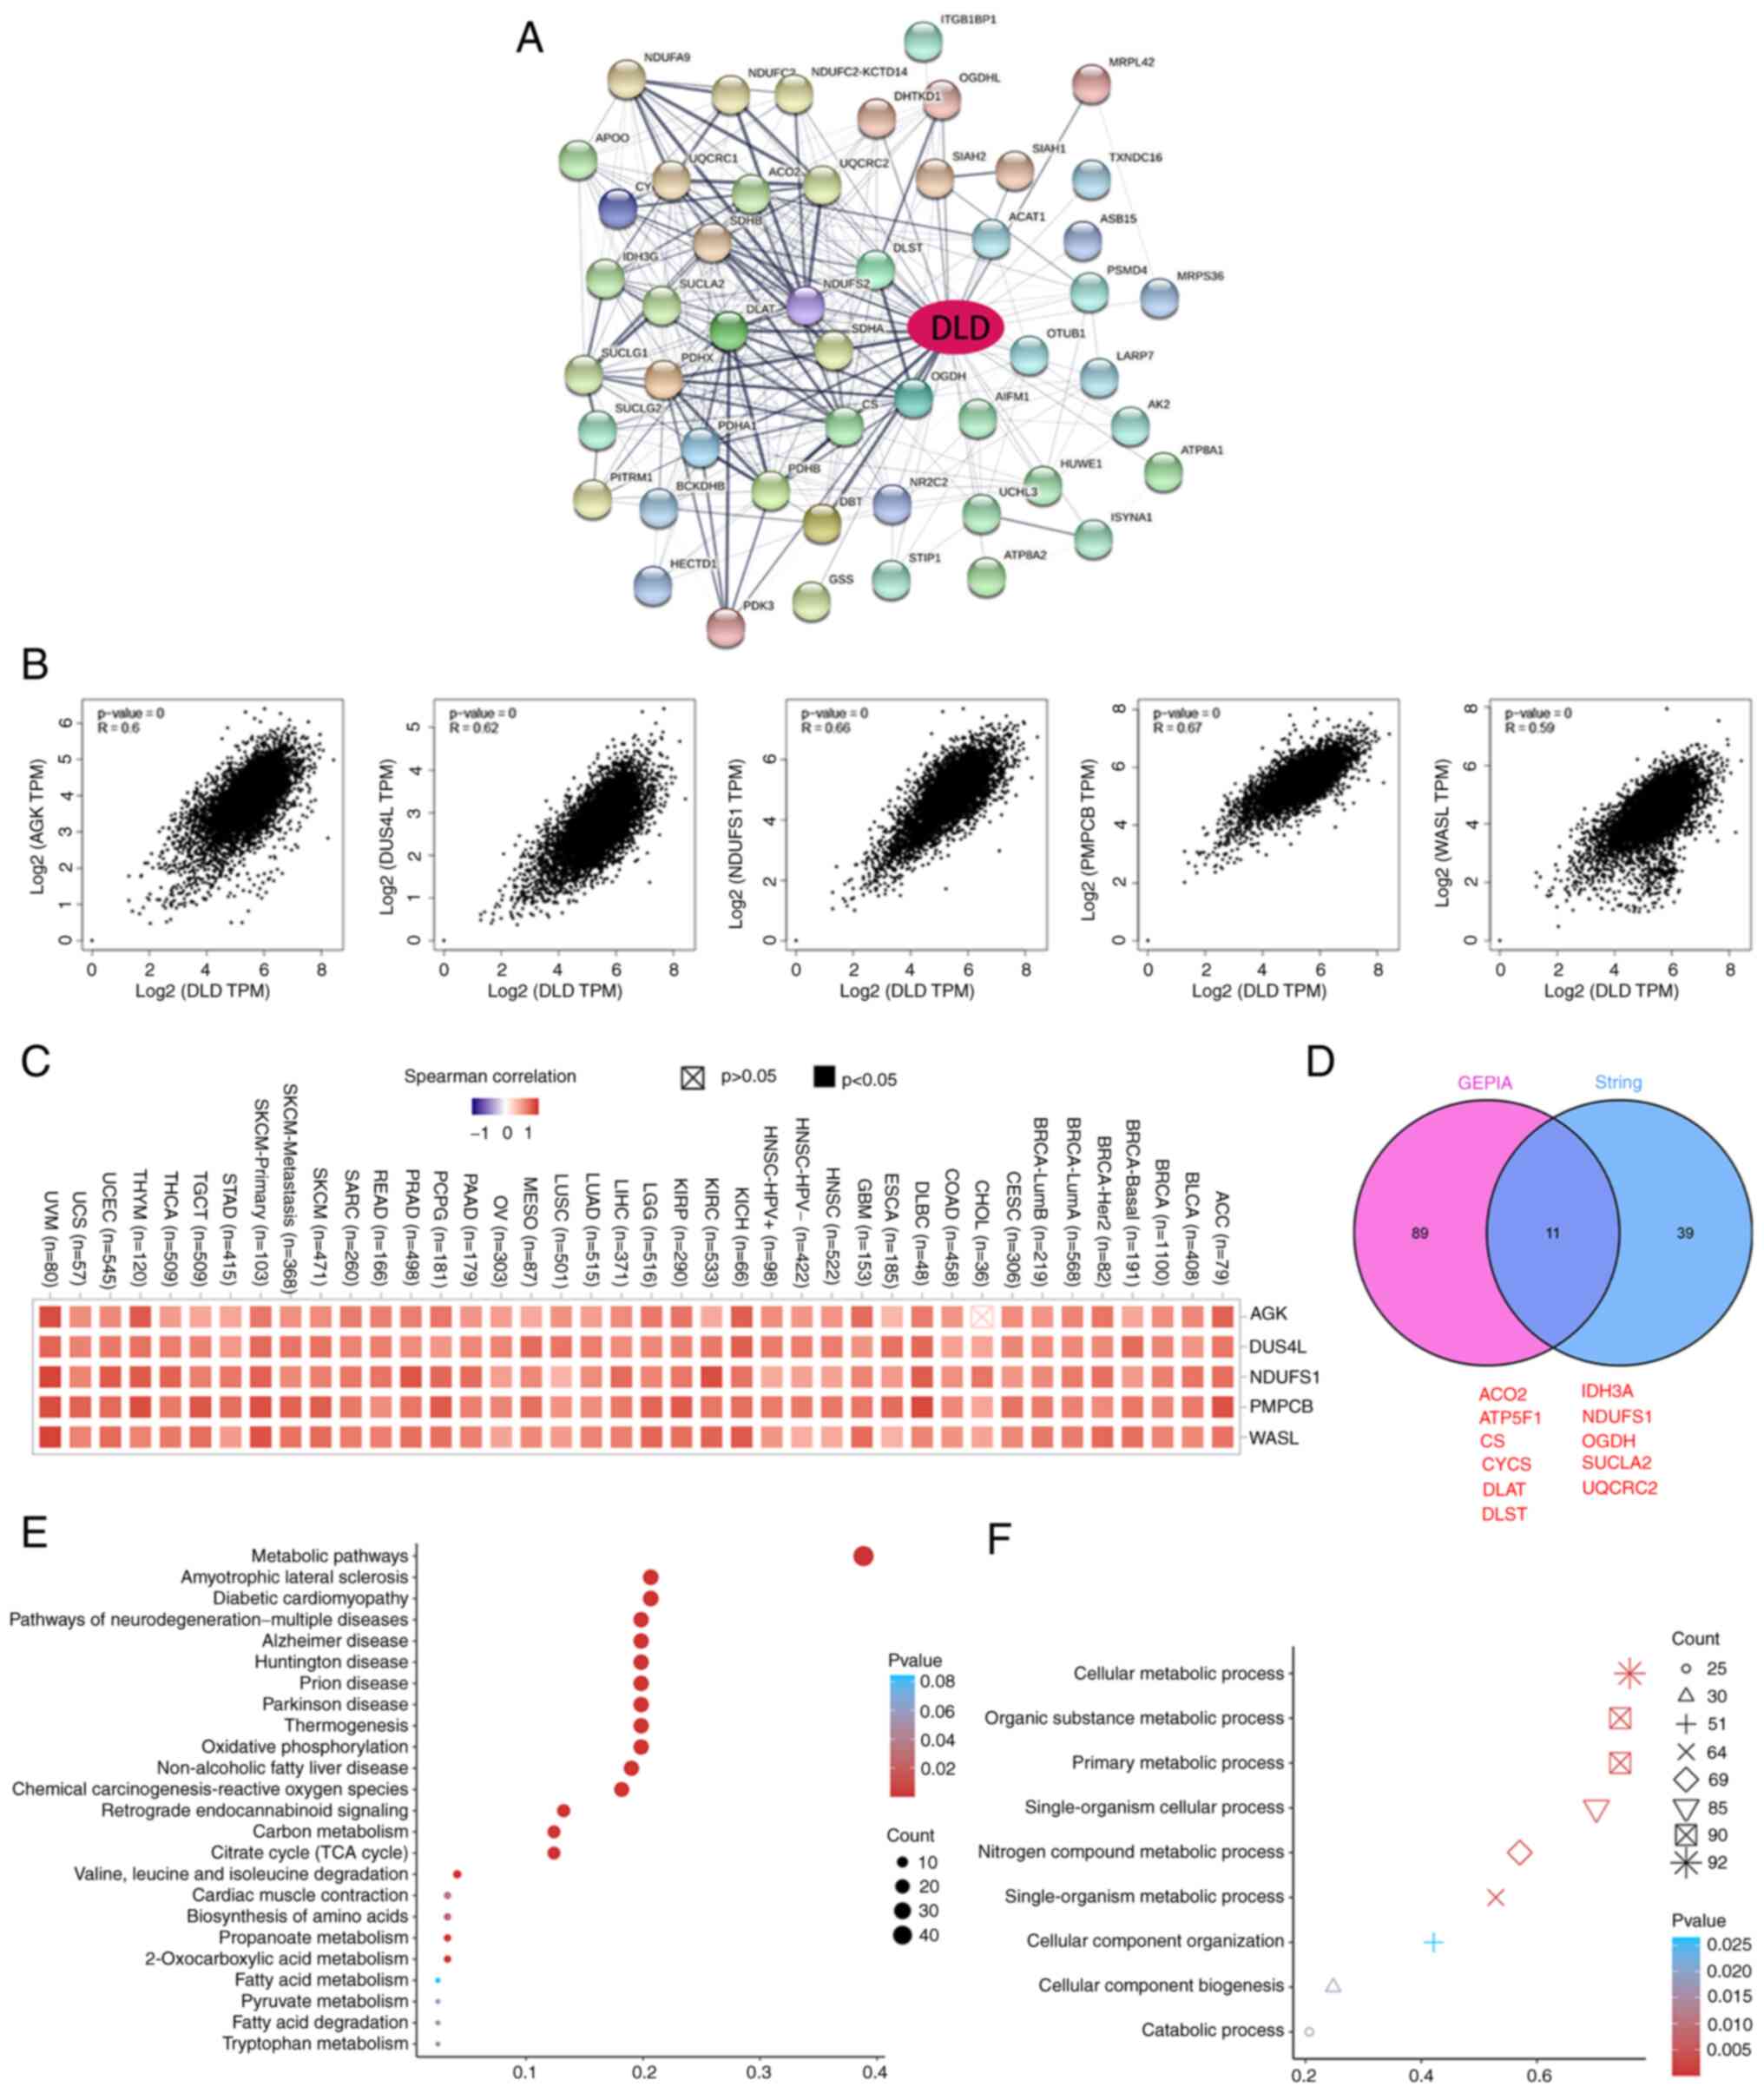 | Figure 5.DLD-related gene enrichment analysis.
(A) Potential DLD-binding proteins were predicted using the Search
Tool for the Retrieval of Interacting Genes/Proteins tool.
Thickness of edge indicates the strength of the correlation. (B)
Top five DLD-correlated genes were found using the gene expression
profiling interactive analysis project. Correlation between DLD
expression and that of the selected target genes AGK, DUS4L,
NDUFS1, PMPCB and WASL are shown. (C) Corresponding heatmap data
for AGK, DUS4L, NDUFS1, PMPCB and WASL in a list of cancers. (D)
DLD-binding proteins and DLD-correlating genes were overlapped by
intersection analysis. (E) Kyoto Encyclopedia of Genes and Genomes
pathway analysis. (F) Molecular function data in Gene Ontology
analysis. DLD, Dihydrolipoamide dehydrogenase; AGK, acylglycerol
kinase; DUS4L, dihydrouridine synthase 4-like; NDUFS1, NADH
dehydrogenase Fe-S protein 1; PMPCB, peptidase mitochondrial
processing β; WASL, Wiskott-Aldrich syndrome-like. ACO2, aconitase
2; ATP5F1, mitochondrial Fo complex subunit B1; CS, citrate
synthase; CYCS, cytochrome c; DLAT, dihydrolipoamide
S-acetyltransferase; DLAST, dihydrolipoamide S-succinyltransferase;
IDH3A, isocitrate dehydrogenase 3α; OGDH, oxoglutarate
dehydrogenase; SUCLA2, succinate-CoA ligase; UQCRC2,
ubiquinol-cytochrome c reductase core protein II. |
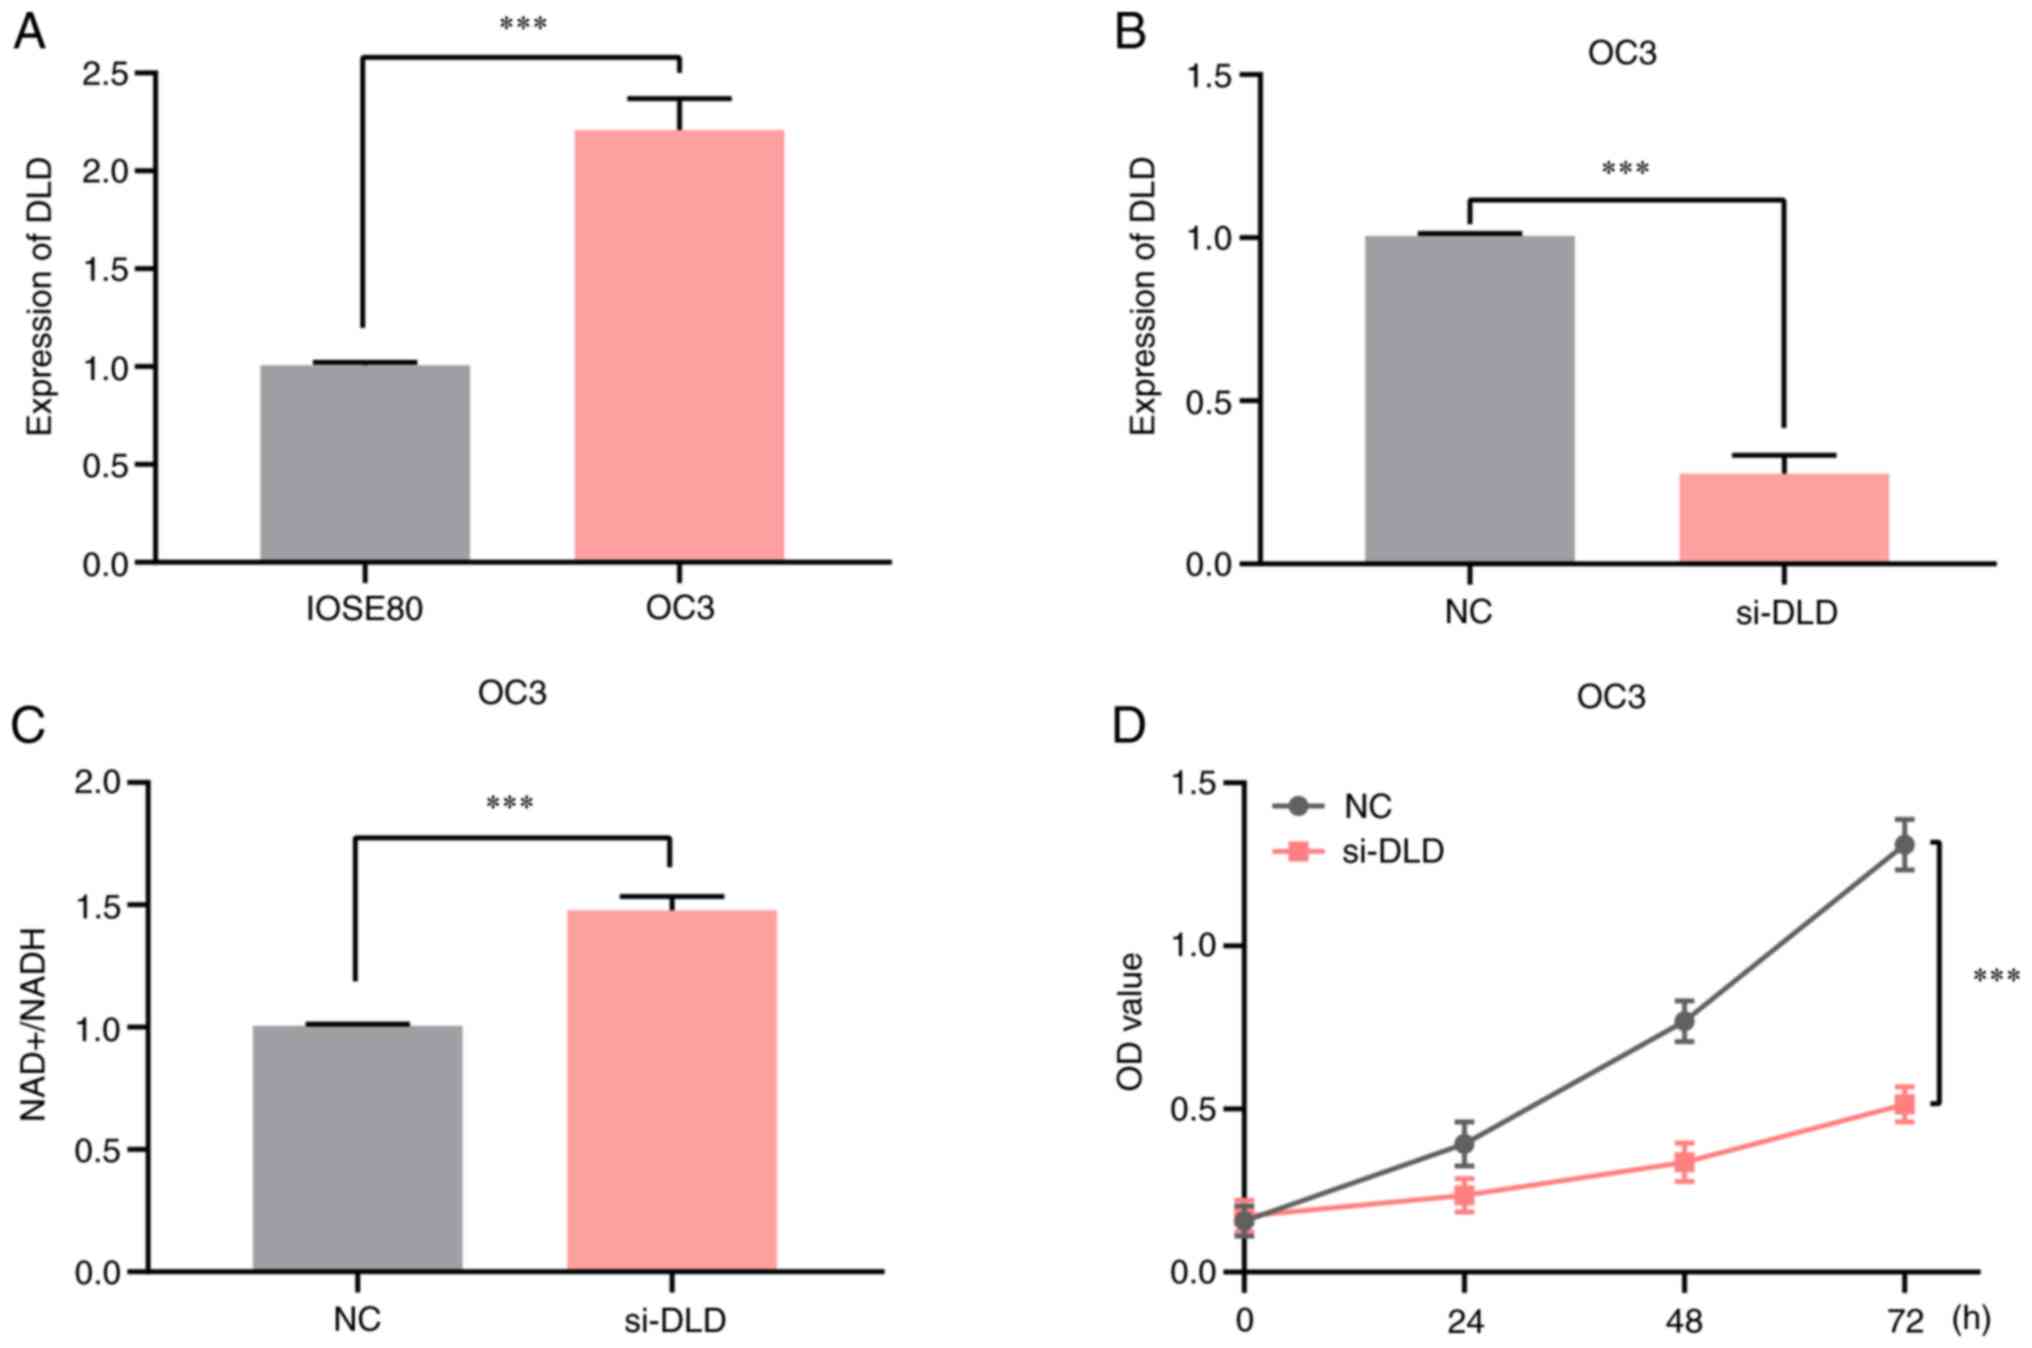
Knocking down DLD expression increases
the NAD+/NADH ratio in OV
Because DLD was highly expressed in ovarian cancer
and associated with a poor prognosis, OV cells were selected for
in vitro experiments. It was showed by RT-qPCR analysis that
the mRNA expression levels of DLD in OC3 cells were significantly
higher compared with those in the normal ovarian epithelial cell
line IOSE80 (Fig. 6A). Next, the
efficiency of the DLD-knockdown was assessed by RT-qPCR (Fig. 6B), and it was found that DLD
expression was successfully decreased. In addition, a significant
increase in the NAD+/NADH ratio was observed in OC3 cell
line compared with that in the negative control group, when DLD
expression was knocked down by DLD-specific siRNA (Fig. 6C), suggesting that the intracellular
NAD+/NADH ratio was regulated by DLD inhibition. Results
of the MTT assay indicated that DLD-knockdown inhibited OC3 cell
proliferation (Fig. 6D). Thus,
these findings suggest that suppressing DLD expression can increase
the NAD+/NADH ratio in OV cells, which inhibited OC3
cell proliferation.
Discussion
A novel form of cell death induced by intracellular
copper has been demonstrated in a recent study, which has been
termed ‘cuproptosis’ and has been previously shown to occur through
affecting TCA cycle (1).
Cuproptosis operates through the binding of copper to one of the
lipoylated components (in particular, the pyruvate dehydrogenase
complex) of the TCA cycle, and DLD is a key regulator of the TCA
cycle (15). DLD has been reported
to participate in a variety of cellular processes in humans, such
as regulating energy metabolism and the cell cycle (16–18).
To the best of our knowledge, the functional relationship between
DLD and tumors has only been reported in four publications to date
(19–22). Therefore, it remains to be fully
elucidated whether DLD may serve significant functions in tumors.
Through a literature search based on the pan-cancer perspective, no
evidence of a pan-cancer analysis of DLD was found. Therefore, in a
total of 33 different tumors, the DLD gene expression profile was
comprehensively examined in the present study based on the online
Bioinformatics databases, where gene expression, genetic
alteration, and immune infiltration were among the parameters
included.
In the present study, DLD was found to be highly
expressed in a number of tumors. Higher levels of DLD expression in
tumors from CHOL, LIHC, LUSC, KICH, and STAD were found compared
with those in the corresponding normal tissues according to
analysis in TIMER2, using data from TCGA. However, the findings
using the CPTAC dataset revealed that in OV and UCEC the expression
of DLD was higher compared with that in normal tissues. Since the
TCGA database was constructed based on the RNA expression level
whereas the data in GPTAC database were based on protein expression
level, the results were not consistent. This finding suggested that
DLD expression is likely to be part of a complex functional network
in tumors, on both RNA and protein levels. Nevertheless, for
survival prognosis, GEPIA was used in the present study to assess
the association between DLD expression and survival. In patients
with BRCA, LUAD, KICH and OV, higher expression of DLD was
associated with poorer prognosis for OS. For DFS, higher DLD
expression was associated with poorer prognosis in patients with
LGG and MESO. This inconsistency may be attributed to the different
carcinogenic mechanisms in the different tumors, which require
further study.
Tumor mutations have been noted for >50 years.
Mutations have been reported to serve an important role in the
occurrence and development of tumors, which have been proposed to
be an important target for tumor diagnosis and treatment (23). Through the present analysis, it was
found that DLD mutations were also abundant in the different
tumors. In particular, patients with mucinous adenocarcinoma of the
colon and rectum had the highest frequency of alterations in DLD
with the ‘mutation’ type, whereas the ‘amplification’ type of
mutation was frequent in the undifferentiated pleomorphic
sarcoma/malignant fibrous histiocytoma/high-grade spindle cell
sarcoma case. In HNSC, PRAD and KIRC, high mutation rates were also
associated with poorer prognosis.
To the best of our knowledge, the present study also
found for the first time evidence of a correlation between the
extent of immune infiltration and DLD expression across some tumor
types. Immune infiltration and the tumor microenvironment have been
shown to serve a function in the development of various tumors by
regulating the dynamic interaction among each of their molecular
features. Specifically, the immune microenvironment has a large
influence on the clinical outcomes (24). Cancer-associated fibroblasts have
been reported to be present in the stroma of the tumor
microenvironment, where they can modulate the function of numerous
tumor-infiltrating immune cells (14). It was also found that DLD can exert
an important role by regulating immune infiltration and the tumor
microenvironment in the present study through using the TIMER
database. After a series of analyses in the TIMER database, it was
found that there was a positive correlation between DLD expression
and the estimated infiltration levels by cancer-associated
fibroblasts in HNSC and HNSC-HPV-negative. However, a negative
correlation between these two parameters was noted in KIRC, LUSC,
KIRP, and THCA. In addition, the present findings suggested for the
first time, to the best of our knowledge, that DLD expression was
associated with the level of infiltration by cancer-associated
fibroblasts in HNSC, KIRC, LUSC, KIRP, and THCA.
Subsequently, information on the DLD
expression-related genes were integrated across all tumors for a
range of enrichment analyses, which identified the potential
effects of ‘metabolic pathways’ and ‘cellular metabolic process’ in
its role in the etiology or pathogenesis of cancer. These results
were similar to a recent study, which reported that DLD can
function as a novel metabolic pathway protein regulating the TCA in
human melanoma progression (20).
Based on the bioinformatics analysis in the present
study, it was found that DLD may regulate ‘metabolic pathways’ and
‘cellular metabolic process’ in cancer. The bioinformatics analysis
results also showed a high level of DLD expression in OV, with DLD
expression being associated with poor prognosis. In addition,
higher expression of DLD in the OV cell line was found compared
with that in the normal ovarian cell line. When DLD expression was
knocked down by siRNA in the OC3 cell line, a significant increase
in the NAD+/NADH ratio was found compared with that in
the negative control group. Several studies have reported that the
NAD+/NADH ratio may affect tumor progression (25,26).
Therefore, these results suggest that DLD can regulate metabolic
pathways in OV by suppressing the intracellular
NAD+/NADH ratio.
In summary, the present pan-cancer analysis of DLD
showed that DLD expression was associated with the clinical
prognosis, immune infiltration, and tumor mutational burden in some
tumor types. This may contribute to understanding the role of DLD
in tumorigenesis from the perspective of clinical tumor
samples.
Acknowledgements
Not applicable.
Funding
Funding: No funding was received.
Availability of data and materials
The datasets used and/or analyzed during the current
study are available from the corresponding author on reasonable
request.
Authors' contributions
DZ and HQ designed and performed the experiments.
Both authors read and approved the final version of the manuscript.
DZ and HQ confirm the authenticity of all the raw data.
Ethics approval and consent to
participate
The Ethics Committee of the Second People's Hospital
of Lianyungang (Lianyungang, China) approved the present study
(approval no. 20220103) of tumor research.
Patient consent for publication
Not applicable.
Competing interests
The authors declare that they have no competing
interests.
References
|
1
|
Cobine PA and Brady DC: Cuproptosis:
Cellular and molecular mechanisms underlying copper-induced cell
death. Mol Cell. 82:1786–1787. 2022. View Article : Google Scholar : PubMed/NCBI
|
|
2
|
Li X, Wang L, Li Y, Fu J, Zhen L, Yang Q,
Li S and Zhang Y: Tyrosine phosphorylation of dihydrolipoamide
dehydrogenase as a potential cadmium target and its inhibitory role
in regulating mouse sperm motility. Toxicology. 357–358. 52–64.
2016.
|
|
3
|
Mayr JA, Feichtinger RG, Tort F, Ribes A
and Sperl W: Lipoic acid biosynthesis defects. J Inherit Metab Dis.
37:553–563. 2014. View Article : Google Scholar : PubMed/NCBI
|
|
4
|
Tsvetkov P, Coy S, Petrova B, Dreishpoon
M, Verma A, Abdusamad M, Rossen J, Joesch-Cohen L, Humeidi R,
Spangler RD, et al: Copper induces cell death by targeting
lipoylated TCA cycle proteins. Science. 375:1254–1261. 2022.
View Article : Google Scholar : PubMed/NCBI
|
|
5
|
Jiang Y, Huo Z, Qi X, Zuo T and Wu Z:
Copper-induced tumor cell death mechanisms and antitumor
theragnostic applications of copper complexes. Nanomedicine (Lond).
17:303–324. 2022. View Article : Google Scholar : PubMed/NCBI
|
|
6
|
Zhang C, Zeng Y, Guo X, Shen H, Zhang J,
Wang K, Ji M and Huang S: Pan-cancer analyses confirmed the
cuproptosis-related gene FDX1 as an immunotherapy predictor and
prognostic biomarker. Front Genet. 13:9237372022. View Article : Google Scholar : PubMed/NCBI
|
|
7
|
Bardou P, Mariette J, Escudié F, Djemiel C
and Klopp C: jvenn: An interactive venn diagram viewer. BMC
Bioinformatics. 15:2932014. View Article : Google Scholar : PubMed/NCBI
|
|
8
|
Ito K and Murphy D: Application of ggplot2
to pharmacometric graphics. CPT Pharmacometrics Syst Pharmacol.
2:e792013. View Article : Google Scholar : PubMed/NCBI
|
|
9
|
Zhu D, Xu X, Zhang M and Wang T: TPX2
regulated by miR-29c-3p induces cell proliferation in osteosarcoma
via the AKT signaling pathway. Oncol Lett. 23:1432022. View Article : Google Scholar : PubMed/NCBI
|
|
10
|
Livak KJ and Schmittgen TD: Analysis of
relative gene expression data using real-time quantitative PCR and
the 2(−Delta Delta C(T)) method. Methods. 25:402–408. 2001.
View Article : Google Scholar : PubMed/NCBI
|
|
11
|
Anderson KA, Madsen AS, Olsen CA and
Hirschey MD: Metabolic control by sirtuins and other enzymes that
sense NAD(+), NADH, or their ratio. Biochimica Biophysica Acta
Bioenerg. 1858:991–998. 2017. View Article : Google Scholar : PubMed/NCBI
|
|
12
|
Li H, Han D, Hou Y, Chen H and Chen Z:
Statistical inference methods for two crossing survival curves: A
comparison of methods. PloS One. 10:e01167742015. View Article : Google Scholar : PubMed/NCBI
|
|
13
|
Domingues P, González-Tablas M, Otero Á,
Pascual D, Miranda D, Ruiz L, Sousa P, Ciudad J, Gonçalves JM,
Lopes MC, et al: Tumor infiltrating immune cells in gliomas and
meningiomas. Brain Behav Immun. 53:1–15. 2016. View Article : Google Scholar : PubMed/NCBI
|
|
14
|
Erdogan B and Webb DJ: Cancer-associated
fibroblasts modulate growth factor signaling and extracellular
matrix remodeling to regulate tumor metastasis. Biochem Soc Trans.
45:229–236. 2017. View Article : Google Scholar : PubMed/NCBI
|
|
15
|
Duarte IF, Caio J, Moedas MF, Rodrigues
LA, Leandro AP, Rivera IA and Silva MFB: Dihydrolipoamide
dehydrogenase, pyruvate oxidation, and acetylation-dependent
mechanisms intersecting drug iatrogenesis. Cell Mol Life Sci.
78:7451–7468. 2021. View Article : Google Scholar : PubMed/NCBI
|
|
16
|
Li R, Luo X, Wu J, Thangthaeng N, Jung ME,
Jing S, Li L, Ellis DZ, Liu L, Ding Z, et al: Mitochondrial
dihydrolipoamide dehydrogenase is upregulated in response to
intermittent hypoxic preconditioning. Int J Med Sci. 12:432–440.
2015. View Article : Google Scholar : PubMed/NCBI
|
|
17
|
Carrozzo R, Torraco A, Fiermonte G,
Martinelli D, Di Nottia M, Rizza T, Vozza A, Verrigni D, Diodato D,
Parisi G, et al: Riboflavin responsive mitochondrial myopathy is a
new phenotype of dihydrolipoamide dehydrogenase deficiency. The
chaperon-like effect of vitamin B2. Mitochondrion. 18:49–57. 2014.
View Article : Google Scholar : PubMed/NCBI
|
|
18
|
Dayan A, Yeheskel A, Lamed R, Fleminger G
and Ashur-Fabian O: Dihydrolipoamide dehydrogenase moonlighting
activity as a DNA chelating agent. Proteins. 2020.Online ahead of
print. PubMed/NCBI
|
|
19
|
Shin D, Lee J, You JH, Kim D and Roh JL:
Dihydrolipoamide dehydrogenase regulates cystine
deprivation-induced ferroptosis in head and neck cancer. Redox
Biol. 30:1014182020. View Article : Google Scholar : PubMed/NCBI
|
|
20
|
Yumnam S, Kang MC, Oh SH, Kwon HC, Kim JC,
Jung ES, Lee CH, Lee AY, Hwang JI and Kim SY: Downregulation of
dihydrolipoyl dehydrogenase by UVA suppresses melanoma progression
via triggering oxidative stress and altering energy metabolism.
Free Radic Biol Med. 162:77–87. 2021. View Article : Google Scholar : PubMed/NCBI
|
|
21
|
Xu WJ, Zhou JJ, Xie Y, Wang WL, Zhao Y,
Chen X and Li Y: Association between the expression and methylation
of energy-related genes with helicobacter pylori infection in
gastric cancer. Zhonghua Yi Xue Za Zhi. 92:366–370. 2012.(In
Chinese). PubMed/NCBI
|
|
22
|
Yoneyama K, Kojima S, Kodani Y, Yamaguchi
N, Igarashi A, Kurose K, Kawase R, Takeshita T, Hattori S and
Nagata K: Proteomic identification of autoantibodies in sera from
patients with ovarian cancer as possible diagnostic biomarkers.
Anticancer Res. 35:881–889. 2015.PubMed/NCBI
|
|
23
|
Starostik P: Clinical mutation assay of
tumors: New developments. Anticancer Drugs. 28:1–10. 2010.
View Article : Google Scholar
|
|
24
|
Sokratous G, Polyzoidis S and Ashkan K:
Immune infiltration of tumor microenvironment following
immunotherapy for glioblastoma multiforme. Hum Vaccin Immunother.
13:2575–2582. 2017. View Article : Google Scholar : PubMed/NCBI
|
|
25
|
Amjad S, Nisar S, Bhat AA, Shah AR,
Frenneaux MP, Fakhro K, Haris M, Reddy R, Patay Z, Baur J, et al:
Role of NAD(+) in regulating cellular and metabolic signaling
pathways. Mol Metab. 49:1011952021. View Article : Google Scholar : PubMed/NCBI
|
|
26
|
Ippolito L, Morandi A, Taddei ML, Parri M,
Comito G, Iscaro A, Raspollini MR, Magherini F, Rapizzi E,
Masquelier J, et al: Cancer-associated fibroblasts promote prostate
cancer malignancy via metabolic rewiring and mitochondrial
transfer. Oncogene. 38:5339–5355. 2019. View Article : Google Scholar : PubMed/NCBI
|