Introduction
Ovarian cancer (OC) is a common malignancy, with
200,000 cancer-related deaths in 2020, marking it the eighth most
fatal female malignant tumor worldwide. In addition, OC possesses
the worst prognosis and highest mortality rate among all
gynecological cancers (1–3). As OC cells are extremely invasive and
spread rapidly from the primary site to achieve extensive
metastases, the majority of patients with OC have often progressed
to an advanced stage at the preliminary diagnosis. Following the
completion of initial treatment for OC, including cytoreductive
surgery and platinum-based chemotherapy, patients with BRCA1/BRCA2
genetic mutations or HRD(Homologous Recombination Defect) often
select PARP inhibitor maintenance therapy as a subsequent
therapeutic option (4,5). Notably, this is the most
well-established treatment strategy. The five-year overall survival
(OS) rate of patients with OC remains at <50% (3,6,7),
despite the addition of multiple molecular targeted therapeutic
signaling cascades into treatment regimes. In addition, the adverse
clinical outcomes of widespread metastasis and recurrence
remain.
Galectin-1 (LGALS1), the first member of the
galectin family with carbohydrate recognition structure, is a 14.5
KDa homodimer that encodes galectin-1 (8). When LGALS1 is secreted, it interacts
with extracellular matrix (ECM) glycoproteins, such as laminin or
fibronectin, to play a role in cell division, migration, adhesion,
invasion, immune response and other activities that promote the
metastasis of tumor cells (8–11).
Results of previous studies demonstrated that LGALS1 is
overexpressed in carcinoma-associated fibroblasts (CAFs), and is
positively correlated with the expression of epithelial-mesenchymal
transition (EMT) interstitial markers (12), supporting the invasion and
metastasis of tumors (13). In
clinical practice, the elevated expression of LGALS1 has been
detected in lung cancer (14),
liver cancer (15), colorectal
cancer (16), OC (17) and other diseases, demonstrating the
potential role of LGALS1 as a marker for disease monitoring and
therapy. However, further research into the transcriptional network
and functional mechanisms of LGALS1 in OC is required. In recent
years, the rapid processing of millions of library clones has
become a reliable laboratory process, due to the development of
high-throughput sequencing techniques. The detection of genes that
play roles in key biological processes provides novel insights into
therapeutic targets and mechanisms of cancer development.
In the present study, a total of five datasets were
downloaded from the Gene Expression Omnibus (GEO) database, and
LGALS1 was found to be highly expressed in OC tissues. Kaplan-Meier
analysis demonstrated that high expression of LGALS1 leads to a
poor prognosis in patients with OC. Using The Cancer Genome Atlas
(TCGA) database, differentially expressed genes (DEGs) were
identified according to the median expression of LGALS1.
Subsequently, Gene Ontology (GO) and Kyoto Encyclopedia of Genes
and Genomes (KEGG) enrichment analyses were performed using the
DEGs. Gene Set Enrichment Analysis (GSEA)is used to explore
genome-wide molecular mechanisms. Thus, genes involved in the
biological processes of cell-matrix adhesion were selected, and
their impact on the survival of patients with OC were analyzed. The
results were further validated using an OC dataset. After analyzing
the association between these cell adhesion molecules (CAMs) and
the expression of LGALS1 using TCGA database, the expression levels
of LGALS1 and fibronectin 1 (FN1) in clinical samples were
determined, and the characteristics of clinical cases were further
investigated. Results of the present study support the hypothesis
that LGALS1, as a gene impacting OC development, modulates gene
expression levels and may exhibit potential as a therapeutic
target.
Materials and methods
Database resource
A total of five datasets that met the inclusion
criteria were downloaded from the GEO database (http://www.ncbi.nlm.nih.gov/geo). The inclusion
criteria was as follows: i) :(Available tissue samples that were
derived from human epithelial OC tissues, the healthy ovarian
epithelium and fallopian tube epithelium; and ii) sample quantities
within each dataset were not <10. A total of 83 control samples
and 271 OC samples were included in the present study (Table I). The original matrix data were
standardized using the RMA algorithm from R software (version
4.0.0). Differences in LGALS1 mRNA expression levels were compared
between the two groups using an unpaired and paired Student's
t-test, and P<0.05 was considered to indicate a statistically
significant difference.
 | Table I.Summary of Gene Expression Omnibus OC
microarray datasets. |
Table I.
Summary of Gene Expression Omnibus OC
microarray datasets.
| Dataset | Sample number
(tumor/control) | Tumor group | Control group | Platform |
|---|
| GSE26712 | 185/10 | HGSOC | OSE | GPL96; Affymetrix
Human Genome U133A Array |
| GSE10971 | 7/24 | HGSOC | FTE | GPL570; Affymetrix
Human Genome U133 Plus 2.0 Array |
| GSE69428 | 10/10 | HGSOC | FTE | GPL570; Affymetrix
Human Genome U133 Plus 2.0 Array |
| GSE12172 | 60/30 | SOC | SO LMP tumor | GPL570; Affymetrix
Human Genome U133 Plus 2.0 Array |
| GSE30587 | 9/9 | Primary | Omental | GPL6244; Affymetrix
Human Gene 1.0 ST Array |
|
|
| OC | Metastases |
|
The gene expression information and the
corresponding clinical data of 354 OC samples were downloaded from
the University of California Santa Cruz database (https://xenabrowser.net/datapages/). Transcripts
per million (TPM) were used to normalize the RNA-seq data. The
specimen belonged to the primary tumor, and the fresh tissue was
preserved at −80°C. LGALS1 expression is presented as the mean ±
standard deviation and analyzed in combination with the clinical
characteristics. Unpaired Student's t-test was used to compare the
differences of two groups.
Acquisition of DEGs
According to the median expression of LGALS1 in TCGA
database, LGALS1 expression was divided into a high expression
group (> median) and low expression group (< median). The R
bioconductor package DESeq2 (18)
was utilized to search for DEGs. The following criteria were
applied to find DEGs: A false discovery rate <0.05, |Log2 FC|
>1.8 and P<0.05. A heatmap was subsequently created for the
DEGs in each sample.
Annotation of the biological functions
of DEGs
The clusterProfiler and Goplot packages in the R
software were used to analyze and visualize GO terms and KEGG
pathway enrichment results of DEGs. P<0.05 and q<0.05 were
considered to indicate a statistically significant difference.
GSEA
GSEA (version 4.2.2) software was used to perform
GSEA analysis on all genes of TCGA OC dataset. The following
conditions were set: i) The grouping method was the same as for
screening DEGs; ii) 1,000 genomic permutations were performed per
analysis; iii) P<0.05 was considered to indicate a statistically
significant difference; and iv) FDR(False Discovery Rates) <25%,
and normalized enrichment score (NES) >1.0 demonstrated that the
enrichment to gene set was significant.
Kaplan-Meier analysis
Kaplan-Meier Plotter database (www.kmplot.com/ovar) was used to analyze the effects
of LGALS1 mRNA and CAMs [FN1, integrin α 11 (ITGA11), gremlin 1
(GREM1), collagen type I α 1 (COL1A1), collagen type 3 α 1 (COL3A1)
and periostin (POSTN)] on the prognosis of patients with OC. This
database contains 1,793 OC samples, and 15 datasets were involved
in the present analysis [GSE14764 (n=80), GSE15622 (n=35), GSE18520
(n=63), GSE19829 (n=28), GSE23554 (n=28), GSE26193 (n=107),
GSE26712 (n=195), GSE27651 (n=49), GSE30161 (n=58), GSE3149
(n=116), GSE51373 (n=28), GSE63885 (n=101), GSE65986 (n=55),
GSE9891 (n=285) and TCGA (n=565)]. Data on the histological type of
serous OC were included in the present analysis. To determine
whether there was a difference in OS between the two groups, and to
create a Kaplan-Meier survival curve, patients with serous OC were
separated into groups with high and low expression of the target
genes, based on the optimal cut-off value. Subsequently, subgroup
analysis was further conducted, including the following: i) Stage;
ii) histological grade; iii) TP53 mutation; iv) surgical treatment;
and v) different chemotherapy regimens. A P-value of log-rank
<0.05 was used to establish whether the target genes were a
protective factor [HR(Hazard Ratio)<1] or a risk factor
(HR>1).
Identification of the expression of
CAMs
Using r-GGStatsplot package in R software, the
association between LGALS1 and the expression of CAMs in TCGA
database was calculated. The correlation between expression levels
was investigated using Pearson's correlation analysis, and
significance was assessed using a Student's t-test. The mRNA
expression levels of CAMs in OC tissue were verified using the
dataset GSE66957 from platform GPL15048, containing 12 ovarian
samples from healthy controls (HC) and 57 OC samples.
Clinical samples
Tissues of patients who received surgical treatment
in the Department of Gynecology, The Second Hospital of Jilin
University from July 2020 to December 2020, were collected. Samples
were obtained from 43 patients with OC and 29 patients with benign
gynecological diseases that required surgical removal of the
ovaries. The ovaries of HC were confirmed to be healthy by an
independent pathologist, and the relevant clinical characteristics
of patients with OC were recorded. The surgical treatment of OC was
comprehensive staging laparotomy and cytoreductive surgery.
Patients who had received neoadjuvant radiotherapy, chemotherapy
and other specific therapies prior to surgery were excluded. An
independent pathologist confirmed that the tissue was epithelial
OC. The age of onset of OC ranged from 34 to 79 years old, with a
median age of 55 years. A total of 21 patients were younger than 55
years old, and 22 patients were older than 55 years old. The Ethics
Committee of The Second Hospital of Jilin University approved
tissue collection (ethics approval no. 2020069). All patients
provided written informed consent prior to inclusion in the
study.
Immunohistochemistry
Immunohistochemistry was used to examine the
expression levels of LGALS1 and FN1 in the tissues of 43 patients
with OC and 29 HC. The resected OC and benign ovarian epithelial
tumor tissues were fixed with formalin, and 4-µm-thick tissue
sections were cut and heated in EDTA repair solution (PH, 9.0) for
antigen repair. Tissues were incubated with primary antibodies
against LGALS1 (1:300; cat. no. 11858-1-AP; ProteinTech Group,
Inc.) and FN (1:200; cat. no. WL00712a; WANLEIBIO) overnight at
4°C. Following primary incubation, tissues were incubated with the
conjugate secondary antibody (1:500; cat. no. 115-035-003; Jackson
ImmunoResearch Laboratories, Inc.) for 50 min at room temperature.
Tissues were washed with PBS three times for 5 min each time.
Intensity was scored as follows: Colorless, 0; light yellow, 1;
yellowish brown, 2; and brown, 3. The percentage of the total cell
population that was positive within the visual field was scored as
follows: <10%, 0 scores; 11–24%, 1 score; 25–49%, 2 scores; and
>50%, 3 scores. When two scores were multiplied, a result ≤2 was
considered to indicate a negative expression, and a result >2
was considered to indicate a positive expression.
Statistical analysis
Statistical analysis was performed using R Software
4.0.0 (R Development Core Team) and GraphPad Prism 9.0 (GraphPad
Software). All experiments were repeated three times. The count
data were represented by the number of cases (percentage), and the
other data were shown as the mean ± standard deviation. Two groups
were compared with the paired and unpaired Student's t-test. A
paired T test was used to compare the difference in LGALS1
expression between the two groups (Data sets: GSE69428 and
GSE30587). Unpaired T test was used to compare the difference of
LGALS1 expression (Data sets: GSE26712, GSE10971, GSE12171), and to
examine the relationship between LGALS1 expression and
clinicopathological characteristics in OC. The differences in CAM
mRNA expression between OC and HC were also analyzed using an
unpaired t-test. Kaplan-Meier curve was used to evaluate the
effects of LGALS1 and CAMs on OS of OC patients. The significance
of the survival differences between the groups was assessed using a
log-rank test. Immunohistochemical difference between the two
groups was Chi-square test. Pearson's correlation was used to
analyze the correlation between LGALS1 and CAMs expression.
P<0.05 was considered to be statistically significant.
Results
High expression of LGALS1 in OC is
associated with prognosis
To understand the expression of LGALS1 mRNA in OC,
the GEO database was used for analysis. Each dataset was normalized
(Fig. 1A). Results of previous
studies demonstrated that serous OC arises from the tubal
epithelium and is secondary to the ovary; whereas epithelial OC was
initially considered to originate from the epithelium on the ovary
surface (19,20). Therefore, healthy tubal tissue was
included in the control group. Compared with healthy ovarian
epithelial tissue, healthy fallopian tube epithelium and serous
ovarian low malignant potential tumor, results of the present study
demonstrated that LGALS1 mRNA was highly expressed in OC (Fig. 1B). Further analysis demonstrated
that LGALS1 mRNA expression in omental metastasis lesions was
higher than in primary OC.
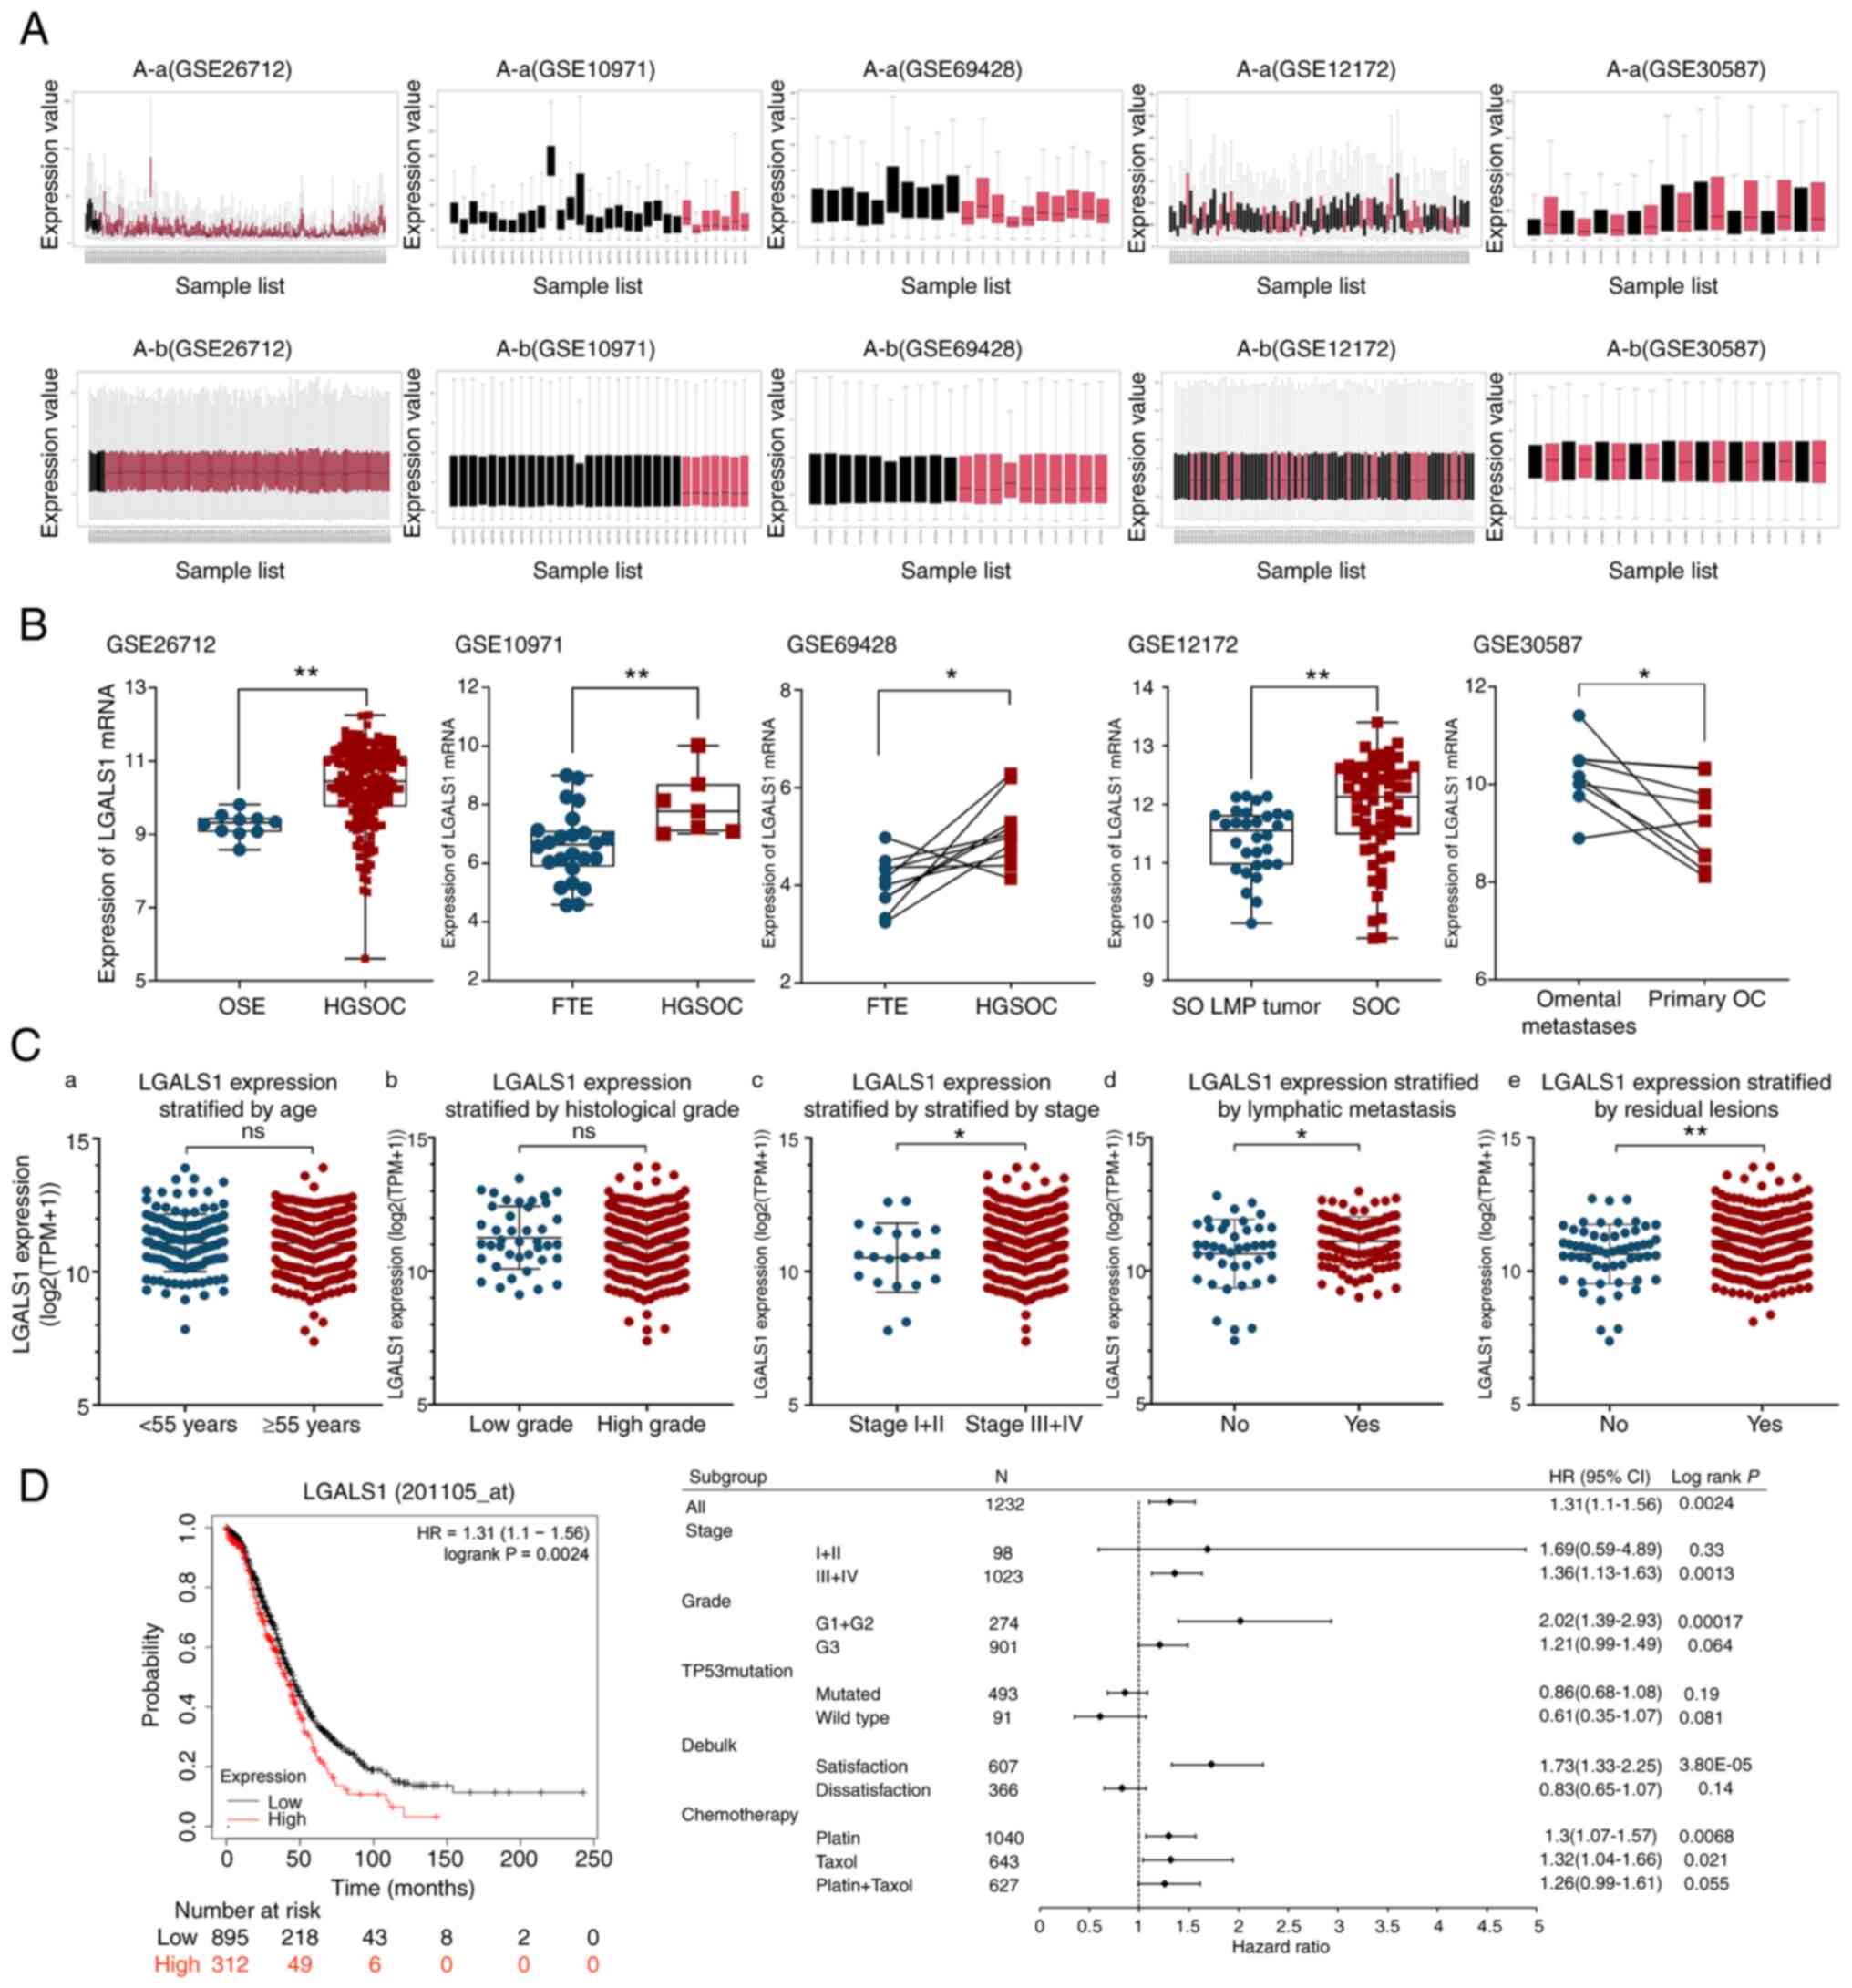 | Figure 1.Expression of LGALS1 in OC and its
relationship with prognosis of patients. (A) GEO dataset
standardization processing: (A-a) Before data processing and (A-b)
after data processing. (B) Differential expression of LGALS1 mRNA
in the tumor and control groups, and primary tumor and tumor
metastasis groups was examined using the relevant GEO database
datasets. Statistical analysis was performed using an unpaired
t-test (GSE26712, GSE10971 and GSE12172) or paired t-test (GSE69428
and GSE30587). (C) Relationship between LGALS1 expression and
different clinicopathological features. Association between the
LGALS1 expression and (C-a) the age of patients, (C-b) histological
grade, (C-c) the stage of OC, (C-d) lymphatic metastasis and (C-e)
residual lesions. An unpaired t-test was used to compare the two
groups. (D) Survival curves and subgroup analysis of overall
survival in patients with OC, stratified by high and low expression
of LGALS1 based on the best cutoff value. *P<0.05, **P<0.01.
GEO, Gene Expression Omnibus; HGSOC, high-grade serous ovarian
cancer; OSE, ovarian surface epithelium; FTE, fallopian tube
epithelium; SO, serous ovarian; LMP, low malignant potential; SOC,
serous ovarian cancer; HR, hazard ratio; LGALS1, galectin-1; OC,
ovarian cancer; ns, not significant; TPM, transcripts per
million. |
Among 354 patients with OC in the TCGA database, the
median age of diagnosis was 59, 88.4% patients had high-grade
histological type, 94.3% patients had advanced stage (stage III–IV)
at the first diagnosis, 69.9% of the patients with lymph node
dissection had lymphatic metastasis, 81.6% OC patients could not
reach R0 resection at the first operation (Table II). LGALS1 mRNA expression was
markedly higher in the advanced stage (stage III–IV), lymphatic
metastasis and residual lesion groups. However, high expression of
LGALS1 was not significantly associated with other clinical
features (Fig. 1C). The association
between LGALS1 expression and patient survival was investigated
using Kaplan-Meier analysis. LGALS1 mRNA expression was negatively
correlated with the OS of patients with serous OC. Moreover,
results of the subgroup analysis demonstrated that Grade 1 and 2,
stages III and IV, and treatment with platinum or Taxol exhibited
statistical significance (Fig.
1D)
| Table II.The Cancer Genome Atlas data of
clinicopathological features of patients with ovarian cancer
(n=354). |
Table II.
The Cancer Genome Atlas data of
clinicopathological features of patients with ovarian cancer
(n=354).
|
Characteristics | No. (%) |
|---|
| Age, years (median,
59 years) |
|
|
<55 | 123 (34.7) |
|
≥55 | 231 (65.3) |
| Histological
grade |
|
| Low
grade | 41 (11.6) |
| High
grade | 311 (88.4) |
| Stage |
|
|
I+II | 20 (5.7) |
|
III+IV | 331 (94.3) |
| Lymphatic
metastasis |
|
|
Yes | 95 (69.9) |
| No | 41 (30.1) |
| Residual
lesions |
|
|
Yes | 257 (81.6) |
| No | 58 (18.4) |
Identification and functional
annotation of DEGs
A total of 208 DEGs were obtained using the
filtering criteria. In total, 83 genes exhibited significant
upregulation and 125 genes exhibited significant downregulation. A
volcano map was used to demonstrate DEGs associated with LGALS1
expression (Fig. 2A). The
significant DEGs were merged to create a heatmap, according to the
levels of expression (Fig. 2B).
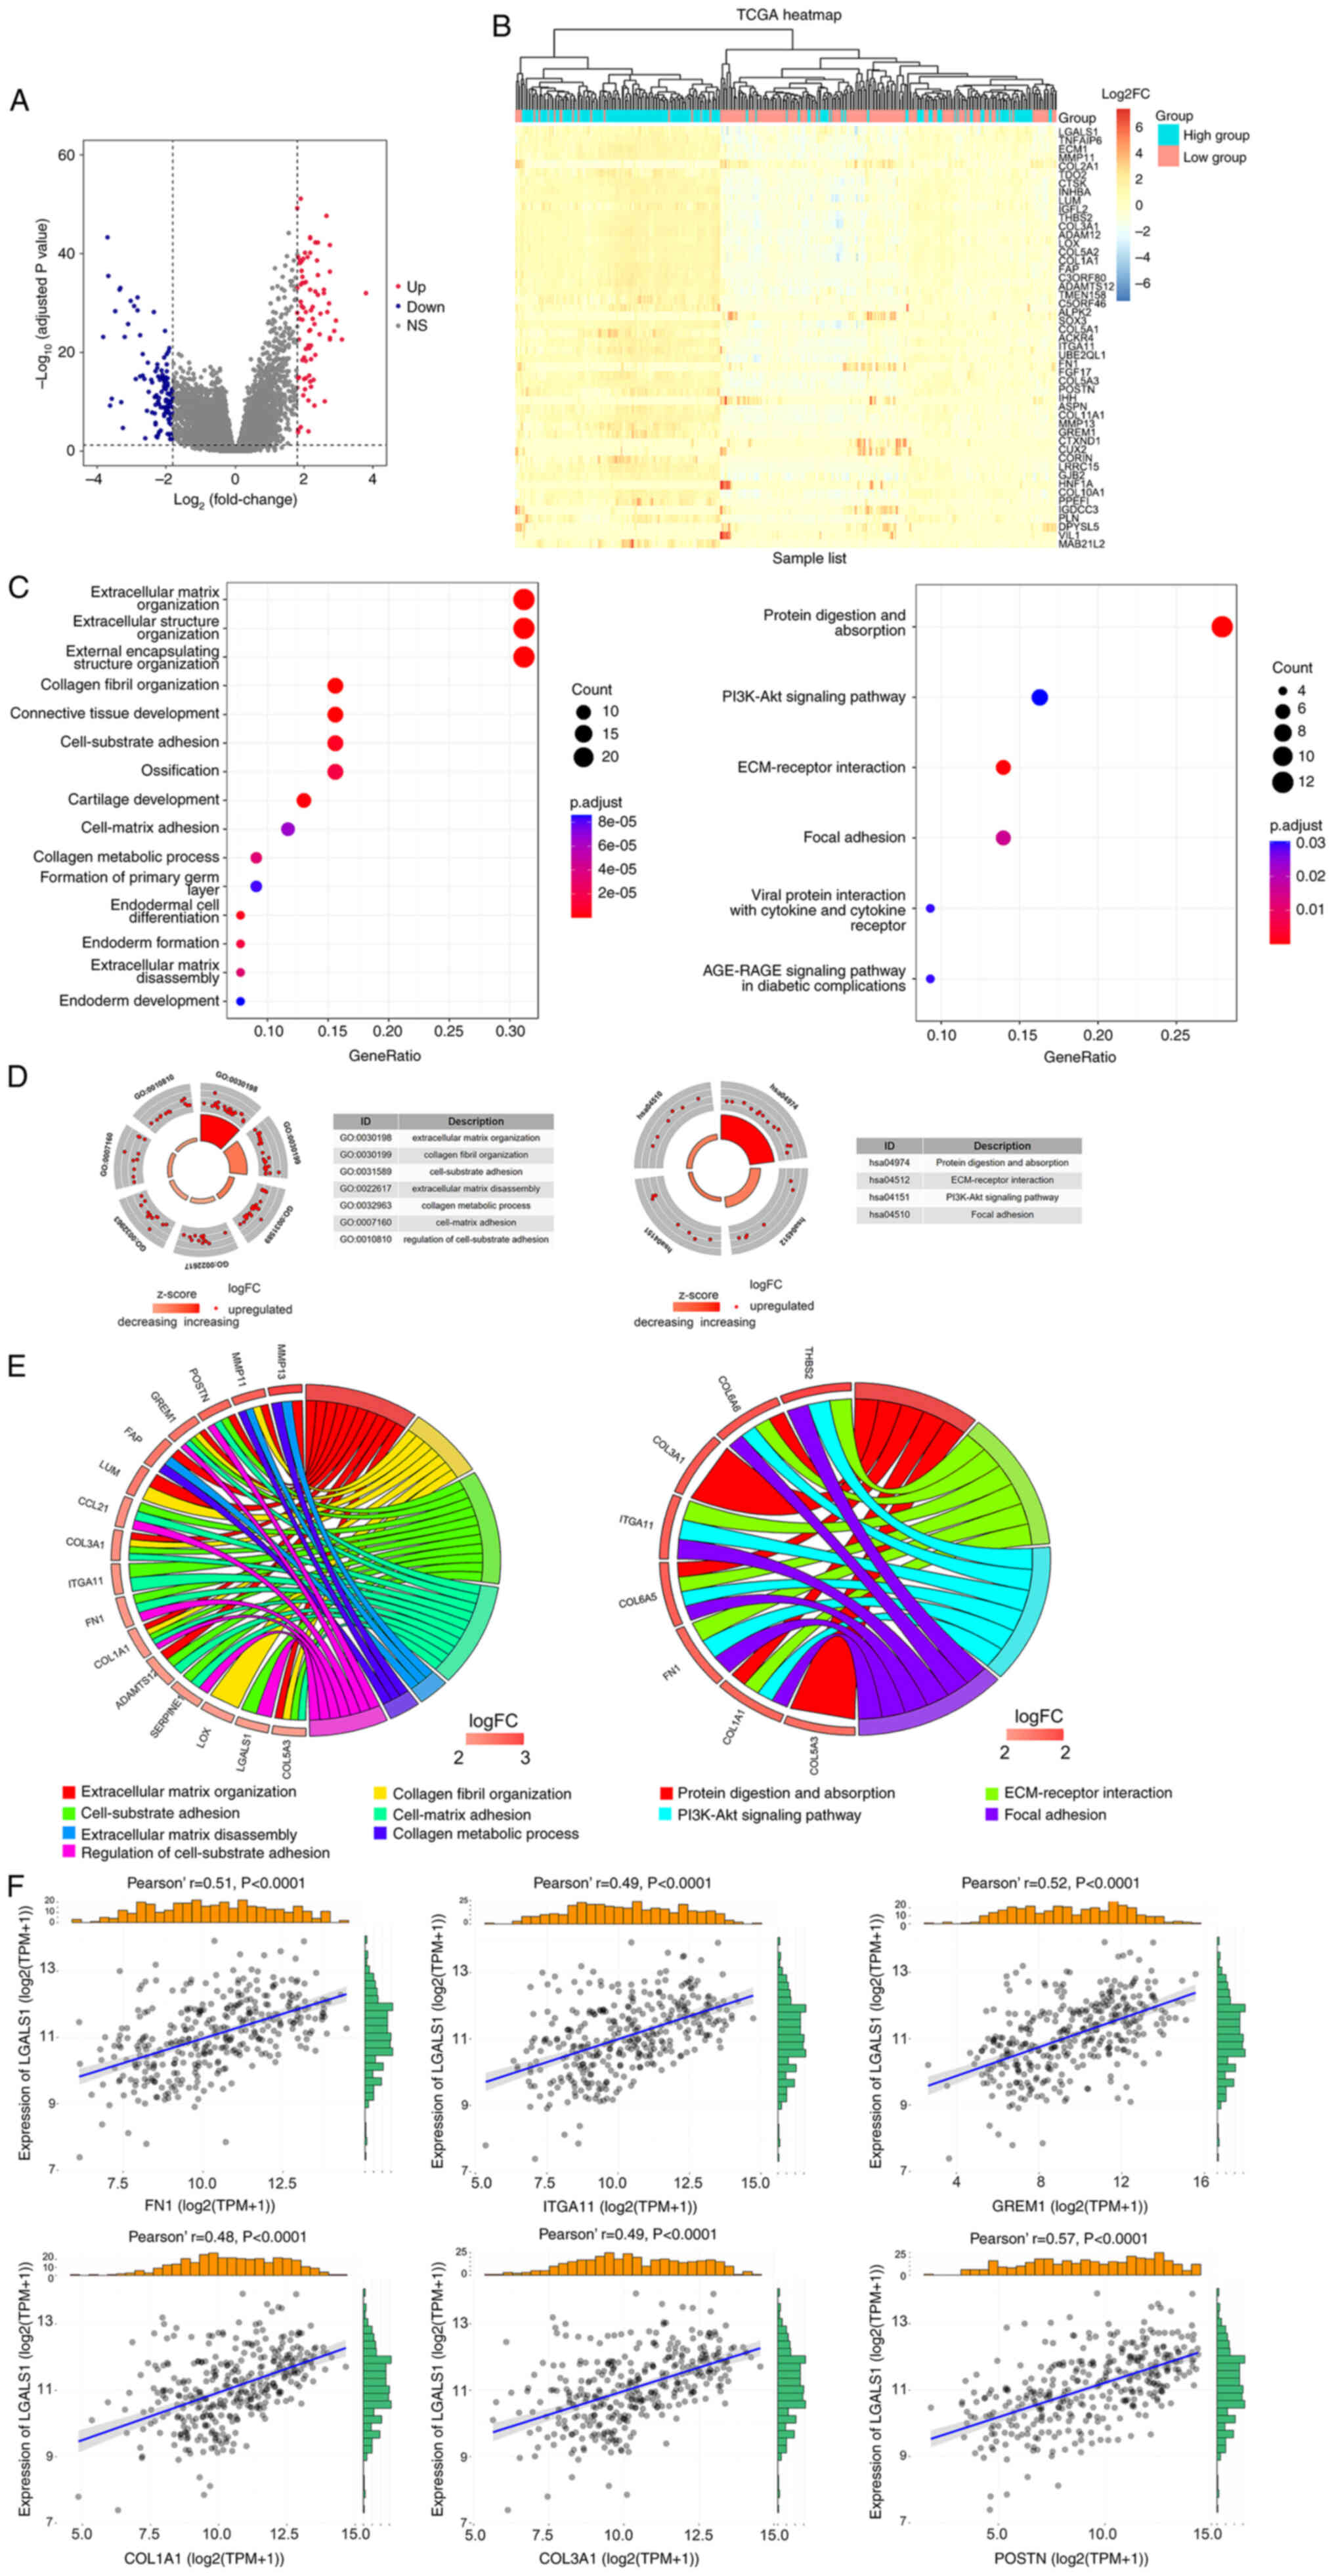 | Figure 2.Identification and function
annotation of DEGs. (A) Volcano map of DEGs between high and low
LGALS1 groups, using abslog2(FC)>1.8 and FDR <0.05/adjusted
P-value <0.05 as the threshold. Red dots represent upregulated
genes, blue dots represent downregulated genes and gray dots
represent genes that were not significantly differentially
expressed. (B) Hierarchical clustering of DEGs in high and low
LGALS1 groups. Each column represents a sample and each row
represents a gene. The expression of each sample is represented as
a log2FC value (scale of −6 to 6). The color gradient from blue to
red represents downregulation to upregulation of gene expression.
The top 50 DEGs are displayed ordered according to the adjusted
P-value (smallest to largest). (C) Top 15 representative GO
biological processes of DEGs, and the six representative KEGG
pathways of DEGs. (D) Enrichment results. The outer circle is the
term, the middle circle is the difference and the inner circle is
the z-score (indicating whether the term is upregulated or
suppressed). The term name corresponds to the GO ID. (E)
Distribution of DEGs for biological processes is shown as a chord
map. The DEGs are depicted on the left side of the map, and the FC
values are represented by the color scale. Colored lines show the
connection between genes and biological functions. (F) Correlation
between LGALS1 and CAM genes in OC examined using TCGA. CAM, cell
adhesion molecule; DEGs, differentially expressed genes; ECM,
extracellular matrix; abs, absolute value FC, fold change; FDR,
false discovery rate; GO, Gene Ontology; KEGG, Kyoto Encyclopaedia
of Genes and Genomes; LGALS1, galectin-1; OC, ovarian cancer; TCGA,
The Cancer Genome Atlas; FN1, fibronectin 1; ITGA11, integrin α 11;
GREM1, gremlin 1; COL1A1, collagen type I α 1; COL3A1, collagen
type III α 1; POSTN, periostin; NS, not significant; TPM,
transcripts per million. |
As LGALS1 may act as an oncogene in OC,
clusterProfiler and Goplot were used for GO and KEGG annotation and
visualization, using upregulated DEGs. Enrichment analysis of
biological processes demonstrated that DEGs were involved in ECM
organization, collagen fibril organization, cell-substrate
adhesion, cell-matrix adhesion, collagen metabolic processes and
ECM disassembly. Moreover, analysis of KEGG pathways demonstrated
that DEGs were involved in protein digestion and absorption,
ECM-receptor interaction, the PI3K-Akt signaling pathway and focal
adhesion (Fig. 2C-E). CAM genes
involved in cell matrix adhesion were selected to analyze the
association with LGALS1 expression. Results of the present study
demonstrated that LGALS1 was positively co-expressed with FN1,
ITGA11, GREM1, COL1A1, COL3A1 and POSTN (Fig. 2F).
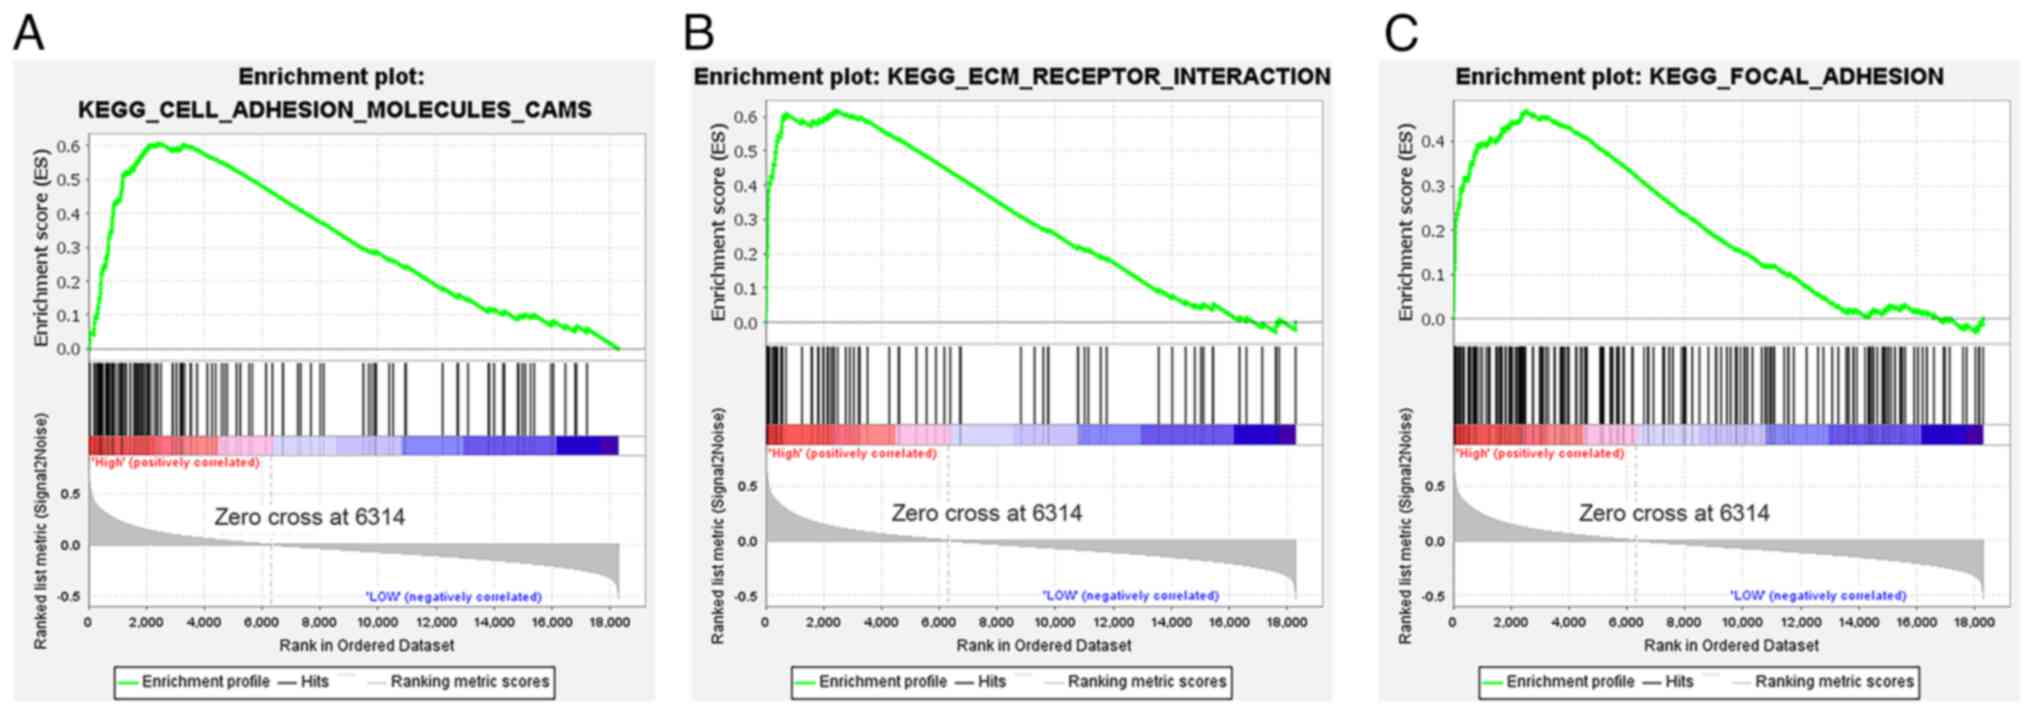
LGALS1 activation pathway in OC
GSEA of TCGA genes demonstrated that the
significantly enriched gene sets were mainly concentrated in the
LGALS1 high expression group. These gene sets included CAMs,
ECM-receptor interaction and focal adhesion gene sets (Fig. 3A-C).
Validation of CAMs
Kaplan-Meier Plotter was used to analyze how the
mRNA expression of CAMs affected the OS of OC patients (Fig. 4A-F). Results of the present study
demonstrated that the expression levels of FN1, ITGA11, GREM1,
COL1A1, COL3A1 and POSTN were significantly correlated with poor OS
rates. Gene expression levels of CAMs in HC and OC were compared
using the dataset GSE66957 (Fig.
4G). The results demonstrated that the expression levels of the
aforementioned CAM genes were markedly increased in OC, except for
POSTN.
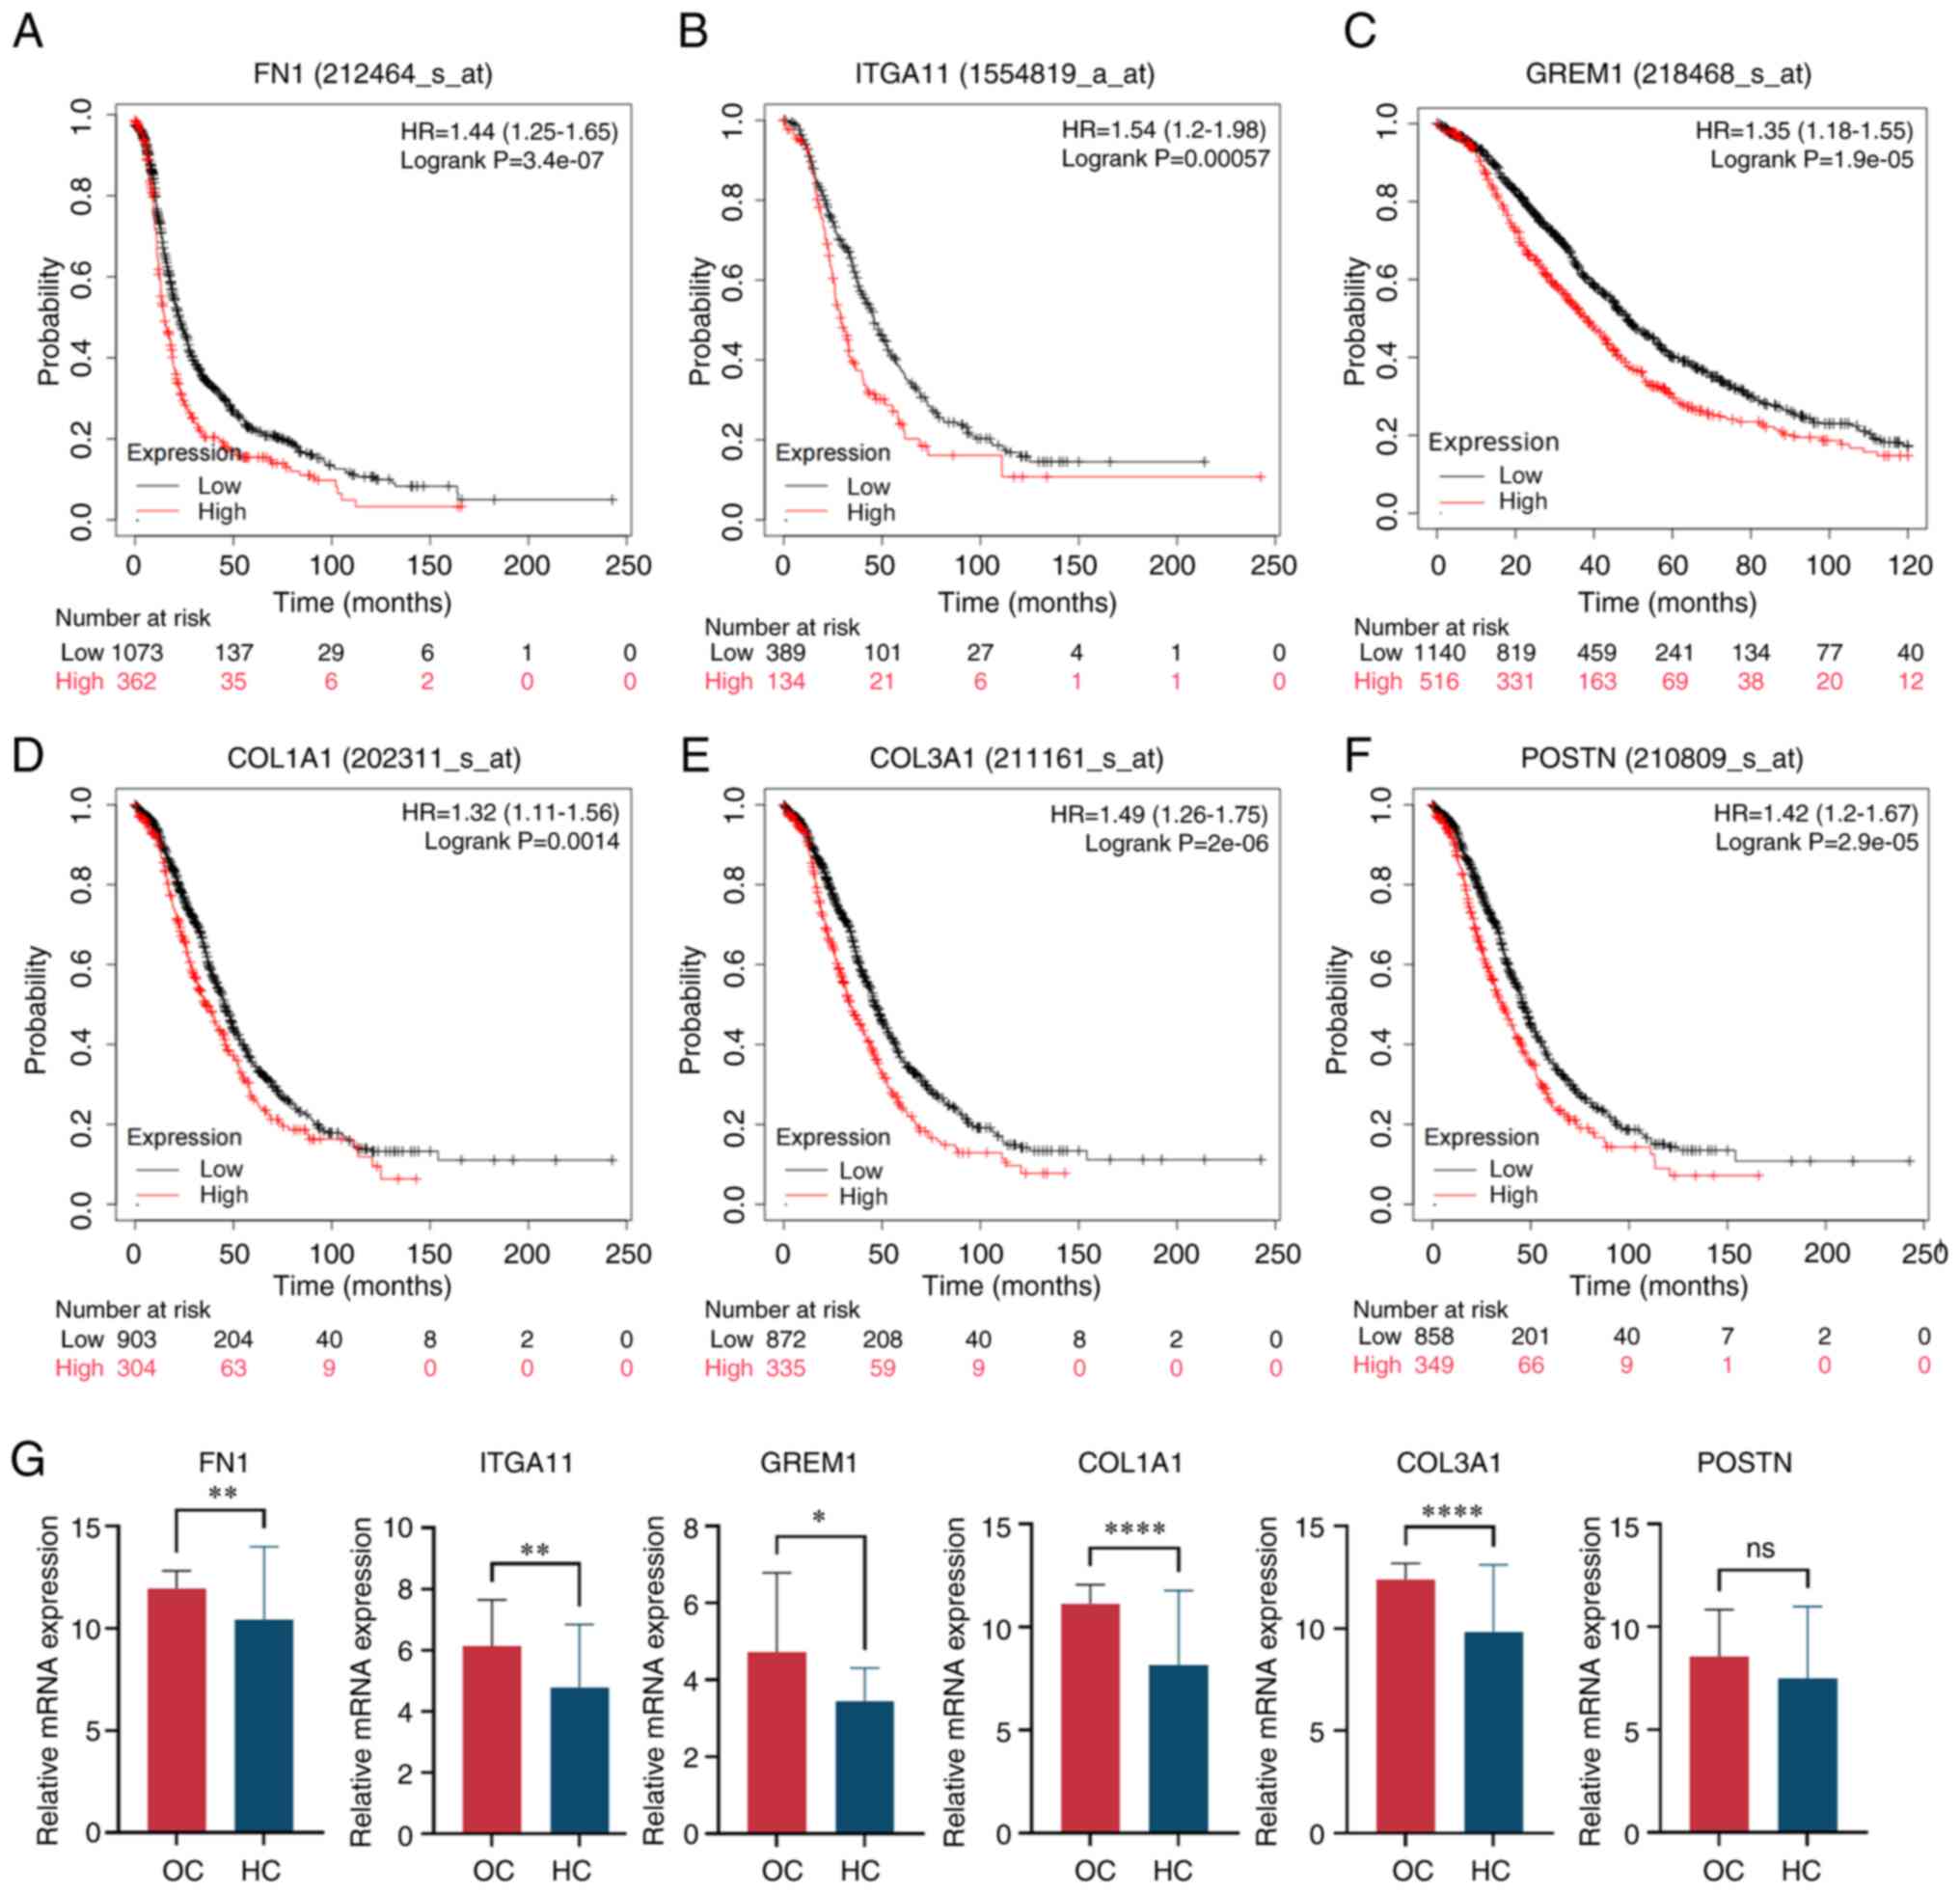 | Figure 4.Validation of CAMs. Expression of
CAMs, including (A) FN1, (B) ITGA11, (C) GREM1, (D) COL1A1, (E)
COL3A1 and (F) POSTN, and overall survival rate of patients with
OC. (G) CAM mRNA was highly expressed in OC samples compared with
HC samples, and unpaired t-test was used for comparison between the
two groups. Data are presented as the mean ± standard deviation.
*P<0.05, **P<0.01, ****P<0.0001. ns, not significant; CAM,
cell adhesion molecule; OC, ovarian cancer; HC, healthy controls;
FN1, fibronectin 1; ITGA11, integrin α11; GREM1, gremlin 1; COL1A1,
collagen type I α 1; COL3A1, collagen type III α 1; POSTN,
periostin; TPM, transcripts per million. |
Clinical sample validation
Compared with HC, the protein expression levels of
LGALS1 and FN1 were significantly upregulated in OC. The positive
rate of LGALS1 expression in FIGO (Federation Internationale Of
Gynecologie And Obstetrigue) III/IV epithelial OC (73.08%) was
significantly higher than that in FIGOI/II epithelial OC (29.41%;
Fig. 5A and B). In addition, the
expression rate of LGALS1 in patients with high-grade OC (67.86%)
was significantly higher than that in patients with low-grade OC
(33.33%; Table III). Notably,
there was no significant difference in LGALS1 expression between
patients of different ages and patients with lymph node metastases.
When comparing the clinical samples obtained during the present
study with data obtained from TCGA, the trend of LGALS1 expression
in staging was consistent. The expression rate of FN1 protein in HC
was 27.59%, and that in OC tissue was 62.79%. Moreover, when
compared with HC, the expression of FN1 protein in patients with OC
was significantly upregulated (Fig.
5C-E).
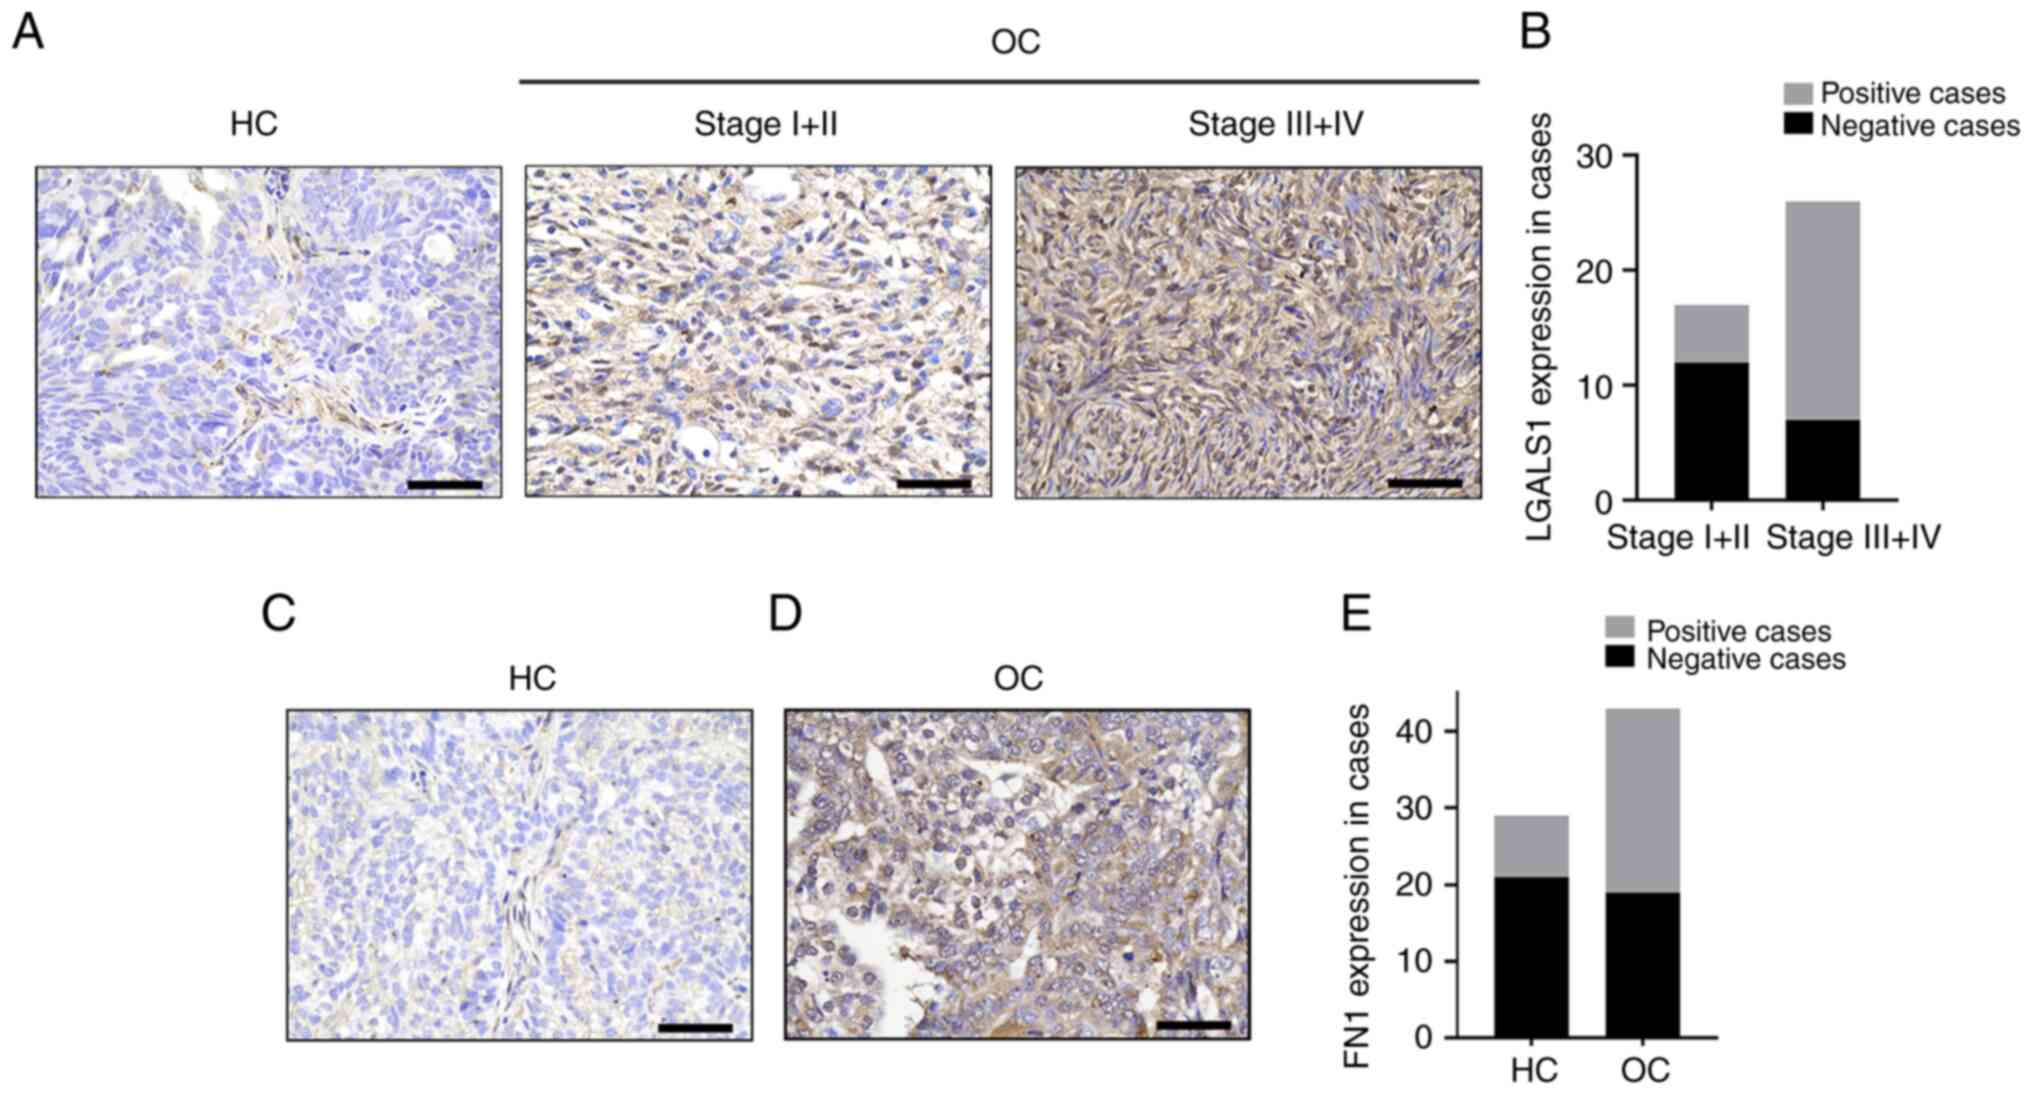 | Figure 5.LGALS1 and FN1 protein expression in
epithelial OC, determined using immunohistochemical staining. (A)
LGALS1 expression levels in HC and OC. Magnification, ×400. Scale
bar, 50 µm. (B) LGALS1 expression levels were quantified according
to immunostaining scores. (C) FN1 protein levels in HC.
Magnification, ×400. Scale bar, 50 µm. (D) FN1 protein levels in
OC. Magnification, ×400. Scale bar, 50 µm. (E) FN1 expression
levels were quantified according to immunostaining scores in HC and
OC. FN1, fibronectin 1; LGALS1, galectin-1; OC, ovarian cancer; HC,
healthy controls. |
| Table III.Protein expression of LGALS1 and
pathological features in patients with ovarian cancer. |
Table III.
Protein expression of LGALS1 and
pathological features in patients with ovarian cancer.
|
|
| LGALS1
expression |
|
|---|
|
|
|
|
|
|---|
|
Characteristics | No. (%) | Positive cases
(%) | Negative cases
(%) | P-value |
|---|
| Age, years |
|
|
|
|
|
<55 | 21 (48.84) | 10 (47.62) | 11 (52.38) | 0.290 |
|
≥55 | 22 (51.16) | 14 (63.64) | 8 (36.36) |
|
| Grade |
|
|
|
|
| Low
grade | 15 (34.88) | 5 (33.33) | 10 (66.67) | 0.030a |
| High
grade | 28 (65.12) | 19 (67.86) | 9 (32.14) |
|
| Stage |
|
|
|
|
|
I+II | 17 (39.53) | 5 (29.41) | 12 (70.59) | 0.005b |
|
III+IV | 26 (60.47) | 19 (73.08) | 7 (26.92) |
|
| Lymphatic
metastasis |
|
|
|
|
|
Yes | 17 (39.53) | 7 (41.18) | 10 (58.82) | 0.118 |
| No | 26 (60.47) | 17 (65.38) | 9 (34.62) |
|
Discussion
OC is a highly metastatic disease with a poor
prognosis, and the underlying molecular mechanisms remain to be
fully elucidated. Using the GEO database, results of the present
study demonstrated that LGALS1 mRNA was highly expressed in OC
tissues, compared with the healthy ovaries, healthy oviduct tissues
and serous ovarian low malignant potential tumor. Moreover,
increased expression levels of LGALS1 were associated with lymph
node metastases and residual tumor lesions. Results of previous
studies demonstrated that serum detection of LGALS1 exhibits
potential for the diagnosis of OC (21,22),
and that LGALS1 levels reduce following tumor excision and
chemotherapy (21). Results of the
present study also demonstrated that elevated LGALS1 expression was
negatively associated with a poor prognosis, particularly in
patients with advanced OC, stage III and IV, Grade 1 and 2,
satisfactory reduction surgery, and treatment with platinum or
paclitaxel. Moreover, similar findings have been observed in
thyroid cancer, breast cancer and pancreatic cancer (21,23,24).
The development of inhibitors that target LGALS1 exhibit potential
as future anti-cancer therapies (25,26).
Collectively, results of the present study demonstrated that LGALS1
may exhibit potential as a target for the treatment of OC.
Enrichment analysis of upregulated DEGs was carried
out to further understand the oncogenic mechanisms of LGALS1 in OC.
Findings of the GO annotation revealed that ECM genes, which encode
collagen fibers, fibronectin and metalloproteinases, were a large
proportion of the upregulated DEGs. These genes were mostly engaged
in cell-matrix adhesion, ECM-receptor interaction, ECM degradation
and collagen fiber decomposition. According to results of the KEGG
analysis, DEGs were involved in protein digestion and absorption,
ECM-receptor interaction, the PI3K-Akt signaling pathway and focal
adhesion. All of these are involved in ECM alteration, and are
closely associated with the proliferation and metastasis of tumor
cells. The uncontrolled adhesion interaction alters the molecular
characteristics of local ECM components, such as their morphology
and hardness, and promotes cancer progression (27). Results of previous studies
demonstrated that OC originates in the epithelium, and moves to the
abdominal cavity through single cell or multicellular aggregation.
These cells are attached to peritoneal mesothelial cells that are
planted in the basement membrane, and to degraded ECM components
for diffusion (27,28). Further investigations into the
mechanisms underlying OC metastasis are required.
The use of GSEA in the present study demonstrated
the significant enrichment of genes involved in focal adhesion,
ECM-receptor interaction and CAMs. These results further indicated
that LGALS1 may impact the mechanisms involved in cell
adhesion.
As a molecular glue, LGALS1 heterotypic recognition
glycoprotein provides diversity in ECM junctions and intercellular
tightness, and improves the physical force for the directed
invasion of tumor cells (11,29).
To further understand the role of LGALS1 in cell matrix adhesion
events, a total of six CAMs of the aforementioned pathway were
selected for subsequent analysis. As a structural scaffold, FN1
regulates cell adhesion, growth and migration, and plays a vital
role in embryonic development and wound healing (30). FN1 is both a mesenchymal marker and
a promoter of EMT (31), and its
abnormal expression is associated with a poor prognosis in patients
with cancer (32,33) and platinum resistance (34). Moreover, members of the integrin
family regulate cell-cell interactions and cell-cell adhesion. As a
specific collagen receptor, ITGA11 initiates the recombination and
alteration of the stiffness of the collagen matrix (35), which significantly facilitates the
migration and invasion of cancer (36,37).
COL1A1 and COL3A1 belong to the collagen family, and are the main
components of the ECM. Levental et al (38) demonstrated that type I collagen
cross-linking is associated with ECM stiffness, which stimulates
focal adhesion and PI3K signal transduction, to enhance breast
cancer cell growth and invasion. Gao et al (39) reported that the silencing of COL1A1
expression inhibited the EMT process and cell motility, and reduced
tumor aggressiveness. COL3A1 is also an important protein in the
development and progression of bladder, glioma, head and neck
cancer (39–41). Following knockdown of COL3A1 using
small interfering RNA, cell growth was prolonged, migration ability
was weakened, and colony formation was inhibited (39). Moreover, GREM1 is a highly conserved
glycoprotein that promotes intracellular infiltration and exosmosis
of MDA-MB-231 cells in zebrafish, through activation of CAFs.
Results of a previous study demonstrated that GREM1 expression was
markedly increased at the infiltrated edge (42), highlighting the function of the
protein in cancer metastasis. In addition, POSTN is expressed in
pan-carcinomas, and is associated with metastasis, recurrence and
poor prognosis (43). Results of a
previous study demonstrated that POSTN from CAFs of OC acts as an
integrin avb3 receptor, to activate the downstream PI3K-Akt
signaling cascade (44). This
initiates EMT and increases the malignancy of cancer. Results of
this previous study demonstrated that candidate genes were
positively correlated with LGALS1 expression, and exerted adverse
effects on the clinical outcomes of patients with OC (44). Results of the present study verified
the high expression of CAM mRNA in OC tissues, except for POSTN.
These results further demonstrated that LGALS1 is involved in cell
adhesion.
Collectively, results of the present study revealed
that the LGALS1 protein was highly expressed in OC, and that the
expression of LGALS1 was significantly associated with increasing
pathological grade and clinical stage. These results indicated that
LGALS1 may promote the development of OC. Notably, results of a
previous study demonstrated that the addition of recombinant LGALS1
promoted the adhesion of OC cell lines to FN in a dose-dependent
manner, whereas free-floating cells exhibited no response to FN
under the same conditions. These results highlighted that FN
altered cell spatial localization and promoted cell-ECM association
under the action of LGALS1; however, this was cell state-dependent
(45). Results of the present study
demonstrated that FN1 protein expression was markedly upregulated
in OC, compared with HC. Thus, we hypothesized that two proteins
may interact to accelerate the progression of OC; however, further
investigations are required.
In conclusion, abnormalities in cell adhesion cause
the ECM to decompose and recombine, increasing the activity and
aggressiveness of tumor cells. Notably, these are crucial processes
for OC cell shedding and implantation. Results of the present study
demonstrated that high expression levels of LGALS1 were associated
with a poor prognosis in patients with OC. Moreover, results of the
present study identified six candidate genes that may regulate cell
adhesion pathways to participate in OC progression. However,
further studies into the specific mechanisms are required.
Transcriptional changes regulated by LGALS1 further the
understanding of signal networks, and may lead to the development
of novel targeted therapies for OC.
Acknowledgements
Not applicable.
Funding
The present research was supported by the Project of Jilin
Provincial Department of Science and Technology (grant no.
20210101442JC).
Availability of data and materials
The datasets used and/or analyzed during the current
study are available from the corresponding author on reasonable
request.
Authors' contributions
XL, HW and ZJ conceptualized and designed the study.
XL and HW wrote the manuscript. XL, HW, AJ, YC and LY carried out
the experiments and analyzed the data. ZJ received funding, ensured
that work-related difficulties were adequately investigated and
resolved, and approved the final version of the article. XL and HW
confirm the authenticity of all the raw data. All authors read and
approved the final manuscript.
Ethics approval and consent to
participate
All tissue collection was approved by the Ethics
Committee of the Second Hospital of Jilin University (ethics
approval no. 2020069; Changchun, China). All patients provided
written informed consent prior to study inclusion.
Patient consent for publication
Not applicable.
Competing interests
The authors declare that they have no competing
interests.
References
|
1
|
Bray F, Ferlay J, Soerjomataram I, Siegel
RL, Torre LA and Jemal A: Global cancer statistics 2018: GLOBOCAN
estimates of incidence and mortality worldwide for 36 cancers in
185 countries. CA Cancer J Clin. 68:394–424. 2018. View Article : Google Scholar : PubMed/NCBI
|
|
2
|
Webb PM and Jordan SJ: Epidemiology of
epithelial ovarian cancer. Best Pract Res Clin Obstet Gynaecol.
41:3–14. 2017. View Article : Google Scholar : PubMed/NCBI
|
|
3
|
Sung H, Ferlay J, Siegel RL, Laversanne M,
Soerjomataram I, Jemal A and Bray F: Global cancer statistics 2020:
GLOBOCAN estimates of incidence and mortality worldwide for 36
cancers in 185 countries. CA Cancer J Clin. 71:209–249. 2021.
View Article : Google Scholar : PubMed/NCBI
|
|
4
|
Arend RC, Jackson-Fisher A, Jacobs IA,
Chou J and Monk BJ: Ovarian cancer: New strategies and emerging
targets for the treatment of patients with advanced disease. Cancer
Biol Ther. 22:89–105. 2021. View Article : Google Scholar : PubMed/NCBI
|
|
5
|
Falzone L, Scandurra G, Lombardo V,
Gattuso G, Lavoro A, Distefano AB, Scibilia G and Scollo P: A
multidisciplinary approach remains the best strategy to improve and
strengthen the management of ovarian cancer (Review). Int J Oncol.
59:532021. View Article : Google Scholar : PubMed/NCBI
|
|
6
|
Baldwin LA, Huang B, Miller RW, Tucker T,
Goodrich ST, Podzielinski I, DeSimone CP, Ueland FR, van Nagell JR
and Seamon LG: Ten-year relative survival for epithelial ovarian
cancer. Obstet Gynecol. 120:612–618. 2012. View Article : Google Scholar : PubMed/NCBI
|
|
7
|
Yeung TL, Leung CS, Yip KP, Yeung CLA,
Wong STC and Mok SC: Cellular and molecular processes in ovarian
cancer metastasis. A review in the theme: Cell and molecular
processes in cancer metastasis. Am J Physiol Cell Physiol.
309:C444–C456. 2015. View Article : Google Scholar : PubMed/NCBI
|
|
8
|
Camby I, Le Mercier M, Lefranc F and Kiss
R: Galectin-1: A small protein with major functions. Glycobiology.
16:137R–157R. 2006. View Article : Google Scholar : PubMed/NCBI
|
|
9
|
Janiszewska M, Primi MC and Izard T: Cell
adhesion in cancer: Beyond the migration of single cells. J Biol
Chem. 295:2495–2505. 2020. View Article : Google Scholar : PubMed/NCBI
|
|
10
|
Yang RY, Rabinovich GA and Liu FT:
Galectins: Structure, function and therapeutic potential. Exp Rev
Mol Med. 10:e172008. View Article : Google Scholar : PubMed/NCBI
|
|
11
|
Perillo NL, Marcus ME and Baum LG:
Galectins: Versatile modulators of cell adhesion, cell
proliferation, and cell death. J Mol Med (Berl). 76:402–412. 1998.
View Article : Google Scholar : PubMed/NCBI
|
|
12
|
Ham IH, Lee D and Hur H: Role of
cancer-associated fibroblast in gastric cancer progression and
resistance to treatments. J Oncol. 2019:62707842019. View Article : Google Scholar : PubMed/NCBI
|
|
13
|
Chong Y, Tang D, Gao J, Jiang X, Xu C,
Xiong Q, Huang Y, Wang J, Zhou H, Shi Y and Wang D: Galectin-1
induces invasion and the epithelial-mesenchymal transition in human
gastric cancer cells via non-canonical activation of the hedgehog
signaling pathway. Oncotarget. 7:83611–83626. 2016. View Article : Google Scholar : PubMed/NCBI
|
|
14
|
Hsu YL, Hung JY, Chiang SY, Jian SF, Wu
CY, Lin YS, Tsai YM, Chou SH, Tsai MJ and Kuo PL: Lung
cancer-derived galectin-1 contributes to cancer associated
fibroblast-mediated cancer progression and immune suppression
through TDO2/kynurenine axis. Oncotarget. 7:27584–27598. 2016.
View Article : Google Scholar : PubMed/NCBI
|
|
15
|
Zhang PF, Li KS, Shen YH, Gao PT, Dong ZR,
Cai JB, Zhang C, Huang XY, Tian MX, Hu ZQ, et al: Galectin-1
induces hepatocellular carcinoma EMT and sorafenib resistance by
activating FAK/PI3K/AKT signaling. Cell Death Dis. 7:e22012016.
View Article : Google Scholar : PubMed/NCBI
|
|
16
|
Wu Y, Liu M, Li Z, Wu XB, Wang Y, Wang Y,
Nie M, Huang F, Ju J, Ma C, et al: LYAR promotes colorectal cancer
cell mobility by activating galectin-1 expression. Oncotarget.
6:32890–32901. 2015. View Article : Google Scholar : PubMed/NCBI
|
|
17
|
Masoodi M, Shah ZA, Beigh AH, Ahmad SZ,
Mir AW, Yasin B, Rasool R, Masoodi KZ and Bhat GM: Galectin-1 as a
predictive biomarker in ovarian cancer. J Ovarian Res. 14:1232021.
View Article : Google Scholar : PubMed/NCBI
|
|
18
|
Robinson MD, McCarthy DJ and Smyth GK:
edgeR: A Bioconductor package for differential expression analysis
of digital gene expression data. Bioinformatics. 26:139–140. 2010.
View Article : Google Scholar : PubMed/NCBI
|
|
19
|
Hu Z, Artibani M, Alsaadi A, Wietek N,
Morotti M, Shi T, Zhong Z, Gonzalez LS, El-Sahhar S, Carrami EM, et
al: The repertoire of Serous Ovarian cancer non-genetic
heterogeneity revealed by single-cell sequencing of normal
fallopian tube epithelial cells. Cancer Cell. 37:226–242. e2272020.
View Article : Google Scholar : PubMed/NCBI
|
|
20
|
Perets R, Wyant GA, Muto KW, Bijron JG,
Poole BB, Chin KT, Chen JY, Ohman AW, Stepule CD, Kwak S, et al:
Transformation of the fallopian tube secretory epithelium leads to
high-grade serous ovarian cancer in Brca;Tp53;Pten models. Cancer
Cell. 24:751–765. 2013. View Article : Google Scholar : PubMed/NCBI
|
|
21
|
Arcolia V, Journe F, Wattier A, Leteurtre
E, Renaud F, Gabius HJ, Remmelink M, Decaestecker C, Rodriguez A,
Boutry S, et al: Galectin-1 is a diagnostic marker involved in
thyroid cancer progression. Int J Oncol. 51:760–770. 2017.
View Article : Google Scholar : PubMed/NCBI
|
|
22
|
Chetry M, Song Y, Pan C, Li R, Zhang J and
Zhu X: Effects of Galectin-1 on biological behavior in cervical
cancer. J Cancer. 11:1584–1595. 2020. View Article : Google Scholar : PubMed/NCBI
|
|
23
|
van de Vijver MJ, He YD, Veer LJ, Dai H,
Hart AAM, Voskuil DW, Schreiber GJ, Peterse JL, Roberts C, Marton
MJ, et al: A gene-expression signature as a predictor of survival
in breast cancer. New Engl J Med. 347:1999–2009. 2002. View Article : Google Scholar : PubMed/NCBI
|
|
24
|
Lankadasari MB, Aparna JS, Mohammed S,
James S, Aoki K, Binu VS, Nair S and Harikumar KB: Targeting
S1PR1/STAT3 loop abrogates desmoplasia and chemosensitizes
pancreatic cancer to gemcitabine. Theranostics. 8:3824–3840. 2018.
View Article : Google Scholar : PubMed/NCBI
|
|
25
|
Paz H, Joo EJ, Chou CH, Fei F, Mayo KH,
Abdel-Azim H, Ghazarian H, Groffen J and Heisterkamp N: Treatment
of B-cell precursor acute lymphoblastic leukemia with the
Galectin-1 inhibitor PTX008. J Exp Clin Cancer Res. 37:672018.
View Article : Google Scholar : PubMed/NCBI
|
|
26
|
Orozco CA, Martinez-Bosch N, Guerrero PE,
Vinaixa J, Dalotto-Moreno T, Iglesias M, Moreno M, Djurec M,
Poirier F, Gabius HJ, et al: Targeting galectin-1 inhibits
pancreatic cancer progression by modulating tumor-stroma crosstalk.
Proc Natl Acad Sci USA. 115:E3769–E3778. 2018. View Article : Google Scholar : PubMed/NCBI
|
|
27
|
Ricciardelli C, Lokman NA, Ween MP and
Oehler MK: WOMEN IN CANCER THEMATIC REVIEW: Ovarian
cancer-peritoneal cell interactions promote extracellular matrix
processing. Endocr Relat Cancer. 23:T155–T168. 2016. View Article : Google Scholar : PubMed/NCBI
|
|
28
|
Kicman A, Niczyporuk M, Kulesza M, Motyka
J and Lawicki S: Utility of matrix metalloproteinases in the
diagnosis, monitoring and prognosis of ovarian cancer patients.
Cancer Manag Res. 14:3359–3382. 2022. View Article : Google Scholar : PubMed/NCBI
|
|
29
|
Storti P, Marchica V and Giuliani N: Role
of galectins in multiple myeloma. Int J Mol Sci. 18:27402017.
View Article : Google Scholar : PubMed/NCBI
|
|
30
|
Li B, Shen W, Peng H, Li Y, Chen F, Zheng
L, Xu J and Jia L: Fibronectin 1 promotes melanoma proliferation
and metastasis by inhibiting apoptosis and regulating EMT. Onco
Targets Ther. 12:3207–3221. 2019. View Article : Google Scholar : PubMed/NCBI
|
|
31
|
Park J and Schwarzbauer JE: Mammary
epithelial cell interactions with fibronectin stimulate
epithelial-mesenchymal transition. Oncogene. 33:1649–1657. 2014.
View Article : Google Scholar : PubMed/NCBI
|
|
32
|
Wu WJ, Wang Q, Zhang W and Li L:
Identification and prognostic value of differentially expressed
proteins of patients with platinum resistance epithelial ovarian
cancer in serum. Zhonghua Fu Chan Ke Za Zhi. 51:515–523. 2016.(In
Chinese). PubMed/NCBI
|
|
33
|
Yoshihara M, Kajiyama H, Yokoi A, Sugiyama
M, Koya Y, Yamakita Y, Liu W, Nakamura K, Moriyama Y, Yasui H, et
al: Ovarian cancer-associated mesothelial cells induce acquired
platinum-resistance in peritoneal metastasis via the FN1/Akt
signaling pathway. Int J Cancer. 146:2268–2280. 2020. View Article : Google Scholar : PubMed/NCBI
|
|
34
|
Yokoi A, Matsumoto T, Oguri Y, Hasegawa Y,
Tochimoto M, Nakagawa M and Saegusa M: Upregulation of fibronectin
following loss of p53 function is a poor prognostic factor in
ovarian carcinoma with a unique immunophenotype. Cell Commun
Signal. 18:1032020. View Article : Google Scholar : PubMed/NCBI
|
|
35
|
Navab R, Strumpf D, To C, Pasko E, Kim KS,
Park CJ, Hai J, Liu J, Jonkman J, Barczyk M, et al: Integrin α11β1
regulates cancer stromal stiffness and promotes tumorigenicity and
metastasis in non-small cell lung cancer. Oncogene. 35:1899–1908.
2016. View Article : Google Scholar : PubMed/NCBI
|
|
36
|
Ando T, Kage H, Matsumoto Y, Zokumasu K,
Yotsumoto T, Maemura K, Amano Y, Watanabe K, Nakajima J, Nagase T,
et al: Integrin alpha 11 in non-small cell lung cancer is
associated with tumor progression and postoperative recurrence.
Cancer Sci. 111:200–208. 2020. View Article : Google Scholar : PubMed/NCBI
|
|
37
|
Primac I, Maquoi E, Blacher S, Heljasvaara
R, Van Deun J, Smeland HYH, Canale A, Louis T, Stuhr L, Sounni NE,
et al: Stromal integrin alpha 11 regulates PDGFR beta signaling and
promotes breast cancer progression. J Clin Invest. 129:4509–4528.
2019. View Article : Google Scholar
|
|
38
|
Levental KR, Yu H, Kass L, Lakins JN,
Egeblad M, Erler JT, Fong SF, Csiszar K, Giaccia A, Weninger W, et
al: Matrix crosslinking forces tumor progression by enhancing
integrin signaling. Cell. 139:891–906. 2009. View Article : Google Scholar : PubMed/NCBI
|
|
39
|
Gao YF, Zhu T, Chen J, Liu L and Ouyang R:
Knockdown of collagen-1(III) inhibits glioma cell proliferation and
migration and is regulated by miR128-3p. Oncol Lett. 16:1917–1923.
2018.PubMed/NCBI
|
|
40
|
Shen Y, Li X, Wang D, Zhang L, Li X, Su L,
Fan X and Yang X: COL3A1: Potential prognostic predictor for head
and neck cancer based on immune-microenvironment alternative
splicing. Cancer Med. 12:4882–4894. 2022. View Article : Google Scholar : PubMed/NCBI
|
|
41
|
Yuan L, Shu B, Chen L, Qian K, Wang Y,
Qian G, Zhu Y, Cao X, Xie C, Xiao Y and Wang X: Overexpression of
COL3A1 confers a poor prognosis in human bladder cancer identified
by co-expression analysis. Oncotarget. 8:70508–70520. 2017.
View Article : Google Scholar : PubMed/NCBI
|
|
42
|
Pelli A, Vayrynen JP, Klintrup K, Makela
J, Makinen MJ, Tuomisto A and Karttunen TJ: Gremlin1 expression
associates with serrated pathway and favourable prognosis in
colorectal cancer. Histopathology. 69:831–838. 2016. View Article : Google Scholar : PubMed/NCBI
|
|
43
|
Gonzalez-Gonzalez L and Alonso J:
Periostin: A matricellular protein with multiple functions in
cancer development and progression. Front Oncol. 8:2252018.
View Article : Google Scholar : PubMed/NCBI
|
|
44
|
Yue H, Li W, Chen R, Wang J, Lu X and Li
J: Stromal POSTN induced by TGF-β1 facilitates the migration and
invasion of ovarian cancer. Gynecol Oncol. 160:530–538. 2021.
View Article : Google Scholar : PubMed/NCBI
|
|
45
|
van den Brule F, Califice S, Garnier F,
Fernandez PL, Berchuck A and Castronovo V: Galectin-1 accumulation
in the ovary carcinoma peritumoral stroma is induced by ovary
carcinoma cells and affects both cancer cell proliferation and
adhesion to laminin-1 and fibronectin. Lab Invest. 83:377–386.
2003. View Article : Google Scholar : PubMed/NCBI
|