Introduction
Locoregional recurrence (LRR) in breast cancer is
defined as recurrence in the ipsilateral breast/chest wall or
regional lymph nodes (ipsilateral axillary, supraclavicular and
internal mammary lymph nodes). LRR is the most common recurrence
pattern after curative treatment, with 10-year LRR rates of 2–10%
after breast-conserving surgery and 5–10% after mastectomy,
regardless of chemotherapy (1,2). Risk
factors for LRR have been known for several decades, including
being diagnosed under the age of 49, tumors ≥4 cm, high tumor
grades, lymphovascular invasion, absence of hormone receptors and
multiple axillary lymph node metastases (3,4).
Radiomics is a powerful technique that allows the
extraction of a wide range of features from radiological images,
encompassing first-order statistics, shape-based features and
texture features (5). Radiomics
enhances the understanding of complex tumor characteristics and
provides valuable insights. This methodology has found application
in the field of oncology, where it aims to improve diagnostic
accuracy, prognostic assessment and support clinical
decision-making (6,7).
Radiomics using various imaging tools such as
ultrasonography or positron emission tomography-computed tomography
can be used for breast tumor diagnosis, predicting the response of
tumors to prior chemotherapy and for the prognosis of patients
(8–10). Magnetic resonance imaging (MRI) is
also an imaging tool used in the diagnosis of breast cancer, and as
it acquires more diverse sequences compared with other imaging
tools, it provides more potential data that can be used for
radiomics. Therefore, radiomics using MRI has the potential to
differentiate between malignant and benign breast lesions (11), and could potentially predict the
molecular subtype of the breast cancer (12), axillary lymph node status (13), tumor response to chemotherapy
(14) and survival outcomes
(15). Despite these applications,
MRI-based radiomics for predicting the risk of LRR in patients with
breast cancer remains an area that has not yet been reported.
Therefore, the present study aimed to develop machine learning
(ML)-based radiomics models to predict the risk of LRR in patients
with breast cancer, leveraging the valuable information obtained
from preoperative MRI.
Materials and methods
Study design and patient
selection
To develop ML-based radiomics models for predicting
LRR in patients with breast cancer, the present study
retrospectively reviewed data from 3,007 patients in South Korea
that met the following inclusion criteria: i) Diagnosed with breast
cancer upon diagnostic breast MRI from January 2013 to December
2017 at Yonsei Cancer Center (Seoul, South Korea); ii) diagnosed
with breast cancer or ductal carcinoma in situ based on
histological features; iii) received standard breast cancer
treatment with a curative aim (for T1N0-1 or T2N0–1 tumors and
ductal carcinoma in situ, breast-conserving surgery +
radiotherapy or mastectomy alone; for T3 or T4 tumors of any
clinical N status or any tumor size with clinical N2 or N3 disease,
neoadjuvant chemotherapy followed by breast-conserving surgery +
radiotherapy or mastectomy alone; in any stage, hormone therapy or
targeted drug therapy was considered depending on the status of
hormone receptors or human epidermal growth factor receptor 2); and
iv) patients aged ≥20 years at the time of diagnosis. The exclusion
criteria were as follows: i) There was no information on age,
breast cancer stage (T and N), pathology, molecular subtype
(luminal type) or LRR; ii) the primary breast tumor was not
delineated on the breast MRI; iii) there was distant metastasis at
the initial diagnosis; iv) the patient had bilateral breast cancer;
v) the patient was male with breast cancer; or vi) the patient had
undergone a preoperative breast MRI at an outside hospital.
Finally, 2,269 patients were included in the present cohort.
Propensity score matching (PSM) was performed to
adjust for clinical factors between patients with and patients
without LRR. Propensity scores were calculated using a
multivariable logistic regression (LR) model adjusting for age, T
stage, N stage, pathology and luminal type. Using nearest-neighbor
matching with a caliper distance of 0.01 standard deviations of the
logit of the propensity score, patients with and without LRR were
matched in a 1:3 ratio based on their scores. The standardized mean
difference was used to evaluate the balance of covariate
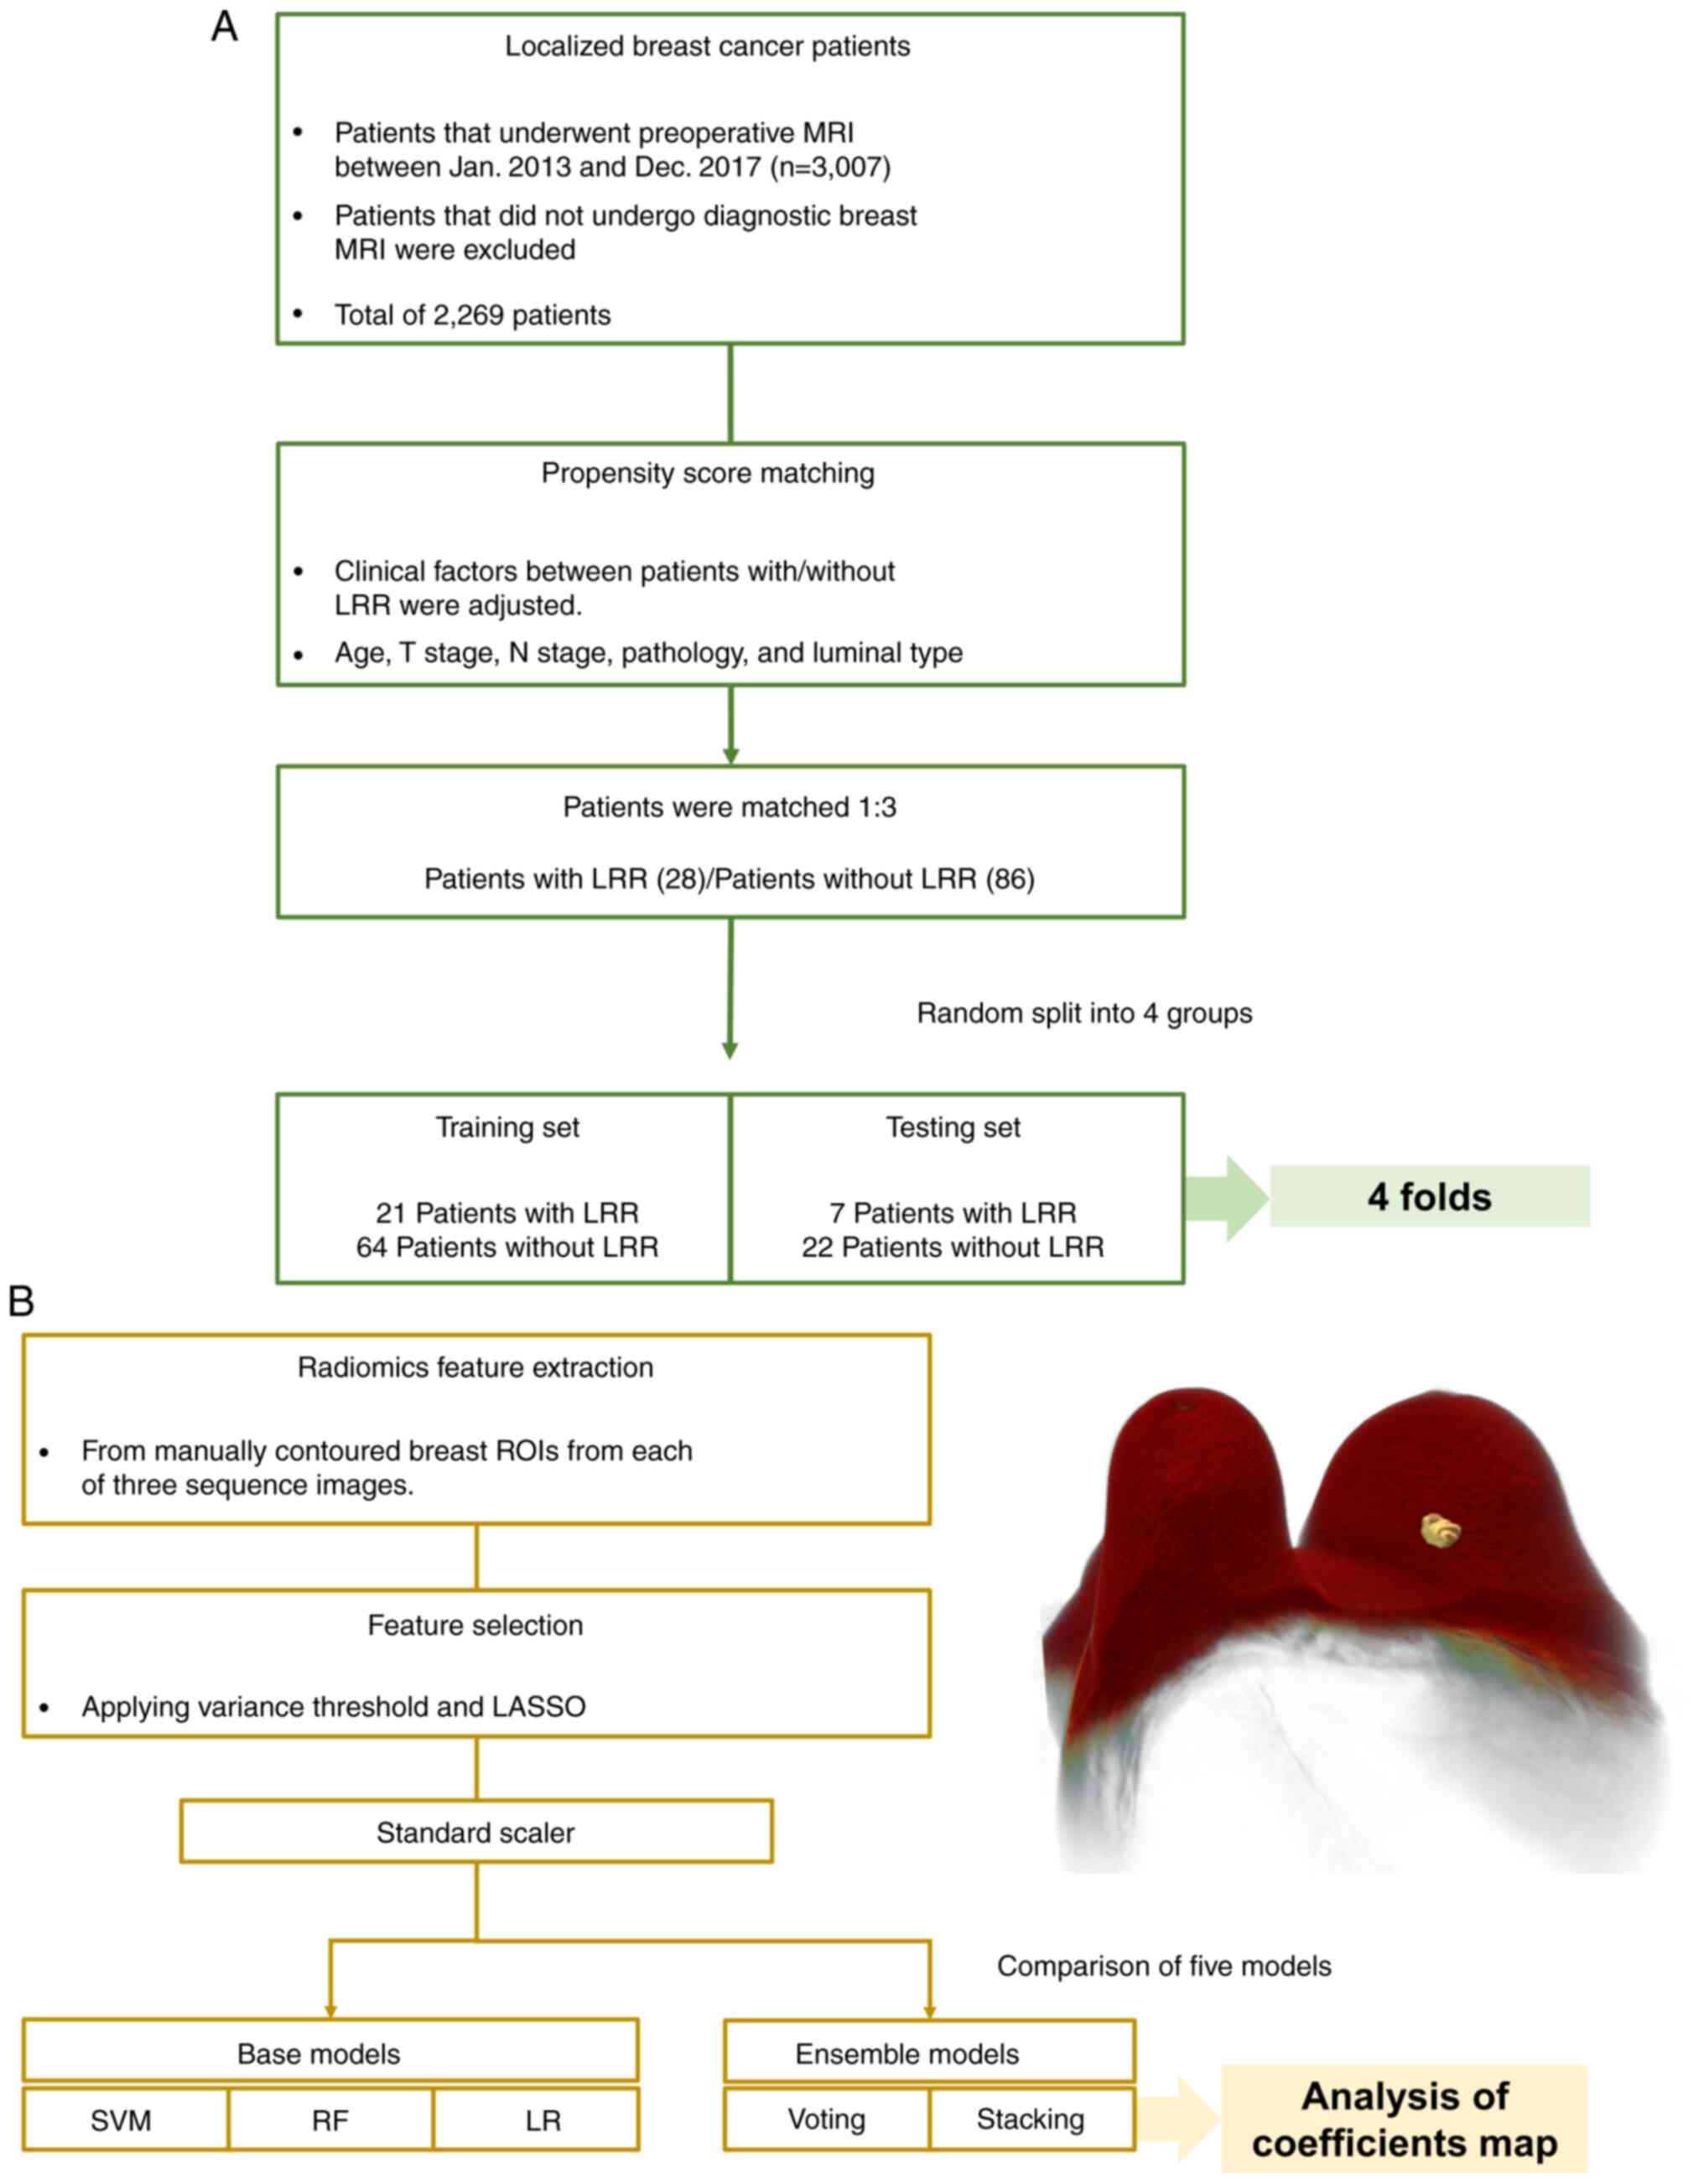
distribution between the two groups. The patient selection
flowchart is presented in Fig.
1A.
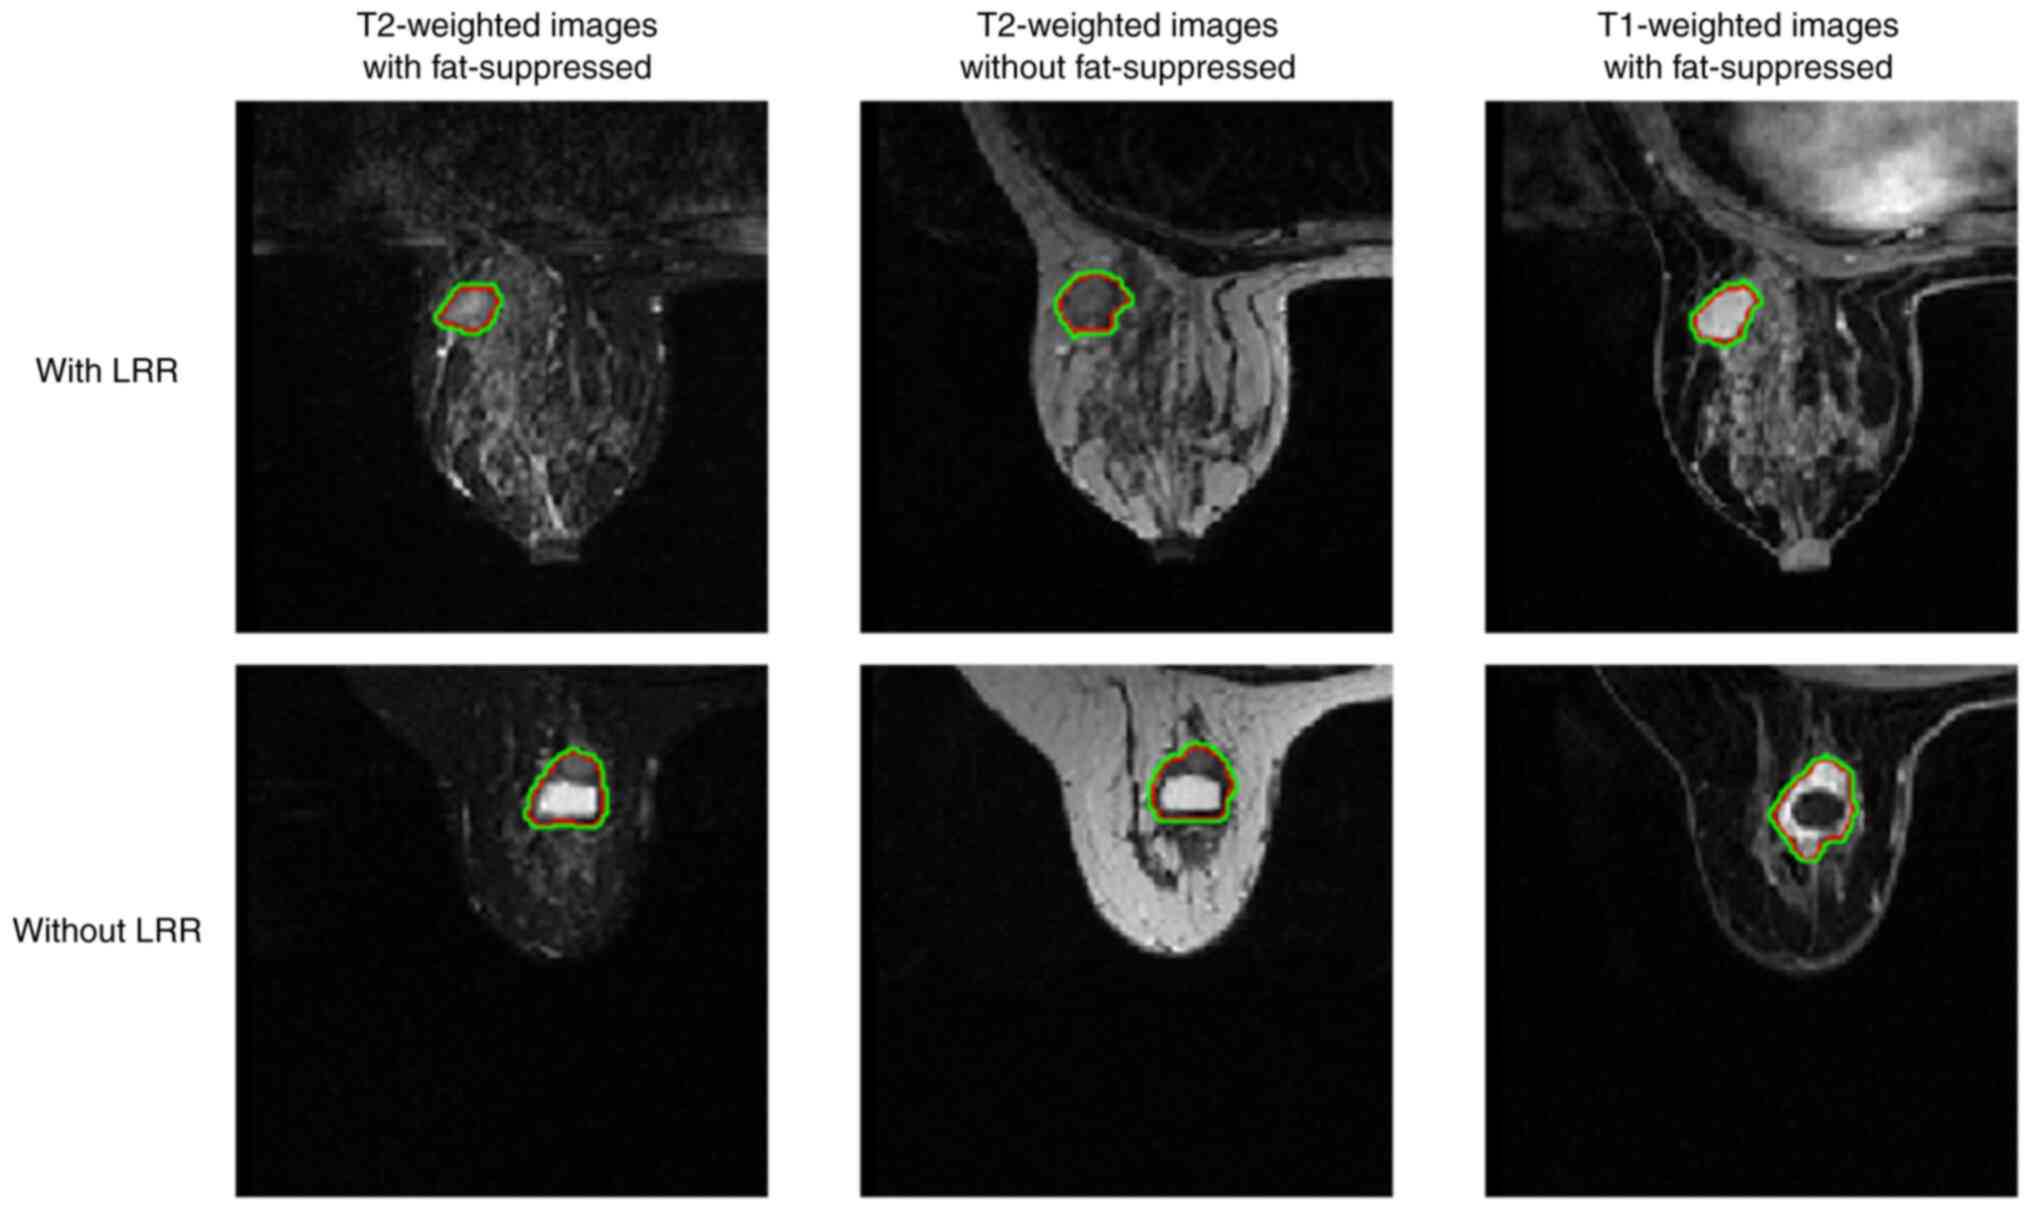
Image modality and volumes of interest
delineation
Breast MRI examinations were performed using two
3-Tesla MRI scanners (Discovery MR750w; GE Healthcare) or Philips
Achieva; Philips Medical Systems B.V.). The sequences used for
radiomics analysis were T2-weighting with and without fat
suppression and contrast-enhanced T1-weighting with fat
suppression, both of which are widely used for the prognostication
of patients with breast cancer and performed as standard imaging
sequences in numerous institutions (16,17).
Three board-certified radiation oncologists manually
contoured primary breast tumors on each of the three sequence
images, and one experienced breast radiation oncologist confirmed
the contours. Before developing the ML-based radiomics (Fig. 1B) the following step was performed:
referencing a previous study (18),
which indicated that the tissue surrounding the tumor can act as an
indicator of the treatment outcome, the 1-mm margin was expanded in
primary tumors to set the volumes of interest (Fig. 2).
Radiomics feature extraction and
selection
The radiomics features were extracted using
PyRadiomics (version 3.0) (19)
from the manually contoured breast regions of interest (ROIs) from
each of the three sequence images. The MRI resolutions slightly
varied across the different images; therefore, before extracting
the features, all images were resampled to have a consistent
resolution of 0.473 pixel spacing and 3-mm slice thickness, which
was the best resolution in the present dataset. For each patient,
1,688 radiomics features were extracted from nine different types
of images, which included the original image and images that were
processed using image processing techniques available in
PyRadiomics, including exponential, gradient, local binary
patterns, Laplacian of Gaussian, logarithm, square, square root and
wavelet functions. For the wavelet images, high-pass (H) and
low-pass (L) filters were applied in three dimensions, resulting in
a total of eight different combinations of the filters (such as
LHL, HHL, HLL, HHH, HLH, LHH, LLH and LLL). Subsequently, these
1,688 features were concatenated across all features to yield a
total of 5,064 radiomics features per patient. The extracted
radiomics features were categorized into seven groups, including
first-order statistics, shape-based features, gray-level
co-occurrence matrix (GLCM) (20)
features, gray-level run length matrix (GLRLM) (21) features, gray-level size zone matrix
(GLSZM) (22) features, gray-level
dependence matrix (GLDM) (23)
features and neighborhood gray tone difference matrix (NGTDM)
features (24). The first-order
statistics described the distribution of voxel intensities within
the ROI, while the shape-based features described the shape and
size of the ROI. The GLCM, GLRLM and GLSZM features described the
spatial relationships between pairs or groups of voxels based on
their intensity values, and the GLDM features described the
dependence between voxels based on their intensity values, for
example, contrast and homogeneity. In addition to these features,
the NGTDM features were used to describe the non-uniformity of
voxel values, which reflected the local texture information around
each voxel.
The next step was the selection of features to
reduce the redundancy among the radiomics features that might not
significantly contribute to the prediction. Among the extracted
radiomics features from each patient in the training set, 47–51
features were selected depending on the fold by applying a variance
threshold and least absolute shrinkage and selection operator
(LASSO), which removes low variance features and reduces the
coefficients of unimportant features to zero with L1 norm
regularization (25). Each feature
was individually transformed to have unit variance using the
StandardScaler function of the scikit-learn library (version
0.23.2) (26) on the training set,
and the fitted scaling method was applied to the testing set. The
refined features were used as inputs for the predictive models to
predict the risk of LRR in breast cancer.
Predictive models of LRR
The stacking model involves utilizing predictions
generated by a set of diverse base models to train a meta-model
that generates the final prediction (27). In the present study, support vector
machine (SVM) (28), random forest
(RF) (29) and LR were used as base
models for stacking, with LR serving as the meta-model. First, the
base models were trained to learn the underlying patterns and
relationships in the data to make predictions based on the input
features; thereafter, the meta-model was trained based on the
predictions generated by the base models. The predictions generated
by the base models were used as features, and the meta-model used
these features to produce the final prediction.
For comparison with the stacking model, the SVM, RF
and LR models as well as a voting ensemble model were constructed.
In the voting ensemble model, SVM, RF and LR were used to generate
predictions, and the final predictions were obtained through
combining predictions via a majority vote, where each model's
prediction contributed to the ensemble decision. The construction
of these models utilized the same dataset and preprocessing as the
stacking model. Finally, the performance of each individual model
was compared with the stacking model to determine if the
combination of models in the stacking ensemble increased the
overall predictive power of the model. The overall ML-based
radiomics flow chart is presented in Fig. 1B.
The full patient cohort, consisting of 114 patients
after PSM, was randomly split into four groups for four-fold
stratified cross-validation. The optimal α value, which controls
the regularization strength for the LASSO, was set to 0.02. In the
RF model, five estimators were included. The regularization
parameters for the SVM and LR models were set to 20 and 1,
respectively. All predictive models were implemented using Python
(version 3.8.3) (Python Software Foundation), scikit-learn and
PyRadiomics.
Statistical analysis
To verify the performances of the five different
models, the accuracy (ACC), sensitivity (SEN), specificity (SPE)
and the area under the receiver operating characteristic curve
(AUC) were quantitatively assessed. The prediction value used to
calculate ACC, SEN, and SPE was defined as a discrete variable by
applying a threshold to the output values, which ranged between 0
and 1 and could be interpreted as probabilities of belonging to a
particular class. The metrics were defined as follows, where TP
represents true positive; TN, true negative; FP, false positive;
and FN, false negative: i) ACC=(NTP +
NTN)/(NTP + NTN + NFP +
NFN); ii) SEN=NTP/(NTP +
NFN); and iii) SPE=NTN/(NTN +
NFP). For the AUC, the output values of the model were
used directly without applying a threshold, and the AUC was
calculated based on the true positive rate and false positive rate
over a range of thresholds. P<0.05 was considered to indicate a
statistically significant difference.
To provide intuitive feedback on the features that
significantly contributed to the proposed decision of the model,
additional analysis was conducted using a coefficient map to assess
the selected features across the different folds of the stacking
model. This analysis indicated that the relationship of each
feature was either positively or negatively correlated with the
decision of the model, and the magnitude of the coefficient
indicated the strength of the correlation.
Results
Baseline characteristics
Before PSM, the median age at diagnosis of all
patients was 51 years (range, 20–83 years). The LRR group consisted
of a higher percentage of patients with more advanced N stages and
more basal-like breast cancer compared with that of the patients
without LRR. After adjusting for propensity scores, 86 patients
without LRR and 28 patients with LRR were matched, and the baseline
characteristics were well-balanced. The baseline characteristics of
patients with or without LRR before and after PSM are presented in
Table I.
 | Table I.Baseline characteristics of patients
with and without LRR before and after PSM. |
Table I.
Baseline characteristics of patients
with and without LRR before and after PSM.
| A, Before PSM |
|---|
|
|---|
| Characteristic | No LRR
(n=2,239) | LRR (n=30) | P-value | SMD |
|---|
| Median age (range),
years | 51 (20–83) | 48 (26–63) | 0.111 | 0.321 |
| Pathology, n
(%) |
|
| 0.446 | 0.112 |
|
IDC | 1,601 (71.5) | 24 (80.0) |
|
|
|
DCIS | 351 (15.7) | 2 (6.7) |
|
|
|
Others | 287 (12.8) | 4 (13.3) |
|
|
| T stage, n (%) |
|
| 0.279 | 0.249 |
|
Tis | 526 (23.5) | 5 (16.7) |
|
|
| T1 | 1,259 (56.2) | 15 (50.0) |
|
|
| T2 | 408 (18.2) | 10 (33.3) |
|
|
| T3 | 36 (1.6) | 0 (0.0) |
|
|
| T4 | 10 (0.4) | 0 (0.0) |
|
|
| N stage, n (%) |
|
| 0.002 | 0.495 |
| N0 | 1,674 (74.8) | 14 (46.7) |
|
|
| N1 | 408 (18.2) | 10 (33.3) |
|
|
| N2 | 106 (4.7) | 3 (10.0) |
|
|
| N3 | 51 (2.3) | 3 (10.0) |
|
|
| Luminal type, n
(%) |
|
| <0.001 | 0.871 |
| A | 817 (36.5) | 4 (13.3) |
|
|
| B | 637 (28.5) | 4 (13.3) |
|
|
|
HER2-enriched | 371 (16.6) | 6 (20.0) |
|
|
|
Basal-like | 414 (18.5) | 16 (53.3) |
|
|
|
| B, After
PSM |
|
|
Characteristic | No LRR
(n=86) | LRR
(n=28) | P-value | SMD |
|
| Median age (range),
years | 48.5 (23–75) | 49 (26–63) | 0.941 | 0.057 |
| Pathology, n
(%) |
|
| 0.703 | 0.129 |
|
IDC | 63 (73.3) | 23 (82.1) |
|
|
|
DCIS | 9 (10.5) | 2 (7.1) |
|
|
|
Others | 14 (16.3) | 3 (10.7) |
|
|
| T stage, n (%) |
|
| 0.505 | 0.025 |
|
Tis | 21 (24.4) | 4 (14.3) |
|
|
| T1 | 37 (43.0) | 14 (50.0) |
|
|
| T2 | 22 (25.6) | 10 (35.7) |
|
|
| T3 | 5 (5.8) | 0 (0.0) |
|
|
| T4 | 1 (1.2) | 0 (0.0) |
|
|
| N stage, n (%) |
|
| 0.195 | 0.076 |
| N0 | 52 (60.5) | 14 (50.0) |
|
|
| N1 | 14 (16.3) | 10 (35.7) |
|
|
| N2 | 12 (14.0) | 2 (7.1) |
|
|
| N3 | 8 (9.3) | 2 (7.1) |
|
|
| Luminal type, n
(%) |
|
| 0.891 | 0.062 |
| A | 11 (12.8) | 4 (14.3) |
|
|
| B | 13 (15.1) | 3 (10.7) |
|
|
|
HER2-enriched | 14 (16.3) | 6 (21.4) |
|
|
|
Basal-like | 48 (55.8) | 15 (53.6) |
|
|
Comparison of model performances
According to the results of four-fold stratified
cross-validation, in each fold, the training set comprised of 21
patients with LRR and 64 patients without LRR, whereas the
corresponding testing set comprised of 7 patients with LRR and 22
patients without LRR. Table II
presents the performance of the five different models obtained
through the four-fold stratified cross-validation. Based on the
results, the stacking model demonstrated a higher predictive power
compared with the individual models in terms of the AUC. The
stacking model achieved the highest AUC [0.78; 95% confidence
interval (CI), 0.74–0.82], followed by the LR model (0.70; 95% CI,
0.64–0.74), SVM model (0.67; 95% CI, 0.63–0.71), voting model
(0.66; 95% CI, 0.62–0.69) and RF model (0.61; 95% CI,
0.57–0.64).
| Table II.Performance comparison of five
predictive models using a four-fold stratified
cross-validation. |
Table II.
Performance comparison of five
predictive models using a four-fold stratified
cross-validation.
| Model | Accuracy | Sensitivity | Specificity | AUC |
|---|
| SVM | 77.98±7.92 | 57.15±14.25 | 76.83±13.93 | 0.67±0.04 |
| RF | 72.78±3.36 | 35.75±12.38 | 84.78±7.17 | 0.61±0.04 |
| LR | 64.93±3.58 | 78.55±7.15 | 60.43±2.50 | 0.70±0.05 |
| Voting | 68.40±2.89 | 60.70±15.55 | 70.78±8.25 | 0.66±0.04 |
| Stacking | 76.38±4.16 | 82.13±6.19 | 74.53±4.69 | 0.78±0.04 |
Features in the proposed model
Table III presents
the detailed information of the analysis on the features
categorized as sequences, image types and classes. The analysis
revealed that a total of 17 features consistently contributed to
the decision-making process of the models, as they appeared in all
four folds.
| Table III.Information of features that
consistently contributed to the decision-making process of the
model across all four folds. |
Table III.
Information of features that
consistently contributed to the decision-making process of the
model across all four folds.
| A, T2-weighted
images with fat-suppressed |
|---|
|
|---|
| Image types | Classes | Features |
|---|
|
Wavelet-LLLa | First-order | Variance |
|
| GLDM | Large dependence
high gray level emphasis |
| Square root | GLRLM | Run length
non-uniformity |
|
| B, T2-weighted
images without fat-suppressed |
|
| Image
types | Classes |
Features |
|
|
Wavelet-LLLa | First-order | Variance |
|
| GLRLM | Run length
non-uniformity |
|
Wavelet-HLLa | First-order | Variance |
| LBP-3D | First-order | Variance |
|
| GLSZM | Large area high
gray level emphasis |
| Exponential | GLRLM | Run length
non-uniformity |
| Square root | GLDM | Large dependence
high gray level emphasis |
| Logarithm | GLRLM | Run length
non-uniformity |
|
| C, T1-weighted
images with fat-suppressed |
|
| Image
types | Classes |
Features |
|
| Original | GLDM | Large dependence
high gray level emphasis |
|
| NGTDM | Busyness |
|
Wavelet-LLLa | Frist-order | Variance |
| LBP-3D | GLSZM | Large area high
gray level emphasis |
| Square root | GLDM | Large dependence
high gray level emphasis |
| Logarithm | GLDM | Large dependence
high gray level emphasis |
The T2-weighted images with fat suppression
consistently used three features from the first-order, GLDM and
GLRLM groups; the T2-weighted images without fat suppression used
eight features from the first-order, GLDM, GLSZM and GLRLM groups;
and the T1-weighted images with fat suppression used six features
from the first-order, GLDM, GLSZM and NGTDM groups.
The large dependence high gray-level emphasis
(LDHGLE) feature from T2-weighted images without fat suppression
with a square root image type (symbol ‘o’ in Fig. 3) had the highest positive
coefficient across the folds, suggesting that distinct patterns and
boundaries of tissue are an important predictor of LRR. By
contrast, the variance feature from the same image sequence
(T2-weighted images without fat suppression) (symbol ‘e’ in
Fig. 3) had the highest negative
coefficient across the folds, indicating that voxel intensity
heterogeneity is a predictor of not having LRR.
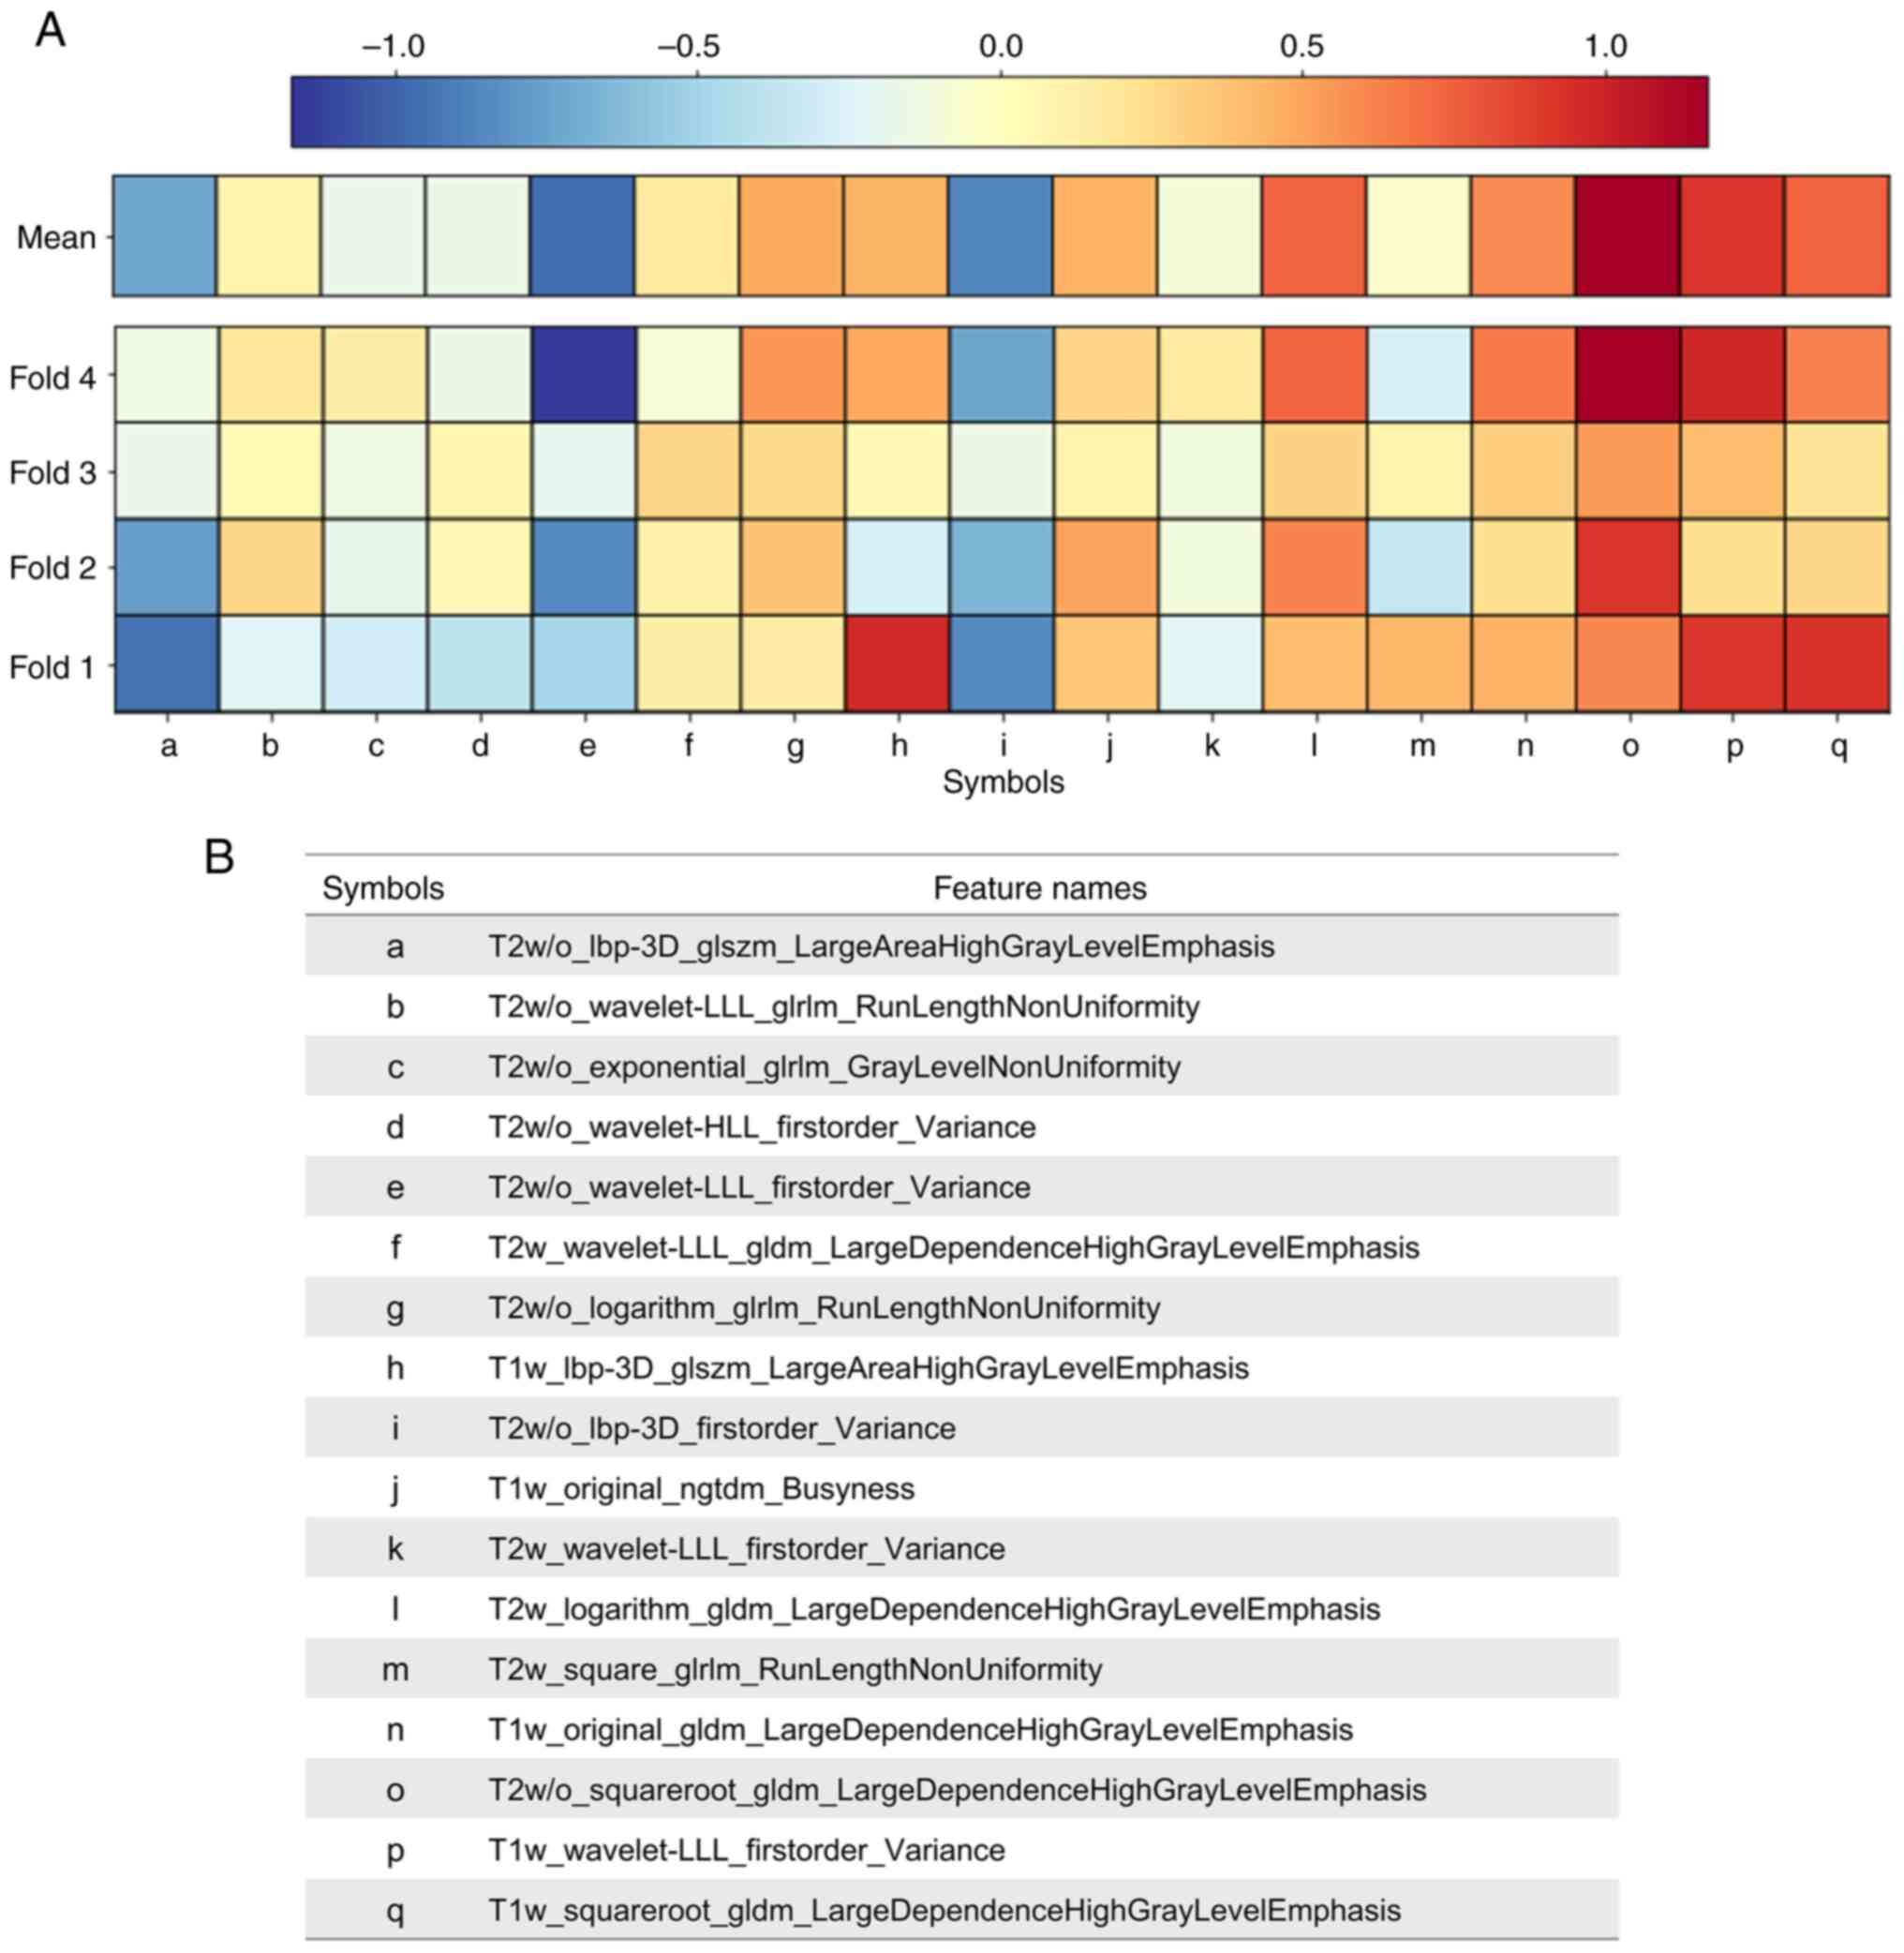 | Figure 3.Folds of the stacking model. (A)
Coefficients map providing intuitive feedback of selected features
across the folds of the stacking model. Red and blue indicate
positive and negative contributions to the model decision,
respectively. (B) Selected features from the four folds are listed
by name. lbp-3D, local binary patterns-three dimensional; gldm,
gray-level dependence matrix; glrlm, gray-level run length matrix;
glszm, gray-level size zone matrix; ngtdm, neighborhood gray tone
difference matrix; H, high-pass filter; L, low-pass filter; w/o,
without; w, with. |
Discussion
To the best of our knowledge, the present study is
the first to develop an ML-based radiomics model using the stacking
method to predict the risk of LRR in patients with breast cancer
using three MRI sequences.
To optimize the predictive framework for LRR, three
commonly used ML algorithms, namely, SVM, RF and LR, were used as
base models for the stacking method. SVM is particularly adept at
classifying complex and non-linear data (28), RF combines multiple decision trees
to increase prediction ACC (29),
and LR uses a sigmoid function to map input features to
probabilities, thereby facilitating the interpretation of model
decisions. Furthermore, the aforementioned base models were used to
also construct a voting model. Although both voting and stacking
models used ensemble methods that involved combining the
predictions of multiple models to generate a final prediction, they
differed in their approaches to combining the base model
predictions. Specifically, the voting model used a simple majority
voting rule, whereas the stacking model used a more sophisticated
approach that entailed training a meta-model to combine the
predictions of the base models. Notably, the enhanced predictive
diversity afforded by the stacking approach resulted in the
superior performance of the stacking model compared with that of
the voting model.
Previous studies have demonstrated the potential of
using breast lesion texture as a non-invasive prognostic biomarker
for patients with breast cancer (30,31).
In these studies, numerous features, such as wavelet, skewness and
kurtosis, were extracted from T2-weighted magnetic resonance (MR)
images and T1-weighted dynamic contrast-enhanced MRI to study the
relationship between texture and risk of recurrence. The results
indicated that tumor heterogeneity quantified by lesion texture
could serve as an independent prognostic marker (30), and wavelet texture features could
predict the risk of tumor recurrence (31). Other studies have demonstrated the
potential of texture analysis to predict the response to treatment
(32,33). For example, first-order statistical
texture measures extracted from the tumor ROI have been used to
predict complete response to therapy, with skewness and kurtosis
being strongly correlated with the response (32). In another study, contrast
enhancement was used to generate a histogram from a pharmacokinetic
parametric map, indicating that patients with a favorable response
(clinical complete response, which represents disappearance of the
primary tumor; clinical partial response, which indicates a
reduction of ≥50% in the bidimensional diameters of the primary
tumor) display a decrease in heterogeneity after the first cycle of
neoadjuvant chemotherapy (17 patients, mitoxantrone + methotrexate;
6 patients, epirubicin + cisplatin + infusional 5-fluorouracil; 2
patients, cyclophosphamide + doxorubicin) (33). Overall, these studies suggest that
texture analysis using radiomics can be a useful tool to predict
the prognosis or response to treatment in breast cancer. Similarly,
in the radiomics models that were developed in the present study,
tissue homogeneity was a predictor of LRR. Although previous
studies analyzed tissue homogeneity with the uniformity of image
intensity through histograms (30–33),
the present study has the strength of analyzing the pattern in
detail by measuring the frequency of continuous high gray-level
pairs in the image along with voxel intensity uniformity. Intensity
uniformity is an important factor in predicting LRR (32), but the findings of the present study
suggest that LDHGLE also serves a significant role in the
prediction by detecting distinct patterns and boundaries in the
image that cannot be captured by intensity uniformity-based
features alone. A heterogeneous texture is reportedly associated
with differences in molecular biology (including on a genetic
level) and susceptibility to treatment (34–36).
Texture features, such as LDHGLE, capture texture variations of the
tumor, which can result in variations in the treatment response. A
heterogeneous texture, including LDHGLE, is associated with a lower
treatment response (30,31). Consequently, patients with tumors
exhibiting a heterogeneous texture may experience poor treatment
outcomes. Therefore, LDHGLE provides a complementary view to
intensity uniformity and may contribute to improving the LRR
prediction.
Previous studies on radiomics feature-based analysis
made use of ultrasound (37,38)
and mammography (39). Dasgupta
et al (37) classified
recurrence for patients using an SVM classifier and achieved an AUC
of 0.76 and revealed the beneficial role of texture features in the
characterization of tissue heterogeneity. In addition, Xiong et
al (38) demonstrated that
radiomics signatures including texture features, were associated
with disease-free survival. Furthermore, Tamez-Peña et al
(39) conducted an association
analysis between molecular signatures obtained from microarray
technology and image features extracted from mammography and
revealed a discernible difference in the texture features between
normal breast tissue and tumors. In contrast to ultrasound and
mammography, the present study specifically focused on MRI-based
analysis, which offers multidimensional and superior tissue
contrast images, enabling a more accurate characterization of the
tumor features compared with that of an ultrasound or
mammography.
A radiomics-based predictive model for LRR using
diagnostic MRI may be very useful in clinical practice. First, such
risk stratification might allow for an optimization of the
decision-making for cancer treatments, such as avoiding the
undertreatment of high-risk patients and overtreatment of low-risk
patients with breast cancer. The radiomics-based predictive model
presents promise in facilitating treatment decisions for patients
in ambiguous situations, commonly referred to as the ‘gray zone’.
For example, it might help to determine whether regional nodal
irradiation should be considered for breast-conserved patients or
whether postmastectomy radiotherapy is necessary for patients with
N1 stage breast cancer (40,41).
Second, in patients with a high risk of LRR based on the
radiomics-based predictive model, recurrence can be promptly
detected through close and meticulous observation after treatment.
Therefore, adding radiomics to the standard radiological workflow
could increase the prognostic value of breast imaging and improve
the treatment outcomes.
Despite these benefits, a number of limitations of
the present study must be acknowledged. Firstly, radiomics features
of lymph node metastasis can also affect LRR, but the stacking
model of the present study uses only the primary lesion in the
breast as the ROI. Secondly, as the number of patients that
experienced LRR in the present study cohort was small, the number
of patients included when developing the radiomics-based predictive
model was also small. Thirdly, the physiological relevance of the
selected features and their specific relationship with LRR should
be clarified. Additionally, as the model was developed through the
interaction of features extracted from Yonsei Cancer Center MRI
sequences, the predictive power may be uncertain when applying the
model of the present study in other hospitals that use different
sequences or machines produced by different manufacturers. To
increase the clinical applicability of the proposed predictive
model, such heterogeneities should be harmonized. To achieve this
aim, one potential strategy would be to leverage domain adaptation
with deep learning techniques to learn a domain-invariant feature
representation that captures the common features across different
MR sequences, while ignoring the differences that are irrelevant to
the prediction of LRR. This may improve the transferability and
robustness of the predictive model and reduce its dependence on a
specific MR sequence.
Because of the aforementioned limitations, the
performance of the radiomics-based predictive model must be
verified in other institutions. Therefore, an external validation
study was initiated to investigate the efficacy of the stacking
model of the present study and is still ongoing (Korean Radiation
Oncology Group 2206). If the external validation study highlights
that the radiomics-based predictive model of the present study
needs improvement, it will be improved and optimized by using
multi-institutional data.
In conclusion, the developed radiomics-based
predictive stacking model for LRR in patients with breast cancer
demonstrated promising results and could potentially serve as a
useful tool in the planning of personalized treatments and
follow-ups for patients with breast cancer.
Acknowledgements
Not applicable.
Funding
Funding: No funding was received.
Availability of data and materials
The datasets used and/or analyzed during the current
study are available from the corresponding author on reasonable
request.
Authors' contributions
JL and SY participated in the design of the work,
extracted the radiomics features and performed bioinformatics
analysis and computational histopathological analysis. JL and SY
confirm the authenticity of all the raw data. VP made substantial
contributions to radiological data acquisition and helped with ROI
delineation. SY and JK performed statistical analysis. JL made
contributions to clinical data acquisition. JL, KK and BL helped
with radiomics feature extraction and confirmed ROIs. JK helped
with the study design. JL and SY drafted and revised the
manuscript. YK designed and conceived this study and was in charge
of its coordination. All authors read and approved the final
version of the manuscript.
Ethics approval and consent to
participate
This study was approved by the Institutional Review
Board of Severance Hospital (approval no. 4-2021-1350), and the
requirement for informed consent was waived because of the
retrospective study design.
Patient consent for publication
Not applicable.
Competing interests
The authors declare that they have no competing
interests.
Glossary
Abbreviations
Abbreviations:
|
LRR
|
locoregional recurrence
|
|
MRI
|
magnetic resonance imaging
|
|
ML
|
machine learning
|
|
PSM
|
propensity score matching
|
|
ROIs
|
regions of interest
|
|
H
|
high-pass
|
|
L
|
low-pass
|
|
GLCM
|
gray-level co-occurrence matrix
|
|
GLRLM
|
gray-level run length matrix
|
|
GLSZM
|
gray-level size zone matrix
|
|
GLDM
|
gray-level dependence matrix
|
|
NGTDM
|
neighborhood gray tone difference
matrix
|
|
LASSO
|
least absolute shrinkage and selection
operator
|
|
SVM
|
support vector machine
|
|
RF
|
random forest
|
|
LR
|
logistic regression
|
|
ACC
|
accuracy
|
|
SEN
|
sensitivity
|
|
SPE
|
specificity
|
|
AUC
|
area under the receiver operating
characteristic curve
|
|
CI
|
confidence interval
|
|
LDHGLE
|
large dependence high gray-level
emphasis
|
|
MR
|
magnetic resonance
|
References
|
1
|
Van Laar C, Van Der Sangen M, Poortmans P,
Nieuwenhuijzen GA, Roukema JA, Roumen RM, Tjan-Heijnen VC and Voogd
AC: Local recurrence following breast-conserving treatment in women
aged 40 years or younger: Trends in risk and the impact on
prognosis in a population-based cohort of 1143 patients. Eur J
Cancer. 49:3093–3101. 2013. View Article : Google Scholar : PubMed/NCBI
|
|
2
|
van Dongen JA, Voogd AC, Fentiman IS,
Legrand C, Sylvester RJ, Tong D, van der Schueren E, Helle PA, van
Zijl K and Bartelink H: Long-term results of a randomized trial
comparing breast-conserving therapy with mastectomy: European
organization for research and treatment of cancer 10801 trial. J
Natl Cancer Inst. 92:1143–1150. 2000. View Article : Google Scholar : PubMed/NCBI
|
|
3
|
Wapnir IL, Anderson SJ, Mamounas EP, Geyer
CE Jr, Jeong JH, Tan-Chiu E, Fisher B and Wolmark N: Prognosis
after ipsilateral breast tumor recurrence and locoregional
recurrences in five national surgical adjuvant breast and bowel
project node-positive adjuvant breast cancer trials. J Clin Oncol.
24:2028–2037. 2006. View Article : Google Scholar : PubMed/NCBI
|
|
4
|
Katz A, Strom EA, Buchholz TA, Thames HD,
Smith CD, Jhingran A, Hortobagyi G, Buzdar AU, Theriault R,
Singletary SE and McNeese MD: Locoregional recurrence patterns
after mastectomy and doxorubicin-based chemotherapy: Implications
for postoperative irradiation. J Clin Oncol. 18:2817–2827. 2000.
View Article : Google Scholar : PubMed/NCBI
|
|
5
|
Koçak B, Durmaz EŞ, Ateş E and Kılıçkesmez
Ö: Radiomics with artificial intelligence: A practical guide for
beginners. Diagn Interv Radiol. 25:485–495. 2019. View Article : Google Scholar : PubMed/NCBI
|
|
6
|
van Timmeren JE, Leijenaar RTH, van Elmpt
W, Reymen B, Oberije C, Monshouwer R, Bussink J, Brink C, Hansen O
and Lambin P: Survival prediction of non-small cell lung cancer
patients using radiomics analyses of cone-beam CT images. Radiother
Oncol. 123:363–369. 2017. View Article : Google Scholar : PubMed/NCBI
|
|
7
|
Bulens P, Couwenberg A, Intven M,
Debucquoy A, Vandecaveye V, Van Cutsem E, D'Hoore A, Wolthuis A,
Mukherjee P, Gevaert O and Haustermans K: Predicting the tumor
response to chemoradiotherapy for rectal cancer: Model development
and external validation using MRI radiomics. Radiother Oncol.
142:246–252. 2020. View Article : Google Scholar : PubMed/NCBI
|
|
8
|
Shen Y, Shamout FE, Oliver JR, Witowski J,
Kannan K, Park J, Wu N, Huddleston C, Wolfson S, Millet A, et al:
Artificial intelligence system reduces false-positive findings in
the interpretation of breast ultrasound exams. Nat Commun.
12:56452021. View Article : Google Scholar : PubMed/NCBI
|
|
9
|
Sannachi L, Gangeh M, Tadayyon H, Gandhi
S, Wright FC, Slodkowska E, Curpen B, Sadeghi-Naini A, Tran W and
Czarnota GJ: Breast cancer treatment response monitoring using
quantitative ultrasound and texture analysis: Comparative analysis
of analytical models. Transl Oncol. 12:1271–1281. 2019. View Article : Google Scholar : PubMed/NCBI
|
|
10
|
Jo JH, Chung HW, So Y, Yoo YB, Park KS,
Nam SE, Lee EJ and Noh WC: FDG PET/CT to predict recurrence of
early breast invasive ductal carcinoma. Diagnostics (Basel).
12:6942022. View Article : Google Scholar : PubMed/NCBI
|
|
11
|
Whitney HM, Drukker K, Edwards A,
Papaioannou J and Giger ML: Effect of biopsy on the MRI radiomics
classification of benign lesions and luminal A cancers. J Med
Imaging (Bellingham). 6:0314082019.PubMed/NCBI
|
|
12
|
Saha A, Harowicz MR, Grimm LJ, Kim CE,
Ghate SV, Walsh R and Mazurowski MA: A machine learning approach to
radiogenomics of breast cancer: A study of 922 subjects and 529
DCE-MRI features. Br J Cancer. 119:508–516. 2018. View Article : Google Scholar : PubMed/NCBI
|
|
13
|
Han L, Zhu Y, Liu Z, Yu T, He C, Jiang W,
Kan Y, Dong D, Tian J and Luo Y: Radiomic nomogram for prediction
of axillary lymph node metastasis in breast cancer. Eur Radiol.
29:3820–3829. 2019. View Article : Google Scholar : PubMed/NCBI
|
|
14
|
Liu Z, Li Z, Qu J, Zhang R, Zhou X, Li L,
Sun K, Tang Z, Jiang H, Li H, et al: Radiomics of multiparametric
MRI for pretreatment prediction of pathologic complete response to
neoadjuvant chemotherapy in breast cancer: A multicenter study.
Clin Cancer Res. 25:3538–3547. 2019. View Article : Google Scholar : PubMed/NCBI
|
|
15
|
Chan HM, van der Velden BHM, Loo CE and
Gilhuijs KGA: Eigentumors for prediction of treatment failure in
patients with early-stage breast cancer using dynamic
contrast-enhanced MRI: A feasibility study. Phys Med Biol.
62:6467–6485. 2017. View Article : Google Scholar : PubMed/NCBI
|
|
16
|
Harada TL, Uematsu T, Nakashima K,
Kawabata T, Nishimura S, Takahashi K, Tadokoro Y, Hayashi T,
Tsuchiya K, Watanabe J and Sugino T: Evaluation of breast edema
findings at T2-weighted breast MRI is useful for diagnosing occult
inflammatory breast cancer and can predict prognosis after
neoadjuvant chemotherapy. Radiology. 299:53–62. 2021. View Article : Google Scholar : PubMed/NCBI
|
|
17
|
Cain EH, Saha A, Harowicz MR, Marks JR,
Marcom PK and Mazurowski MA: Multivariate machine learning models
for prediction of pathologic response to neoadjuvant therapy in
breast cancer using MRI features: A study using an independent
validation set. Breast Cancer Res Treat. 173:455–463. 2019.
View Article : Google Scholar : PubMed/NCBI
|
|
18
|
Symmans WF, Peintinger F, Hatzis C, Rajan
R, Kuerer H, Valero V, Assad L, Poniecka A, Hennessy B, Green M, et
al: Measurement of residual breast cancer burden to predict
survival after neoadjuvant chemotherapy. J Clin Oncol.
25:4414–4422. 2007. View Article : Google Scholar : PubMed/NCBI
|
|
19
|
Van Griethuysen JJM, Fedorov A, Parmar C,
Hosny A, Aucoin N, Narayan V, Beets-Tan RGH, Fillion-Robin JC,
Pieper S and Aerts HJWL: Computational radiomics system to decode
the radiographic phenotype. Cancer Res. 77:e104–e107. 2017.
View Article : Google Scholar : PubMed/NCBI
|
|
20
|
Haralick RM, Shanmugam K and Dinstein I:
Textural features for image classification. IEEE Trans Syst Man
Cybern. 3:610–621. 1973. View Article : Google Scholar
|
|
21
|
Galloway MM: Texture analysis using gray
level run lengths. Comput Graph Image process. 4:172–179. 1975.
View Article : Google Scholar
|
|
22
|
Thibault G, Fertil B, Navarro C, Pereira
S, Cau P, Levy N, Sequeira J and Mari JL: Shape and texture indexes
application to cell nuclei classification. Int J Pattern Recognit
Artif Intell. 27:13570022013. View Article : Google Scholar
|
|
23
|
Sun C and Wee WG: Neighboring gray level
dependence matrix for texture classification. Comput Vis Graph
Image Process. 23:341–352. 1983. View Article : Google Scholar
|
|
24
|
Amadasun M and King R: Textural features
corresponding to textural properties. IEEE Trans Syst Man Cybern.
19:1264–1274. 1989. View
Article : Google Scholar
|
|
25
|
Tibshirani R: Regression shrinkage and
selection via the lasso. J R Stat Soc B (Methodol). 58:267–288.
1996.
|
|
26
|
Pedregosa F, Varoquaux G, Gramfort A,
Michel V and Thirion B: Scikit-learn: Machine learning in Python. J
Mach Learn Res. 12:2825–2830. 2011.
|
|
27
|
Wolpert DH: Stacked generalization. Neural
Netw. 5:241–259. 1992. View Article : Google Scholar
|
|
28
|
Steinwart I and Christmann A: Support
vector machines. Springer Science & Business Media; 2008
|
|
29
|
Cutler A, Cutler DR and Stevens JR: Random
forests. Ensemble machine learning: Methods and applications.
157–175. 2012.
|
|
30
|
Kim JH, Ko ES, Lim Y, Lee KS, Han BK, Ko
EY, Hahn SY and Nam SJ: Breast cancer heterogeneity: MR imaging
texture analysis and survival outcomes. Radiology. 282:665–675.
2017. View Article : Google Scholar : PubMed/NCBI
|
|
31
|
Park H, Lim Y, Ko ES, Cho HH, Lee JE, Han
BK, Ko EY, Choi JS and Park KW: Radiomics signature on magnetic
resonance imaging: Association with disease-free survival in
patients with invasive breast cancer. Clin Cancer Res.
24:4705–4714. 2018. View Article : Google Scholar : PubMed/NCBI
|
|
32
|
Johansen R, Jensen LR, Rydland J, Goa PE,
Kvistad KA, Bathen TF, Axelson DE, Lundgren S and Gribbestad IS:
Predicting survival and early clinical response to primary
chemotherapy for patients with locally advanced breast cancer using
DCE-MRI. J Magn Reson Imaging. 29:1300–1307. 2009. View Article : Google Scholar : PubMed/NCBI
|
|
33
|
Padhani AR, Hayes C, Assersohn L, Powles
T, Makris A, Suckling J, Leach MO and Husband JE: Prediction of
clinicopathologic response of breast cancer to primary chemotherapy
at contrast-enhanced MR imaging: Initial clinical results.
Radiology. 239:361–374. 2006. View Article : Google Scholar : PubMed/NCBI
|
|
34
|
Liu X, Xiang K, Geng GY, Wang SC, Ni M,
Zhang YF, Pan HF and Lv WF: Prognostic value of intratumor
metabolic heterogeneity parameters on 18F-FDG PET/CT for
patients with colorectal cancer. Contrast Media Mol Imaging.
2022:25862452022.PubMed/NCBI
|
|
35
|
Gerlinger M, Rowan AJ, Horswell S, Math M,
Larkin J, Endesfelder D, Gronroos E, Martinez P, Matthews N,
Stewart A, et al: Intratumor heterogeneity and branched evolution
revealed by multiregion sequencing. N Engl J Med. 366:883–892.
2012. View Article : Google Scholar : PubMed/NCBI
|
|
36
|
Asselin MC, O'Connor JPB, Boellaard R,
Thacker NA and Jackson A: Quantifying heterogeneity in human
tumours using MRI and PET. Eur J Cancer. 48:447–455. 2012.
View Article : Google Scholar : PubMed/NCBI
|
|
37
|
Dasgupta A, Bhardwaj D, DiCenzo D, Fatima
K, Osapoetra LO, Quiaoit K, Saifuddin M, Brade S, Trudeau M, Gandhi
S, et al: Radiomics in predicting recurrence for patients with
locally advanced breast cancer using quantitative ultrasound.
Oncotarget. 12:2437–2448. 2021. View Article : Google Scholar : PubMed/NCBI
|
|
38
|
Xiong L, Chen H, Tang X, Chen B, Jiang X,
Liu L, Feng Y, Liu L and Li L: Ultrasound-based radiomics analysis
for predicting disease-free survival of invasive breast cancer.
Front Oncol. 11:6219932021. View Article : Google Scholar : PubMed/NCBI
|
|
39
|
Tamez-Peña JG, Rodriguez-Rojas JA,
Gomez-Rueda H, Celaya-Padilla JM, Rivera-Prieto RA, Palacios-Corona
R, Garza-Montemayor M, Cardona-Huerta S and Treviño V:
Radiogenomics analysis identifies correlations of digital
mammography with clinical molecular signatures in breast cancer.
PLoS One. 13:e01938712018. View Article : Google Scholar : PubMed/NCBI
|
|
40
|
Moreno AC, Shaitelman SF and Buchholz TA:
A clinical perspective on regional nodal irradiation for breast
cancer. Breast. 34 (Suppl 1):S85–S90. 2017. View Article : Google Scholar : PubMed/NCBI
|
|
41
|
Zeidan YH, Habib JG, Ameye L, Paesmans M,
de Azambuja E, Gelber RD, Campbell I, Nordenskjöld B, Gutiérez J,
Anderson M, et al: Postmastectomy radiation therapy in women with
T1-T2 tumors and 1 to 3 positive lymph nodes: Analysis of the
breast international group 02–98 trial. Int J Radiat Oncol Biol
Phys. 101:316–324. 2018. View Article : Google Scholar : PubMed/NCBI
|